U.S. Coast Guardtdept.cgaux.org/stafftraining/5thedPIG.pdf3 Preface to Fifth Edition The Performance...
170
PERFORMANCE IMPROVEMENT GUIDE Fifth Edition September 2012 Reprint U.S. Coast Guard
Transcript of U.S. Coast Guardtdept.cgaux.org/stafftraining/5thedPIG.pdf3 Preface to Fifth Edition The Performance...
PERFORMANCE
IMPROVEMENT
GUIDE
Fifth Edition September 2012 Reprint
U.S
. C
oas
t G
uar
d

2
Editors: SCPO Robert R. Buxman
Christen M. Wehrenberg
Project Coordinator: SCPO Robert R. Buxman
Contributors: AIM Consulting
CWO Michael J. Brzezicki
SCPO Robert R. Buxman
CPO John M. Callaghan
Charles D. Coiro
Frederick L. Hooghouse
LT Jacqueline M. Leverich
Lori J. Maselli
CDR Joseph M. Re
Paul E. Redmond
Jason M. Siniscalchi, Ph.D
LCDR Richter L. Tipton
Frank S. Wood
Jeff L. Wright
Christen M. Wehrenberg
Stephen B. Wehrenberg, Ph.D
If this guide is used as a reference in preparing a research paper or other
publication, we suggest acknowledgement citation in the references. Here is a
suggested bibliography entry in APA or ―author (date)‖ style:
U.S. Coast Guard Leadership Development Center (2006). Performance
improvement guide, 5th
edition. Boston, MA: U.S. Government Printing
Office.

3
Preface to Fifth Edition
The Performance Improvement Guide (PIG) is published by the
US Coast Guard Leadership Development Center, in collaboration with
the Office of Performance Management (CG-0954).
The Coast Guard strives to be the best-led and best-managed
organization in government. That's a never-ending challenge for all
Coast Guard people. This guide is an aid to help you respond to the
challenge; its contents were selected to involve employees, enhance
team effectiveness, ease problem-solving, facilitate better meeting
management, improve processes, increase customer satisfaction, and
improve overall performance to produce superior mission results.
The PIG is an idea source of tools, processes, and models.
Organizational Performance Consultants (OPCs) and the latest
Commandant‘s Performance Excellence Criteria (CPEC) Guidebook
are also valuable leadership and management resources.
The Leadership Development Center appreciates the many
improvement suggestions made by users of previous editions. Though
the PIG format remains largely the same, its contents and organization
have changed. Changes to this edition include:
A reorganized and expanded tool section, including basic project
management tools
A section on senior leadership, including strategic planning
Updates to examples
Updates to wording choice and explanations to reflect the Coast
Guard‘s evolution in its continuous improvement efforts
We hope you find this a useful, informative resource.
The Leadership Development Center Staff
and the Performance Excellence Program
4
CONTENTS
U.S. COAST GUARD LEADERSHIP COMPETENCIES ......................... 7
LEADERSHIP RESPONSIBILITIES ..................................................... 9
SENIOR LEADERSHIP .................................................................... 10
Effective Management ............................................................ 11
Strategic Planning ................................................................... 13
Does every Unit Need its Own Strategic Plan? ...................... 14
U.S. Coast Guard Core Values ............................................... 20
SWOT Analysis ...................................................................... 24
Goal Writing Primer ............................................................... 25
The Balanced Strategic Plan ................................................... 28
TEAM LEADERSHIP ...................................................................... 31
Organizational Interface ......................................................... 33
Team Building ........................................................................ 35
Project Management ............................................................... 36
FACILITATIVE LEADERSHIP .......................................................... 39
Facilitator Behaviors ............................................................... 41
Facilitator Checklist ................................................................ 43
Facilitator Pitfalls .................................................................... 44
The Facilitative Leader ........................................................... 45
MEETING MANAGEMENT ............................................................. 46
Effective Meetings .................................................................. 46
Planning a Meeting ................................................................. 47
Agenda Checklist .................................................................... 47
Team Member Roles ............................................................... 48
Ground Rules .......................................................................... 49
Parking Lot ............................................................................. 50
Meeting Evaluation ................................................................. 52
GROUP LEADERSHIP .................................................................... 55
Stages of Group Development ................................................ 56
Managing Conflict .................................................................. 57
ORGANIZATIONAL PERFORMANCE ............................................... 58
Systems Thinking ................................................................... 59
The Voice of the Customer ..................................................... 68

5
Work as a Process ................................................................... 70
Performance Elements ............................................................ 71
Performance Measures ............................................................ 73
Data Collection, Analysis, and Display .................................. 75
Activity Based Costing (ABC) ............................................... 87
The Unified Performance Logic Model (UPLM) ................... 89
What to Work On .................................................................... 91
Process Improvement and Problem-Solving .......................... 92
The CG Organizational Assessment Survey (CG-OAS) ........ 96
Coast Guard Business Intelligence (CGBI) ............................ 98
The Commandant‘s Innovation Council ............................... 100
TOOLS ........................................................................................ 103
Action Planning .................................................................... 104
Affinity Diagram .................................................................. 106
Brainstorming ....................................................................... 110
Charter .................................................................................. 113
Cause-and-Effect Diagram ................................................... 116
Check Sheet .......................................................................... 118
Consensus Cards ................................................................... 120
Contingency Diagram ........................................................... 122
Control Charts ....................................................................... 124
Customer Alignment Questions ............................................ 127
Customer Requirements Matrix ............................................ 128
Decision Matrix .................................................................... 129
Flowchart .............................................................................. 131
Force Field Analysis ............................................................. 134
Gantt Chart ............................................................................ 135
Kano Model .......................................................................... 139
Multi-Voting ......................................................................... 140
Nominal Group Technique ................................................... 142
Pareto Chart .......................................................................... 144
Project Requirements Table .................................................. 146
Project Responsibility Matrix ............................................... 147
Run Chart .............................................................................. 148
6
Scatter Diagram .................................................................... 153
SIPOC ................................................................................... 154
Stakeholder Analysis ............................................................ 156
SWOT Analysis .................................................................... 157
Why Technique ..................................................................... 159
Work Breakdown Structure (WBS) ...................................... 160
GLOSSARY ................................................................................. 162
REFERENCES .............................................................................. 165
ADDITIONAL RESOURCES .......................................................... 166
TABLE OF TOOL USAGE ............................................................. 168
TABLE OF TOOL USAGE (DMAIC) ............................................ 168
QUICK TOOLS REFERENCE GUIDE ............................................. 170
7
U.S. COAST GUARD LEADERSHIP COMPETENCIES
The Coast Guard‘s definition of leadership is:
―You influencing others to achieve a goal‖
In this guide you will find ideas and resources to help you
positively influence others to achieve unit goals. Whether you‘re
a team leader, team member, or facilitator, you have the potential
to lead and influence change.
The Coast Guard uses 28 leadership competencies consistent with
our missions, work force, and core values of Honor, Respect, and
Devotion to Duty. These competencies fall into four categories:
LEADING SELF
o Accountability and Responsibility
o Followership
o Self Awareness and Learning
o Aligning Values
o Health and Well-Being
o Personal Conduct
o Technical Proficiency
LEADING OTHERS
o Effective Communications
o Influencing Others
o Respect for Others and Diversity Management
o Team Building
o Taking Care of People
o Mentoring
8
LEADING PERFORMANCE AND CHANGE
o Customer Focus
o Management and Process Improvement
o Decision Making and Problem Solving
o Conflict Management
o Creativity and Innovation
o Vision Development and Implementation
LEADING THE COAST GUARD
o Stewardship
o Technology Management
o Financial Management
o Human Resource Management
o Partnering
o External Awareness
o Entrepreneurship
o Political Savvy
o Strategic Thinking
The discussions, strategies, models, and tools in this guide
strongly support the development of most of these competencies.
For more information on the Coast Guard‘s Leadership
Competencies, see the Coast Guard Leadership Development
Program, COMDTINST 5351.1 (series).

9
LEADERSHIP RESPONSIBILITIES
Senior leaders, team leaders, and facilitators play key and support
roles in the managing and improving organizational performance.
These roles include identifying important opportunities; aligning
with stakeholders; selecting the appropriate tools; planning work;
training team members; cultivating teamwork;, implementing
solutions; and leading long-term change.
The following matrix outlines some key and support roles:
SL = Senior Leaders ● Key Role
TL = Team Leader ○ Support Role
FAC = Facilitator
Team Role Matrix
●Selects team
●●●○Helps find win/win solutions
○●●Coordinates pre- and post-meeting logistics
○●●Conducts planning
○●Manages organization
○●●Interfaces with organization
○
○
○
SL
●
●
●
●
●
○
○
FAC
Remains neutral
●○Focuses on process
●●Protects individuals and their ideas from attack
●●Contributes ideas
●●Encourages participation
●●Focuses energy of group on common task
○●Manages project
○●Builds team
TeamTLRole
The senior leader, team leader, and facilitator roles,
responsibilities, and checklists presented in this guide provide a
brief overview. For more in-depth discussion, please refer to the
additional references section.
10
SENIOR LEADERSHIP
Senior leaders—whether at the organizational, unit, or work
group level—are responsible for effective management.
Management should be part of a regular routine, not a separate
event. Leading-edge organizations use performance
measurement and management systems to gain insight into, and
make judgments about, the effectiveness and efficiency of their
programs, processes, and people. Best-in-class organizations
determine and use indicators to measure progress toward meeting
strategic goals and objectives, gather and analyze performance
data, and use the results to both drive improvements and
successfully translate strategy into action.

11
Effective Management
The Commandant‘s Performance Excellence Criteria (CPEC)
provides a systematic way to improve management practices
across the organization. The criteria are slightly modified from
the Malcolm Baldrige National Performance Excellence Criteria,
which are based on core principles and practices of the highest
performing organizations in the world. The Commandant‘s
Performance Challenge (CPC) Criteria are a subset of the CPEC
tailored specifically for new users.
Category 6
Process
Management
Category 4
Measurement, Analysis, and Knowledge Management
Category 3
Customer and
Market Focus
Category 1
Leadership
Category 7
Results
Category 2
Strategic
Planning
Category 5
Workforce
Focus
Organizational Profile:
Environment, Relationships, and Challenges
Figure 1. CPEC Framework: A Systems Perspective
12
Actively using the criteria fosters systems thinking with a focus
on factors such as missions, customers, innovation, people,
measurement, leadership, processes, readiness, and stewardship.
The way each leader manages assigned responsibilities has
implications for the entire Coast Guard and the public we serve.
In other words, management matters—excellent management
practices equate to performance results. The best way leaders
can learn how the CPEC can help them accomplish command
goals is to use the system.
The criteria are built upon eleven core principles and concepts.
These principles and concepts are the foundation for integrating
key performance requirements within a results-oriented
framework. These core principles and concepts are:
Visionary Leadership
Customer-Driven Excellence
Organizational and Personal Learning
Valuing Employees and Partners
Agility
Focus on the Future
Managing for Innovation
Management by Fact
Public Responsibility and Citizenship
Focus on Results and Creating Value
Systems Perspective
For more CPEC information, see the Commandant‘s Performance
Excellence Criteria Guidebook, COMDTPUB P5224.2 (series).

13
Strategic Planning
Strategic planning is the process by which leaders clarify their
organization‘s mission, develop a vision, articulate the values,
and establish long-, medium-, and short-term goals and strategies.
The Strategic Planning Process presented in this guide is based
on the Hierarchy of Strategic Intent shown below. At the top of
the hierarchy is the organization‘s Mission and Vision, both of
which should be long-lasting and motivating. At the base of the
hierarchy are the shorter-term strategies and tactics that unit
members will use to achieve the Vision.
Hierarchy of Strategic Intent
Use the Hierarchy to answer “Why my organization does X” by
looking up one level, e.g., “this set of tactical plans exist to
achieve that Outcome.” Answer “How” the organization will
accomplish X by looking down one level, e.g., “our Strategies are
how we will attain our Critical Success Factors.”
Strategic (Organizational)
Operational (Area/District)
Tactical (Sector/Unit/Team)

14
Does every Unit Need its Own Strategic Plan?
The traditional view of planning might dictate that leaders at field units
and even individual HQ program offices leave Strategic Planning to the
senior-most, agency-level leaders, as depicted here:
Strategic – Operational - Tactical
Traditional View: Strategic
Operational
Tactical
The Reality:
National
Regional
Sector/Unit
Strategic
Operational
Tactical
National
Regional
Sector/Unit
However, in reality, every USCG command/staff has strategic value. To
ensure each is ready to perform its assigned responsibilities, able to sustain
and improve performance, and to anticipate and prepare for future needs,
planning at all levels—Strategic, Operational, Tactical—is necessary.
Strategic
Operational
Tactical
National
Regional
Sector/Unit
The Reality:
There are, however, differences in the planning scope and horizons at the
national, regional, and unit levels—perhaps 18-24 months for cutters, 5
years for Sectors, 5-8 years for Areas, and 20 years for the Coast Guard.
Strategic Planning process steps are listed below:
Step
1.0
Develop Guiding Documents. This includes developing
Mission, Vision, and Values statements; if these already
exist, review them to prepare for strategic planning.
Step
2.0
Define the Strategy. This step is the heart of strategy
development; it establishes Outcomes, Critical Success
Factors, and outlines the Goals to accomplish both.
Step
3.0
Develop Action Plan and Execute. This includes developing
action plans, allocating resources, and deploying the plan.
Avoid an ―Execution Gap,‖ by conducting Action Planning
in a disciplined manner and Execute Action Plans with
accountability.

15
SITUATION ANALYSIS AND STRATEGIC ALIGNMENT
Prior to strategic planning, leaders should study all the factors
that may affect the organization during its target time-frame.
Leaders should align the strategic plan with efforts up and down
the chain of command in such a way that it maintains a ―unity of
effort‖ or common strategic intent. This analysis focuses on the
following.
Planning Assumptions: resource constraints, strategic
challenges, organization sustainability issues, and emergency
business continuity
Environmental Factors: Coast Guard strategic, operational,
and tactical plans; and financial, societal, ethical, regulatory,
and technological risks
Future Focus: Major shifts in technology, missions, or the
regulatory and competitive environments (particularly those
derived from up-line plans)
Performance Metrics: such as mission/operational
performance status and other key effectiveness measures
Assessments: Organizational Assessment Survey (OAS);
Commandant‘s Performance Challenge (CPC); unit climate
surveys; compliance inspection and audit findings; strategic
capability; and organizational strengths, weaknesses,
opportunities, and threats
16
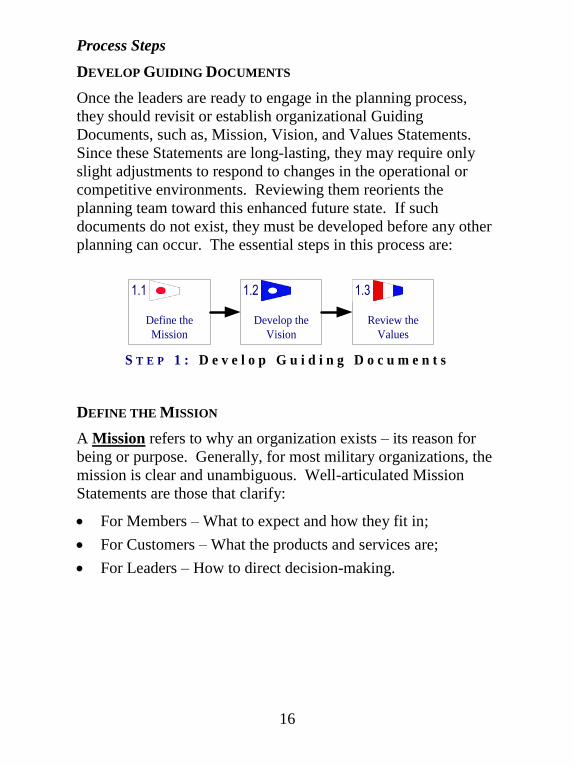
Process Steps
DEVELOP GUIDING DOCUMENTS
Once the leaders are ready to engage in the planning process,
they should revisit or establish organizational Guiding
Documents, such as, Mission, Vision, and Values Statements.
Since these Statements are long-lasting, they may require only
slight adjustments to respond to changes in the operational or
competitive environments. Reviewing them reorients the
planning team toward this enhanced future state. If such
documents do not exist, they must be developed before any other
planning can occur. The essential steps in this process are:
1.1 1.2
Develop the
Vision
Review the
Values
Define the
Mission
S T E P 1 : D e v e l o p G u i d i n g D o c u m e n t s
1.3
DEFINE THE MISSION
A Mission refers to why an organization exists – its reason for
being or purpose. Generally, for most military organizations, the
mission is clear and unambiguous. Well-articulated Mission
Statements are those that clarify:
For Members – What to expect and how they fit in;
For Customers – What the products and services are;
For Leaders – How to direct decision-making.
17
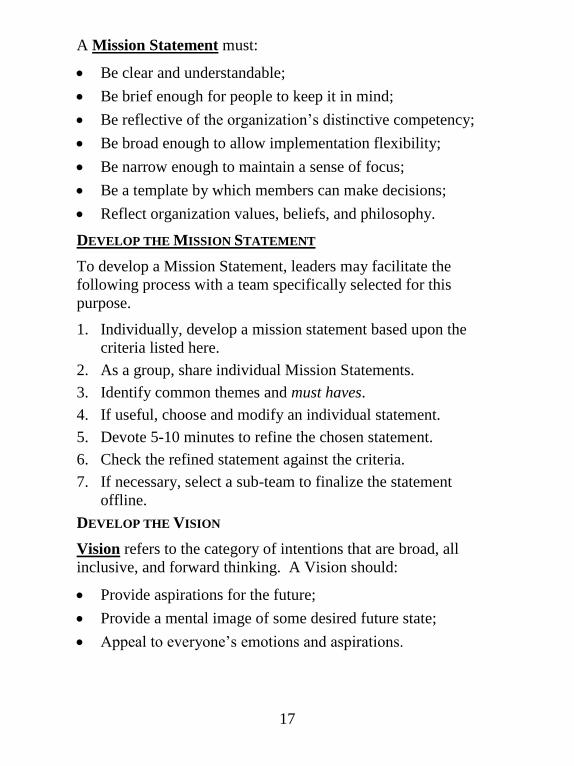
A Mission Statement must:
Be clear and understandable;
Be brief enough for people to keep it in mind;
Be reflective of the organization‘s distinctive competency;
Be broad enough to allow implementation flexibility;
Be narrow enough to maintain a sense of focus;
Be a template by which members can make decisions;
Reflect organization values, beliefs, and philosophy.
DEVELOP THE MISSION STATEMENT
To develop a Mission Statement, leaders may facilitate the
following process with a team specifically selected for this
purpose.
1. Individually, develop a mission statement based upon the
criteria listed here.
2. As a group, share individual Mission Statements.
3. Identify common themes and must haves.
4. If useful, choose and modify an individual statement.
5. Devote 5-10 minutes to refine the chosen statement.
6. Check the refined statement against the criteria.
7. If necessary, select a sub-team to finalize the statement
offline.
DEVELOP THE VISION
Vision refers to the category of intentions that are broad, all
inclusive, and forward thinking. A Vision should:
Provide aspirations for the future;
Provide a mental image of some desired future state;
Appeal to everyone‘s emotions and aspirations.

18
BRAINSTORM INDIVIDUAL AND COLLECTIVE LEGACY
Start by defining the organization for which the Vision is being
developed. A Vision can be developed for a subgroup of a larger
organization, which has a separate, broader, more inclusive
Vision. Subgroup Visions must be aligned with and mutually
supportive of the larger organizational Vision. Ask the group to
quietly and honestly list their own responses to the five questions
below. Tell participants they will be asked to share their answers
to Questions 4 and 5 with the group.
The Five Vision Questions
1. What do you like about being a part of this organization?
2. What do you like about the organization‘s mission?
3. When it‘s at its best, what do you like about the organization?
4. What legacy would you like to leave behind?
5. What legacy should we collectively leave behind?
REPORT INDIVIDUAL RESPONSES TO THE GROUP
Once everyone has listed their responses, go around the room and
ask each participant share his/her responses to Questions 4 and 5.
The following ground rules apply.
Speak from the heart
Listen carefully
Seek first to understand (clarifying questions only)
Do not evaluate responses
IDENTIFY COMMON VISION THEMES
As a group, identify the common themes in the individual
responses to the questions. Has a Vision or the elements of a
Vision emerged? What‘s missing? Facilitate discussion until all
key elements have been fully developed and are clear to all.

19
FINALIZE VISION STATEMENT OFFLINE
If necessary, select a smaller team to work offline to finalize the
Vision Statement. The team will use the responses and common
themes as input to develop several Vision Statements for the
group‘s approval. The simple act of developing these concepts
within the group will provide enough direction to continue
developing the strategic plan.
Trick of the Trade: Never wordsmith in a group! You’ll
destroy momentum.
Why Does a Unit Need Its Own Vision?
Unit leaders often resist developing a Vision Statement. Many
feel that their command‘s Vision should match the
Commandant‘s Vision or the District Commander‘s Vision.
They are correct to the extent that a unit‘s Vision must be aligned
with and supportive of those higher in the chain of command;
however, many up-line Visions are too broad or all encompassing
to be relevant to the members of a given unit. More importantly,
each unit has a specific if not unique role in successful mission
execution and mission support. Leaders are responsible for
articulating that role and setting a Vision to drive improvement
and higher levels of performance.
A unit Vision should span a couple of COs tours or about five
years. A five-year Vision is often a reach for a field unit and is
generally long enough to hold a crew‘s focus. It is also a
reasonable time frame given the ever-changing nature of the
Coast Guard‘s operating environment and initiatives responsive
to a given Commandant‘s Intent.
20
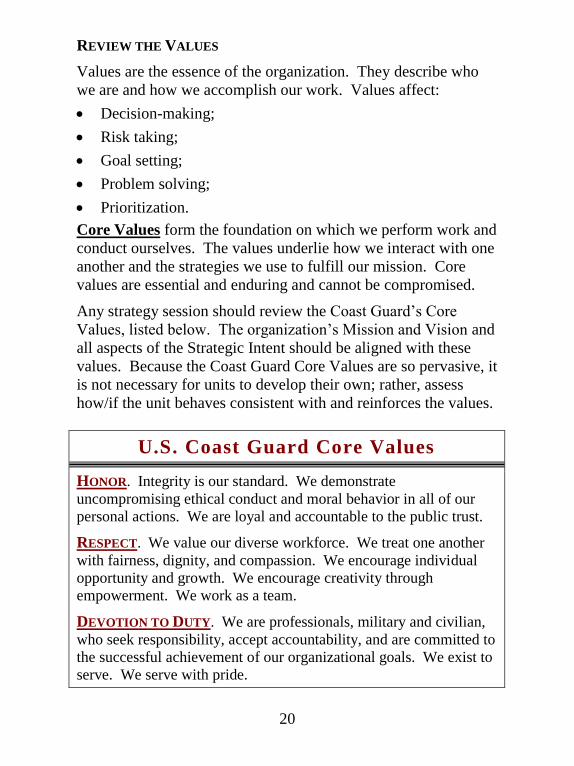
REVIEW THE VALUES
Values are the essence of the organization. They describe who
we are and how we accomplish our work. Values affect:
Decision-making;
Risk taking;
Goal setting;
Problem solving;
Prioritization.
Core Values form the foundation on which we perform work and
conduct ourselves. The values underlie how we interact with one
another and the strategies we use to fulfill our mission. Core
values are essential and enduring and cannot be compromised.
Any strategy session should review the Coast Guard‘s Core
Values, listed below. The organization‘s Mission and Vision and
all aspects of the Strategic Intent should be aligned with these
values. Because the Coast Guard Core Values are so pervasive, it
is not necessary for units to develop their own; rather, assess
how/if the unit behaves consistent with and reinforces the values.
U.S. Coast Guard Core Values
HONOR. Integrity is our standard. We demonstrate
uncompromising ethical conduct and moral behavior in all of our
personal actions. We are loyal and accountable to the public trust.
RESPECT. We value our diverse workforce. We treat one another
with fairness, dignity, and compassion. We encourage individual
opportunity and growth. We encourage creativity through
empowerment. We work as a team.
DEVOTION TO DUTY. We are professionals, military and civilian,
who seek responsibility, accept accountability, and are committed to
the successful achievement of our organizational goals. We exist to
serve. We serve with pride.

21
DEFINE THE STRATEGY
Defining the Strategy is inherently a leadership responsibility.
While Action Planning can be jointly accomplished by
organizational leaders and front-line teams, Coast Guard leaders
cannot delegate strategy development.
Developing strategy encompasses defining Outcomes from the
Stakeholders‘ perspective, identifying Critical Success Factors,
and developing Goals for an 18- to 36-month time horizon.
These Strategic Plan elements lay the groundwork for all
strategic activities within the command. The following outlines
essential steps in this process.
2.1 2.2 2.3
Identify Critical
Success Factors
Develop Long-
Range Goals
Define
Outcomes
S t e p 2 : D e f i n e t h e S t r a t e g y
DEFINE OUTCOMES
Outcomes are the organizational or public benefit(s) that the unit
seeks to achieve or influence:
Outcomes identify the impact the organization has as opposed
to the activities in which it engages.
Outcomes should be derived from Stakeholder perspectives,
expressed as expected results from the organization.
Outcomes should encompass multiple stakeholder
perspectives to ensure they are ―balanced.‖
Outcomes are not always under the full control of the
organization; many factors can influence outcomes. However, if
outcomes are well defined and continually focused upon, they
can be attained more often than not!

22
IDENTIFY STAKEHOLDERS
1. Begin by asking:
o Who has an interest in what the organization provides?
o Who cares whether the organization succeeds?
2. Participants can answer these questions on sticky notes
(putting one stakeholder or group name on each). When
finished, they can randomly place the notes on butcher-block
paper or a whiteboard.
3. The participants then silently ―affinitize‖ the stakeholders by
clustering similar groups into similar or related categories.
Attempt to create four to eight categories and name them.
4. Display these relationships in a diagram or chart.
DEFINE STAKEHOLDER EXPECTATIONS
1. Break the participants into groups; assign one the previously
defined primary stakeholder groups to each breakout group.
2. Ask each group to envision themselves riding a crowded
escalator on which two members of their assigned stakeholder
group are on the stairs ahead of them. The stakeholders do
not realize you are there and they are discussing their
experience with your organization as you‘ve defined it in its
enhanced future state (Vision).
3. Ask the group: What do you want to hear them say?
4. Each group then reports out the top two or three stakeholder
quotes that most represent a future desired outcome. Record
key items or common themes that cut across groups.
DEVELOP OUTCOMES
1. Identify five to seven common outcome themes. Assign
breakout groups to develop them into Outcomes Statements.
Outcome Statements should be measurable and directly
reflect the Vision.

23
2. Ask each group to report their outcomes. Take comments,
but do not allow the group to wordsmith.
3. Assign an individual or small team to finalize the Outcome
Statements offline.
IDENTIFY CRITICAL SUCCESS FACTORS (CSFS)
CSFs are what the organization must absolutely do right, or
manage well, if it is to achieve its Outcomes.
Organizations may not control all factors leading to
outcomes; however, CSFs are wholly within their control.
CSFs generally relate to processes, people, or technologies
that enable Outcome achievement.
CSFs are leading indicators for Outcomes. Successful
organizations know their CSFs and how they affect
Outcomes. These causal relationships are monitored and
reinforced through a robust measurement system.
Until cause-effect relationships are identified, CSFs are no
more than a management hypothesis based on individual
experience, theory, or background. Measurement can be used
to validate these hypotheses.
IDENTIFY CSFS
Develop a list of potential CSFs by asking the group:
What must you absolutely do right or keep in control to
achieve your desired Outcomes?
What is within your ability to control?
REDUCE TO THE CRITICAL FEW CSFS
If breakout groups are used, each group should report their top
CSFs. Then, together, the larger group should identify common
themes, paring the list down to three to four total.
24
DEVELOP LONG-RANGE GOALS
Goals are intentions that make the Vision, Mission, and
Outcomes actionable. They typically encompass a shorter time
frame than a Vision or an Outcome. Goals should address all
organization aspects, including mission, operations, customer,
process, people, and resources. They should facilitate reasoned
trade-offs and be achievable. Goals usually cut across functions
and can counteract sub-optimization.
CREATING GOALS
1. Review the previously developed material.
o Outcomes – Ensure the Goals are directly aligned with and
support the Outcomes.
o Critical Success Factors (CSFs) – Ensure the Goals support
achieving the CSFs.
o SWOT Analysis (see box and tools) – Ensure strengths
align to opportunities; establish Goals to leverage strengths
to exploit opportunities; identify weaknesses that line up
with threats; establish Goals that mitigate weaknesses and,
consequently, reduce threats.
2. Identify six to eight potential organizational Goals; ensure
Goals are concrete and within your control to attain. If
breakout groups are used, report out Goals and consolidate.
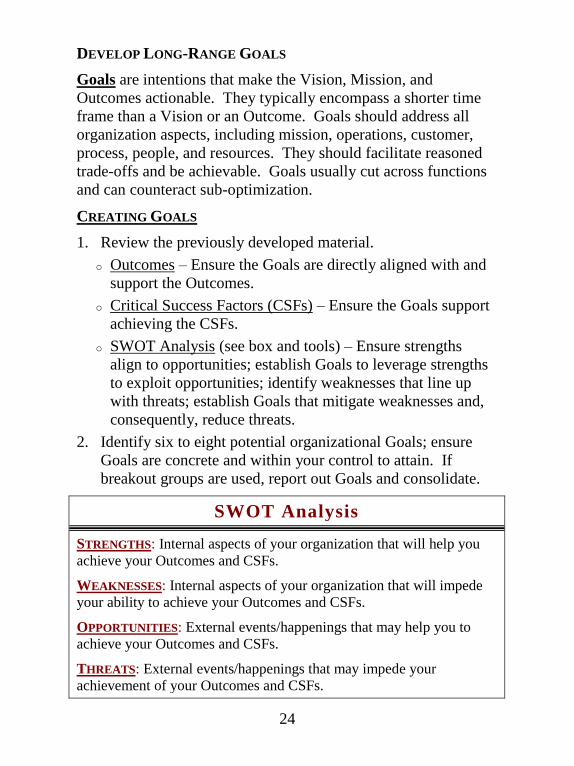
SWOT Analysis
STRENGTHS: Internal aspects of your organization that will help you
achieve your Outcomes and CSFs.
WEAKNESSES: Internal aspects of your organization that will impede
your ability to achieve your Outcomes and CSFs.
OPPORTUNITIES: External events/happenings that may help you to
achieve your Outcomes and CSFs.
THREATS: External events/happenings that may impede your
achievement of your Outcomes and CSFs.

25
AUDIT GOALS
Ensure the Goals satisfactorily aligned with up-line plans by
auditing them against Outcomes, CSFs, and SWOT.
Ensure perspective balance among: Mission/Operations,
Customer/Stakeholder, Internal Processes, People, and
Financial/Resources.
Ensure the Goals meet the Goal Writing Primer criteria.
Goal Writing Primer
CREATING GREAT GOALS!
Avoid the tendency to create too many goals. ―If everything is
important, then nothing is important.‖
Ensure goals support the Mission, Vision, Outcomes, and
CSFs.
Ensure you can articulate the Why of each goal.
Make sure the goal describes a desired state or outcome.
GOALS SHOULD BE SMART
Specific
Measurable
Action-oriented
Realistic
Time Based

26
DEVELOP THE ACTION PLAN AND EXECUTE
In their book Execution: The Discipline of Getting Things Done,
Larry Bossidy and Ram Charan highlight the major reason most
organizations fail in their attempts to implement strategy; they
call it the ―Execution Gap.‖
Action Planning therefore must be a component of Execution.
This step in the strategic planning process is the key to
―operationalizing‖ the strategy that leadership has so adeptly
fashioned. The best, most well-thought-out strategic plans are
worthless if they cannot be implemented. The following outlines
essential steps in this process.
3.1 3.2Allocate
Strategic
Resources
Monitor
Progress and
Execution
Develop
Strategies and
Tactics
S T E P 3 : D e v e l o p t h e A c t i o n P l a n a n d E x e c u t e
3.3
DEVELOP STRATEGIES AND TACTICS
Strategies and Tactics tend to be actions that can be accomplished
within a 12- to 18-month time frame. They should be tied to
resources and specific milestones and deliverables in order to be
monitored for progress/accomplishment. Strategies and Tactics
are not static and may be modified as circumstances in the
strategic environment change. They must, however, be tied
closely to a goal or set of goals in the plan and provide some
strategic value to the organization.

27
Strategies are specific, quantifiable, assignable sets of
actions or projects that lead to accomplishing a Goal over a
specific time period.
Tactics are specific tasks within a Strategy that can be
assigned to an individual or team to accomplish over a short
period of time.
DEVELOP STRATEGIES
The leadership group should involve mid-level and front-line
organization members in generating a set of Strategies they know
will effectively accomplish their Goals. Strategies can cover one
or multiple Goals. Once identified, leaders assign responsibility
to a division or team for each Strategy to be undertaken.
DEFINE TACTICS
Strategies should then be further broken down into Tactics by the
division or team assigned responsibility. As the team identifies
Tactics it should consider:
WHAT ...the Strategy is intended to achieve;
WHY ...achievement is important;
WHO ...will participate in accomplishing the Strategy;
HOW ...the Strategy will achieve the Goals;
WHEN ...deliverables are needed to accomplish the Strategy.
ESTABLISH AN ACTION PLAN
As it formulates its list of Tactics, the planning team should
assign each Tactic to a work team or individual along with a
milestone date. After a few catch-ball or pass-back review and
improve cycles, the Action Plan is approved by the leadership
team in a manner appropriate for the unit.

28
The Balanced Strategic Plan
Comprehensive strategy and measurement balances:
Past, present, and future performance;
Near- and long-term strategic challenges;
Strategic, operational, and tactical considerations;
Perspectives of product and service, customer effectiveness,
financial and budget, human resources, and organizational
effectiveness.
A balanced strategic planning approach acknowledges that good
strategy development requires a more holistic view of
organizational performance.
ALLOCATE STRATEGIC RESOURCES
To deploy the strategy, the leaders should engage in a process to
identify and allocate resources for strategy execution. A
recommended methodology follows:
IDENTIFY NON-DISCRETIONARY FUNDING
1. The CO and the unit funds manager identify the non-
discretionary funds available for Strategic Projects.
2. The planning team creates the ground rules for using the
funds to execute Strategic Action Plans.
PRESENT DIVISION ACTION PLAN
1. Division heads present their proposed actions for meeting the
goals and estimate the people and funding required to
complete the action.
2. The group questions the assumptions and the validity of the
proposed action in a facilitated discussion, including how
each action may affect other divisions or planned actions.
3. After all have spoken, the group should break into sub-teams
to further refine proposals.

29
REFINE ACTION PLANS AND RESOURCES
1. When groups reconvene, the facilitator should put the plans
and resources into a strategic resource worksheet or
spreadsheet for all to see.
2. The process continues through the questioning, refining, and
reshaping cycle until consensus is reached (usually requires
three to four cycles).
3. Document the final resource allocation in a strategic resource
worksheet.
MONITORING PROGRESS AND EXECUTION
Monitoring and controlling progress involves collecting and
disseminating performance information as well as issues and
concerns that may negatively affect achieving a strategy or tactic.
Leaders and other stakeholders need this information to make
midcourse direction and resource corrections. It also provides a
fact-based method to hold individuals accountable to achieve
assigned strategies and tactics.
EXECUTING STRATEGIC PROJECTS
1. Some action may be more easily executed as a project. In
these cases, proper planning should precede any quantifiable
work. The assigned team or individual should develop and
document the plan using whatever convention is customary.
A project abstract and/or GANTT Chart usually suffice.
2. Whether a project or a single action item, the responsible
individual or team shall work closely with a Leadership
Champion or Sponsor to ensure the project requirements are
being met, paying particular attention to deliverables and
timelines.
30
CONDUCT STRATEGY/PROGRESS REVIEW MEETINGS
1. Responsible entities are accountable for all aspects of
execution. They and their Leadership Champions shall
confer on a regular basis in a mutually agreed manner. They
shall keep stakeholders informed of progress.
2. Responsible entities should brief leaders during regularly
scheduled, periodic strategic progress reviews. During these
briefings, the responsible person explains current status,
presents any new challenges and barriers to progress, and
outlines next steps. Midcourse corrections arising from the
review session shall be incorporated into the next update to
the Action or Project Plan.
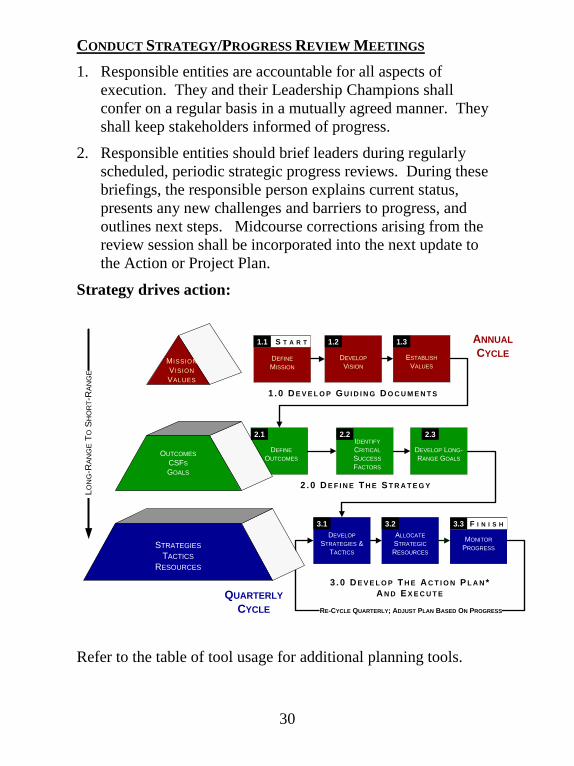
Strategy drives action:
ALLOCATE
STRATEGIC
RESOURCES
DEVELOP
STRATEGIES &
TACTICS
DEFINE
OUTCOMES
DEVELOP LONG-
RANGE GOALS
IDENTIFY
CRITICAL
SUCCESS
FACTORS
DEFINE
MISSION
DEVELOP
VISION
ESTABLISH
VALUES
RE-CYCLE QUARTERLY; ADJUST PLAN BASED ON PROGRESS
S T A R T ANNUAL
CYCLE
QUARTERLY
CYCLE
MONITOR
PROGRESS
3 . 0 D E V E L O P T H E A C T I O N P L A N *
A N D E X E C U T E
1 . 0 D E V E L O P G U I D I N G D O C U M E N T S
2 . 0 D E F I N E T H E S T R A T E G Y
LO
NG
-RA
NG
E T
O S
HO
RT-R
AN
GE
F I N I S H
OUTCOMES
CSFS
GOALS
STRATEGIES
TACTICS
RESOURCES
M ISSION
V ISION
VALUES
1.1 1.2 1.3
2.1 2.2 2.3
3.1 3.2 3.3
Refer to the table of tool usage for additional planning tools.

31
TEAM LEADERSHIP
Effective team leaders help inspire and focus small- to mid-size
groups (natural work groups, problem-solving teams, focus
groups, etc.) to achieve project goals. Team leaders are selected
based upon the team's function and are typically designated in a
charter. For those on a natural work group, a team leader is
normally established by billet or position. Any team member,
though, may be designated as team leader for a particular meeting
or project piece.
Regardless a group‘s scope, effective team leaders:
Ensure optimal team composition
Develop stakeholder commitment
Communicate vision
Outline boundaries
Give proper direction and support
Use facilitative leadership
Build teamwork
Ensure accountability
While the formal position power of being a team leader can only
be assigned to one person, all team members should be ready to
take on informal leadership roles.

32
Key Roles & Tasks of Team Leader
Key Roles
of Team Leader Tasks
Organizational
Interface
representing the project
to others
Gain and maintain alignment with
chartering body/senior managers
Make presentations
Maintain written communications
Initiate personal contact and request
feedback
Champion performance improvement
initiatives
Team Building
using methods and
creating an environment
so each member
participates in
generating ideas,
interpreting findings,
and making decisions
Use team building methods. For example:
Consider using warm-up activities
Develop ground rules
Use group idea-generation tools
Use consensus for making decisions
Help team through the stages of group
development
Cultivate full participation. For example:
Enforce guidelines
Negotiate and mediate
Counsel individuals
Adjust membership
Provide training in models and tools
Project Management
directing the team’s
attention to the
necessary work
Select and manage important projects
Align with stakeholders
Establish scope
Build and lead teams
Identify work
Create and update work plans
Manage resources
Monitor progress
Review performance

33
Organizational Interface
Alignment and continuous communication with senior leadership
and other key stakeholders is crucial to running a successful
project. One essential tool is a charter. A charter outlines
expectations from all parties, clarifies roles and responsibilities,
and aligns team efforts to organizational needs. Some issues that
the chartering body and team leader should discuss prior to
commencing the team‘s activities are:
Purpose of the charter
Role(s) of the team leader and chartering body
Parameters the team has to work within (time, funds,
equipment, people, and policy)
Who has decision-making authority
Concerns regarding accomplishing the charter objectives
Strategies to accomplish the desired objectives
In addition to the team leader, another person key to a successful
project is the champion or sponsor. For a chartered team, the
sponsor is the person who approved the charter. This person must
be high enough in the organization to address problems, should
any arise, within the scope of the project.
As a team leader, remember to keep the sponsor aware of
progress and committed to team success. Encourage the sponsor
to attend some of your meetings. Speak up if you have concerns.
Let the sponsor know about:
Team goals and project plans
Interim findings and recommendations
Roadblocks encountered
Resources needed
Milestones reached
34
Good alignment is often the difference between success and
failure. For more information on charters, see the tools section.
Beyond the charter, team leaders ensure that the interests of
people not on the team are adequately represented. They get
commitment from people who may be affected by the team‘s
actions before decisions are made.
Some key questions to ask before putting the team together are
who has a stake in the outcomes of the project? To what extent
will these stakeholders support the team‘s efforts? One effective
method of answering these questions is to conduct a stakeholder
analysis. For more information on stakeholder analysis, see the
tools section.

35
Team Building
Team leaders choose the right team members based upon project
requirements, as well as each member‘s knowledge, skills, and
ability to work as an effective team member. They continue to
build the team‘s interpersonal and rational skills. Ignoring the
interpersonal side of the equation may hinder team effectiveness
or, in more extreme cases, lead to failure.
In this respect, an outside facilitator can help team leaders be
more effective. Inviting an outside facilitator allows a team leader
to focus on the content of a meeting while the facilitator helps the
group with process. Often, this split leadership approach pays
big dividends in terms of group development and success.
Some team leaders decide to facilitate their own meetings.
Performing the roles of both team leader and facilitator can be
difficult, especially where there is passion for an issue. If that is
your choice, however, you may refer to the facilitator checklist
for guidance.
Team leaders who develop good facilitation skills can foster an
environment where people remain open and engaged. Two
techniques may help:
Listen first: Although leaders often ask for other
thoughts, subordinates or team members may simply nod
in agreement. To overcome this, listen first. Find out what
your co-workers think before sharing your own opinion.
Set the tone by simply saying, ―I‘d like to first hear what
each of you thinks about this.‖
Acknowledge emotion: Confront emotion when it arises
and get to the facts behind it. Pretending someone isn‘t
upset will close group communication. (See also the
section on managing conflict.)
36
Project Management
Team leaders should have a working knowledge of project
management skills. To begin with, they must be experts in
teamwork; they must build teams, guide group development and
manage conflict. Knowing the four project phases, collectively
known as the project life cycle, can help team leaders manage the
overall process more effectively:
Initiating
o Selecting a project
o Drafting a charter
o Developing guiding statements
o Determining scope
Planning
o Formally identifying the work required
o Ensuring adequate budget, personnel, and resources
o Scheduling
o Assessing risk
Execution
o Managing resources
o Managing changes
o Monitoring status
o Communicating
Close-out
o Evaluating
o After-action reporting
o Saving records
o Celebrating
37
A Closer Look at Project Phases
Initiating
Before embarking on a project, be sure to ask questions such as:
Why is this project important? What is the business case for this
project? Are there other projects with a higher priority? Will
senior leadership support this project? Will customers and other
stakeholders be happy that you are working on this project?
Once a project has a green light, formalize project details through
a charter. A charter can help ensure support and alignment, and
help avoid potential pitfalls. For more information on charters,
see the tool section
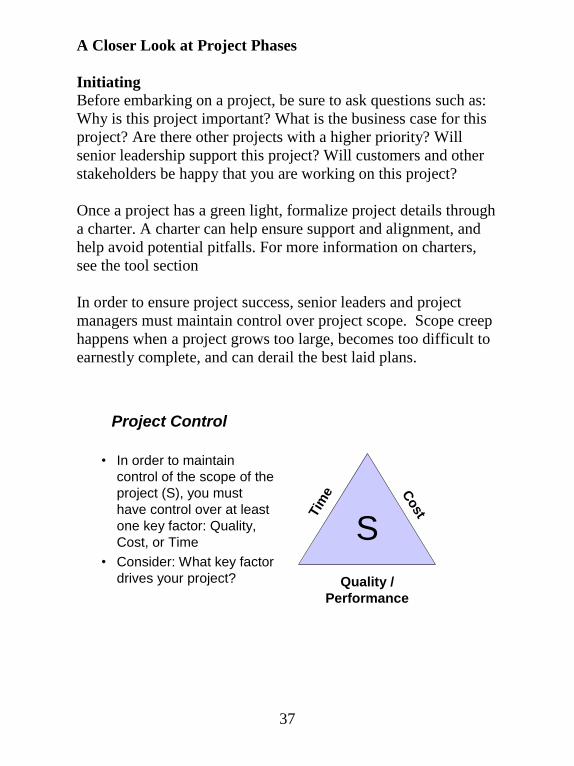
In order to ensure project success, senior leaders and project
managers must maintain control over project scope. Scope creep
happens when a project grows too large, becomes too difficult to
earnestly complete, and can derail the best laid plans.
Project Control
• In order to maintain
control of the scope of the
project (S), you must
have control over at least
one key factor: Quality,
Cost, or Time
• Consider: What key factor
drives your project?
S
CostT
ime
Quality /
Performance

38
Planning
Planning includes identifying the work, resources, performance
requirements, and time required. Identify work by completing a
work breakdown structure (WBS) or by using another planning
tool. See the tool section for more information. Work should be
broken down to the appropriate level of detail, typically into 80
hour or smaller segments. The 80-hour rule can help project
managers maintain control of the project by promoting check-in
after task completion.
Consider also task dependencies, in addition to the personnel,
resources, and time required. A task is dependent upon another
task when another task must be completed before that task can be
started. Task dependencies and project requirements will impact
the overall timeline.
Execution
Execution means getting the work done. During execution, senior
leaders and project managers must ensure communications
between all concerned parties and carefully consider any
proposed changes along the way. Scheduling regular team briefs
with key stakeholders can help avoid any problems.
Close-Out
Closing out a project properly can help teams determine how well
they met project outcomes and identify opportunities for
improvement. By developing the ability to plan and implement
projects, managers can enhance overall organizational
performance.
For more in-depth coverage of project management principles
beyond the scope of this guide, see the additional resources
section.

39
FACILITATIVE LEADERSHIP
Facilitators help teams achieve their goals through the use of
team tools, disciplined problem-solving techniques, and
continuous improvement methods. They apply good meeting
management principles, give and receive feedback, and learn to
make adjustments.
A facilitator focuses on team upkeep. They guide, teach, and
encourage the team. Ultimately, facilitators should work
themselves out of a job, where the group no longer needs their
assistance. A facilitator‘s role is to help the group with process,
not to try to influence the content and final product of the group.
Facilitate:
To make easy or easier
To lighten the work of, assist, help
To increase the ease of performance of
any action
Webster’s New World Dictionary

40
Key Roles & Tasks of Facilitator
Key Roles
of Facilitator Tasks
Coach the Team
Leader
coaching the team
leader in the
process of
accomplishing the
meeting objectives
Conduct one-on-one planning with team
leader
Provide agenda guidance
Provide feedback to the team leader
Facilitator
using methods to
solicit ideas so
each member
participates in
generating ideas,
interpreting
findings,
developing
solutions, and
making decisions
Clarify team members‘ roles
Facilitate agenda. For example:
Warm-ups
Ground rules
Idea generation
Decision-making
Data collection methods
Data analysis
Monitor sequence of model
Focus team on task at hand
Monitor stages of group development
Manage group dynamics and individuals
Cultivate cooperation. For example:
Mediate
Encourage
Enforce ground rules
Coach
Trainer
training team
members
Provide just in-time (JIT) training on:
Models and tools
Team roles and responsibilities
Continuous improvement concepts
41
Facilitator Behaviors
To be proficient in the previously mentioned roles of effective
facilitators, you may find yourself needing to practice one of the
following behaviors:
The Facilitator . . .
guides the group through a predetermined process/agenda
encourages group members to participate
focuses and refocus the group on common goals and tasks
ensures an environment of mutual respect amongst group
members
explains their role and how they can help the group
assesses the group‘s progress and commitment for a given
task and suggests alternative approaches as needed
suggests agenda topics and approaches to most efficiently
and effectively help the group meet its goals
records group ideas in a way that allows participants to
see and build on ideas
trains group members on new tools and techniques just-
in-time
enforces the group‘s ground rules when they are violated
energizes the group through a positive and enthusiastic
attitude
manages conflict and helps the group find win-win
solutions
One of the most common and helpful roles you may find yourself
in as a facilitator is as a discussion moderator. In this role
you‘re primarily an observer who ensures that group members
have an equal opportunity to contribute ideas and differ with each
other. When ideas are introduced in their simple form, they often
need time to take shape and be further developed before anyone
has an opportunity to shoot them down. While it may seem
contradictory, it‘s also important to allow for a healthy amount of
42
differing when ideas are moving along and the group seems
committed to them. This will help the group avoid the common
pitfall of ―groupthink.‖ This term was coined to describe a state
when a group is moving along so efficiently that no one dares
contradict or slow the momentum.
Another important reason to be a discussion moderator is that you
usually find equal numbers of introverts and extroverts in any
group. Extroverts often thrive in group settings because they find
it natural to think aloud and build on other peoples ideas.
Introverts are often at a disadvantage in most group settings
because they are usually more reflective and hesitant to shout out
ideas. They like to have extra time to process information.
Excellent facilitators realize this and make adjustments to
maximize the contributions of introverts while not slowing down
the contributions of the extroverts.
Two facilitator behaviors help to encourage participation and
protect ideas. These are gate opening and safe-guarding:
Gate opening: Provide quiet individuals the opportunity
to participate. Some people will not cut another person off
and will wait for a quiet moment before speaking. In some
meetings, there are little to no quiet moments. Create an
opportunity like, ―Petty Officer Gonzales, what do you
think about this?‖
Safe-guarding: Ensure that individuals have a chance to
finish their thoughts. When ideas begin to flow quickly,
some members begin before others have finished. Not
everyone has the ability to present a complete and polished
thought off the top of their head. Safe-guarding might
sound like: ―Before we move ahead, let‘s give Ms. Jones a
chance to finish her thought.‖

43
Facilitator Checklist
The following checklist can help you align with senior
leadership, plan effectively, conduct productive meetings, and
ensure action and follow up.
Prior to Alignment Meeting Research information on
group
Consider possible warm-ups
Gather reference material
(PIG, etc.)
Review tools
Prepare a contract
Arrange meeting with team
leader
Alignment Meeting Review contract—modify as
appropriate
Establish purpose, goal,
and/or desired outcome
Determine scope
Get background information
on team
o Consider optimal size,
composition, and
representation
Develop an agenda (see
section on agendas)
Before Meeting Gather supplies
Ensure room is set up.
(Optimal layout, equipment,
etc.)
During Meeting Review agenda—modify as
appropriate
Establish or review:
o Roles
o Secondary facilitation
o Ground rules
o Parking lot
o Group expectations
Conduct warm-up activity or
icebreaker as appropriate
Conduct meeting
o Follow agenda
o Use timekeeper
o Monitor group dynamics
o Demonstrate facilitative
leadership
o Record group memory
o Use tools appropriately
o Check parking lot
Close meeting
o Develop action plan
o Review accomplishments
o Review agenda
o Clear parking lot
o Develop future meeting plans
o Conduct meeting evaluation
After Meeting Discuss meeting evaluation with
team leader Follow up on contract
Ensure action plans and minutes
are developed
Develop plan for next meeting
44
Facilitator Pitfalls
As you become more familiar with the facilitator behaviors, it‘s
important to avoid some of the common mistakes many novice
facilitators make:
The Facilitator should AVOID:
taking sides on an issue the group is discussing
passing judgment on ideas that are generated by group
members
contributing ideas without prior group approval
being inflexible to the changing needs of the group
being the center of attention
talking too much
45
The Facilitative Leader
Often you may find yourself in charge of a group with no formal
facilitator assigned. This is common because people are so busy
in the Coast Guard and can rarely dedicate themselves full time
to a group outside their usual job functions. Realizing the
benefits of the facilitator role, Team Leaders are encouraged to
take on some or all of the facilitative behaviors mentioned
previously. While this can be a challenge, the best Team Leaders
do this naturally. They already know where they stand on an
issue and are committed to getting the best ideas from their
Team, for often, these are the ideas from the workers who are
most likely to implement them.
Note: If you find yourself favoring the Facilitative Leader role
it‘s important to let the group know when you‘re stepping out of
your Facilitator Role and into a leader or group member role.
46
MEETING MANAGEMENT
Good meetings are key to good management; they allow effective
processing and sharing of information. Often, however, meetings
are ineffective and inefficient. They waste time and resources and
cause frustration, low morale, and poor performance. To create
an environment that promotes effective meetings, team leaders
and facilitators must manage many different dynamics.
Effective Meetings
Regardless of the purpose of a meeting, effective meetings have
many of the same ingredients:
A focus on what needs to be done
A focus on how it can best be accomplished
A focused goal / clear outcomes
A focused agenda with specific time allotments
Clear roles, responsibilities, and standards of behavior
Balanced communications and participation
Evaluation of meeting effectiveness

47
Planning a Meeting
Successful meetings require proper planning. A good rule of
thumb is to spend one hour planning for each hour of meeting
time. Sometimes more time may be spent planning a meeting
than actually conducting it.
There are numerous formats for an agenda. The following
checklist contains some of the most typically found items:
Agenda Checklist
Answer these questions before developing the agenda:
What is the purpose and desired outcome(s)?
Is a meeting necessary to achieve the desired outcomes?
Who should attend? Invite the minimum number of people
required to achieve the desired outcome.
Develop agenda. An agenda should include:
Date, starting, and ending times
Location
Purpose of the meeting
All known desired outcomes
Develop or review ground rules
Agenda items. The following are possible items to consider:
Warm-ups Review previous meeting‘s minutes
Mission review Model and/or tool selection
Assignments & scheduling Progress report/status
Report of findings Interpretation of findings
Next steps Organizational communications
Presentations Just-in-time training
Person responsible for each item
Time allotted for each item
Assigned roles (team leader, facilitator, recorder, timekeeper)
Time for meeting evaluation

48
Team Member Roles
In any effective team, the group members take on added
responsibilities with regards to the content of the group
discussion as well as the process. Many Facilitator and Team
Leaders find success in sharing responsibility for the group‘s
success using the following roles:
Timekeeper
Scribe
Recorder
Co-Facilitator
Meeting Chairperson/Coordinator
Subject Matter Expert

49
Ground Rules
Ground rules reflect team values and create an environment for
achieving common goals. They clarify responsibilities, describe
how meetings will be run, and express how decisions will be
made.
Ground rules allow facilitators, team leaders, and groups to hold
their own feet to their own fire. For ground rules to be effective,
follow these simple rules:
1. Develop ground rules during the first meeting and get
consensus.
2. Remind the group that everyone is responsible for group
behavior.
3. Revisit them regularly. Ground rules are living documents
that may be changed or added to as groups mature.
4. Ask the group to periodically gauge their own
effectiveness and make corrections as needed.
Sample Ground Rules
We‘re here for the same purpose, we respect each other
It‘s okay to disagree
Share all relevant information
Solicit others‘ ideas
Listen as an ally
Everyone participates, no one person dominates
Share responsibility
Honor time limits, Start on time
Base decisions upon data whenever possible
Choose right decisions over quick decisions
Strive for consensus

50
Parking Lot
One of the most effective tools a group can use to keep a meeting
on track is a parking lot. A parking lot is a place where issues
that are important but not relevant to the topic at hand can be
parked out of the congestion of discussion. Issues can be brought
back in to the discussion, when appropriate, or reviewed at a later
time. A parking lot serves as a visual reminder that each
individual idea is important and will not be lost or ignored.
At the beginning of a session:
Post a blank piece of chart paper on the wall and write ―Parking
Lot‖ across the top. Place the parking lot near a room exit. This
will serve as a reminder and allow people to post any off-topic
thoughts they might have as they go on break. During the session
warm-up, possibly during or just after a discussion of ground
rules, discuss the concept of a parking lot and how to use it.
During a session:
If the group strays from the agenda, ask the group if they would
like to spend more time discussing the issue or place in the
parking lot. Ask the person who initiated the issue to write it up
using one ―sticky-note‖ per thought. Also, ensure that the
parking lot is cleared at regular, agreed-upon intervals.
At the end of a session:
Meeting discussions are typically not held simply for discussions
sake, so follow-up is key. Review parking lot items at the end of
each session. Like other parking lots, a meeting parking lot can
be the last place you focus on before departing and leaving the
discussion behind. In this way, the group can ensure that
important thoughts are not lost. To review, simply read each
item and ask, ―Has this issue been addressed or is further
discussion and/or follow-up needed?‖ If the group desires further
discussion, coordinate an appropriate time. Get confirmation
from the group on the disposition of each item.

51
IDA Boards
A related concept is to break the parking lot into different parking
boards. One tactic is to use three boards labeled ―Issues,
Decisions, and Actions‖ often referred to as ―IDA.‖ The IDA
method can help groups to effectively convert discussion into
action and document meeting outcomes.
The Issues board is like a standard parking lot. It consists of
those slightly off topic or extraneous issues that come up
during the meeting discussion. The issues list could also
contain those issues that are ―out of reach‖ but need
attention (these items may be later documented under
Decisions or Actions).
The Decisions board simply documents decisions made by
the group during the course of the meeting.
The Actions board is for next steps related to each issue
and/or decision.
As with other parking lots, end-of-meeting review is important.
When reviewing each issue on the list, ask: ―Have we
covered it?‖ ―Do we need to cover it?‖ and ―When should
time be spent covering it?‖
When reviewing the decisions list, the opportunity exists to
dig deeper and look at each decision and ask, ―What is the
change or benefit of this decision?‖ Groups might also take
time to review and discuss each decision to gauge and set
the expectation for follow-through.
The actions list contains the overall impact of the meeting.
In reviewing the actions list, assign specific steps, names,
dates, and reporting/follow-up for each item. (See also
action planning.)

52
Meeting Evaluation
To improve team and meeting effectiveness, there must be a
continuous cycle of evaluation and action planning. Evaluation
methods include round robin and consensus discussions, a
plus/delta, and meeting surveys. While participative discussion
following a facilitated meeting can be the best source of
actionable feedback for the facilitator, not every group is eager to
discuss their own improvement opportunities. Effective methods
to obtain feedback are a plus/delta and meeting surveys.
Plus/Delta
A plus/delta can help a team identify what went well along with
opportunities for improvement. It typically takes place after a
meeting review and any closing remarks.
To perform a plus/delta, first ensure that each participant has
access to sticky note pads and a pen (a fine-tip permanent marker
works well in this case). Then draw two columns on flip-chart
paper, as illustrated below, one labeled ―+‖ and the other labeled
―Δ‖ (the Greek symbol for delta, meaning change).
+ ∆
53
Ask each participant to take two separate note pages from the
sticky pads. Ask them to write a ―+‖ on one and a ―Δ‖ on the
other. On the plus have them provide a comment on something
they thought went well and should be continued. On the delta
have them provide a comment on something that perhaps did not
go well and could be improved for the next meeting. Emphasize
that the delta symbol indicates change; in this case what is being
asked for is a specific way to improve. A meeting delta could
include a request for an additional resource like new instructional
material or a more robust explanation of a decision-making tool,
it could even make an overall process improvement suggestion.
A delta is constructive criticism that is 95% constructive and only
5% criticism. The goal behind writing a delta statement should
be to not only highlight an opportunity for improvement, but to
propose a solution or a corrective course of action.
Typically participants are most comfortable when the flipchart
stand is placed near the door so they can simply post their notes
(without names) in the appropriate column on the flipchart as
they leave the room following the meeting. At some point,
however, the group should review the feedback and create an
action plan for improvement.
Feedback is of little worth if it is not seriously considered and
followed up on. Work to ensure that strengths listed in the plus
column will continue in future meetings. Legitimate concerns
must be addressed and deltas worked on so that they can become
pluses in future meetings.

54
Meeting Surveys
Meeting surveys provide the benefit of quantitative measurement
of meeting performance, as well as specific focus areas that
groups sometimes avoid discussing, such as interpersonal skills.
Using meeting surveys can help groups track their progress over
time and diagnose specific factors that hinder group performance.
Surveys such as the one below tend to be more effective if
completed anonymously and compiled by a trusted party, perhaps
an outside facilitator. Asking participants to provide written
comments regarding their ratings can help groups link specific
behaviors to ratings. Once results have been compiled, they
should be shared with the group. The group can then analyze the
data and formulate specific action plans for improvement.
Some dominant 1 2 3 4 5 6 7 8 9 10 All involvedParticipation
No buy in 1 2 3 4 5 6 7 8 9 10 Ready to implementSatisfaction with decisions
No agenda / not used 1 2 3 4 5 6 7 8 9 10 Agenda usedUse of Agenda
Many side trips 1 2 3 4 5 6 7 8 9 10 FocusedStaying on Task
Disorganized 1 2 3 4 5 6 7 8 9 10 Well plannedMeeting Planning
More than one talking 1 2 3 4 5 6 7 8 9 10 One at a timeListening
RatingEffectiveness Focus Area
Instructions: Rate any area that your team is currently
working on, plus some general areas that are useful,
such as satisfaction with decision quality, staying on
track, etc

55
GROUP LEADERSHIP
All groups follow predictable stages of group development on
their journey toward becoming self-sufficient, high-performing
teams. These stages are known as form, storm, norm, and
perform. Different factors such as group maturity, personnel
changes, and alteration of group goals or work conditions can
impact whether a team progresses or regresses. Group leaders—
whether a team leader, a facilitator, or a team member providing
informal leadership—can help teams navigate through the
hazards of group dynamics and achieve group goals.
The following chart will help you to both recognize group
dynamics and lead more effectively:

56
Stages of Group Development
Stages of Group Development
Form Storm Norm Perform
Group
Characteristics Uncertain
Tentative
Serious
Goals unclear
Conflict
Team organizing
Goals still
unclear
Hostility
Defensive
Committed to
task
Conflicts
resolved
Harmony
Sense of team
pride
Fully functional
Self-organizing
Flexible
Innovative
Team
Member
Behaviors
Talkative
Polite
Fearful
Anxious
Optimistic
Seeking
belonging
Disagree
May resist
demands of
teamwork and
homework
Comfortable
Sense of
belonging
Share willingly
Enjoy work
Work earnestly
Function well
together
Understand
others‘ views
Experience
personal growth
Leader’s
Tasks Give clear
direction
Get members
acquainted
Create positive
atmosphere
Assign straight-
forward, simple
tasks
Sensitive to
members‘ need
for direction
Open up conflict
Move toward
negotiation and
consensus
Get members to
assume more
tasks
responsibly
Let team assign
own tasks
Provide
direction
Hold celebration
Encourage team
to review own
goals and
progress
Listener and
facilitator
Participate
Consult
Inspire
Be involved in
tasks as needed
Keep
communications
and information
flowing
Reinforce and
celebrate
achievement
Provide new
vision
Output Little gets done Low Moderate to
high
Very high
Facilitation
Tasks Organize
Teach
Establish ground
rules
Set standards
Set goals
Manage
expectations
Listen and
observe
Enforce ground
rules
Manage conflict
Advise
Intervene as
needed
Provide
feedback
Affirm
Coach
Encourage
Foster consensus
Coach
Cheerlead
Withdraw

57
Managing Conflict
Working with people who have diverse backgrounds, experience,
and opinions provides a rich array of insight and opportunity;
however, some sort of conflict may be expected. Webster‘s
Collegiate Dictionary defines conflict as a ―mental struggle
resulting from incompatible or opposing needs, drives, wishes, or
external or internal demands.‖ These different needs and desires
drive individual, and ultimately, group behavior.
Sometimes, conflict is good. Conflict can prompt us to examine
our views at a deeper level. When this happens we may see
things from a different perspective and change our opinion.
Conflict may also lead to solutions that take into account many
perspectives, prompt more buy-in, and are more likely to
succeed.
Without early intervention, however, conflict situations can
escalate quickly from an open and interactive dialogue to an
emotionally-blinded, adversarial approach to problem solving.
Many conflict situations are, in reality, disputes which can be
resolved using proper skills and tactics. A longer, ongoing
adversarial situation may be defined as "conflict" and are
commonly comprised of multiple individual disputes. Looking at
conflict from this perceptive, managing conflict becomes an
active process of assessing the dynamics of the situation,
strategizing a management approach, implementing this
approach, and reassessing the situation.
58
ORGANIZATIONAL PERFORMANCE
Improving organizational performance requires us to examine
what we do and how we do it. Often, we focus on what we are
directly involved in and never stop to ask, ―Is this the right thing
to do or the best way to do it?‖
The Commandant’s Performance Excellence Criteria (CPEC)
asks us to do that—every day. It asks that we challenge
assumptions about how we work, continually find ways to
improve, satisfy our customers, and produce performance results.
Performance results begin with daily work processes.
To improve any work process we must:
Understand the mission (business) of the unit
Know the end-users (customers) and their requirements
Clearly define the current work process
Identify the output(s) of the process
Measure the effectiveness and efficiency of the process
Continually look for improvement opportunities
The rest of this guide presents information, techniques, and tools
that will help you discover what the right thing is to do and the
best way to do it.

59
Systems Thinking
Peter Senge, author of three blockbuster business books and
hundreds of insightful articles, and the founder of the Society for
Organizational Learning, suggests that the successful
organization of the future will be the company that can learn the
fastest. Indeed, one might argue that the future is here and ample
evidence exists of the truth of his assertion. What Senge means
by "learn" is to act, observe the results, reflect, adjust, and act
again intentionally seeking a different result. Rinse and repeat.
The company that can get through this learning cycle quickly and
most efficiently—a learning organization—is the one that will
survive and thrive in the long run. In order for an organization to
develop this capability it must master five disciplines:
Personal mastery – individuals must understand themselves
and their discipline, and be able to direct their own actions
toward a desired goal.
Mental models – individuals must be able to create useful
but simple representations of reality—the causes and
effects of actions—that can be used to test ideas. Groups
must be able to identify and integrate their individual
models into one that explicitly represents their consensual
view of reality.
Shared vision – groups must share the same model of the
desired future state so their individual actions can create
synergy even when not consciously coordinated.

60
Team learning – teams must be able to learn in the fashion
suggested above. An army platoon is the archetype of team
learning; through a process known as an After Action
Report team members reflect, in a blame free environment,
about what worked, what didn‘t, and what new or different
actions can be tried next time … along with their predicted
and intended results.
And—drum roll please—the fifth discipline, systems
thinking.
Systems thinking achieves its position by being the discipline that
integrates the other four. Each alone is interesting, and you may
remember many fads that relate to these disciplines: visioning,
the personal insight interventions of the 60s and 70s, a host of
team development exercises, and the like. One reason they were
short lived is that they were narrowly specific and not integrated
into the broader system of learning and change. Each had value,
but could not survive alone. All must be considered in a broader
context—the system in which they operate. Systems thinking is
the integrator.
What is systems thinking?
It‘s hard to create a single definition, because the term refers to a
paradigm, a method, a language, and a set of tools—all for the
purpose of constructing better mental models, simulating them
more reliably, and communicating them more effectively.
Systems thinking is a way of thinking about, and a language for
describing and understanding, the forces and interrelationships
that shape the behavior of systems. The discipline helps us see
how to change systems more effectively, avoid unintended
consequences, and to act more in concert with (rather than in
opposition to) other processes that make up even larger systems.

61
Then what is a system?
A system is any group of interacting, interdependent, related
parts that form a complex and unified whole, that whole
having some purpose. It exhibits properties (or produces
results) in excess of the sum of the properties of its components.
The excess is created by the structural organization of the parts.
To assert that something is a system requires identifying the
excess properties; to explain a system means to explain how the
organization of the parts produces the excess.
Some quick examples: a car is a system made up of individual
parts, none of which provides the property of ―self contained
transportation‖ until the parts are assembled in the right structure,
with the right sequence and timing of activity, etc. A toolbox full
of tools is not a system, but merely a collection, since it would be
rare that the tools would be interdependent. Even though they
may be unified in purpose (woodworking, for example), they are
not interdependent and don‘t create any results just by being to
together in the right order. On the other hand, a carpenter and a
toolbox full of woodworking tools may act like a system when
combined with materials and a blueprint (purpose). A football
team and a toaster are systems, as is a marriage. A system can be
part of a larger system. A bowl of fruit would not normally be
considered a system, nor would a customer database, nor would
an elevator full of people, though an elevator and a person do
comprise a system. But it is the interaction of the person with the
elevator, not the interaction of the people with each other that
creates the system‘s behavior.
The budget process is a system. The hiring process is a system.
A small boat is a system. Most Coast Guard units are systems
that have lots of parts, including people, and many different
purposes. As you might expect, the parts often have to be
rearranged (different structural organization) in order to pursue
different purposes. But once you put the parts together in a
62
certain way, the behavior of that system is determined in large by
that structure. That is a critically important characteristic of
systems: the behavior of a system, how it operates and what it
produces, is determined by its structure.
Characteristics of systems:
Every system has a purpose within a larger system.
A system has properties that only emerge when the parts
are assembled.
All of a system's parts must be present for the system to
carry out its purpose optimally.
A system's parts must be arranged in a specific way to carry
out its purpose. Any other arrangement would yield a
different result. (Thus Einstein's warning about the folly
of doing things the same way while hoping for a different
result.)
The outputs of systems depend on the inputs and the
relationships and feedback among the parts.
Systems remain in balance by acting on their feedback.
What makes systems thinking different from other ways of
thinking?
Just one contrast can point out the difference. Analytic thinking
is the process of systematically disassembling something in order
to understand it. Break it down into increasingly smaller parts
that grow more understandable as they are removed from the
complexity of the whole. This is a standard method for solving a
problem: divide and conquer. Mechanical and electronic devices
are good examples: disassemble a car, for example, to find out of
what parts it is made. But in its disassembled form, it isn‘t a car
(system), but a collection of parts. The parts only provide the
excess or emergent property of transportation when they are
properly connected together—no specific part carries the specific
property of transportation.
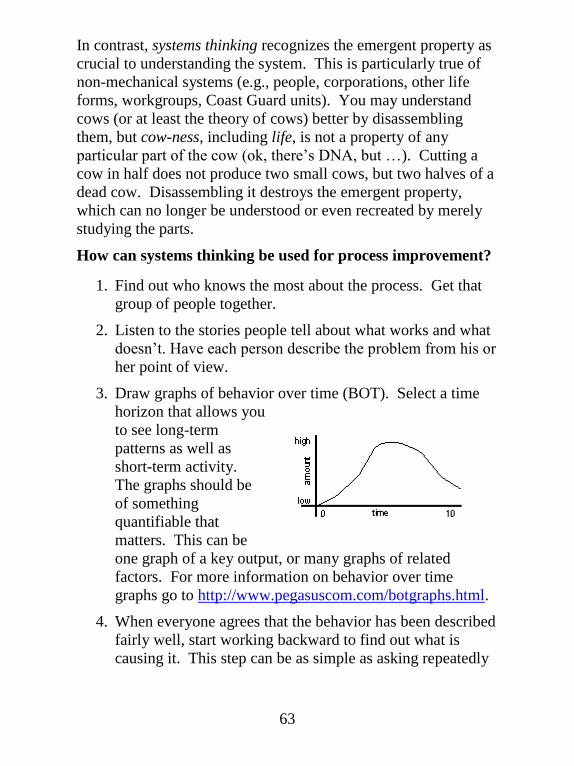
63
In contrast, systems thinking recognizes the emergent property as
crucial to understanding the system. This is particularly true of
non-mechanical systems (e.g., people, corporations, other life
forms, workgroups, Coast Guard units). You may understand
cows (or at least the theory of cows) better by disassembling
them, but cow-ness, including life, is not a property of any
particular part of the cow (ok, there‘s DNA, but …). Cutting a
cow in half does not produce two small cows, but two halves of a
dead cow. Disassembling it destroys the emergent property,
which can no longer be understood or even recreated by merely
studying the parts.
How can systems thinking be used for process improvement?
1. Find out who knows the most about the process. Get that
group of people together.
2. Listen to the stories people tell about what works and what
doesn‘t. Have each person describe the problem from his or
her point of view.
3. Draw graphs of behavior over time (BOT). Select a time
horizon that allows you
to see long-term
patterns as well as
short-term activity.
The graphs should be
of something
quantifiable that
matters. This can be
one graph of a key output, or many graphs of related
factors. For more information on behavior over time
graphs go to http://www.pegasuscom.com/botgraphs.html.
4. When everyone agrees that the behavior has been described
fairly well, start working backward to find out what is
causing it. This step can be as simple as asking repeatedly

64
―… and what causes that?‖ or ―… and why is that?‖ It can
also be as complicated as using a computer-aided system
dynamics modeling and simulation package. More likely it
will be somewhere in between. An excellent and easily
learned method is called causal loop diagramming.
Measurable quantities (stocks) are connected together by
their inflows and outflows (flows), and the controlling
feedback loops are connected in such a way as to control
the flows. After a while these diagrams form patterns that
look familiar and share certain archetypal features. Two
types will be shown here, and an extensive web-based
discussion may be found at
http://www.pegasuscom.com/cld.html and
http://www.pegasuscom.com/landl.html or at
http://www.clexchange.org/.
5. One very common structure reflects the concept of
―snowballing.‖ ―No matter what we try
it just keeps getting worse!‖ ―This
business is growing like rabbits!‖ This
pattern is reflected as a loop that
reinforces the behavior, like that on the
right: as sales increase, if the
customers are happy word
of mouth advertising
increases; as word spreads,
it creates more sales,
which further increases
word of mouth advertising
… and so on in a
continuously reinforcing loop. The behavior over time
might look like that on the left.

65
You can’t improve a process until you can control it …
and you can’t control it until you understand it.
Jim Hines, MIT, 1996
6. A second common type of
structure (loop) is the
balancing loop. These
abound in nature, but can be
understood by thinking of
something with which we all
have some experience: a
thermostat. A heating
system is controlled by a
thermostat. We set the desired temperature on the
thermostat,
and when
the
temperature
falls below
that point it
sends a signal to the heater to come on. That heats the air
in the room. Eventually the temperature in the room equals
the thermostat setting, and the thermostat turns off the
heater. Though our goal is to maintain a stable
temperature, the system actually tends to oscillate, more
like the BOT on the left. This is caused by an inevitable
delay between when the room temperature increases and
the thermostat sends an ―off‖ signal to the heater.
7. Often, once the basic structure of a system is described in a
causal loop diagram, opportunities to change that structure
(install balancing feedback, remove or compensate for
delays, etc.)
become more
evident. And
recalling one of the characteristics of a system noted above,
if you want to change the behavior (outcomes) you
probably have to change the structure!

66
8. Making change then can become an experimental process:
decide what you want the output of the system to be, build
your mental model of what will have to change to produce
that output, change it, compare your result to the intended
result, adjust your mental model to take the new
information into account … and try again. In true causal
loop fashion, that brings us back to where we began: ―What
Senge means by "learn" is to act, observe the results,
reflect, adjust, and act again intentionally seeking a
different result.‖
Reflections, laws, helpful hints, and afterthoughts
Cause and effect are often separated in time and space.
Actions have both intended and unintended effects.
Today's problems are yesterday's solutions.
The harder you push, the harder the system pushes back.
Some systems are stable and tend to seek a certain value if
disturbed. Other systems are in equilibrium, but any
disturbance could cause them to tip into a reinforcing loop
in a positive direction, or in a negative direction.
Sometimes it‘s hard to tell which is which.
Systems sometimes react so as to show improvement before
things get worse. Short-term or obvious solutions may
actually make the problem worse.
The easy way out often leads back in.
The cure can be worse than the disease.
Faster is slower.
Small changes can bring big results, but the areas of highest
leverage are often the least obvious.
There is no blame.
There is no "away." When you ―throw it away‖ it goes
somewhere; you may need to expand the boundary of your
system to see that.
Everything is connected to everything else.
You can never do just one thing.
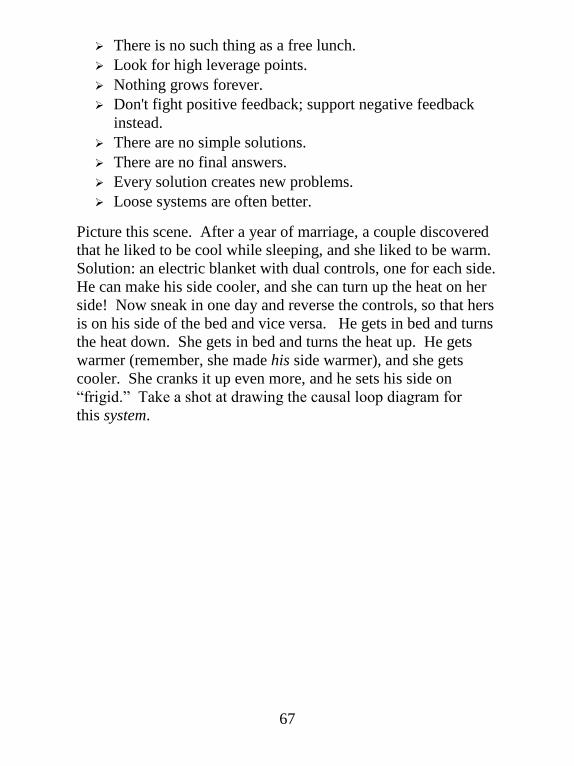
67
There is no such thing as a free lunch.
Look for high leverage points.
Nothing grows forever.
Don't fight positive feedback; support negative feedback
instead.
There are no simple solutions.
There are no final answers.
Every solution creates new problems.
Loose systems are often better.
Picture this scene. After a year of marriage, a couple discovered
that he liked to be cool while sleeping, and she liked to be warm.
Solution: an electric blanket with dual controls, one for each side.
He can make his side cooler, and she can turn up the heat on her
side! Now sneak in one day and reverse the controls, so that hers
is on his side of the bed and vice versa. He gets in bed and turns
the heat down. She gets in bed and turns the heat up. He gets
warmer (remember, she made his side warmer), and she gets
cooler. She cranks it up even more, and he sets his side on
―frigid.‖ Take a shot at drawing the causal loop diagram for
this system.

68
The Voice of the Customer
Whatever your job may be, you provide a product or service for
someone else—your customer. Your work group or unit‘s
success comes from providing products or services that meet
customer needs.
Who are your customers? Consider three types of customers:
end-user customers, broker customers, and fixer customers. End-
user customers are those people who ultimately use your work
group or unit‘s product or service. These are the most important
customers to keep in mind. Broker customers are those people
who transform a product in some way between you and the end-
user customer. And fixer customers are those responsible for
product maintenance. Each type of customer will have different
requirements.
In addition to customer types, consider customer segments.
Different customer segments may also have different
requirements. Boater segments, for example, might include
recreational boaters, fishing vessels, and merchant mariners. A
Servicing Personnel Office may look at the different needs of
officers, enlisted, active duty, reservists, members of other
services, and dependents.
To determine how well you are meeting customer needs, you
must first understand the product or service characteristics the
customer considers most important. Using the critical-to-quality
(CTQ) tree summarized in the tool section is one effective
method. The CTQ tree can help you identify key drivers of
product or service satisfaction, as well as key performance
measures. The customer requirements matrix is another effective
tool. It allows you to identify the gaps between what you provide
and what the customer expects, and prioritize product or service
improvement efforts.
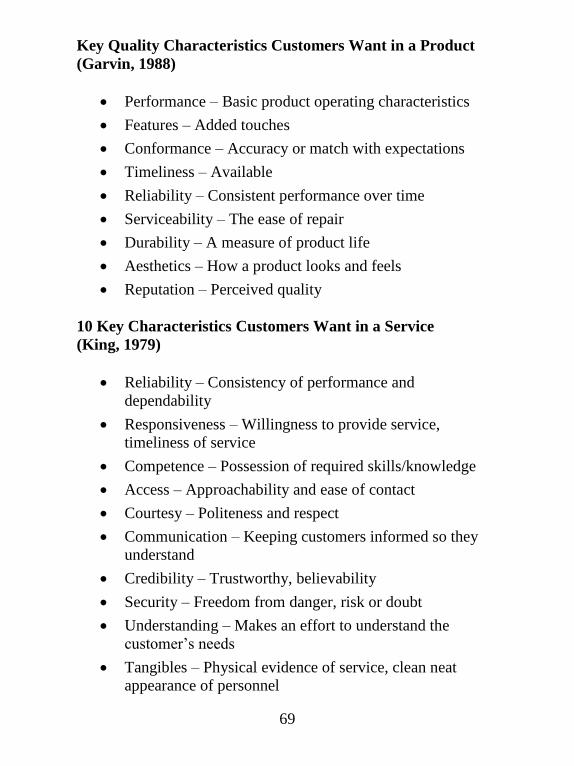
69
Key Quality Characteristics Customers Want in a Product
(Garvin, 1988)
Performance – Basic product operating characteristics
Features – Added touches
Conformance – Accuracy or match with expectations
Timeliness – Available
Reliability – Consistent performance over time
Serviceability – The ease of repair
Durability – A measure of product life
Aesthetics – How a product looks and feels
Reputation – Perceived quality
10 Key Characteristics Customers Want in a Service
(King, 1979)
Reliability – Consistency of performance and
dependability
Responsiveness – Willingness to provide service,
timeliness of service
Competence – Possession of required skills/knowledge
Access – Approachability and ease of contact
Courtesy – Politeness and respect
Communication – Keeping customers informed so they
understand
Credibility – Trustworthy, believability
Security – Freedom from danger, risk or doubt
Understanding – Makes an effort to understand the
customer‘s needs
Tangibles – Physical evidence of service, clean neat
appearance of personnel

70
Work as a Process
All work efforts are part of a process, not an isolated event. All
performance gaps, or problems, are related somehow to a work
process. A process is a series of work steps that change inputs
into outputs. Customers are the end-users of the process. They are
the ones who can tell you if your process is effective.
The following ―SIPOC‖ diagram illustrates the concept of work
as a process:
Suppliers and customers can be from within your own work
group or unit, another Coast Guard unit, or outside the
Coast Guard. Just as a supplier‘s output becomes your input,
your output becomes your customer‘s input. Your customer may
have a customer as well. This string of processes forms a system.
When assessing process performance, it‘s important to know
what is happening both upstream and downstream. Process
mapping can help you identify opportunities for improvement.
See SIPOC and Flow Charts in the tools section for more
information.
Process Customer Output Input Supplier
Key Idea: All performance gaps, or problems, are
related to a work process. Yet, even when
people understand this concept, they tend to
think in terms of isolated problems, not the
process. In order to address root causes of
problems, and not symptoms, we must
understand the voice of the process.

71
Performance Elements
The effectiveness and efficiency of processes depend on more
than the procedural steps within the process itself. To properly
examine a process, a team should consider all of the performance
elements:
Outcomes The benefit that the command/staff/organization
seeks to achieve or influence—the eventual
process and output effect.
Outputs The immediate products, services, or information
produced.
Inputs The resources needed for the process to operate.
Conditions Factors that influence the availability of inputs
and the operation of the process.
Feedback Solicited or unsolicited comments from others
regarding the process, outputs, and outcomes.
Performance
Measures
Systematically collected quantitative and
qualitative data on the effectiveness and
efficiency of the process.
The table on the next page shows examples of elements that may
factor into the performance of a process.

72
Element Examples
Outcomes Effect on mission(s), program goals, and/or the local
community; employee, customer, and stakeholder
satisfaction; community response; customer use of
products and services
Outputs Boardings, inspections, identification cards, skilled
trainees, health care services, directives and policies
Inputs Equipment, funding, materials, information, skilled
labor, requests for service
Conditions Management priority, organization values, employee
behaviors, work environment, policies, support
systems, weather
Feedback Customer and stakeholder feedback, metrics, news
reports, independent studies
Performance
Measures
Customer satisfaction, on-time-delivery, organizational
requirements, quality, cost, cycle time, productivity and
waste. See the next section for more information.
The following Work Context diagram which builds on the
―SIPOC‖ diagram shows how the elements work together.
Process Outputs Outcomes
Feedback Feedback
Performance Measures
Inputs
Conditions

73
Performance Measures
To meet and exceed customer and mission requirements, you
must develop meaningful effectiveness and efficiency measures:
Effectiveness measures indicate how well process outputs meet
customer and mission requirements. Measures of effectiveness
include customer satisfaction, on-time-delivery, organizational
requirements, and quality.
Customer Satisfaction is a soft measure of how the
customer perceives your product or service.
On-Time-Delivery is a measure of how often the desired
process output is delivered when the customer wants it.
Organizational Requirements are measures of how well
your outputs meet requirements of stakeholders that are not
necessarily your customers. Organizational requirements
measures are a subset of quality measures.
Quality is a measure of how well your outputs meet
important requirements or needs, such as reliability,
features, etc.
Efficiency measures indicate how well you are meeting your
customer and mission requirements with a minimum use of
resources. Measures of efficiency include cost, cycle time,
productivity, and waste.
Cost is a measure of fiscal stewardship.
Cycle Time is a measure of the time a service or product
takes to move from the beginning of a process to the end.
Productivity is the ratio between output and input, as
illustrated in the formula P = O/I (where P = productivity,
O = output, and I = input).
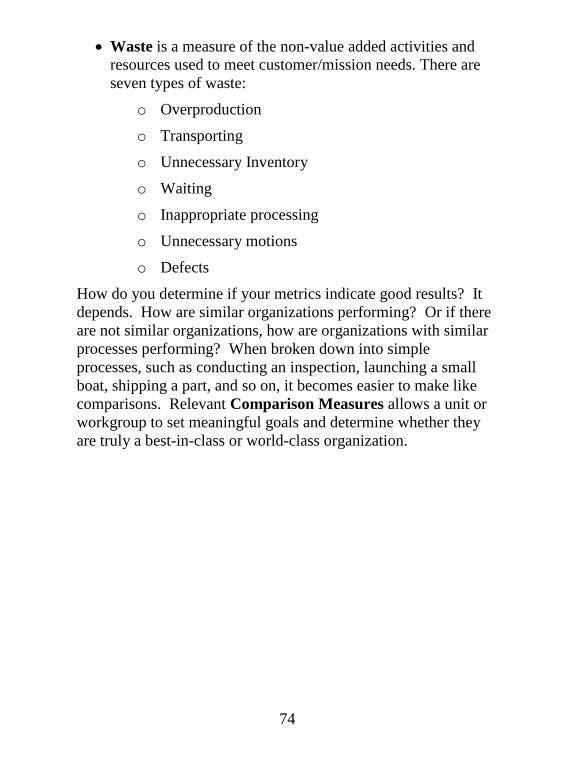
74
Waste is a measure of the non-value added activities and
resources used to meet customer/mission needs. There are
seven types of waste:
o Overproduction
o Transporting
o Unnecessary Inventory
o Waiting
o Inappropriate processing
o Unnecessary motions
o Defects
How do you determine if your metrics indicate good results? It
depends. How are similar organizations performing? Or if there
are not similar organizations, how are organizations with similar
processes performing? When broken down into simple
processes, such as conducting an inspection, launching a small
boat, shipping a part, and so on, it becomes easier to make like
comparisons. Relevant Comparison Measures allows a unit or
workgroup to set meaningful goals and determine whether they
are truly a best-in-class or world-class organization.
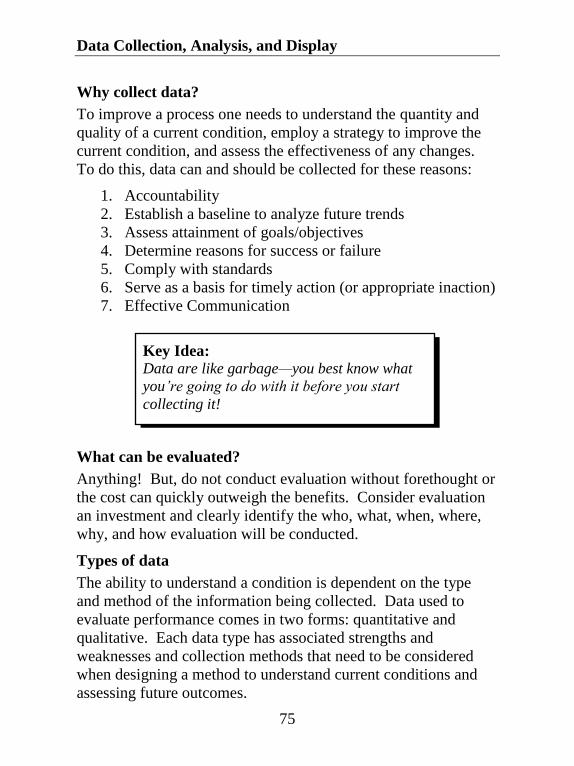
75
Data Collection, Analysis, and Display
Why collect data?
To improve a process one needs to understand the quantity and
quality of a current condition, employ a strategy to improve the
current condition, and assess the effectiveness of any changes.
To do this, data can and should be collected for these reasons:
1. Accountability
2. Establish a baseline to analyze future trends
3. Assess attainment of goals/objectives
4. Determine reasons for success or failure
5. Comply with standards
6. Serve as a basis for timely action (or appropriate inaction)
7. Effective Communication
What can be evaluated?
Anything! But, do not conduct evaluation without forethought or
the cost can quickly outweigh the benefits. Consider evaluation
an investment and clearly identify the who, what, when, where,
why, and how evaluation will be conducted.
Types of data
The ability to understand a condition is dependent on the type
and method of the information being collected. Data used to
evaluate performance comes in two forms: quantitative and
qualitative. Each data type has associated strengths and
weaknesses and collection methods that need to be considered
when designing a method to understand current conditions and
assessing future outcomes.
Key Idea: Data are like garbage—you best know what
you’re going to do with it before you start
collecting it!

76
Quantitative Data
Quantitative data are generally what comes to mind when
thinking about assessment. Simply defined, quantitative data are
the result of measurement, the process of changing words into
numbers. Quantitative data tend to be used for systematic
statistical analysis with a goal of verification. Examples include
choice or scale items such as:
Example 1. What is your current age? ______
Example 2. Use the below scale to answer the below questions:
1. Strongly
Disagree
2. Disagree
3. Neutral
4. Agree
5. Strongly
Agree
A. ____ Morale in my department is high.
Example 3. What is your gender?
1.Female
2. Male
Types of Quantitative Data
Investigating deeper into these examples leads to another
question, are these items measuring the same type of data? Data
can be classified into two types: continuous and discrete.
Continuous data (example 1) are measured on a continuum, e.g.,
age; time; weight; number of units produced per hour; dollars
spent; or test scores. Alternatively, discrete data are not
continuous, that is, they are merely counts, e.g., number of
females in a unit (example 3). To put it a different way, if you
want to ask ―what is the average number of X‖ you are referring
to continuous data. If you want to ask ―what is the percent of X‘s
occurrence‖ you are referring to discrete data. The type of data
measured is directly related to the types of statistical analyses that
can be conducted. What about example 2?

77
Say example 2 provided us with the following results after
sampling 10 students:
Example 2. A. ____ Morale in my department is high.
1. Strongly
Disagree
2. Disagree
3. Neutral
4. Agree
5. Strongly
Agree
Results: 0 1 0 1 8
Average Rating = 4.6
This shows that scale responses can fall into a gray area. They
are technically discrete, each item is an independent response, but
are generally considered continuous data as there is an implied
underlying continuity (strongly disagree to strongly agree). As a
side note, continuous data are considered more robust than
discrete data because continuous data allow for more complex
analyses and can easily be converted into discrete data (groups),
while the inverse (discrete to continuous) is not possible.
Qualitative Data
While quantitative data answers the question ―how many‖ or
―what amount,‖ another question is left unanswered: ―why?‖ An
average score may be sufficient in some situations, particularly
when conducting systematic or programmatic analyses, but in
many cases this is not enough information to make meaningful
changes or improvements. Qualitative data improves our
understanding by clarifying the underlying rationale for
quantitative ratings. In other cases, such as focus groups or
interviews, qualitative data is preferred as it provides rich
feedback with specific examples, ideas, and reasons. In the
above example, it would be useful to know why students felt
what they learned will help them on the job. Was it due to the
content of the instruction, the materials used, or the manner in
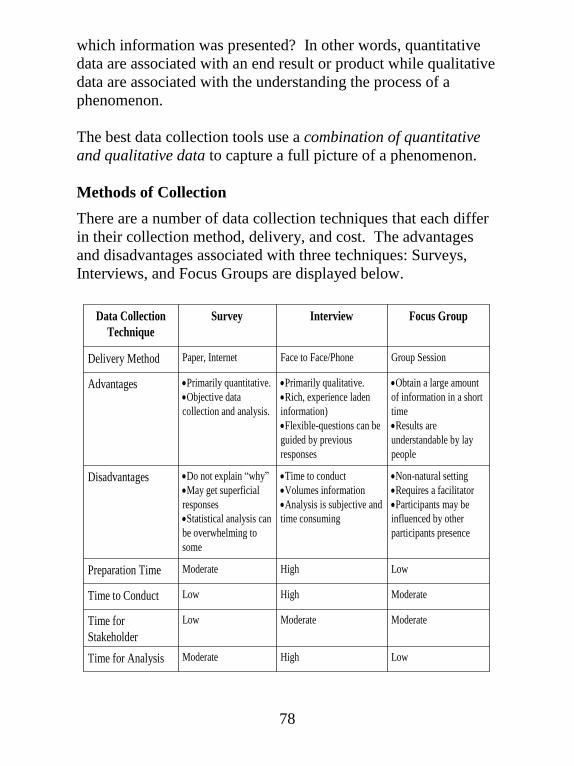
78
which information was presented? In other words, quantitative
data are associated with an end result or product while qualitative
data are associated with the understanding the process of a
phenomenon.
The best data collection tools use a combination of quantitative
and qualitative data to capture a full picture of a phenomenon.
Methods of Collection
There are a number of data collection techniques that each differ
in their collection method, delivery, and cost. The advantages
and disadvantages associated with three techniques: Surveys,
Interviews, and Focus Groups are displayed below.
LowHighModerateTime for Analysis
ModerateModerateLowTime for
Stakeholder
ModerateHighLowTime to Conduct
LowHighModeratePreparation Time
Non-natural setting
Requires a facilitator
Participants may be
influenced by other
participants presence
Time to conduct
Volumes information
Analysis is subjective and
time consuming
Do not explain ―why‖
May get superficial
responses
Statistical analysis can
be overwhelming to
some
Disadvantages
Obtain a large amount
of information in a short
time
Results are
understandable by lay
people
Primarily qualitative.
Rich, experience laden
information)
Flexible-questions can be
guided by previous
responses
Primarily quantitative.
Objective data
collection and analysis.
Advantages
Group SessionFace to Face/PhonePaper, InternetDelivery Method
Focus GroupInterviewSurveyData Collection
Technique

79
Guidelines for Data Collection Methods
General Considerations
Plan ahead! Know what questions you want to ask ahead of time
and ensure the data collection method you select will answer
those questions. It is difficult to go back and collect more data.
Think about the population you are interested in. How will you
sample from this group of people? Do you ask everyone to
participate or only select a few? There are a number of sampling
techniques available to use, the most common being using a
random sample of all possible participants or selecting a specific
group to participate. See ‗further reading‘ for more information
on sampling. Regardless of the sampling method, make sure
participants know what is expected of them and what you plan to
do with their data. There are federal regulations to ensure a
participant‘s rights are protected. Simply stated, this protection
ensures participants will remain anonymous, have the right to
terminate at any point, data will remain confidential, and their
responses will not affect their job or performance evaluations
(unless clearly stated otherwise). Also, remember a participant‘s
time is valuable. To get the most valid and meaningful data, be
sure to not overtax participants with questions that do not meet
your objectives
It is usually helpful to run a pilot or small test study prior to the
full data collection to work out any problems. By using a
practice study you will benefit both through participants
clarifying potential problems and in your collection technique or
process. This is of particular importance if you are collecting
qualitative data (interviews or focus groups) to ensure you are
familiar with your questions. Regardless of the data collection
techniques, it is important to always try to avoid confusion when
possible. Ask clear, singular, focused questions and use simple
language (no acronyms, ‗big words‘)
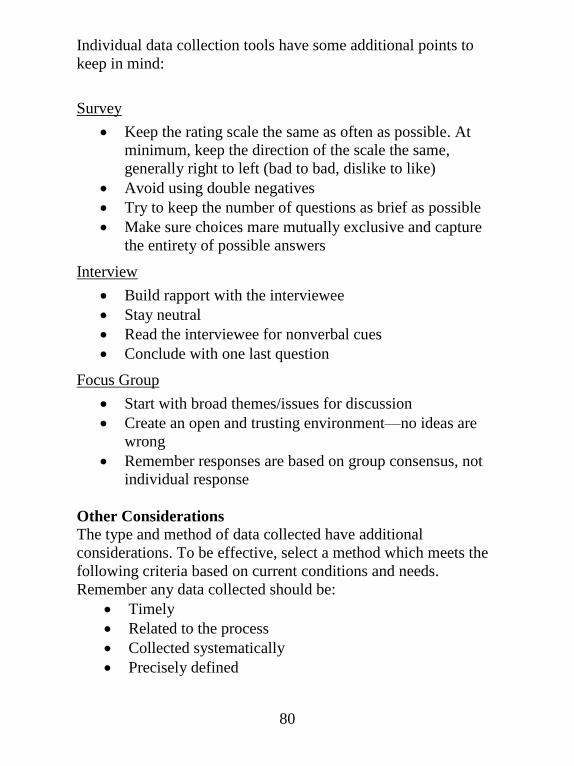
80
Individual data collection tools have some additional points to
keep in mind:
Survey
Keep the rating scale the same as often as possible. At
minimum, keep the direction of the scale the same,
generally right to left (bad to bad, dislike to like)
Avoid using double negatives
Try to keep the number of questions as brief as possible
Make sure choices mare mutually exclusive and capture
the entirety of possible answers
Interview
Build rapport with the interviewee
Stay neutral
Read the interviewee for nonverbal cues
Conclude with one last question
Focus Group
Start with broad themes/issues for discussion
Create an open and trusting environment—no ideas are
wrong
Remember responses are based on group consensus, not
individual response
Other Considerations
The type and method of data collected have additional
considerations. To be effective, select a method which meets the
following criteria based on current conditions and needs.
Remember any data collected should be:
Timely
Related to the process
Collected systematically
Precisely defined

81
What To Do With The Data?
Once you have collected data you need to do something with the
results. If you leave collected unanalyzed you have not only
wasted time and money but leave questions unanswered, i.e., why
even collect the data in the first place?
The method of data collection generally dictates what analysis
can be done. Of course, while planning the evaluation you
should have thought about what objectives/questions you wanted
answered and how to analyze data to answer these questions.
This guide several examples of analytical and graphical tools to
describe and display your data. Decisions must be made
relatively quickly, accurately, and presented in a manner that is
easily and effectively understood by all audiences.
Effective Data Collection Strategy
Answering the following questions will allow you to develop
an effective strategy for collecting data.
What do we want to accomplish by collecting the data?
What data is needed to achieve this goal?
Where in the process should we collect data?
What sampling scheme should we use?
How much data (samples/data points) are needed?
When/how long should data be collected?
How will we record the data?
Who is responsible for collecting the data?
Is the collection method simple and efficient?

82
Data Analysis
An in-depth explanation of data analysis is beyond the scope of
this book; however, several simple tools are available to analyze
your data. Briefly, there are two analytical tools descriptive
analysis and inferential analysis. Descriptive statistics describe
the sample1 and inferential statistics are used to determine
relationships between samples. This guide will only cover
descriptive statistical tools.
As mentioned, the types of descriptive statistics used is
dependent on the type of data collected, i.e., discrete or
continuous. When describing data, the goal is to use one number
(or fewer numbers) as a summary for a larger group of data. In
the case of discrete data, this summary generally takes the form
of frequencies and percentages. Frequencies are counts of each
category while percentages are a standard metric for comparing
frequencies by dividing frequencies by the total number of cases
(participants). When reporting percentages, always include the
sample size or frequency to help the reader correctly interpret the
statistic. For example, the statement ‗75% of all employees are
dissatisfied with their work environment‘ is more meaningful if
100 individuals were sampled as opposed to 4.
For example, in Example 2, 80% of the participants stated they
strongly agreed that morale is high.
1 Specifically, the sample is an estimate of the target population from which
the sample came from, e.g., a sample of Coast Guard Reservists are meant to represent the population of all Reservists in the Coast Guard.

83
Continuous data allows for more complex analysis. Two pieces
of information are needed to describe continuous data taken from
a sample: a measure of the data‘s middle point a measure of
variability or spread. The most common measures used are the
mean (average or middle point) and standard deviation
(―average‖ variation around the mean), though other measures
exist. In the example below, the ages for 7 participants are 20,
22, 28, 30, 31, 33, and 40. The mean score is 29.1 and the
standard deviation is 6.7.
Spreadsheet and statistical packages, such as Excel, MINITAB,
SPSS, and SAS can all compute descriptive (and inferential
statistics). A note of caution, though simple to use, these analysis
packages assume the user understands the assumptions
underlying statistical tests and can accurately interpret the results.
Consult a statistician or analyst prior to analyzing data with
computer applications.
One final note, qualitative data should also be analyzed. The
most common procedure for analyzing qualitative data is to use a
content analysis. Content analysis requires an analyst to read
through comments, interviews, or other collected text and
determine common themes or patterns within the data. These
themes usually presented in terms of frequencies.

84
Displaying Data
Statistics such as frequencies and means provide evidence to
support decisions, but these decisions are not always easily made
from lists of statistics. Graphically representing statistics can
provide a simple and powerful way to help interpret results. Two
types of statistical displays are table and figures.
Tables provide a mechanism to summarize groups of statistics in
a specific location. Tables can also be used to represent
qualitative data, such as the themes derived from a content
analysis or focus group exercise.
Some considerations when developing tables:
Tables should have labeled titles and column headings
Titles should be descriptive but not overly wordy
Column heading should include units of measurement
Data should be arranged in a logical order
Align decimal points and be consistent with the number
of decimal points used. Usually 1 or 2 decimal points are
sufficient
Use the space underneath a table to describe anther other
notes or explanations within a table.
Do not use too many borders. Generally, a border around
the column headings and at the bottom of the table are
sufficient
Personality types
Hidden agenda
Table 1. Years on Active Duty
Mean SD
Years Active (Range 0 to 20) 5.2 6.4
Table 2. Gender Distribution
Freq %
Male
Female
48 95.1
4 4.9
Sample size = 52
Note: 2 cases missing
Table 3. Considerations of Facilitators
Tips Pitfalls
Not affected by outcomes
No personal agenda
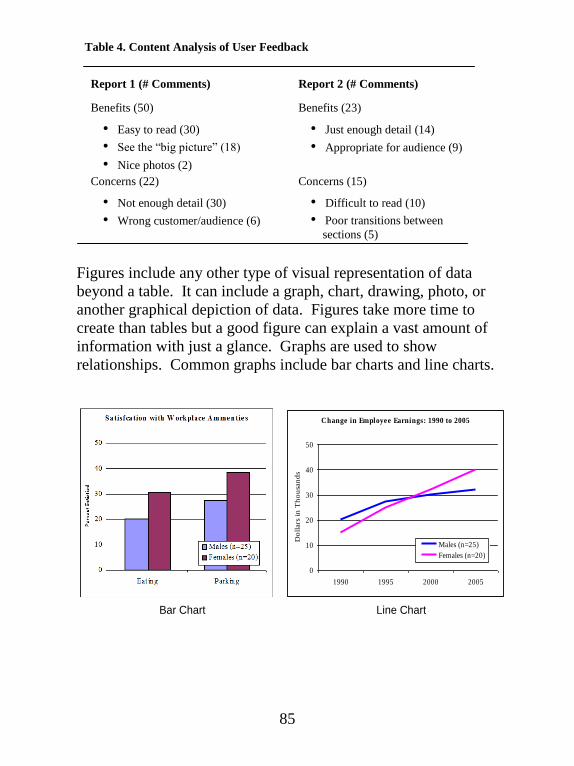
85
Figures include any other type of visual representation of data
beyond a table. It can include a graph, chart, drawing, photo, or
another graphical depiction of data. Figures take more time to
create than tables but a good figure can explain a vast amount of
information with just a glance. Graphs are used to show
relationships. Common graphs include bar charts and line charts.
Change in Employee Earnings: 1990 to 2005
0
10
20
30
40
50
1990 1995 2000 2005
Do
llars
in
Th
ou
san
ds
Males (n=25)
Females (n=20)
Bar Chart Line Chart
Table 4. Content Analysis of User Feedback
Report 1 (# Comments) Report 2 (# Comments)
Benefits (50)
• Easy to read (30)
• See the ―big picture‖ (18)
• Nice photos (2)
Concerns (22)
• Not enough detail (30)
• Wrong customer/audience (6)
Benefits (23)
• Just enough detail (14)
• Appropriate for audience (9)
Concerns (15)
• Difficult to read (10)
• Poor transitions between
sections (5)

86
The most effective figures incorporate the following
considerations:
All axes are labeled with units of measurement
Titles should be descriptive but not overly wordy
Fonts should be similar to what is used in other text,
though generally smaller and bolded to identify labels
Gridlines can help a reader interpret results
Do not use too many colors and be mindful of color
blindness (be careful using blue and yellow or red and
green to display different groups)
Note the scale. Scales can be altered to emphasize or
diminish results. This is why it is important to label axes
(see below)
With the simple guidelines presented here and throughout this
guide you can begin to better understand any process and use the
results to make meaningful changes and improvements. For
more information regarding data collection, analyses, and
display, see the additional references section.
Profit for FY 2006
9
10
11
12
1 2 3 4
Quarter in 2006
Mil
lio
ns
of
Do
llar
s
Profit for FY 2006
0
2
4
6
8
10
12
1 2 3 4
Quarter in 2006
Mil
lio
ns
of
Do
llar
s
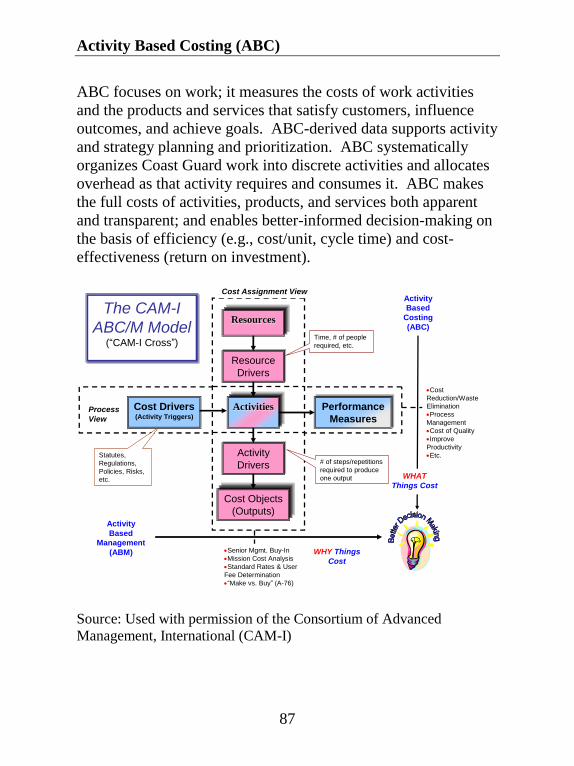
87
Activity Based Costing (ABC)
ABC focuses on work; it measures the costs of work activities
and the products and services that satisfy customers, influence
outcomes, and achieve goals. ABC-derived data supports activity
and strategy planning and prioritization. ABC systematically
organizes Coast Guard work into discrete activities and allocates
overhead as that activity requires and consumes it. ABC makes
the full costs of activities, products, and services both apparent
and transparent; and enables better-informed decision-making on
the basis of efficiency (e.g., cost/unit, cycle time) and cost-
effectiveness (return on investment).
WHY Things
Cost
ResourcesResources
ActivitiesActivities
Cost Objects
(Outputs)
Resource
DriversResource
Drivers
Activity
DriversActivity
Drivers
Cost Drivers(Activity Triggers)
Performance
MeasuresPerformance
Measures
Cost Assignment View
Process
View
The CAM-I
ABC/M Model(“CAM-I Cross”)
The CAM-I
ABC/M Model(“CAM-I Cross”)
WHAT
Things Cost
Activity
Based
Management
(ABM)
Activity
Based
Costing
(ABC)
Statutes,
Regulations,
Policies, Risks,
etc.
Cost
Reduction/Waste
Elimination
Process
Management
Cost of Quality
Improve
Productivity
Etc.
Time, # of people
required, etc.
# of steps/repetitions
required to produce
one output
Senior Mgmt. Buy-In
Mission Cost Analysis
Standard Rates & User
Fee Determination
“Make vs. Buy” (A-76) Source: Used with permission of the Consortium of Advanced
Management, International (CAM-I)
88
ABC Deployment
Both the Atlantic and Pacific Maintenance and Logistics
Commands (MLCLANT and MLCPAC) have established ABC
systems to better measure and understand support costs. All
MLCPAC Integrated Support Commands (ISCs) have software
licenses, training, and computer support for an initial effort to
deploy ABC methodologies. The MLCLANT support
community has a similar effort underway. Other support units
will follow. The Marine Safety and Environmental Programs
piloted ABC at Headquarters and two field units—Marine Safety
Office (MSO) New Orleans and Activities Baltimore—between
1997 and 1999. Lessons learned were applied at Sector St.
Petersburg (MSO Tampa/Group St. Petersburg) and then at
Sector Corpus Christi to support risk management. Follow-on
efforts will continue at other units.

89
The Unified Performance Logic Model (UPLM)
The UPLM is a detailed ―cognitive mapping‖ tool that will be
primarily used by program analysts, to capture the cause-and-
effect relationships between Coast Guard capabilities, require-
ments, activities, outputs, and goals/outcomes achieved. The
UPLM clarifies the relationship between operational performance
(risk management) and support (readiness management). It
demonstrates alignment between Coast Guard work activities,
outputs (products and services) and the goals, or purposes, for
which the work is performed. It is fundamentally an activity-
based model (see ABC) and provides a framework for metrics.
Unified Performance Logic Model (UPLM)
Support Outcomes
(Stewardship)
Support Outcomes
(Stewardship)
ActivityActivity
OutputOutput
OutputOutput
SupportOutputs
SupportOutputs
ActivityActivity
ActivityActivity
SupportOutputs
SupportOutputs
SupportActivities
SupportActivities
SupportActivities
SupportActivities
Why we perform activities.
How we achieve our goals.
Measures
RequirementsRequirements
RequirementsRequirements
RequirementsRequirements
RequirementsRequirements
Capability Capability
Capability Capability
Capability Capability
Capability Capability
External
Outcomes
(Public Effectiveness)
External
Outcomes
(Public Effectiveness)
Some Definitions:
• Activity – A unit of work with a beginning and end
leading to an output
• Output – A product or service desired by a customer that
is produced by an activity or a process. Examples

90
include: a mariners license, a strategic plan, a completed
SAR case.
• Outcome – The public benefit that the Coast Guard seeks
to achieve or influence (e.g., Maritime Safety—a
reduction in deaths associated with maritime
transportation, fishing, and recreational boating).
• Readiness - Measure of USCG ability to execute mission
requirements IAW standards
• Standard – Designated parameter or expectation of
performance. Standards should be established based on
systematic assessment of requirements and should be
updated to reflect changing conditions.
The UPLM shows how activities convert resources into readiness
(Authorities, Competencies, Capabilities, and Partnerships). And
it shows how readiness is consumed to influence public outcomes
across the performance spectrum (awareness, prevention,
protection, response, and recovery) to achieve Coast Guard
strategic goals.
Building the UPLM is a complex, ongoing, and detailed effort to
identify activities the Coast Guard performs (work), the outputs
produced (products and services), the goals they are intended to
influence, and the cause-and-effect relationship between all. The
UPLM will facilitate and support:
Causal Analysis
Organizational and Performance Metrics Identification and
Alignment
A Standardized, Disciplined Planning and Management
Lexicon
Development of the Mission-Oriented Information
Systems Architecture (CIO-designed Enterprise
Architecture)

91
What to Work On
Deciding what to work on can be a difficult task. Whether a team
seeks to improve its own processes or management faces multiple
improvement opportunities, the question, ―where do we start?‖
must be answered. Whatever the choice, the project must be
worthwhile. In other words, it must be:
Important—there is no point in working on a problem
that nobody cares about. Is there a business case?
Achievable—is the scope of the project too large?
Projects don't have to be huge to be important—a series of small
improvements can make a big difference. Small projects can help
spark other ideas and show employees how to make a significant
change. Solving an easy problem provides the experience needed
to tackle tougher ones.
Consider these factors when deciding on a project:
Customers. Satisfaction, relationships, complaints, trends
in behavior, requirements, etc.
Organizational Goals. What‘s important to
management?
Other Stakeholder Expectations. Employees,
community, neighbors, suppliers, etc.
Productivity. Costs in money, labor, material, and
equipment, etc.
Mission Performance. Meeting or exceeding customer
expectations, productivity goals, or standards.
Organizational Assessment. Such as Commandant‘s
Performance Challenge, Commandant‘s Quality Award,
Organizational Assessment Survey.
Strategic Challenges. Preparing for the needs of your
operating environment.
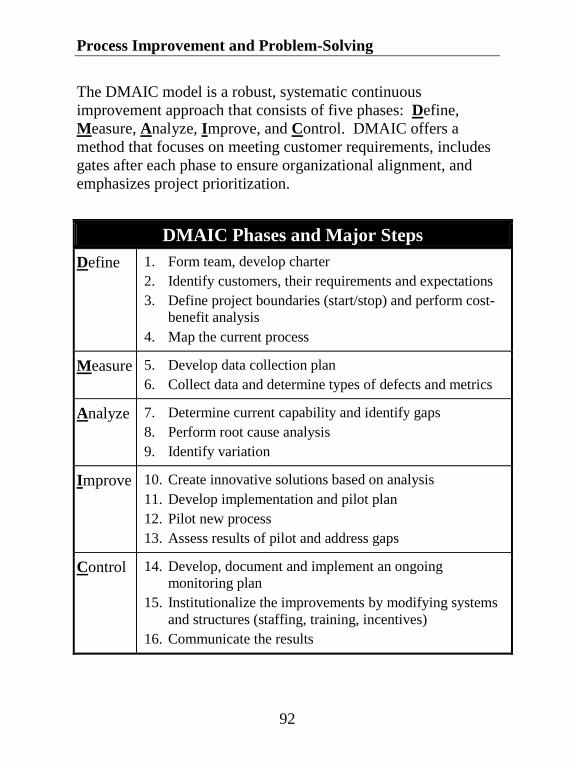
92
Process Improvement and Problem-Solving
The DMAIC model is a robust, systematic continuous
improvement approach that consists of five phases: Define,
Measure, Analyze, Improve, and Control. DMAIC offers a
method that focuses on meeting customer requirements, includes
gates after each phase to ensure organizational alignment, and
emphasizes project prioritization.
DMAIC Phases and Major Steps
Define 1. Form team, develop charter
2. Identify customers, their requirements and expectations
3. Define project boundaries (start/stop) and perform cost-
benefit analysis
4. Map the current process
Measure 5. Develop data collection plan
6. Collect data and determine types of defects and metrics
Analyze 7. Determine current capability and identify gaps
8. Perform root cause analysis
9. Identify variation
Improve 10. Create innovative solutions based on analysis
11. Develop implementation and pilot plan
12. Pilot new process
13. Assess results of pilot and address gaps
Control 14. Develop, document and implement an ongoing
monitoring plan
15. Institutionalize the improvements by modifying systems
and structures (staffing, training, incentives)
16. Communicate the results

93
DMAIC Roadmap:
Define
1. Form team, develop charter
Define project objectives
o Is there a business case?
o What is the problem?
o What is the goal, in measurable terms? Triangulating
the business case, problem, and goal is key.
o What is the scope of the project?
o What is the background?
o Who is the sponsor?
o Who is on the team? Team selection is critical.
2. Identify stakeholders, their requirements and
expectations
Obtain customer input
o What is the voice of the customer?
o What are the critical-to-quality requirements?
Identify other stakeholders
o Perform a stakeholder analysis
3. Define project boundaries (start/stop) and perform cost-
benefit analysis
Identify the first and last step of the process associated
with the problem you are addressing
4. Map the current process
Start with a macro-level flowchart, and then do one with
enough detail to understand the performance challenge
Identify/verify key process outputs and customers who
use them, key inputs and suppliers who provide them
Identify/verify the factors that most influence the process

94
Measure
5. Develop data collection plan
Check and validate existing measures
6. Collect data and determine types of defects and metrics
Consider measures of effectiveness and efficiency
Analyze
7. Determine current capability and identify gaps
Is the process capable of performing to requirements?
8. Perform root cause analysis
Identify all gaps, root causes, or symptoms which are
beyond your knowledge or control
9. Identify variation
Examine how the processes associated with the root
causes are performing
Improve
10. Create innovative solutions based on analysis
Generate lots of ideas, then select the one (or more) most
promising change(s) to make based on the identified gaps
and root causes
11. Develop implementation and pilot plan
Consider time, cost, and quality requirements
12. Pilot new process
Test the process out before implementing a full-scale
change
13. Assess results of pilot and address gaps
Did the new process perform as expected?

95
Control
14. Develop, document and implement an ongoing monitoring
plan
Choose valid and reliable measures
15. Institutionalize the improvements through the
modification of systems and structures (staffing, training,
incentives)
Consider Commandant‘s Instructions, Standard Operating
Procedures, checklists, etc.
16. Communicate the results
Consider different methods such as presentations, posting
of results, and e-mail
Conduct a gate review after each phase is complete. During a
tollgate review, the team leader/team should meet with the senior
champion. Together, they should review progress and ensure that
no steps have been missed.
For in-depth
DMAIC
model
information
beyond the
scope of this
guide, consult
the Six Sigma
references in
the additional
resources
section.
Effect
Causes
Alternatives
x _______
x _______
x _______
DMAIC
X ________
X ________
Solutions
Metrics
CTQ 1
CTQ 2

96
The CG Organizational Assessment Survey (CG-OAS)
The CG-OAS is a biennial survey conducted in the January-
March time frame; the Coast Guard first used it in 2002. The
CG-OAS is an extensive survey that all Active Duty, Selected
Reserve, and Civilian members/employees are asked to complete.
This survey is the cornerstone of the Human Resources
Directorate‘s assessment process. The CG-OAS contributes to
performance improvement by:
Assessing Coast Guard organizational strengths and
weaknesses;
Providing a basis for effective management, planning, and
evaluation of organizational initiatives and strategies;
Establishing measures to benchmark and evaluate change
in organizational performance over time;
Measuring key indicators relevant to the Government
Performance and Results Act (GPRA) and the
Commandant‘s Performance Excellence Criteria (CPEC);
Providing government and private sector comparative
data;
Providing commands/staffs comparative data for unit type
or communities.
ALL SECTORS % Positive Values
20%
30%
40%
50%
60%
70%
80%
90%
Communicatio
n
Innovation
Leaders
hip
Teamwork
Use of R
esource
s
2006-ALL
SECTORS
2006
2004
2002

97
CG-OAS results are used by the Chain of Command, Command
Master Chiefs, Rating Force Master Chiefs, program managers,
civilian personnel, Reserve Component managers, and many
others. CG-OAS data gives these decision-makers a better
understanding of the issues and concerns affecting Coast Guard
people. Our regular CG-OAS use will provide results and trends
to track the success of a wide range of local and service wide
initiatives.
Coast Guard wide results and tools to work with those CG-OAS
results are located on CG Portal. A CO/OINC or their designated
representative can get unit-specific results by contacting COMDT
(CG-1B2), Mr. Paul Redmond (see global list), to gain access to
unit level results. In addition, regional Organizational
Performance Consultants (OPCs) can work with leaders to better
understand command-specific results and to develop an action
plan to improve in selected performance areas.
The CG-OAS gives all but the smallest units a way to track and
respond to unit-level issues with quantifiable information. And,
it gives senior leaders and program and community managers
valuable information with which to lead and manage their areas
of responsibility.
98
Coast Guard Business Intelligence (CGBI)
Business Intelligence is a standard industry term that refers to a
set of processes and tools to collect and analyze business data and
transform it into organizational knowledge and—ultimately—
wisdom.
The Coast Guard currently has numerous business intelligence
initiatives underway. COMDT (CG-095) is partnering with HQ
directorates and field users at all levels to combine the “best” of
these initiatives to deliver a CGBI system that we can rely on and
readily use. CGBI seeks to provide access to dependable data,
standard measures and robust analyses in a repeatable manner to
make fact-based decisions possible. The CGBI motto is:
One Source. One Answer. One Coast Guard.
CGBI includes readiness, activity, and performance measures
for every member, unit, and community accessible through
CG Portal. The “Business Intelligence” tab provides access
to information relevant to individuals, units, and the Service.
Business Intelligence principles:
Organizations run best on accurate information;
Unit-level people provide 99% of that information;
responsibility for accurate input rests with every
Coast Guard member; and
Every piece of information should be collected only once
and it should be nearly effortless to collect, analyze, view,
and use.
CGBI extracts data from existing Coast Guard systems like
Direct Access, AOPS, ALMIS, TMT, etc., which are mandated
by COMDT to be the repository for their respective information.

99
These are called source systems. In almost all cases, members in
various Coast Guard commands enter data into those source
systems. CGBI does not ‗own‘ the data, merely centralizes the
data and displays it to everyone in a consistent manner.
Many commands and programs have traditionally kept
homegrown databases and spreadsheets in order to store, view
and retrieve data. The problem with this approach is that each
collects and stores different data in various methods (Excel
spreadsheets, Access databases, etc.), which forces individualized
training at each command/staff and does not allow information
sharing between commands/staffs. To allow good data
stewardship, each command, staff, and member is asked to enter
the data into the official source system. Those that ensure
reliable and timely data input will reap full CGBI benefits of
accurate and useful information with which they and other
decision-makers can confidently make use of.
One Source. One Answer. One Coast Guard.
11
What is Business Intelligence?– A set of business processes and tools for
collecting and analyzing business data and
information and transforming it into
organizational knowledge and ultimately
wisdom.
CG Business Intelligence (CGBI)
Analysis
Analysis

100
The Commandant’s Innovation Council
We recognize the potential for individuals to solve organizational
challenges by ingeniously applying their talents and existing
resources. The Commandant‘s Innovation Council champions
Innovators by revealing and illuminating their ideas and
evaluating them for Coast Guard-wide implementation. The
Council acts as a catalyst for change in Mission Execution and
Mission Support. The Council seeks to promote an innovative
Coast Guard culture; identify enabling technology; champion
innovative solutions; and improve Coast Guard key processes.
Our Innovation Initiative was formally established in NOV 2000.
Since its inception, the Innovation Council, which reports directly
to the Coast Guard Chief of Staff, provides cross-programmatic
advocacy to Coast Guard people, units, and programs while
promoting an innovative culture that entertains all ideas to
resolve organizational challenges.
PHILOSOPHY: Innovation is not a new concept, just as improving
efficiency and effectiveness are age-old objectives; across private
and government sectors, leaders search for new ways to get better
results. The Innovation Initiative aids leaders in this goal through
processes that seek-out, promote, and help implement ideas to
improve effectiveness. The Council aggressively acts to
prioritize and champion competing innovative projects and
enables Field Innovation Councils to ensure Coast Guard-wide
alignment and implementation.
PROCESSES: To further the Innovation Initiative goals, the
Council uses the following processes:
Innovation Venture Capital Fund: Funds innovative solutions
to organizational challenges; supports the annual Innovation
Exposition; and Captain Neils P. Thomsen Innovation
Awards program. Members and units may submit proposals
to the Commandant‘s Innovation Council via the Innovation
Database, where proposals are evaluated for technical,

101
Innovation Venture Capital Fund Decision Process
Information from source (member, unit, or organization) is manually entered into the Innovation Database following Database guidance/steps.
Submission remains in Innovation Database pending review .
Submission is reviewed by specified Command
Location ( PACAREA , LANTAREA , or HQ / HQ Unit ) using established
criteria .
Is this a request for funding ?
Yes
No
Action taken as deemed necessary by Command
Location Reviewer . Submitter notified of
disposition .
Does reviewer need additional information ?
Yes
No
Submitter contacted requesting additional
information .
Does submission meet criteria ?
Yes No Innovation submitted to
COMDT’s Innovation Council for funding
consideration ( see Note 1 )
Does submission have support from 75 % of Innovation Council ?
Would additional information help ?
Yes
No
Yes
No
Funds are allocated and transferred as needed to support
innovation development .
Innovation will remain in the Database but is marked Closed .
No further action taken .
Note: LANTAREA and PACAREA Field
Innovation Councils may approve funding for innovation in their AORs; not to exceed
$100K annually. .
102
business, and resource merit. See the Innovation Council
website for guidance at http://www.uscg.mil/innovation/.
Innovation Exposition: The annual Expo is designed to
bring together Team Coast Guard, industry, and other
Government agencies to establish open dialogue among
technology users, innovators, academia, Research and
Development Centers, and Coast Guard support elements to
promote innovation. The Expo typically focuses on major
Coast Guard challenges and agendas consist of the full range
of issues pertaining to Homeland Security and other
Coast Guard mission areas. Annual Innovation Exposition
information is promulgated via ALCOAST at the start of
each calendar year.
Captain Neils P. Thomsen Innovation Awards: These
Awards recognize individuals or teams for their ability to
develop creative ideas that result in successful implementa-
tion of an innovative solution. Four types of individual
and/or team awards exist: (1) Science or Technology;
(2) Operations or Readiness; (3) Administration, Training, or
Support; and (4) the Commander Joel Magnussen Innovation
Award for Management. Award winners are announced at
the annual Innovation Exposition. Additional information on
the Award Program, including nomination procedures, is
published in COMDINST 1650.8 (series), Captain Niels P.
Thomsen Innovation Award and is announced each year via
ALCOAST.
Questions or Comments: Questions should be directed to
COMDT (CG-095) via email to: [email protected] or through
the Innovation Council site at http://www.uscg.mil/innovation/.
103
TOOLS
As used here, ―tools‖ refers to techniques used to guide and
organize group or individual thoughts. Successful groups or
individuals must become adept at identifying the most effective
tool for a given situation.
A cornerstone of any performance improvement initiative is to
get the ideas of the people involved. People get excited about
contributing to efforts that make things better, especially when
those efforts involve their work areas or processes. The tools and
techniques presented in this section will help you:
Identify customer requirements
Generate ideas
Pare down a list of ideas
Prioritize ideas
Make decisions
Collect, display, and analyze data
Plan effectively

104
Action Planning
What is it: Often, projects evolve from meeting discussions and
decisions. Action planning helps ensure that what is decided upon
actually gets done.
How to use it:
Top section: When a decision is made at your meeting that a certain project or
task needs to be done, write the project description in the Action
Item box. Extra action planning sheets may be used for large
projects. Then, in the box What Demonstrates Completion,
identify specific outcomes. Finally, in the Champion box, write in
the name of the project manager, process owner, or person
responsible for the overall task.
Bottom section:
Continue by listing each task description in the Steps to Achieve
Desired Outcome column. Once a person is identified to
spearhead the task, that person becomes accountable for ensuring
that the task is completed and his or her name is written in the
Who column. Finally, the deadline agreed upon by all concerned
is written in the When column.
Helpful hints:
To ensure accountability, use specific names and dates.
Break work down into manageable chunks. The 80-hour
rule is a rule-of-thumb that recommends assigning chunks
that require less than 80 hours to complete.

105
WhenWhoSteps to Achieve Desired Outcome
Champion:
What demonstrates completion:
Action Item:
Action Plan
When using this approach, a good rule-of-thumb is to involve the
person responsible for completion of a given project in deciding
the Steps to Achieve Desired Outcome and When it gets done.
Also, be sure to formally document the plan and periodically
review its status with stakeholders.

106
Affinity Diagram
An affinity diagram organizes verbal information into a visual
pattern. An affinity diagram starts with specific ideas and helps
you work toward broad categories. This is the opposite of a
cause-and-effect diagram, which starts with broad effects and
works toward specific causes. Use either technique to explore all
aspects of an issue. Affinity diagrams can help you:
Organize a list of factors that contribute to a problem.
Identify areas where improvement is most needed.
How to use it:
Identify the problem. Post the problem or issue in a location
where all team members can see it.
Generate ideas. Use index cards or sticky-back notes to record
the ideas.
Cluster your ideas (on cards or paper) into related groups.
Use questions like ―Which ideas are similar?‖ and ―Is this idea
somehow connected to any others?‖ to prompt ways to group
ideas together.
Create affinity cards. For each group, create a card that has a
short statement describing the entire group of ideas.
Cluster related affinity cards. Put all of the individual ideas in
a group under their affinity card. Then group the affinity cards
under even broader groups. Continue to group the cards until
your grouping becomes too broad to have any meaning.

107
Create an affinity diagram. Post all of the ideas and affinity
cards. Draw outlines of the groups with the affinity cards at the
top of each group. The resulting hierarchical structure will give
you valuable insight into the problem.
Affinity Diagram
A publication team wanted to reduce the number of typographical
errors in their program‘s documentation. As part of a first step,
they conducted a brainstorming session that produced the
following list of factors that influenced errors.
Computers No Feedback Proofreading Skill
Lighting Typewriters Chair Height
Comfort Desk Height Time of Day
Technical Jargon Interruptions Handwriting
Grammar Slang Spelling
Draft Copy Punctuation Distribution
Font Final Copy Editing Skill
Computer Skill Typing Skill No Measurement
Printers Unreasonable
Deadlines
Noise

108
The following affinity diagram helped them to focus on areas for
further analysis.
Tips for keeping ideas flowing
Use 3x5 cards or sticky-back notes to record your ideas: This
allows you to cluster similar thoughts, eliminate duplications, and
use a ―silent‖ version of any of the techniques listed in this
section. This can be helpful when issues carry a lot of emotion.
Environment
Interruptions
Unreasonable
Deadlines
Time of Day
Ergonomics
Noise
Lighting
Desk Height
Chair Height
Comfort
Original Document
Author Skill Handwriting
Grammar
Punctuation
Spelling
Requirements
Draft Copy
Final Copy
Distribution
Font
Technical Jargon/Slang
Equipment
Computers
Printers
Typewriters
Training
Typing Skill
Editing Skill
Computer Skill
Proofreading Skill
No Definition of
Quality No Measurement
No Feedback
109
Be creative! Don‘t limit suggestions or ideas early on in
discussions. Encourage people to think creatively. Ask ―What
if?‖ and visualize the desired state if you could do anything you
wanted. Ask ―If I were the Commandant…‖
During your idea-generating sessions:
Change seats…views can be affected by where people sit
in relation to others.
Avoid cliques…encourage people to sit with those whom
they don‘t know.
Review the data or ideas periodically – encourage further
input.
Rotate groups and/or members to provide a fresh
perspective.
Make it clear you want EVERYONE to participate!
Create an open climate.
Work to develop a group consensus.
Don‘t evaluate…concentrate on getting many ideas.
HAVE FUN!
110
Brainstorming
Brainstorming is a technique, generally used in a group setting, to
quickly generate a large number of ideas about a specific problem
or topic. It can help encourage creative thinking and generate
enthusiasm, as well as avoid the ―paralysis of analysis‖ by
holding the evaluation of ideas until a group has identified
different possibilities.
How to do it:
The goal of brainstorming is to generate ideas. Before you start,
remind everyone in your group to postpone judgment until after
the brainstorming session is completed.
Post the problem or topic where all participants can see it.
Write all ideas on the board and do as little editing as
possible.
There are three different types of brainstorming techniques:
structured, unstructured, and silent. Each technique has different
pros and cons.
In structured brainstorming:
Solicit one idea from each person in sequence.
Participants who don‘t have an idea at the moment may
say ―pass.‖
Each person has an equal chance to participate, regardless
of rank or personality.
Spontaneity can be limited. It can sometimes feel rigid and
restrictive.

111
In unstructured brainstorming:
Participants simply contribute ideas as they come to mind
and can build off each other‘s ideas. The atmosphere is
very relaxed.
Less assertive or lower-ranking participants might not
contribute.
In silent brainstorming:
Participants may write ideas individually on Post-It® notes
or small slips of paper. Collect the papers and post them
for all to see.
Individuals cannot make disruptive ―analysis‖ comments
during the brainstorming session and the process provides
confidentiality. This can help prevent a group from being
overly influenced by a single participant or common flow
of ideas.
The group can lose the synergy that comes from an open
session.
An ideal approach is to combine two of these methods. For
example, begin the session with a round of silent or structured
brainstorming, then finish with an unstructured period.
The result of a brainstorming session is a list of ideas. If this list
is too long, the group can pare it down with a tool such as multi-
voting or prioritize it with a tool such as nominal group
technique.

112
Points To Remember About Brainstorming:
Never judge ideas as they are generated. The goal of
brainstorming is to generate a lot of ideas in a short time.
Analysis of these ideas is a separate process.
Don’t quit at the first lull. All brainstorming sessions reach
lulls, which are uncomfortable for the participants. Research
indicates most of the best ideas occur during the last part of a
session. Encourage the group to push through at least two or three
lulls.
Try to write down all of the ideas as they were presented.
When you condense an idea to one or two words for ease of
recording, you are doing analysis. Analysis should be done later.
Encourage outrageous ideas. While these ideas may not be
practical, they may spur a flow of creative ideas. This can help
the group break through a lull.
Try to have a diverse group. Involve process owners,
customers, and suppliers to obtain a diverse set of ideas.
After brainstorming:
Reduce your list to the most important items.
Combine items that are similar.
Discuss each item on its own merits.
Eliminate items that may not apply to original issue or
topic.
Give each person one final chance to add items.
113
Charter
A charter is a tool that can help groups:
Determine a business case for a project
Define the problem
Focus the goal
Establish project scope
Facilitate buy-in from key stakeholders
Identify project milestones, metrics, and resources
Clarify linkages to strategic and mission objectives
Identify if others are working or have worked on the
problem
Identify potential aids or barriers
There are many different styles of charters, but most have the
same basic information:
Title: Team Name – Be descriptive
Key Stakeholders: Those key individuals or constituent groups that will be
affected by or can impact the success of the project
Champion: Senior leader and project sponsor
Problem Statement: Describe what is wrong: ―The Pain‖
When and where do problems occur?
What is the size and impact of problem?
Use specific business metrics.
Would customers be happy if they know we are working
on this?
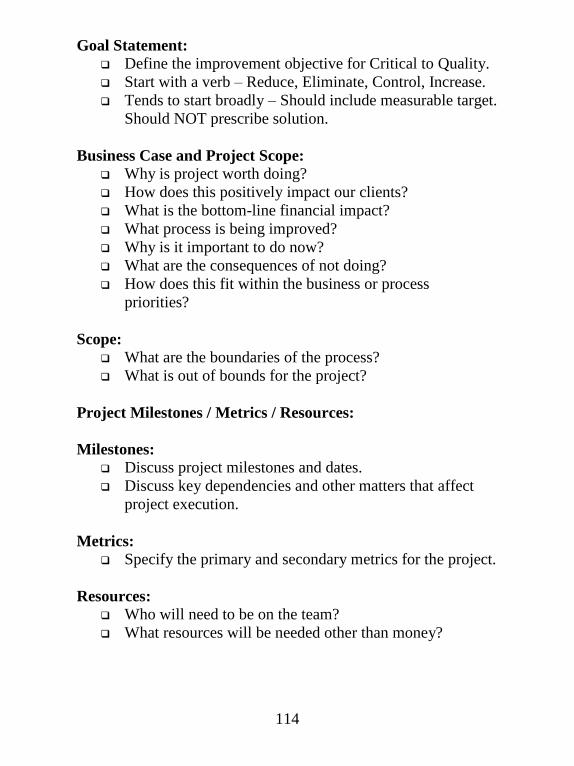
114
Goal Statement:
Define the improvement objective for Critical to Quality.
Start with a verb – Reduce, Eliminate, Control, Increase.
Tends to start broadly – Should include measurable target.
Should NOT prescribe solution.
Business Case and Project Scope: Why is project worth doing?
How does this positively impact our clients?
What is the bottom-line financial impact?
What process is being improved?
Why is it important to do now?
What are the consequences of not doing?
How does this fit within the business or process
priorities?
Scope: What are the boundaries of the process?
What is out of bounds for the project?
Project Milestones / Metrics / Resources:
Milestones:
Discuss project milestones and dates.
Discuss key dependencies and other matters that affect
project execution.
Metrics: Specify the primary and secondary metrics for the project.
Resources: Who will need to be on the team?
What resources will be needed other than money?
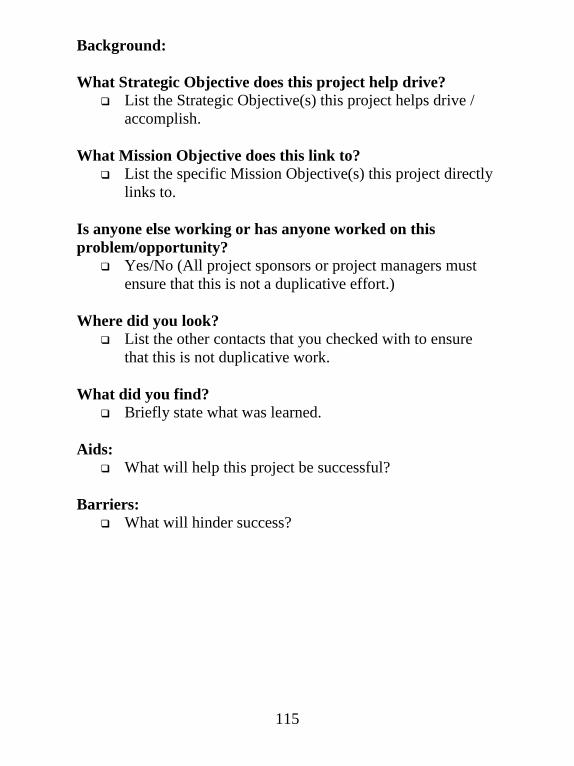
115
Background:
What Strategic Objective does this project help drive?
List the Strategic Objective(s) this project helps drive /
accomplish.
What Mission Objective does this link to?
List the specific Mission Objective(s) this project directly
links to.
Is anyone else working or has anyone worked on this
problem/opportunity?
Yes/No (All project sponsors or project managers must
ensure that this is not a duplicative effort.)
Where did you look? List the other contacts that you checked with to ensure
that this is not duplicative work.
What did you find? Briefly state what was learned.
Aids: What will help this project be successful?
Barriers: What will hinder success?

116
Cause-and-Effect Diagram
A cause-and-effect diagram graphically illustrates the
relationship between a given outcome and all the factors that
influence this outcome. Sometimes called an Ishikawa or
―fishbone‖ diagram, it helps show the relationship of the parts
(and sub-parts) to the whole by:
Determining the root causes of a problem.
Focusing on a specific issue without resorting to
complaints and irrelevant discussion.
Identifying areas where there is a lack of data.
How to use it:
Specify the problem to be analyzed. State the problem in
quantitative terms (e.g., ―50% of employee performance reviews
are not submitted on time). This helps teams avoid finger
pointing by focusing on facts rather than opinions. Place the
problem statement in a box on the right side of the diagram. Then
list the major categories of the factors that influence the effect
being studied. The ―6 Ms‖ [methods, manpower (personnel),
materials, machinery, mother nature (environment), and
measures] are commonly used as a starting point: These six
categories are six key sources of variation in any process.

117
Identify factors and sub factors. Use an idea-generating
technique to identify the factors and sub-factors within each
major category. An easy way to begin is to use the major
categories as a catalyst. For example, ―What methods are
causing…?‖ Keep asking why to flush out root causes.
Identify significant factors. Look for factors that appear
repeatedly or have a significant effect according to data available.
A sub-factor may be the root cause of all your problems. You
may also decide to collect more data on a factor that had not been
previously identified.
Effect
Methods Manpower
Mother Nature Materials Measures
Machinery
Effect
Methods Manpower
Mother Nature Materials Measures
Machinery

118
Check Sheet
A check sheet is a form you can use to collect data in an
organized manner and convert it into readily useful information
like Pareto charts or histograms. With a check sheet, you can:
Collect data with minimal effort.
Convert raw data into useful information.
Translate opinions of what is happening into what is
actually happening. In other words, ―I think the problem
is…‖ becomes ―The data says the problem is….‖
How to use it:
Clearly identify what is being observed. The events being
observed should be clearly labeled. Everyone has to be looking
for the same thing.
Keep the data collection process as easy as possible.
Collecting data should not become a job in and of itself. Look
for the easiest approach; simple check marks are easy.
Group the data. Collected data should be grouped in a way that
makes the data valuable and reliable. Similar problems must be
in similar groups.
Be creative. Try to create a format that will give you the most
information with the least amount of effort.
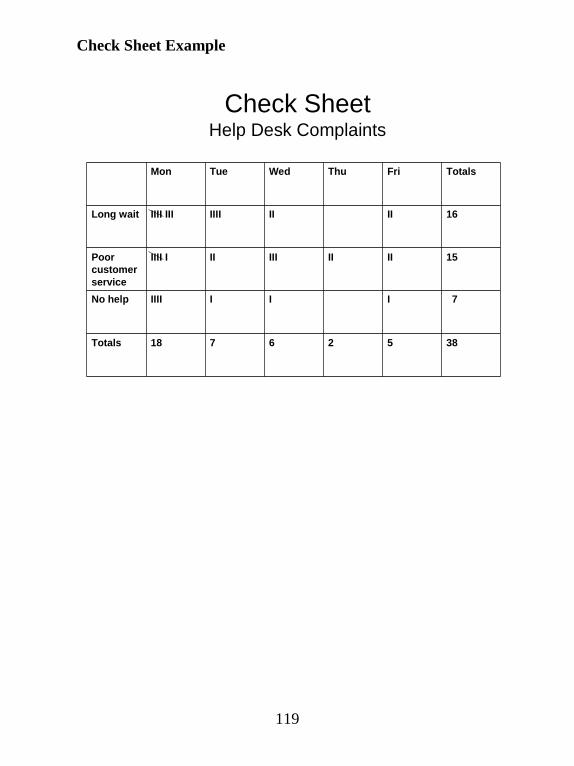
119
Check Sheet Example
Check SheetHelp Desk Complaints
7IIIIIIINo help
2
II
Thu
3856718Totals
15IIIIIIIIIII IPoor
customer
service
16IIIIIIIIIIII IIILong wait
TotalsFriWedTueMon

120
Consensus Cards
Consensus cards allow team leaders, facilitators, and group
members to visually see where the group stands on an issue; help
a group examine all viewpoints; and keep the group focused.
How to use them:
Simply buy enough four-color packs of 3 X 5‖ recipe cards so
that each person gets one card of each color. Typically, the cards
come in green, yellow, red, and either blue or purple. Assign uses
to each color as listed in the table below.
Consensus Cards
Color Use
Green Agree, ―I can support this.‖
Yellow Unsure or need more information
Red Disagree, ―I can‘t support this.‖
Blue or Purple Wildcard, use for breaks or when
groups are beating a dead horse.
Ask group members to weigh in on an issue by holding up a
green, yellow, or red card, as appropriate. Require that all
members hold up a card. This ensures that those who are on the
fence make a choice.
A good approach is to allow the minority, which will often hold
yellow or red cards, to voice their perspective. Explore the
reasons that they are unsure or disagree with the issue. Allowing
the minority to state their viewpoint may help the group develop
a solution that is inclusive of many perspectives and avoid
groupthink. A key facilitative question to ask is ―What concern, if
addressed, would cause you to change your yellow vote to green
or red vote to yellow?‖
121
The Wildcard
Using a wildcard, such as a blue or purple card, can remind
groups that they are overdue for a break or signal the group that
the discussion is heading into the weeds.
Often a timekeeper will keep track of agreed-upon breaks. (An
often-used rule-of-thumb is ten minutes of break for every fifty
minutes of meeting.) Sometimes, however, the group will get
engaged and forget the time. A blue or purple card can serve as a
reminder to take time to recharge.
When used as a ―don‘t beat a dead horse‖ card, the blue or purple
card can signal that it‘s time to move on. A good approach is to
let the person talking finish their thought, then ask the group if
the issue has been sufficiently addressed, needs to be discussed
further, or put in the parking lot.

122
Contingency Diagram
The contingency diagram is a way to capitalize on negative
thought. It helps leaders consider all the potential negative
―contingencies‖ of a future goal or program. Also, by thinking of
all the ways a problem can get worse or continue unchecked, a
group can develop an action plan to overcome any barriers.
How to use it:
Step 1. Place a goal or problem in the center circle.
Step 2. Draw lines outward from the circle and brainstorm:
o What will cause this situation to get worse or
continue?
o What will prevent (or sabotage) your desired state?
Implementnew dutyschedule
Large number of
leave requests
Gaps between departing
and arriving personnel
Surge o
peratio
ns
Lack of qualified
people
Over-tasking of
personnel during
break-in period
Emergent situations
Po
or
sch
ed
ule
ma
nag
em
en
t
TDY a
ssig
nmen
ts
Step 3. Formulate a plan with specific actions to prevent these
obstacles.
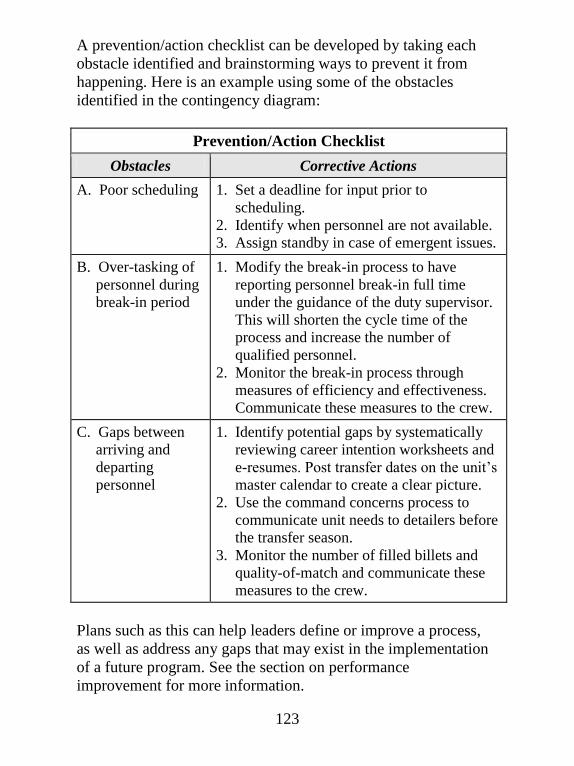
123
A prevention/action checklist can be developed by taking each
obstacle identified and brainstorming ways to prevent it from
happening. Here is an example using some of the obstacles
identified in the contingency diagram:
Prevention/Action Checklist
Obstacles Corrective Actions
A. Poor scheduling 1. Set a deadline for input prior to
scheduling.
2. Identify when personnel are not available.
3. Assign standby in case of emergent issues.
B. Over-tasking of
personnel during
break-in period
1. Modify the break-in process to have
reporting personnel break-in full time
under the guidance of the duty supervisor.
This will shorten the cycle time of the
process and increase the number of
qualified personnel.
2. Monitor the break-in process through
measures of efficiency and effectiveness.
Communicate these measures to the crew.
C. Gaps between
arriving and
departing
personnel
1. Identify potential gaps by systematically
reviewing career intention worksheets and
e-resumes. Post transfer dates on the unit‘s
master calendar to create a clear picture.
2. Use the command concerns process to
communicate unit needs to detailers before
the transfer season.
3. Monitor the number of filled billets and
quality-of-match and communicate these
measures to the crew.
Plans such as this can help leaders define or improve a process,
as well as address any gaps that may exist in the implementation
of a future program. See the section on performance
improvement for more information.
124
Control Charts
Control charts are the next step from run charts; they help users
determine if a process is in Statistical Process Control (SPC).
Control charts use mathematically derived upper and lower
control limits. Statistically, 99.73% of all stable process results
fall between these limits. Control charts show unwanted process
changes that appear as abnormal points on a chart. The process is
said to be in ―statistical control‖ when the data vary randomly
within the upper and lower control limits.
Control limits are not tolerance or specification limits; rather,
they are mathematical functions of how a process actually
performs. Thus, it is possible for a process to be in statistical
control but operate outside tolerance.
The control chart type you use depends on the type of data you
collect. There are several types of control charts; each has an
appropriate use and inherent strengths and weaknesses. Control
chart selection is beyond the scope of the PIG; however, the
X-Bar chart on the next page is an example of the most
commonly used chart and shows individual process outputs.
The chart, with upper and lower limits, shows that the (fictitious)
maximum time to get underway is 21 minutes—within the upper
limit. However, it is probable that this process will generate a
result that is unsatisfactory to USCG standards. To prevent such
an occurrence, this cutter would need to change its process.
While the most common sign of special cause variation is having
a single point above or below the upper and lower control limits,
there are other indicators. These observations indicate the
presence of special cause variation:
1 or more points outside the control limits.
7 or more consecutive points on one side of the centerline.
6 points in a row steadily increasing or decreasing.
14 points alternating up and down.

125
Special cause variation should be investigated and the cause
removed if possible; however, process redesign is not required if
the process is stable and within acceptable limits (standards).
Treating special cause variation as common cause variation, and
vice versa, can have disastrous effects on performance results.
The below chart shows the launch times for this unit have not
been affected to date by special cause variation.
Patrol Boat Launch Time
0
5
10
15
20
25
1 4 7 10 13 16 19 22 25 28Occurrences
Min
ute
s
Cycle Time
Average
UCL
LCL
This chart shows the Coast Guard maximum limit is inside the
control limits. It is likely this process will eventually produce a
result that is unacceptable. Process redesign may be in order.
Patrol Boat Launch Time
0
5
10
15
20
25
1 4 7 10 13 16 19 22 25 28
Occurrences
Min
ute
s
Cycle Time
Average
UCL
LCL
CG Standard

126
Critical-to-Quality Tree
A critical-to-quality (CTQ) tree enables you to take a ―soft‖
customer need and break it down into more tangible customer
requirements.
How to use it:
Begin with an overall customer need. Examples of needs are on-
time delivery, good customer service, or as illustrated below,
effective search-and-rescue response. Then identify the key
drivers that support your unit‘s ability to supply that need.
Finally, identify the metrics that allow you to measure how well
those drivers are performing. Use ―hard‖ numbers such as wait
time or number of defects over ―soft‖ measures such as customer
satisfaction survey response indicators. CTQ measures often
provide input to a unit or workgroup‘s strategic planning process
and can be used to drive process improvement projects.
Voice of the Customer,
Critical-to-Quality (CTQ) Tree
Effective
SAR
response
Boat crew
training
Maintenance
Need
Drivers % required
training
completed
CTQs
% underway
on time
Location
information
% of systems
operational
% successful
location of
vessel

127
Customer Alignment Questions
Customer alignment questions generate information about how
well your processes meet your customer‘s needs. To establish
some agreed-upon performance requirements, ask these four
questions:
What do you need from me?
What do you do with what I give you?
What are the gaps between what I provide and what you
need?
What do I give you that you do not want or need?
How to use them:
These questions will allow you to discover what your customer‘s
needs, wants, and expectations may be for the service, product, or
information you are supplying. By understanding how your
customer is using your output, you can better align your process
capabilities with what your customer wants. Knowing if there are
gaps and what the impacts of those gaps are can provide
improvement opportunities. Asking a customer what they don't
want or need can help you reduce unnecessary work.
Once you obtain this information, you may want to establish a
baseline to better determine which direction to take. You may
also establish a formal, repetitive feedback system if it will help
in continuous process improvement.

128
Customer Requirements Matrix
A customer requirements matrix can help suppliers identify the
characteristics of a product or service that drive customer
satisfaction and evaluate opportunities for improvement.
How to use it:
Begin by identifying quality characteristics—key requirements of
a product or service as defined by the customer. Then, ask the
customer to rate the importance and performance of each quality
characteristic. Performance is a rating of how well you are doing
as a supplier (see below example). Armed with knowledge in
these areas, you can calculate the gaps in performance, and then
multiply importance and the performance gap to identify
opportunities for improvement.
Voice of the Customer,
Customer Requirements Matrix
10235Hot food
1
1
2
4
Gap
242Appearance of physical
facilities
444Cleanliness
633Friendly service
2015Healthy food choices
TotalPerformanceImportanceQuality Characteristic
ISC Anywhere Dining Facility:
Importance: 5 = very important, 1 = not very important
Performance: 5 = excellent, 1 = poor
Gap = top performance rating – performance rating
Total = importance x gap
129
Decision Matrix
A decision matrix, or prioritization matrix, is used for selecting
one option from several possibilities. It involves selecting criteria
by which the items will be judged and using them to make an
acceptable decision. It can be used to choose a single problem or
solution from a list.
How to use it:
Generate a list of options using an idea-generation tool, then pare
the list down to a manageable few.
Choose criteria. Once the list of criteria is generated, the team
needs to discuss and refine the list to the five or six that the team
believes are the most important. Often-used criteria include:
Effectiveness
Feasibility
Capability
Time requirements
Cost
Enthusiasm (of the team and of others)
Weight the Criteria. After the criteria are identified, the team
assigns a relative weight to each criterion based on how
important that criterion is to the situation. There are different
ways the solutions can be graded against the criteria. One way is
to answer with a yes/no, but problems might arise if two different
solutions receive the same number of yes/no votes.
Another way is to rate the criteria on a scale in relation to each of
the options. The option with the highest, or lowest depending on
the scale used, point total might be the option the group decides
to focus on first.

130
Draw a grid. Create the grid with the criteria across the top and
the options along the left side.
Decision Matrix Example
Criteria #1
(weight
value)
Criteria #2
(weight
value)
Criteria #3
(weight
value)
Score
Solution
#1
Solution
#2
Solution
#3
Evaluate Choices. Evaluate each choice against the criteria.
Calculate Weight Values. Multiply each choice‘s rating by the
weight. As Nancy Tague states in her book The Quality Toolbox,
―The choice with the highest score will not necessarily be the one
to choose, but the relative scores can generate meaningful
discussion and lead the team toward consensus.‖

131
Flowchart
A flowchart is a graphic representation of the major steps of a
process. It can help you:
Understand the complete process.
Identify the critical stages of a process.
Locate problem areas.
Show relationships between different steps in a process.
How to use it:
Identify the process. Define the start point and finish point for
the process to be examined. It is sometimes helpful to refer back
to the SIPOC model to do this on a macro level.
Describe the current process. Lay out all the process steps
from beginning to end. Use the symbols shown on the next page
to improve clarity.
(Optional) Chart the ideal process. Try to identify the easiest
and most efficient way to go from the start block to the finish
block. While this step isn‘t absolutely necessary, it makes the
next step easier.
Search for improvement opportunities. Identify the areas that
hinder your process or add little or no value. If you did the
optional step, examine all areas that differ from your ideal
process and question why they exist. Consider measures of
effectiveness and efficiency.
Update your chart. Build a new flowchart that corrects the
problems you identified in the previous step.

132
Helpful hint:
Put the steps of your process on index cards or sticky notes. This
lets you rearrange the diagram without erasing and redrawing.
Note: It is sometimes more efficient for the group to develop the
major elements of the process than for an individual or sub-group
to create a more detailed and aesthetically pleasing flowchart.
These are standard flowchart symbols:
This
symbol... Represents… Some examples are…
Start/Stop
Receive trouble report
Receive input from supplier
Decision Point
Approve / Disapprove
Accept / Reject
Yes / No
Activity Drop off travel voucher
Open access panel
Document Fill out a trouble report
Connector (to
another page or part
of diagram.)
Database Coast Guard Business Intelligence
(CGBI)
A
B
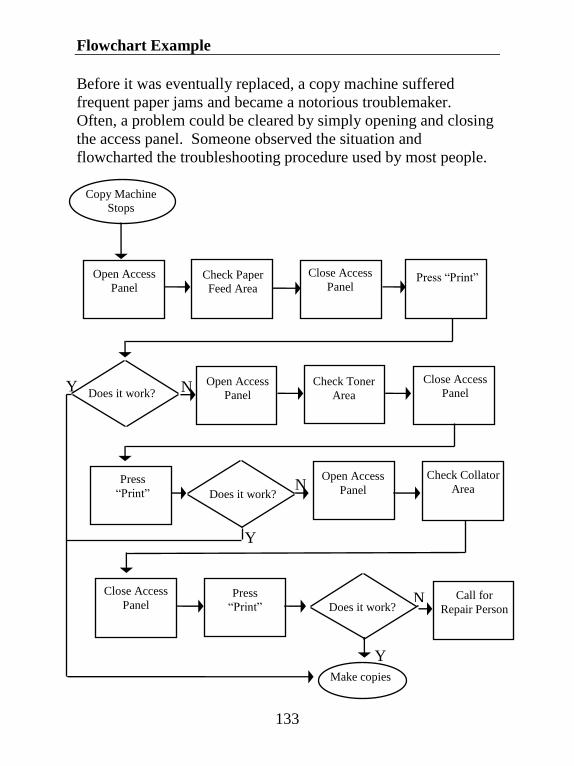
133
Flowchart Example
Before it was eventually replaced, a copy machine suffered
frequent paper jams and became a notorious troublemaker.
Often, a problem could be cleared by simply opening and closing
the access panel. Someone observed the situation and
flowcharted the troubleshooting procedure used by most people.
Copy Machine
Stops
Open Access
Panel Check Paper
Feed Area
Close Access
Panel Press ―Print‖
Does it work? Y N Open Access
Panel
Check Toner
Area
Close Access
Panel
Press
―Print‖ Does it work? N
Y
Open Access
Panel
Check Collator
Area
Close Access
Panel Press
―Print‖ Does it work? N
Y
Call for
Repair Person
Make copies

134
Force Field Analysis
Force field analysis helps identify key forces that promote or
hinder the solution of a problem or the achievement of a goal.
How to use it:
Define the objective. Place the problem or goal to be analyzed
in the upper right corner of the chart.
List the forces. List the key factors that promote or hinder the
achievement or your goal or the resolution of your problem.
Groups should use an idea-generation technique. Use two lists:
one for promoting forces and one for hindering forces.
Prioritize. Prioritize the forces in each list according to their
relative impact on the problem or goal. You can use nominal
group technique or some other decision-making tool.
Implement. Create an action plan to minimize the key hindering
forces and maximize the promoting ones.
Force Field Analysis Example:
• Unit support
• ESO support
• Tuition assistance
• Family support
• Credit for military
experience & courses
• Job responsibilities
• Operational tempo
• Hard to study at home
• Family responsibilities
• Poor study habits
Goal: Get a College Degree
Promoting Restraining

135
Gantt Chart
A Gantt Chart depicts an overall project timeline, lists tasks
required for project completion, and visually illustrates task
dependencies. Project managers often include other key
information such as task responsibilities (who is responsible for
task completion) and resource requirements.
How to use it:
Begin by identifying the work that must be accomplished. Once
the work is listed, plot the time required for each task. Be sure to
note which tasks are dependent on others, and if the required
resources are available at that time. The overall plot can help
managers determine the total project time required and monitor
task completion.

136
Histogram
A histogram is a bar graph that shows the central tendency and
variability of a data set. Histograms are sometimes referred to as
frequency distributions. A histogram can help you:
Understand the variability of a process.
Quickly and easily determine the underlying distribution
of a process.
How to use it:
Determine the type of data you want to collect. Be sure that
the data is measurable (for example, time, length, speed, etc.).
Collect the data. Collect as many measurable data points as
possible. Collect data on one parameter at a time. Check sheets
may be used, but are not the only way to collect data for a
histogram.
Count the total number of points you have collected.
Determine the number of intervals required. Use this table to
determine how many intervals (or bars) the graph should have.
If you have this #
of data points…
Then use this #
of intervals
less than 50 5 - 7
50 - 99 6-10
100 - 249 7 - 12
More than 250 10 - 20
Determine the range. Subtract the smallest value in the data set
from the largest. This value is the range of your data set.

137
Determine the interval width. Divide the range by the number
of intervals. Round up your answers to a convenient value. For
example, if the range of the data is 17 and you have decided to
use 9 intervals, then your interval width is 1.88. You can round
this to 1.9 or 2.0. It is helpful to have intervals defined to one
more decimal place than the data collected.
Determine the starting point of each interval. Use the smallest
data point value as the first interval starting point. The starting
point for the second interval is the sum of the smallest data point
plus the interval width. For example, if your smallest data point
is 10 and the interval width is 2, then the starting point for the
second interval is 12. Label intervals along the horizontal axis.
Plot the data. Count the number of data points that fall within
each interval and plot this frequency on the histogram. Keep in
mind that each data point can appear in only one interval. For
example, if your first interval begins with 10.0 and the second
with 12.0, then all data points that are equal to or greater than
10.0 and still less than 12.0 are counted in the first interval.
Points to remember:
Each data point appears in one and only one interval.
The number of intervals can influence the pattern your
data will take.
Don‘t expect the histogram to be a perfect bell curve;
variations will occur. Ask yourself if the picture is
reasonable and logical. And be careful not to let your
preconceived ideas influence your decision unfairly.

138
Histogram Example
The weights of 80 Coast Guard members are laid out in this table:
208
155
159
153
115
159
150
127
145
190
130
165
147
189
139
175
180
180
171
181
156
109
206
130
150
200
128
187
150
163
149
189
159
165
141
180
173
179
166
172
156
208
155
159
201
150
185
150
163
149
190
137
165
145
188
180
171
169
185
178
128
158
129
201
159
127
159
161
191
144
165
147
189
139
166
169
170
180
169
175
The points are distributed on a histogram as follows:
20-
15-
10-
5-
0-
# of
people
109 121.4 133.8 146.2 158.6 171.0 183.4 195.8
Weight (lbs.)
80 data points--8 Intervals
Range= 208-109=99
Interval width=99/8=12.375 ( or12.4)
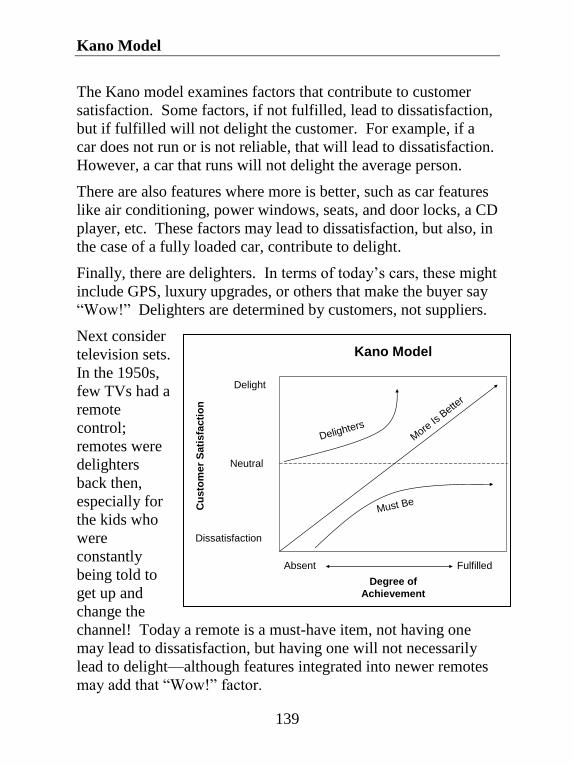
139
Delighters
Must Be
More
Is B
etter
Absent Fulfilled
Degree of
Achievement
Delight
Neutral
Dissatisfaction
Cu
sto
mer
Sati
sfa
cti
on
Kano Model
Kano Model
The Kano model examines factors that contribute to customer
satisfaction. Some factors, if not fulfilled, lead to dissatisfaction,
but if fulfilled will not delight the customer. For example, if a
car does not run or is not reliable, that will lead to dissatisfaction.
However, a car that runs will not delight the average person.
There are also features where more is better, such as car features
like air conditioning, power windows, seats, and door locks, a CD
player, etc. These factors may lead to dissatisfaction, but also, in
the case of a fully loaded car, contribute to delight.
Finally, there are delighters. In terms of today‘s cars, these might
include GPS, luxury upgrades, or others that make the buyer say
―Wow!‖ Delighters are determined by customers, not suppliers.
Next consider
television sets.
In the 1950s,
few TVs had a
remote
control;
remotes were
delighters
back then,
especially for
the kids who
were
constantly
being told to
get up and
change the
channel! Today a remote is a must-have item, not having one
may lead to dissatisfaction, but having one will not necessarily
lead to delight—although features integrated into newer remotes
may add that ―Wow!‖ factor.

140
Multi-Voting
Multi-voting is a way for a group to determine which items in a
list are most important. This technique helps you:
Pare down a larger list into a manageable few
Separate the vital few items from the important many
How to use it:
Combine like items. This prevents the splitting of votes for
essentially the same thing.
Letter the choices. This makes tabulating the votes easier.
Use the half-and-half rule. Each person gets a number of votes
equal to approximately half the number of items on the list (10
votes for a 20-item list). Then each person gets up to half the
number of votes to place on any one item (if each person has 10
votes, then the maximum number they can assign to one item is
five).
Vote. Have each member vote privately on a slip of paper for the
items they believe have high priority.
Compile the votes given to each item. If planning is done
beforehand, this can be time for a group break! You could put a
mark beside each item for every vote it receives.
Reduce the list. Highlight the items that received the most
votes.
Helpful hints: Multi-voting is best suited for larger groups and
long lists. Its simplicity makes it quick and easy to use. Be sure to
get consensus on the final results. This is not a final decision-
making tool!

141
Multi-Voting Example
District staff elements attended a lot of meetings at different
locations around their district. They complained because
meetings conducted at these locations were not always as
productive as they might have been. The Chief of Staff called a
meeting to improve the situation. A brainstorming session
produced the following list of reasons for unproductive meetings:
List of Reasons for Unproductive Meetings
A. No agendas
B. No clear objectives
C. Going on tangents
D. Too much time
E. Too much protocol/politics
F. Wrong people
G. Not enough data provided before meeting
H. No administrative support
I. Roles of participants not clear
To reduce this list to a manageable size, each member was given
five votes (approximately half of the total number of items). Each
member was allowed to assign a maximum of three votes to any
one item.
The problems received the following votes:
A. //// F. /////
B. // G. ///// /////
C. /// H. //
D. ///// ///// I. ///// ///
E. ///
The group then decided to focus on problems D, G, and I.

142
Nominal Group Technique
Nominal group technique is a structured method to prioritize
items in a list. This method uses priorities of each group member
to discover the overall priorities of the group. Nominal group
technique helps you:
Prioritize a list of ideas.
Make decisions using inputs from all participants.
How to use it:
Assign a letter to each idea. For example, for seven ideas, you
would assign the letters A through G.
List the letters. Have each person in the group write the
assigned letters on a piece of paper.
Prioritize the lists. Have each person prioritize their list by
writing a number beside each letter. If there are seven ideas, then
―1‖ is written beside the letter corresponding to the most
important idea. This is repeated for each number until ―7‖ is
written beside the letter corresponding to the least important idea.
Each number (1 though 7) is used only once by each group
member.
Compute the group total for each letter. The letter with the
lowest score is the idea with the highest priority, and the letter
with the highest score has the lowest priority.

143
Nominal Group Technique Example
The following office problems were identified in a brainstorming
session:
A. Ineffective organizational structure
B. Poor communications outside the office
C. Lack of training
D. Poor communications within the office
E. Unclear mission and objectives
F. Poor distribution of office mail
G. Lack of feedback on reports on management
Each group member then wrote the letters A through G on a piece
of paper and prioritized each problem from 1 to 7 (lowest to
highest), using each number only once. The results were
summarized as follows:
Person
Problem 1 2 3 4 5 Total Priority
A 6 5 7 5 6 29 2
B 3 2 4 1 3 13 5
C 1 1 2 2 2 8 7 Highest Priority
D 4 4 5 6 4 23 4
E 7 7 6 7 5 32 1 Lowest Priority
F 2 3 1 3 1 10 6
G 5 6 3 4 7 25 3

144
Pareto Chart
Pareto charts are bar charts used to separate the vital few from the
trivial many. The Pareto Principle is a rule-of-thumb, which
states that: ―20 percent of the problems have 80 percent of the
impact.‖ The 20 percent of the problems are the ―vital few‖ and
the remaining problems are the ―trivial many.‖ A Pareto chart can
help:
Separate the few major problems from the many possible
problems so you can focus your improvement efforts.
Arrange data according to priority or importance.
Determine which problems are most important using data,
not perceptions.
How to use it:
Use existing metrics or collect new data on the process. Be
sure the units of measure are consistent throughout your data.
Select attributes to be charted so that any given occurrence will
fall into one AND ONLY ONE category. Check sheets are great
sources of data for building a Pareto.
Label the chart. Label the units of measure on the left vertical
axis and the categories of problems on the horizontal axis.
Plot the data. Order the categories according to their frequency,
not their classification. Use a descending order from left to right.
Categories that appear infrequently, or in comparatively small
numbers, can be grouped together in an ―Other‖ category.
Optional. You can place a line that represents a cumulative total
above the bars along with a percentage scale along the right
vertical axis.

145
Points to remember:
Determine which type of measure is most important ($, #,
%, etc.) and clearly mark these units on the chart.
Order categories from left to right, in descending order, to
highlight impact.
If the ―Other‖ category accounts for more than 25% of the
problem, a good rule-of-thumb is to break it down.
Pareto Chart Example:
Billeting Complaints
0
10
20
30
40
50
60
Not clean Temperature Maintenance Furnishings External noise Other
Problem Type
Nu
mb
er
of
Tim
es
Pro
ble
m O
cc
ure
d
0
0.1
0.2
0.3
0.4
0.5
0.6
0.7
0.8
0.9
1
Pe
rce
nt
Data Pareto
Progressive Analysis. Progressive analysis takes one category
from the Pareto chart and breaks it down into its subparts,
progressing from the general classifications to the specific. It is
used when the category has many subparts to it that might be
affecting it. The resulting bar graph is a Pareto chart which can
then be broken down even further.

146
Project Requirements Table
A project requirements table can help prioritize tasks in terms of
musts, wants, and nice-to-have items and establish project scope.
How to use it:
Simply list the project customer requirements in the ―musts‖
column and deliverables that the customer wants, but are not
requirements, in the ―wants‖ column. Then, list items that would
delight the customer in the ―nice‖ column. Customer
requirements, as well as time and resource constraints, will help
guide project scope.
Below is a sample, completed Project Requirements Table:
Project: Build Storage Facility
Musts Wants Nice
5,000 sq. ft.
Secure access
Separate unit
storage cages
Heavy-duty
shelving
Large garage
door
Energy-efficient
lighting
Fire equipment
Air conditioning
Garage door
opener
Water fountain
Finished interior
Light sensors

147
Project Responsibility Matrix
A project responsibility matrix can help project managers
coordinate the completion of tasks.
How to use it:
List all tasks for the project under the tasks column. If necessary,
use additional sheets. Typically, project managers will assign the
same letter or number used to identify tasks from a work
breakdown structure (WBS) or other planning tool. Then list the
project team members or other individuals that will complete or
support the completion of each task under the project contributors
heading. Consider also those individuals that must be notified
prior to task start. To fill out the matrix, assign the appropriate
task responsibilities to each person.
The example below depicts typical headings and values.
Completion Date:Revision Date:Project:
Tasks:
Project Contributors:Manager:
Responsibility: 1 = Key Role, 2 = Support Role, 3 = Must Notify

148
Run Chart
Also called a trend chart, a run chart is a graph that shows the
changes in a process measure over time. It can help you:
Recognize patterns of performance in a process.
Document changes over time.
How to use it:
Construct the chart. Label the vertical axis with the key
measurement of the process being measured.
Collect the data. Collect data for an appropriate number of time
periods, in accordance with your data collection strategy.
Plot the data. Plot each data point on the chart. Calculate and
plot the average. This provides a reference for drawing
conclusions about individual data points.
Interpret the chart. Use your knowledge of the process.
Patrol Boat Launch Time
0
5
10
15
20
25
1 3 5 7 9 11 13 15 17 19 21 23 25 27 29
Occurrences
Min
ute
s
Cycle Time
Average
Step 1: Construct the chart. In this case, the unit is looking at
its launch time in minutes.
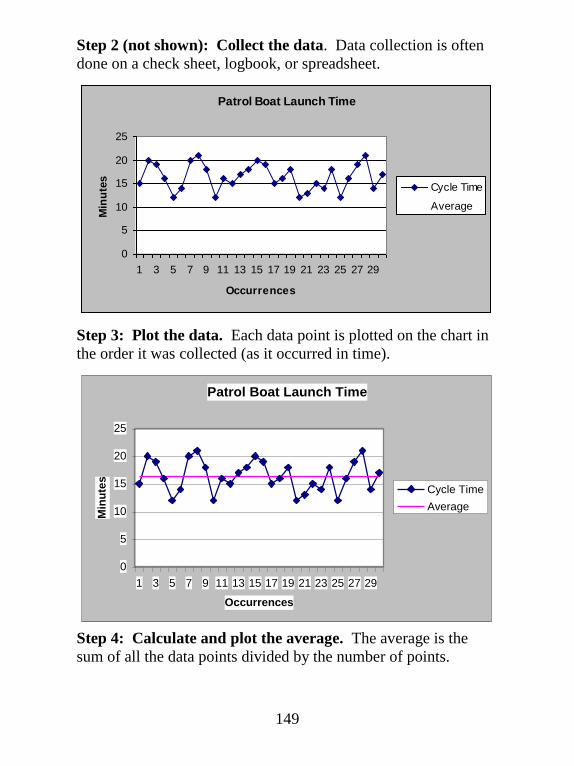
149
Step 2 (not shown): Collect the data. Data collection is often
done on a check sheet, logbook, or spreadsheet.
Patrol Boat Launch Time
0
5
10
15
20
25
1 3 5 7 9 11 13 15 17 19 21 23 25 27 29
Occurrences
Min
ute
s
Cycle Time
Average
Step 3: Plot the data. Each data point is plotted on the chart in
the order it was collected (as it occurred in time).
Patrol Boat Launch Time
0
5
10
15
20
25
1 3 5 7 9 11 13 15 17 19 21 23 25 27 29
Occurrences
Min
ute
s
Cycle Time
Average
Step 4: Calculate and plot the average. The average is the
sum of all the data points divided by the number of points.

150
Step 5: Interpret the chart. In order to properly interpret your
data, there are a few things you must know.
First, how was the data collected? Was it collected specifically
for your purpose or as the byproduct of some other process?
What emphasis was given to this data collection effort? Was it
verified by a second collection method or source? These
questions are important for data integrity. The closer your data is
to reality, the better the analysis.
Second, you need to know if the process you are measuring is
stable. In other words, did the same process generate all of your
data? When multiple people accomplish the same objective, they
often use different processes. If this is the case, your data will
not be a true reflection of a single organizational process and
your analysis may be affected as a result. Another example how
a change process can be used to create a data set is initiating a
process improvement effort. If, during the data collection, you
alter the process (installing new machines or improving existing
techniques), your data will need to be divided as shown on the
following page.
A stable process will generate different values; this difference is
called variation. Common cause variation is the difference in
numbers generated by a stable process. Special cause variation
generates a value outside of the normal range of numbers and
will be discussed later.
If the data integrity is satisfactory and the data-generation process
was/is systematic and repeatable, it is time to interpret the chart.

151
To begin, look for signs that the process has significantly
changed. There are three basic ways to do this:
Six points in a row that steadily increase or decrease.
Nine points in a row on the same side of the average.
Significant shifts in levels, cyclical patterns, and bunching
of data points.
If any of these can be seen on your chart, explore what happened
to your process to cause the change. Positive changes should be
documented and institutionalized. Negative changes should be
analyzed and their root causes corrected.
Next, identify the range within the data set. Is the difference
between the highest and lowest points on the chart acceptable?
Even if the chart shows only a few points too high or too low,
you may need to improve or redesign the process. If the range is
acceptable and the process is stable, there should be no need to
change your system.
Weight per Week
195
200
205
210
215
220
225
230
1 3 5 7 9
11 13 15 17 19
Week
We
igh
t (L
bs)
Weight
Average

152
The above chart shows more than nine points above the average
line indicating a change in the process. Root cause: In week 11,
the individual measured on this chart began training for a
marathon (a different process).
Weight per Week
195
200
205
210
215
220
225
230
1 3 5 7 9
11
13
15
17
19
Week
Weig
ht
(Lb
s)
Weight
Average 1-10
Average 11-20
A more descriptive way to display the data might be to separate
the stable process from the new process and assign each its own
average. You should expect to see the second average drop as the
new process stabilizes.
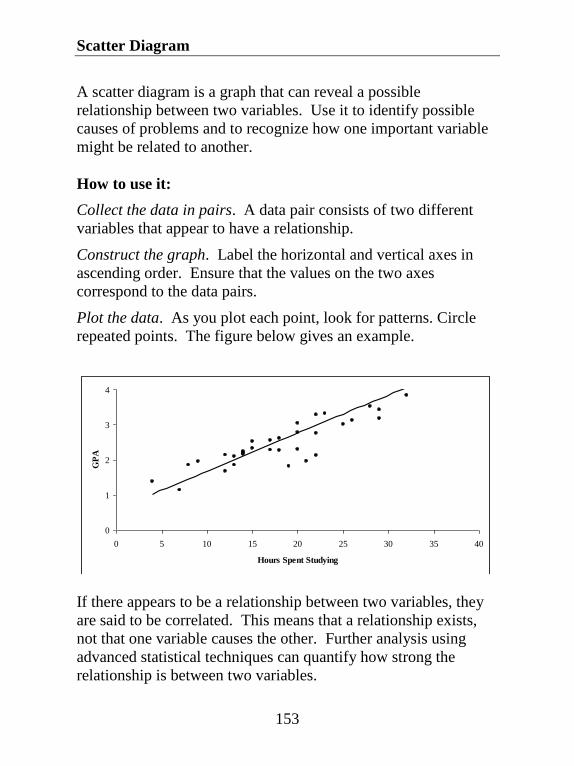
153
Scatter Diagram
A scatter diagram is a graph that can reveal a possible
relationship between two variables. Use it to identify possible
causes of problems and to recognize how one important variable
might be related to another.
How to use it:
Collect the data in pairs. A data pair consists of two different
variables that appear to have a relationship.
Construct the graph. Label the horizontal and vertical axes in
ascending order. Ensure that the values on the two axes
correspond to the data pairs.
Plot the data. As you plot each point, look for patterns. Circle
repeated points. The figure below gives an example.
0
1
2
3
4
0 5 10 15 20 25 30 35 40
Hours Spent Studying
GP
A
If there appears to be a relationship between two variables, they
are said to be correlated. This means that a relationship exists,
not that one variable causes the other. Further analysis using
advanced statistical techniques can quantify how strong the
relationship is between two variables.

154
SIPOC
SIPOC is shorthand for Supplier, Input, Process, Output, and
Customer. It enables a group to identify customer requirements
and factors that affect a given process.
How to use it:
Begin by describing the process you wish to examine in verb-
noun format. For example: conduct boarding, fix equipment, or
fill prescription. Next, create a high-level flow chart of the
process. A good rule-of-thumb is to identify about 5-7 steps.
A flow chart can help you visualize how inputs are transformed
into outputs. Then list outputs; identify customers, customer
segments, or stakeholders that receive each output; list inputs;
and identify suppliers that provide each input.
SIPOC
CustomerProcess OutputInputSupplier
Rebuild
Engine
Rebuilt
Engine
CoxswainMechanic
Repair
Parts
Equipment
Manual
Diagnostic
Equipment
Tools
MK School
Supply
Manufacturers
155
A SIPOC can help you identify and address sources of variation
which affect outputs and, ultimately, the customer. Variation is
present in all processes. It comes from the inputs to the process
and is also generated within the process itself. When identifying
inputs to the process, it helps to consider the ―6 Ms‖—methods,
manpower (personnel), materials, machinery, Mother Nature
(environment), and measures—are six key sources of variation.
If, during an analysis of a process, you find that an input is a root
cause of the problem, you must work with the associated supplier
to correct the problem.
Measures of efficiency and effectiveness can you help monitor
process health. See the section on performance measures for
more information.

156
Stakeholder Analysis
Use a stakeholder analysis to identify stakeholders and potential
risks during any project that involves change.
How to use it:
1. Plot where individuals currently are with regard to desired
change ( = current).
2. Plot where individuals need to be (X = desired) in order to
successfully accomplish desired change—identify gaps
between current and desired.
3. Indicate how individuals are linked to each other; draw
lines to indicate an influence link using an arrow ( ) to
indicate who influences whom.
4. Plan action steps for closing gaps.

157
SWOT Analysis
SWOT Analysis is a method of performing an environmental
scan that is often used as an input to a strategic or project plan. It
allows a group to capitalize on their strengths, identify
weaknesses, take advantage of opportunities, and identify threats.
SWOT Analysis
Strengths OpportunitiesWeaknesses Threats
SWOT analyses take both an internal and external view. The
strengths and weaknesses categories are looked at from an
internal perspective (internal to the group or unit), while the
opportunities and threats categories are looked at from an
external perspective (external to the group or unit).
How to use it:
Two common methods for conducting a SWOT analysis are
silent brainstorming and round-robin.
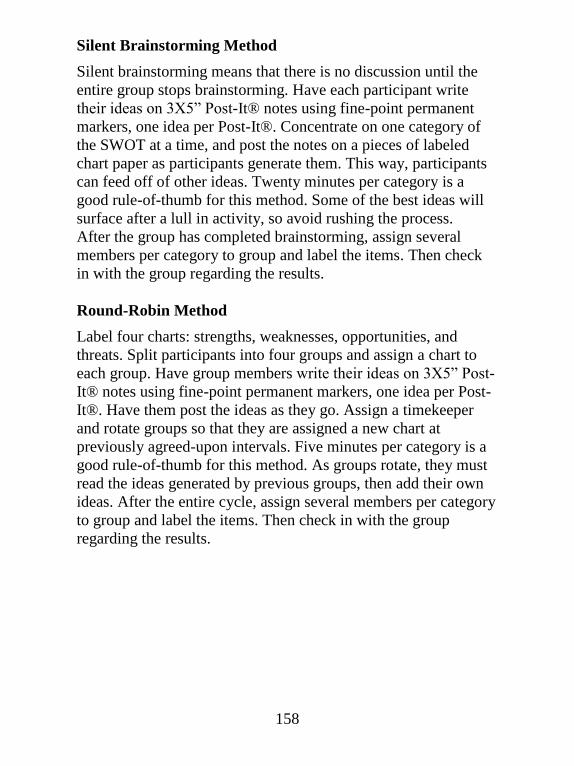
158
Silent Brainstorming Method
Silent brainstorming means that there is no discussion until the
entire group stops brainstorming. Have each participant write
their ideas on 3X5‖ Post-It® notes using fine-point permanent
markers, one idea per Post-It®. Concentrate on one category of
the SWOT at a time, and post the notes on a pieces of labeled
chart paper as participants generate them. This way, participants
can feed off of other ideas. Twenty minutes per category is a
good rule-of-thumb for this method. Some of the best ideas will
surface after a lull in activity, so avoid rushing the process.
After the group has completed brainstorming, assign several
members per category to group and label the items. Then check
in with the group regarding the results.
Round-Robin Method
Label four charts: strengths, weaknesses, opportunities, and
threats. Split participants into four groups and assign a chart to
each group. Have group members write their ideas on 3X5‖ Post-
It® notes using fine-point permanent markers, one idea per Post-
It®. Have them post the ideas as they go. Assign a timekeeper
and rotate groups so that they are assigned a new chart at
previously agreed-upon intervals. Five minutes per category is a
good rule-of-thumb for this method. As groups rotate, they must
read the ideas generated by previous groups, then add their own
ideas. After the entire cycle, assign several members per category
to group and label the items. Then check in with the group
regarding the results.

159
Why Technique
Asking, ―why?‖ repeatedly allows you to peel away layer after
layer of symptoms to get to the heart of an issue. This technique
also helps you see how different causes of a problem may be
related.
How to use it:
Describe the problem in specific terms.
Ask why it happens.
If the answer doesn‘t identify a root cause, ask why again.
You have identified the root cause when asking why
doesn‘t yield any more useful information.
Points to remember:
Always focus on the process/aspects of a problem, rather
than on the personalities involved. Finding scapegoats
does not solve problems!
Answers to each successive ―why‖ may require gathering
additional information.
A problem may have more than one root cause. In this
case, the key is to address the causes that have the most
impact.

160
Work Breakdown Structure (WBS)
A WBS is used to identify the work to be done and the scope of a
project.
Work Breakdown Structure (WBS)
Paint Office
1
Prep
2
Cut In
3
Paint
1.1
Clean
1.2
Lay
Drop Cloths
2.1
Tape
2.2
Cut In
2.3
Do Corners
3.1
Roll
3.2
Touch Up
Level 0
Level 2
Level 1
How to use it:
Prior to defining the work to be accomplished, gather relevant
information regarding customer and stakeholder requirements, as
well as available resources. Then, begin to identify the work that
needs to be accomplished in appropriate sized chunks called
―work packages.‖ This is best accomplished in a small group
setting, since different people will have a different perspective on
the work that needs to be done. A simple way to accomplish this
task is to use 3 X 5‖ Post-It® notes and chart paper. Arrange the
Post-It® notes in a tree fashion.

161
There are two general approaches to identify the work: top-down
and bottom-up. In the top-down approach, begin at Level 0 with
the overall project. Then, break work down into categories
beginning at Level 1 and down to further levels as appropriate.
Typically, smaller projects will not go beyond Level 4. A good
rule-of-thumb is to break each work package down so that each
does not exceed 80 hours. This is known as the 80-hour rule.
Once the overall work is identified, a common way to formalize
the WBS is to put it in outline format. Work packages can be
identified by number, by levels, and by tasks. For example, tasks
at Level 1 may be labeled 1, 2, 3, and so on; tasks at Level 2 may
be labeled 1.1, 1.2, and so on. Each task can then be assigned
appropriate personnel, budget, and a due date.
More complex projects may require the use of specialized
scheduling tools such as activity network diagrams or Gantt
Charts; other project planning or implementation tools; or project
management software.

162
GLOSSARY
Acronym What it means: Description:
CPC Commandant‘s
Performance
Challenge
A facilitated self-assessment
done by Coast Guard units to
assess their leadership and
management practices compared
to the CPEC.
CPEC Commandant‘s
Performance
Excellence
Criteria
The Coast Guard‘s management
model based on the Malcolm
Baldrige National Performance
Excellence Criteria.
CQA Commandant‘s
Quality Award
A rigorous award program
modeled after the Malcolm
Baldrige National Quality
Award. Commands/Staffs that
achieve mature management
levels through their CPC efforts
can become eligible for this
award program.
CTQ Critical to Quality Links customer needs from
VOC data collection efforts and
enables the project team to get
more specific information that
cascades in a ―tree‖ format.
DMAIC Define Measure
Analyze Improve
Control
Problem solving model used in
Six Sigma Projects
DOE Design of
Experiments
A Six Sigma Tool used to test
multiple causes in a systematic
way so that causal relationships
within a process can be
determined.

163
Acronym What it means: Description:
DPMO Defects Per
Million
Opportunities
Six Sigma represents 3.4 DPMO
or 99.9997% accuracy. 3.8
Sigma represents 10,700 DPMO
or 98.9% accuracy.
ESC Executive
Steering
Committee
Sometimes used to describe the
most senior management team
in an organization. See also
SMT.
FADE Focus Analyze
Develop Execute
A problem solving model
introduced to the Coast Guard in
1991 by the consulting firm
ODI.
FMEA Failure Mode and
Effects Analysis
Used to identify specific ways
that a process, product or service
may fail. Once this is
understood, countermeasures
can be developed to mitigate the
potential failures.
NWG Natural Working
Group
A team that works around
common processes or functions
within an organization.
OPC Organizational
Performance
Consultant
Internal Consultants with
expertise in organizational
assessments and development.
They help commands and staffs
implement Coast Guard
management programs.
PDCA Plan Do Check
Act
The elemental problem solving
model developed by Shewart in
the mid 1900s to bring scientific
problem solving discipline into
management practices
QAT Quality Action
Team
A team chartered to work on
solving a specific problem or
improving a process.
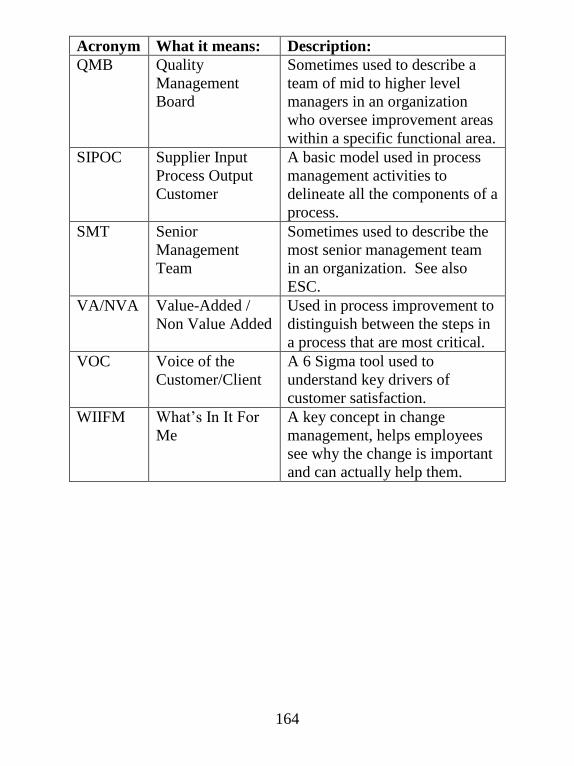
164
Acronym What it means: Description:
QMB Quality
Management
Board
Sometimes used to describe a
team of mid to higher level
managers in an organization
who oversee improvement areas
within a specific functional area.
SIPOC Supplier Input
Process Output
Customer
A basic model used in process
management activities to
delineate all the components of a
process.
SMT Senior
Management
Team
Sometimes used to describe the
most senior management team
in an organization. See also
ESC.
VA/NVA Value-Added /
Non Value Added
Used in process improvement to
distinguish between the steps in
a process that are most critical.
VOC Voice of the
Customer/Client
A 6 Sigma tool used to
understand key drivers of
customer satisfaction.
WIIFM What‘s In It For
Me
A key concept in change
management, helps employees
see why the change is important
and can actually help them.

165
REFERENCES
Coast Guard Leadership Development Program,
COMDTINST 5351.1 (series)
Commandant’s Performance Excellence Criteria Guidebook,
COMDTPUB P5224 (series)
Doyle, M., Straus, D. (1976). How to Make Meetings Work. New
York: Jove Books.
Kayser, Thomas A. (1990). Mining Group Gold. El Segundo:
Serif Publishing.
Senge, Peter M. (1990). The Fifth Discipline. New York:
Doubleday.

166
ADDITIONAL RESOURCES
Alessandra, A. J. & Hunsaker, P. L. (1993). Communication at
Work. New York, NY. Simon & Schuster.
Arnold, K. J. (1999). Team Basics: Practical Strategies for Team
Success. Hampton, VA. QPC Press.
Babbie, E. (1990). Survey Research Methods (2nd
ed.). CA:
Wadsworth.
Bens, I. (2003). Facilitating Uphill. Sarasota, FL. Participative
Dynamics.
Blaikie, N. (2003). Analyzing Quantitative Data : From
Description to Explanation. Thousand Oaks, CA. Sage
Publications.
Covey, S. R. (1989). The 7 Habits of Highly Effective People.
New York, NY. Simon & Schuster.
Damelio, R. (1996). The Basics of Process Mapping. Portland,
OR. Productivity Inc.
Dillman, D. A. (2000). Mail and Internet surveys--The tailored
design method (2nd
ed.). New York: John Wiley & Sons, Inc.
Hackett, D. & Martin, C. L. (1993). Facilitation Skills for Team
Leaders. Menlo Park, CA. Crisp Publications.
Heldman, K. (2003). Project Management Jumpstart. Alameda,
CA. Sybex.
Kirk, R. E. (1990) Statistics: An Introduction (3rd
edition). Fort
Worth, TX: Holt, Rinehart, and Winston.
Kotter, J. P. (1996). Leading Change. Boston, MA. Harvard
Business School Press.
LaFasto, F. M. J. & Larson, C. E. (2001). When Teams Work
Best. Thousand Oaks, CA. Sage Publications.

167
Lewis, J. P. (2002). Fundamentals of Project Management (2nd
Ed). New York, NY. American Management Association.
Milosevic, D. Z. (2003). Project Management Tool Box.
Hoboken, NJ. John Wiley & Sons, Inc.
Pande, P. S. et al. (2002). The Six Sigma Way Team Fieldbook.
New York, NY. Mc-Graw Hill.
Patton, M. Q. (1990). Qualitative Evaluation and Research
Methods (2nd ed.). Newbury Park, CA: Sage Publications,
Inc.
Pershing, J. A. (2000). USCG Workshop Survey: The Design and
Development of Survey Instruments. Bloomington, IN.
Education and Management Research Associates.
Rath & Strong Management Consultants. (2000). Rath &
Strong’s Six Sigma Pocket Guide.
Scholtes, P. R. (1998). The Leader’s Handbook. New York, NY.
McGraw-Hill.
Straus, D. (2002). How to Make Collaboration Work. San
Francisco, CA. Berrett-Koehler Publishers, Inc.
Tague, N. R. (1995). The Quality Toolbox. Milwaukee, WI.
ASQC Quality Press.
Wilkinson, M. (2004). The Secrets of Facilitation. San Francisco,
CA. Josey-Bass.
Schwarz, R. M. (1994). The Skilled Facilitator: Practical
Wisdom for Developing Effective Groups. San Francisco,
CA. Jossey-Bass, Inc.
Streibel, B. J. et al. (2003). The Team Handbook (3rd
Ed).,
Madison, WI. Joiner/Oriel, Inc.

168
TABLE OF TOOL USAGE Frequent Occasional
Tool Generate
Ideas Collect
Info
Analyze
Info Make
Decisions Display
Info Plan
Action Planning
Affinity Diagram
Brainstorming
Cause & Effect
Charter
Check Sheet
Consensus Cards
Contingency Diagram
Control Charts
Critical-To-Quality Tree
Customer Rqmts Matrix
Decision Matrix
Flowchart
Force-Field Analysis
Histogram
Kano Model
Multi-Vote
Nominal Group Technique
Pareto Chart
Project Rqmts Table
Proj Responsibility Matrix
Run Chart
Scatter Diagram
SIPOC
Stakeholder Analysis
SWOT Analysis
Why Technique
Work Brkdown Structure

169
TABLE OF TOOL USAGE (DMAIC) Frequent Occasional
Tool
Define Measure Analyze Improve Control
Action Planning
Affinity Diagram
Brainstorming
Cause & Effect
Charter
Check Sheet
Consensus Cards
Contingency Diagram
Control Charts
Critical-To-Quality Tree
Customer Rqmts Matrix
Decision Matrix
Flowchart
Force-Field Analysis
Histogram
Kano Model
Multi-Vote
Nominal Group Technique
Pareto Chart
Project Rqmts Table
Proj Responsibility Matrix Run Chart Scatter Diagram SIPOC Stakeholder Analysis SWOT Analysis Why Technique Work Brkdown Structure

170
QUICK TOOLS REFERENCE GUIDE
TOOL ...................................................................................... PAGE
Action Planning .................................................................... 104
Affinity Diagram .................................................................. 106
Brainstorming ....................................................................... 110
Charter .................................................................................. 113
Cause-and-Effect Diagram ................................................... 116
Check Sheet .......................................................................... 118
Consensus Cards ................................................................... 120
Contingency Diagram ........................................................... 122
Control Charts ....................................................................... 124
Customer Alignment Questions ............................................ 127
Customer Requirements Matrix ............................................ 128
Decision Matrix .................................................................... 129
Flowchart .............................................................................. 131
Force Field Analysis ............................................................. 134
Gantt Chart ............................................................................ 135
Kano Model .......................................................................... 139
Multi-Voting ......................................................................... 140
Nominal Group Technique ................................................... 142
Pareto Chart .......................................................................... 144
Project Requirements Table .................................................. 146
Project Responsibility Matrix ............................................... 147
Run Chart .............................................................................. 148
Scatter Diagram .................................................................... 153
SIPOC ................................................................................... 154
Stakeholder Analysis ............................................................ 156
SWOT Analysis .................................................................... 157
Why Technique ..................................................................... 159
Work Breakdown Structure (WBS) ...................................... 160