U.S. BIOMASS AS FEEDSTOCK FOR A BIOENERGY AND … · FOR A BIOENERGY AND BIOPRODUCTS INDUSTRY: ......
31
Bob Perlack – Oak Ridge National Laboratory Bryce Stokes – CNJV (DOE Golden Field Office) and Others June 2011 U.S. BIOMASS AS FEEDSTOCK FOR A BIOENERGY AND BIOPRODUCTS INDUSTRY: AN UPDATE TO THE BILLION-TON ANNUAL SUPPLY
-
Upload
truongkhanh -
Category
Documents
-
view
214 -
download
0
Transcript of U.S. BIOMASS AS FEEDSTOCK FOR A BIOENERGY AND … · FOR A BIOENERGY AND BIOPRODUCTS INDUSTRY: ......

Bob Perlack – Oak Ridge National Laboratory Bryce Stokes – CNJV (DOE Golden Field Office) and Others June 2011
U.S. BIOMASS AS FEEDSTOCK FOR A BIOENERGY AND BIOPRODUCTS INDUSTRY: AN UPDATE TO THE BILLION-TON ANNUAL SUPPLY

WHAT IS THE 2005 BILLION TON STUDY? • First national assessment of agricultural and
forestry biomass resources potentially available for energy production
• Heralded as a seminal report that – provided evidence of a real and substantial
resource – nudged federal government policy shifts – accelerated renewable fuels policies
• Cited numerous times and subject of many commentaries, several theses and dissertations, and even a workshop 2

WHAT IS THE 2005 BILLION TON STUDY (Continued)? • Scrutinized in detail • Criticized as
– too conservative/optimistic – unrealistic without economics and
sustainability criteria – missed the mark on some technical
assumptions – confusion over currently used biomass
• Often debated but generally accepted as starting point for further analysis
3

4 Managed by UT-Battelle for the U.S. Department of Energy
BILLION-TON RESOURCE ASSESSMENT
• Review original study
• Preview Billion-Ton Update:
• Scope of study
• Analyses approach
• Summary results

5 Managed by UT-Battelle for the U.S. Department of Energy
Oak Ridge National Laboratory
Robert D. Perlack* Craig C. Brandt Anthony F. Turhollow Lynn L. Wright Laurence M. Eaton Anna M. Shamey Jacob M. Kavkewitz Matt H. Langholtz Mark E. Downing Robin L. Graham Idaho National Laboratory
David J. Muth J. Richard Hess Jared M. Abodeely Kansas State University
Richard G. Nelson State University of New York
Timothy A. Volk Thomas S. Buchholz Lawrence P. Abrahamson
Iowa State University Robert P. Anex
CNJV LLC
Bryce J. Stokes*
University of Tennessee
Chad Hellwinckel Daniel De La Torre Ugarte Daniel C. Yoder James P. Lyon Timothy G. Rials USDA Agricultural Research
Service
Douglas L. Karlen Jane M. F. Johnson Robert B. Mitchell Kenneth P. Vogel Edward P. Richard John Tatarko Larry E. Wagner University of Minnesota
William Berguson Don E. Riemenschneider Texas A&M University William L. Rooney
USDA Forest Service
Kenneth E. Skog, Patricia K. Lebow Dennis P. Dykstra Marilyn A. Buford Patrick D. Miles D. Andrew Scott James H. Perdue Robert B. Rummer Jamie Barbour John A. Stanturf David B. McKeever Ronald S. Zalesny Edmund A. Gee USDA National Institute of Food
and Agriculture
P. Daniel Cassidy USDA Natural Resources
Conservation Service
David Lightle University of Illinois Thomas B. Voigt
CONTRIBUTORS
* Co-leads

6 Managed by UT-Battelle for the U.S. Department of Energy
Willow Lawrence P. Abrahamson, Ph.D. – Senior Research Associate, State University of New York, College of Environmental Science and Forestry, Syracuse, NY Timothy A. Volk, Ph.D. – Senior Research Associate, State University of New York, College of Environmental Science and Forestry, Syracuse, NY
Eucalyptus Matt H. Langholtz, Ph.D. – Economist, Oak Ridge National Laboratory, Bioenergy Resource and Engineering Systems Group, Environmental Sciences Division, Oak Ridge, TN
Switchgrass and Other
Perennial Grasses Robert B. Mitchell, Ph.D. – Research Agronomist, USDA Agricultural Research Services, Grain, Forage & Bioenergy Research Unit, Lincoln, NB Kenneth P. Vogel, Ph.D. – Supervisory Research Geneticist, USDA Agricultural Research Services, Grain, Forage & Bioenergy Research Unit, Lincoln, NB Sugarcane Edward P. Richard Jr., Ph.D. – Research Leader, USDA Agricultural Research Services, Sugarcane Research Unit, Houma, LA
Sorghum
William L. Rooney, Ph.D. – Professor, Texas A&M University, Department of Soil and Crop Sciences, College Station, TX Giant Miscanthus Thomas B. Voigt, Ph.D. – Extension Specialist, University of Illinois, Department of Crop Sciences, Urbana, IL Southern Pines Lynn L. Wright – Consultant, Oak Ridge National Laboratory, Bioenergy Resource and Engineering Systems Group, Environmental Sciences Division, Oak Ridge, TN
ENERGY CROP BACKGROUND AUTHORS

7 Managed by UT-Battelle for the U.S. Department of Energy
Dr. Harry Baumes
Director Office of Energy Policy and New
Uses U.S. Department of Agriculture
Washington, DC Dr. Mary Bohman
Division Director, Resource and Rural Economics Division
Economics Research Service U.S. Department of Agriculture
Washington, DC Dr. Craig Frear
Bioproducts Specialist, Biological Systems Engineering
Washington State University
Pullman, WA
Dr. Göran Berndes
Leader, International Energy Agreement Bioenergy Task 43 and Docent
Department of Energy and Environment
Chalmers University of
Technology
Gothenburg, Sweden Dr. Bryan Jenkins
Professor Biological & Agricultural
Engineering University of California
Davis, CA Dr. Alan Lucier
Senior vice President National Council on Air and
Stream Improvement
Research Triangle Park, NC Dr. Ken Moore
Professor Department of Agronomy Iowa State University
Ames, IA
Jim Richardson
Leader (Retired), International Energy Agreement Bioenergy Task 31
J. Richardson Consulting
Ottawa, ON, Canada Dr. V. Alaric Sample
President Pinchot Institute for
Conservation
Washington, DC David Sjoding
Renewable Energy Specialist Washington State University
Olympia, WA Dr. David Wear
Project Leader Southern Research Station U.S. Forest Service Research Triangle Park, NC
REVIEWERS

8 Managed by UT-Battelle for the U.S. Department of Energy
ASSOCIATED EFFORTS
Additional Notes for Workshops: • 6 editors • 13 Participants – corn/residues workshop • 13 Participants – herbaceous crops workshop • 15 Participants – woody crops workshop
https://bioenergykdf.net/ https://inlportal.inl.gov/portal/server.pt/community/bioenergy/421/high_yield_scenario/8985

9 Managed by UT-Battelle for the U.S. Department of Energy
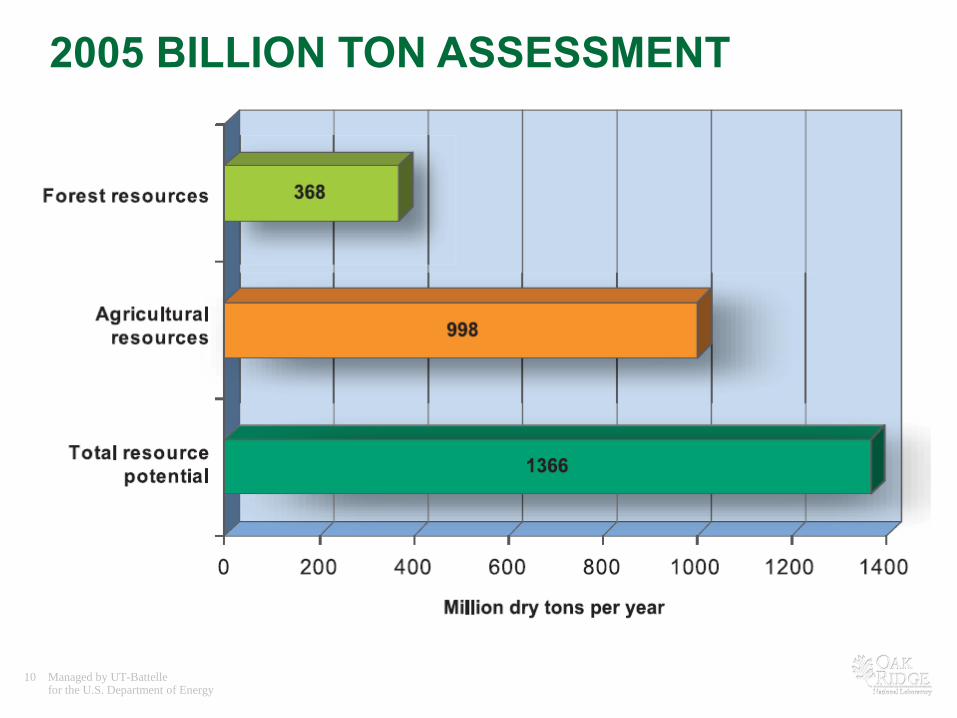
• Forest resources – Logging residues
– Forest thinnings (fuel treatments)
– Conventional wood
– Fuelwood
– Primary mill residues
– Secondary mill residues
– Pulping liquors
– Urban wood residues
• Agricultural resources – Crop residues
– Grains to biofuels
– Perennial grasses
– Perennial woody crops
– Animal manures
– Food/feed processing residues
– MSW and landfill gases
– Annual energy crop
• About one-half of the land in the contiguous U.S. – Forestland resources: 504 million acres of timberland, 91 million acres
of other forestland
– Agricultural resources: 342 million acres cropland, 39 million acres idle cropland, 68 million acres cropland pasture
BIOMASS FEEDSTOCK RESOURCE BASE
Added in 2011 Update
Added in 2011 Update
10 Managed by UT-Battelle for the U.S. Department of Energy
2005 BILLION TON ASSESSMENT
11 Managed by UT-Battelle for the U.S. Department of Energy
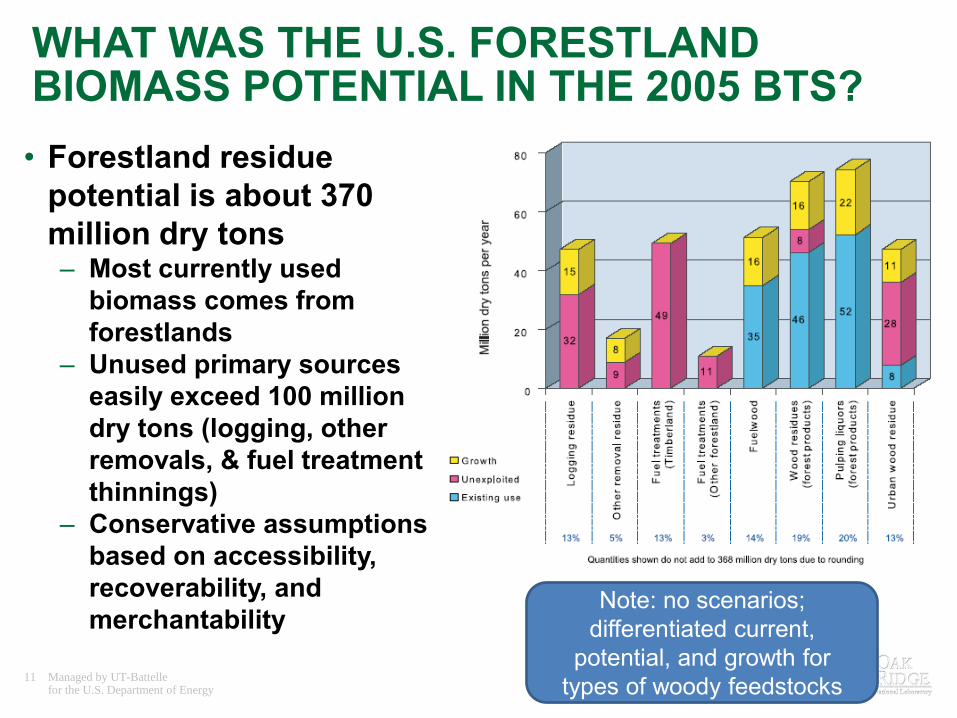
WHAT WAS THE U.S. FORESTLAND BIOMASS POTENTIAL IN THE 2005 BTS? • Forestland residue
potential is about 370 million dry tons – Most currently used
biomass comes from forestlands
– Unused primary sources easily exceed 100 million dry tons (logging, other removals, & fuel treatment thinnings)
– Conservative assumptions based on accessibility, recoverability, and merchantability
Note: no scenarios; differentiated current,
potential, and growth for types of woody feedstocks

12 Managed by UT-Battelle for the U.S. Department of Energy
• Total cropland resource approaches 1 billion dry tons/year including perennial energy crops – Continuation in yield growth trend for corn and small grains – Shift to conservation tillage and no-till – Improvements in residue collection equipment – Perennial energy crops (40 - 60 million acres)
WHAT WAS THE U.S. CROPLAND BIOMASS POTENTIAL IN THE 2005 BTS?
Note: yield and land use change
scenarios; inclusion/exclusion
of “perennial” crops at selected
acreage

13 Managed by UT-Battelle for the U.S. Department of Energy
WHAT ARE THE GOALS OF THE UPDATE?
• To address biomass resource availability, sustainability, and costs collectively and spatially
• To improve the data, the methodology, and future projections
• To make the data and analysis transparent and available to others
• To address concerns and issues from the 2005 study

14 Managed by UT-Battelle for the U.S. Department of Energy
KEY DIFFERENCES BETWEEN THE 2005 STUDY AND THE BILLION-TON UPDATE
2012 Update • County to national level
• Supply curves by feedstock by county
• Environmental sustainability included at field and stand level
• 2012 USDA agricultural baseline and 2007 forestry RPA/TPO
• Land use change modeled for energy crops
• 2012 - 2030 timeline
2005 Original • National estimates – no
spatial information
• No cost analyses
• Environmental sustainability addressed nationally
• 2005 USDA agricultural baseline and 2000 forestry RPA/TPO
• No explicit land use change modeling
• Long-term time horizon (2005, 2025 – 2050)
KEY COMMONALITY
AN ASSESSMENT OF BIOMASS POTENTIAL
UNDER A GIVEN SET OF ASSUMPTIONS AND AVAILABLE DATA

15 Managed by UT-Battelle for the U.S. Department of Energy
SUMMARY OF APPROACH • Estimate availability and costs for major feedstocks to
the farmgate or roadside – Update and new data – Model and framework development – NASS, USDA Baseline, FIA, TPO, RPA, etc.
• Resource costs – Grower payments for crop residues – Stumpage costs for forest residues and resources – Production (establishment and agronomic or silviculture) costs for
perennial and annual dedicated energy crops
• Collection and harvest costs – IBSAL model and INL for cropland resources – FRCS model for forestland resources – Shifted to “integrated” harvest
• Supply curve estimation – Cost-quantity by county – POLYSYS model (BTS2 version operating at a county-level) – Forestry was exogenously completed
• Forest sector component in POLYSYS under development (not for BTS2)

16 Managed by UT-Battelle for the U.S. Department of Energy
GENERAL APPROACH • County feedstock supply curves for major primary cropland and
forestland resources
– Agricultural policy model (POLYSYS) used to estimate supply curves and land use change for crop residues and energy crops • USDA baseline forecast and projections and NASS data (yields,
acres, crop prices, production, exports, etc.) to 2030 • Requirements for resource sustainability – crop residue
retention coefficients, tillage options, crop rotations; costs include good management practices
• Energy crop yield
– Resource cost analysis used to estimate supply curves (cost-quantities) for forestland resources • USDA/FS data (FIA, TPO, RPA, …) • Forest residue access, recovery, and merchantability • Requirements for resource sustainability – land classes, residue
retention, slope and stand types, no road construction

17 Managed by UT-Battelle for the U.S. Department of Energy
GENERAL APPROACH (cont.) • POLYSYS - dynamic model of the U.S.
agricultural sector – Anchored to USDA 10-year projections & extrapolated to
2030 by ORNL
– 8 major crops (corn, soybeans, wheat, sorghum, oats, barley, rice, cotton) and hay, livestock, food/feed markets
– Model requires meeting projected demands for food, feed, forage, fuel (grain ethanol and oils in RFS2), and exports
– Added stover, straw, energy crops (perennial grass, woody, annual): switchgrass, other grasses, miscanthus, sugarcane, sorghum, poplar, willow, eucalyptus, southern pines
– 3,110 counties to assess land use change
– Land base includes cropland (250 million acres), cropland pasture (22 million acres), hay (61 million acres), permanent pasture (118 million acres)
• Pasture can convert to energy crops if forage made up through intensification
• Restraints limiting land use change • No CRP • 10% cropland and 25% total
• No forestland conversion to energy crops
– Forest resources exogenous to the model
For model background see: De la Torre Ugarte, Daniel G., and Darrell E. Ray. 2000. “Biomass and Bioenergy Applications of the POLYSYS Modeling Framework,” Biomass
and Bioenergy 4(3):1-18, May. University of Tennessee - Agricultural Policy Analysis Center (APAC) (http://www.agpolicy.org/)

18 Managed by UT-Battelle for the U.S. Department of Energy
GENERAL APPROACH (cont.) • Secondary processing residues and wastes are estimated using
technical coefficients
• Coordination among partners to develop key technical and factor input cost data, enhancement of models (e.g., POLYSYS), and analyses
• Use of the KDF (Knowledge Discovery Framework) to provide and visualize county-level data and results
19 Managed by UT-Battelle for the U.S. Department of Energy
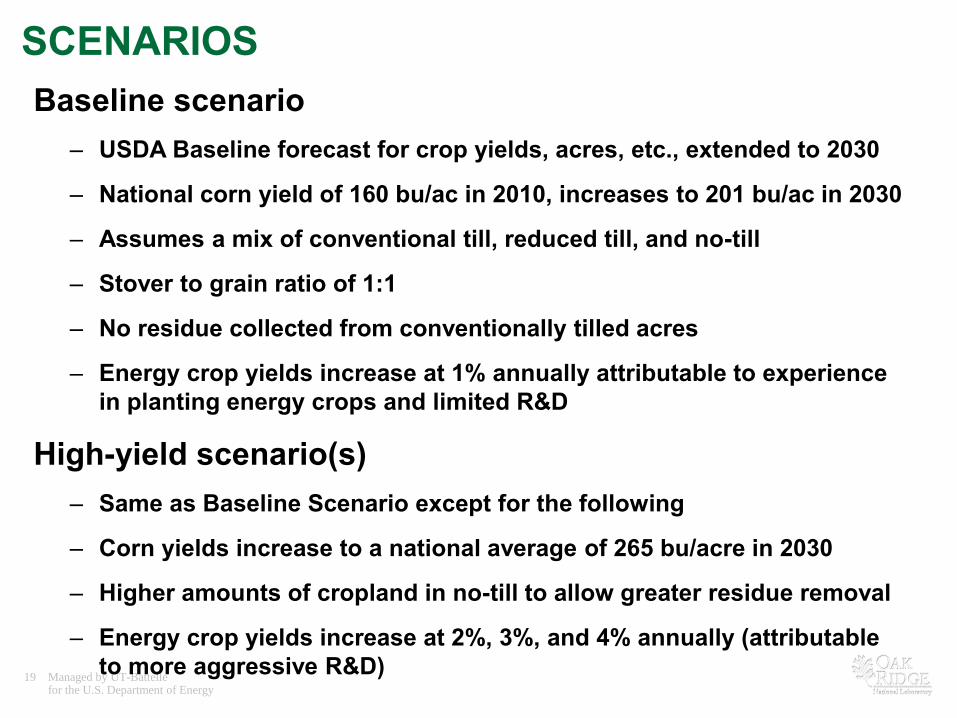
Baseline scenario – USDA Baseline forecast for crop yields, acres, etc., extended to 2030
– National corn yield of 160 bu/ac in 2010, increases to 201 bu/ac in 2030
– Assumes a mix of conventional till, reduced till, and no-till
– Stover to grain ratio of 1:1
– No residue collected from conventionally tilled acres
– Energy crop yields increase at 1% annually attributable to experience in planting energy crops and limited R&D
High-yield scenario(s) – Same as Baseline Scenario except for the following
– Corn yields increase to a national average of 265 bu/acre in 2030
– Higher amounts of cropland in no-till to allow greater residue removal
– Energy crop yields increase at 2%, 3%, and 4% annually (attributable to more aggressive R&D)
SCENARIOS

20 Managed by UT-Battelle for the U.S. Department of Energy
FOREST RESIDUES SUSTAINABILITY • Land base – 504 million acres of timberland & 91 million
acres of “other forestland” • Evaluated biomass removal sustainability (erosion, soil
nutrients, biodiversity, soil-organic carbon, and long-term soil productivity); developed retention levels as function of slope
• Removed reserve lands, roadless areas, steep slopes, wet areas, and biomass requiring road building
• Used new USFS FIA (Forest Inventory & Analysis) tree biomass equations
• Never harvested more than growth • Supply curves for integrated operations for logging
residues and fuel treatment thinnings on timberland, i.e., biomass is part of mix of products
• Estimated supply curves for conventionally sourced wood (i.e., pulpwood) from additional harvests and shift from current uses to bioenergy (conservatively)

21 Managed by UT-Battelle for the U.S. Department of Energy
CROP RESIDUE SUSTAINABILITY
Crop management zones
High residue availability
• Yields and acres planted and harvested (baseline forecast)
• Stover to grain ratio
• Tillage (conventional, reduced, no-till) and rotations
• Sustainability - residue retention coefficients estimated using RUSLE2, WEPS, and SCI for erosion and soil carbon using “Residue Removal Tool” – Separate coefficients for
reduced till and no-till; no residue removal under conventional till
– Nutrient replacement

22 Managed by UT-Battelle for the U.S. Department of Energy
ENERGY CROP SUSTAINABILITY • Allowed on cropland, cropland pasture, and some permanent
pasture – not on forestland
• Cultural practices based on minimal tillage and recommended fertilizer and herbicide applications
• Used BMPs for establishment, cultivation, and harvesting
• Some intensification of pasture land required to meet lost forage
• Retained low-levels of biomass for long-term site productivity with nutrient replacement
• Generally assumed landscape diversity of energy crops with other agricultural and forestry activities
• Energy crops not allowed on irrigated cropland & pasture
• Annual energy crops (i.e., energy sorghum) limited to non-erosive cropland and part of multi-crop rotation
23 Managed by UT-Battelle for the U.S. Department of Energy
$20
$30
$40
$50
$60
$70
0 100 200 300 400 500 600 700 800 900
$/d
ry t
on
Million dry tons
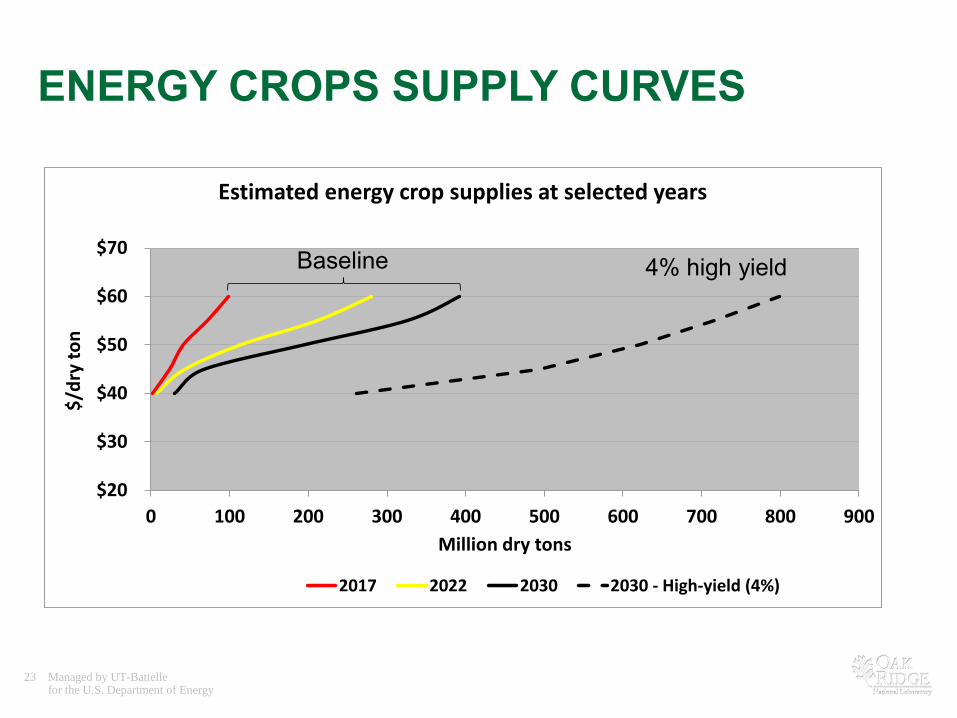
Estimated energy crop supplies at selected years
2017 2022 2030 2030 - High-yield (4%)
Baseline 4% high yield
ENERGY CROPS SUPPLY CURVES

24 Managed by UT-Battelle for the U.S. Department of Energy
0
100
200
300
400
<$40 <$50 <$60 <$40 <$50 <$60 <$40 <$50 <$60 <$40 <$50 <$60
2012 2017 2022 2030
Mill
ion
dry
to
ns
Forest residues and wastes Agricultural residues and wastes Energy crops
FOREST AND AGRICULTURAL RESIDUES AND WASTES AND ENERGY CROPS AT SELECTED PRICES AND YEARS UNDER BASELINE ASSUMPTIONS

25 Managed by UT-Battelle for the U.S. Department of Energy
0
200
400
600
800
2012 2017 2022 2030 2012 2017 2022 2030 2012 2017 2022 2030
2% energy crop 3% energy crop 4% energy crop
Mill
ion
dry
to
ns
Forest residues and wastes Agricultural residues and wastes Energy crops
FOREST AND AGRICULTURAL RESIDUES AND WASTES AND ENERGY CROPS AT SELECTED PRICES AND YEARS UNDER HIGH-YIELD ASSUMPTIONS

26 Managed by UT-Battelle for the U.S. Department of Energy
0
10
20
30
40
50
60
70
80
90
2012 2014 2016 2018 2020 2022 2024 2026 2028 2030
Mill
ion
acr
es
Baseline High-yield (4%)
Total land use change ($60/dry ton) is 63 million acres under the baseline scenario and 79 million acres under the high-yield scenario (4% annual growth in energy crop yield) by 2030
LAND-USE CHANGE

27 Managed by UT-Battelle for the U.S. Department of Energy
Summary of Available Biomass Per Year
0 500 1000 1500 2000
Baseline
High yield - 2%
High yield - 3%
High yield - 4%
Baseline
High yield - 2%
High yield - 3%
High yield - 4%
Baseline
High yield - 2%
High yield - 3%
High yield - 4%
Baseline
High yield - 2%
High yield - 3%
High yield - 4%
20
10
20
17
20
22
20
30
Million dry tons
Ethanol - 15 BGY (corn grain)
Biodiesel - 1 BGY (soybeans)
Other currently used agricultural resources Forest resources currently used
Forest biomass & waste resources Agricultural biomass & wastes resources Energy crops
Feedstock (groups) All scenarios At a price of $60/dry ton Use status All years National (continental US)
468 New BTS
1634 New BTS
At $60 per dry ton
1366 Old BTS
472 Old BTS

28 Managed by UT-Battelle for the U.S. Department of Energy

29 Managed by UT-Battelle for the U.S. Department of Energy
SHARES OF ENERGY CROPS, AGRICULTURAL RESIDUES, AND FOREST RESOURCES POTENTIALLY AVAILABLE AT $60 PER DRY TON OR LESS IN 2030 UNDER BASELINE SCENARIO ASSUMPTIONS

30 Managed by UT-Battelle for the U.S. Department of Energy
Baseline Scenario

31 Managed by UT-Battelle for the U.S. Department of Energy
Thank you!
Questions?