U.S. Beverage Alcohol Trends
30
64
-
Upload
samarth-dargan -
Category
Documents
-
view
219 -
download
0
Transcript of U.S. Beverage Alcohol Trends
8/20/2019 U.S. Beverage Alcohol Trends
http://slidepdf.com/reader/full/us-beverage-alcohol-trends 1/40
8/20/2019 U.S. Beverage Alcohol Trends
http://slidepdf.com/reader/full/us-beverage-alcohol-trends 2/40
U.S. Beverage Alcohol Trends
Mike Ginley – Next Level Marketing
8/20/2019 U.S. Beverage Alcohol Trends
http://slidepdf.com/reader/full/us-beverage-alcohol-trends 3/40
Overview
This session will start with a fast paced and information pa
of the trends in total beverage alcohol consumption and th
category specific trends across beer, wine and spirits.
After the short trend review, world renowned mixologist To
Ganim will moderate a panel of leading mixologists to prov
unique perspectives on the major trends impacting the ind
8/20/2019 U.S. Beverage Alcohol Trends
http://slidepdf.com/reader/full/us-beverage-alcohol-trends 4/40
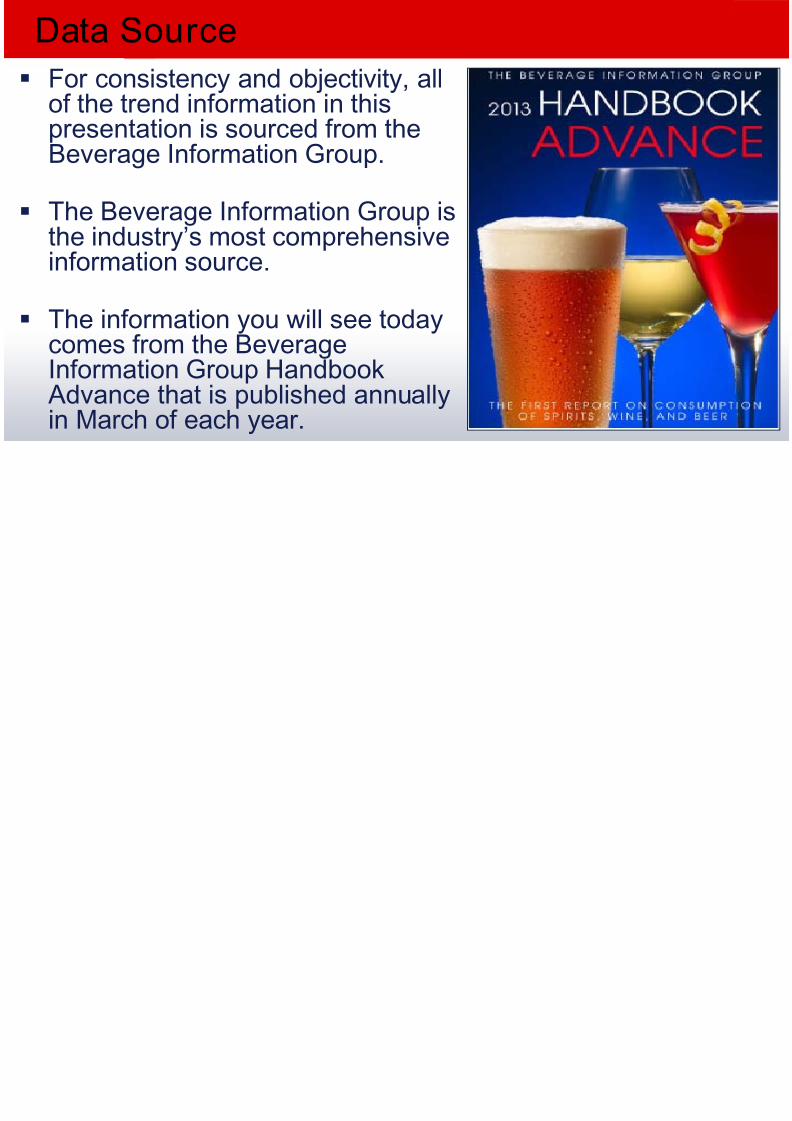
Data Source
For consistency and objectivity, allof the trend information in this
presentation is sourced from theBeverage Information Group.
The Beverage Information Group isthe industry’s most comprehensiveinformation source.
The information you will see todaycomes from the BeverageInformation Group Handbook
Advance that is published annuallyin March of each year.
8/20/2019 U.S. Beverage Alcohol Trends
http://slidepdf.com/reader/full/us-beverage-alcohol-trends 5/40
Total Beverage Alcohol Tren
8/20/2019 U.S. Beverage Alcohol Trends
http://slidepdf.com/reader/full/us-beverage-alcohol-trends 6/40
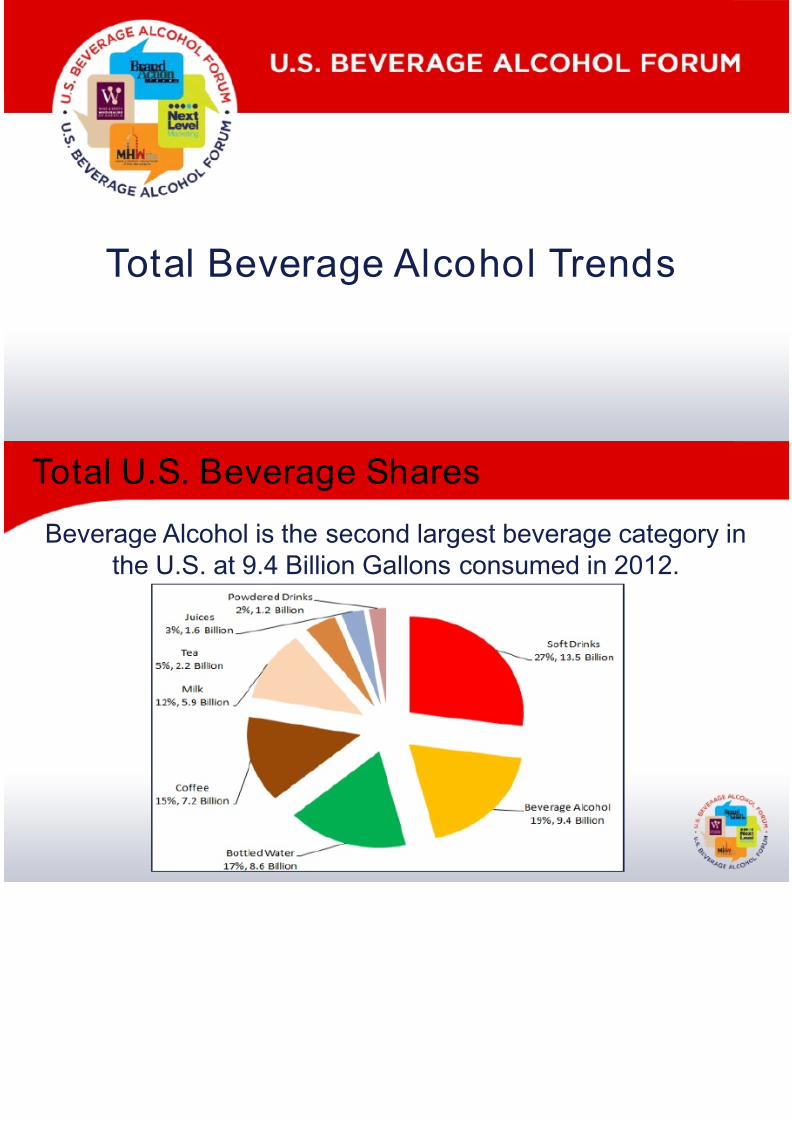
Total U.S. Beverage Shares
Beverage Alcohol is the second largest beverage cthe U.S. at 9.4 Billion Gallons consumed in 2
8/20/2019 U.S. Beverage Alcohol Trends
http://slidepdf.com/reader/full/us-beverage-alcohol-trends 7/40
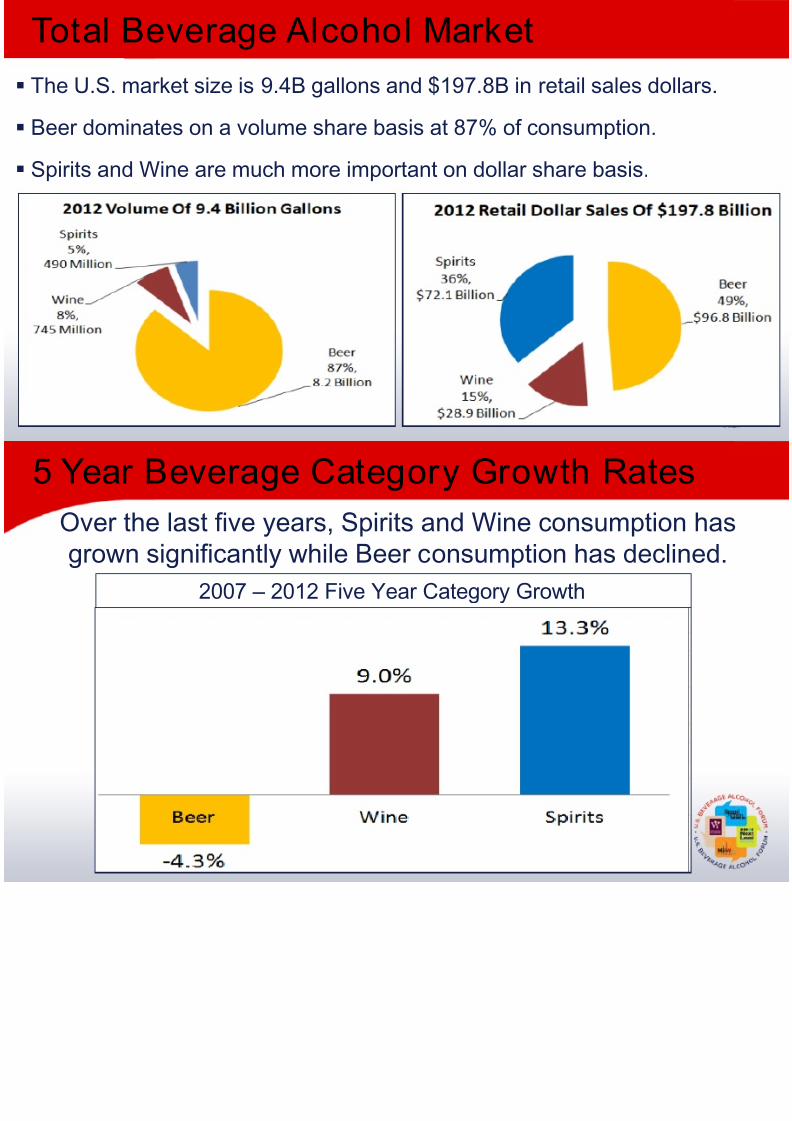
Total Beverage Alcohol Market
The U.S. market size is 9.4B gallons and $197.8B in retail sale
Beer dominates on a volume share basis at 87% of consumpti Spirits and Wine are much more important on dollar share bas
8/20/2019 U.S. Beverage Alcohol Trends
http://slidepdf.com/reader/full/us-beverage-alcohol-trends 8/40
5 Year Beverage Category Growth Ra
Over the last five years, Spirits and Wine consumgrown significantly while Beer consumption has d
2007 – 2012 Five Year Category Growth
8/20/2019 U.S. Beverage Alcohol Trends
http://slidepdf.com/reader/full/us-beverage-alcohol-trends 9/40
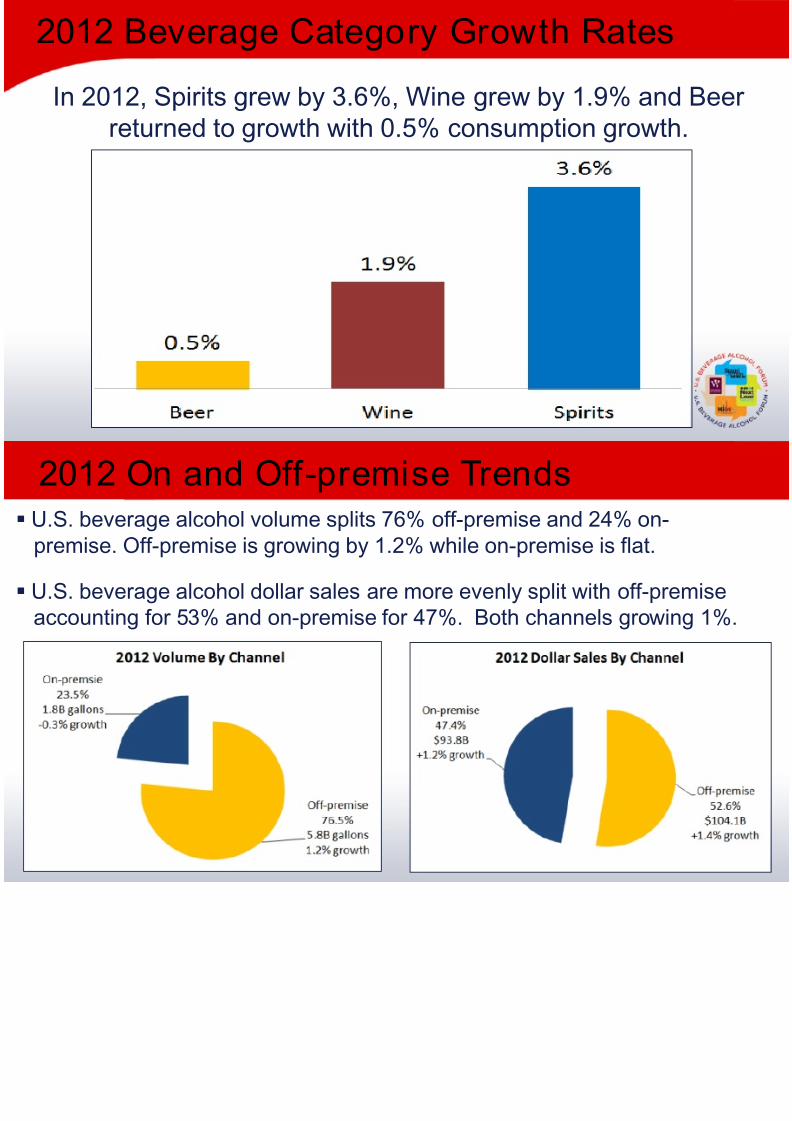
2012 Beverage Category Growth Rat
In 2012, Spirits grew by 3.6%, Wine grew by 1.9%
returned to growth with 0.5% consumption gro
8/20/2019 U.S. Beverage Alcohol Trends
http://slidepdf.com/reader/full/us-beverage-alcohol-trends 10/40
2012 On and Off-premise Trends
U.S. beverage alcohol volume splits 76% off-premise and 24%premise. Off-premise is growing by 1.2% while on-premise is f
U.S. beverage alcohol dollar sales are more evenly split with oaccounting for 53% and on-premise for 47%. Both channels g

8/20/2019 U.S. Beverage Alcohol Trends
http://slidepdf.com/reader/full/us-beverage-alcohol-trends 11/40
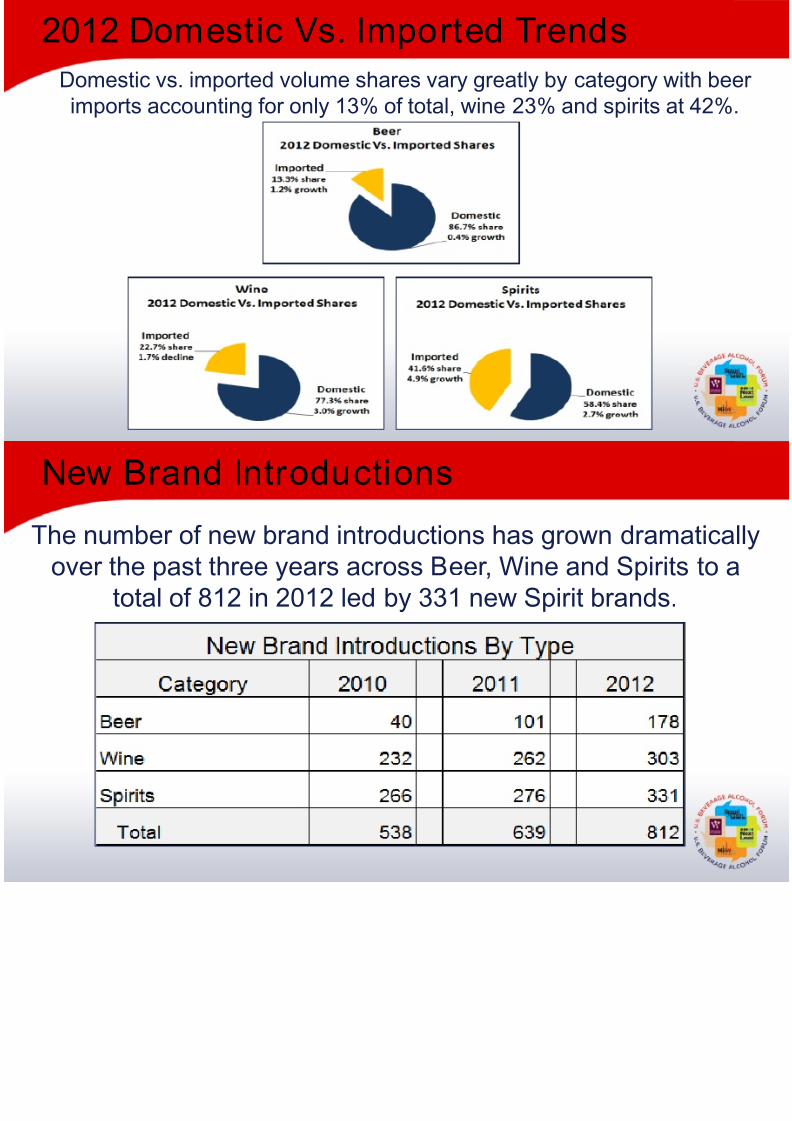
2012 Domestic Vs. Imported Trends
Domestic vs. imported volume shares vary greatly by categimports accounting for only 13% of total, wine 23% and sp
8/20/2019 U.S. Beverage Alcohol Trends
http://slidepdf.com/reader/full/us-beverage-alcohol-trends 12/40
New Brand Introductions
The number of new brand introductions has grown dover the past three years across Beer, Wine and S
total of 812 in 2012 led by 331 new Spirit bra

8/20/2019 U.S. Beverage Alcohol Trends
http://slidepdf.com/reader/full/us-beverage-alcohol-trends 13/40
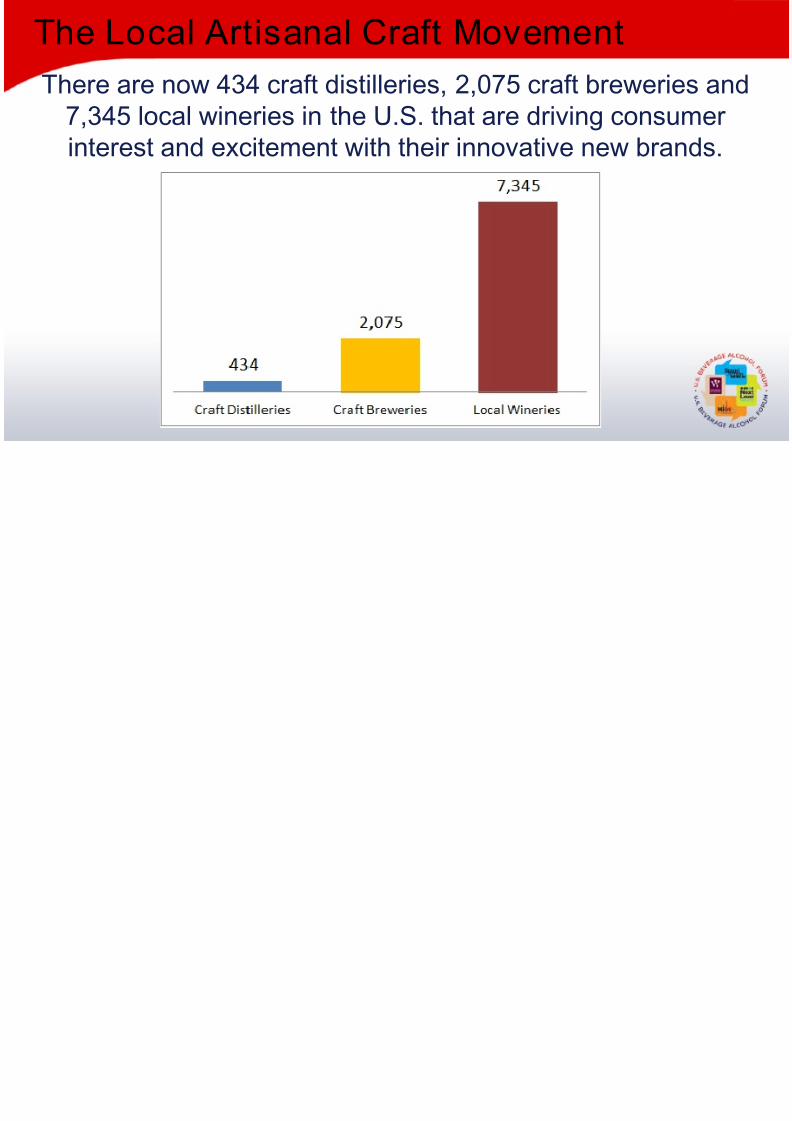
The Local Artisanal Craft Movement
There are now 434 craft distilleries, 2,075 craft brew7,345 local wineries in the U.S. that are driving co
interest and excitement with their innovative new
8/20/2019 U.S. Beverage Alcohol Trends
http://slidepdf.com/reader/full/us-beverage-alcohol-trends 14/40
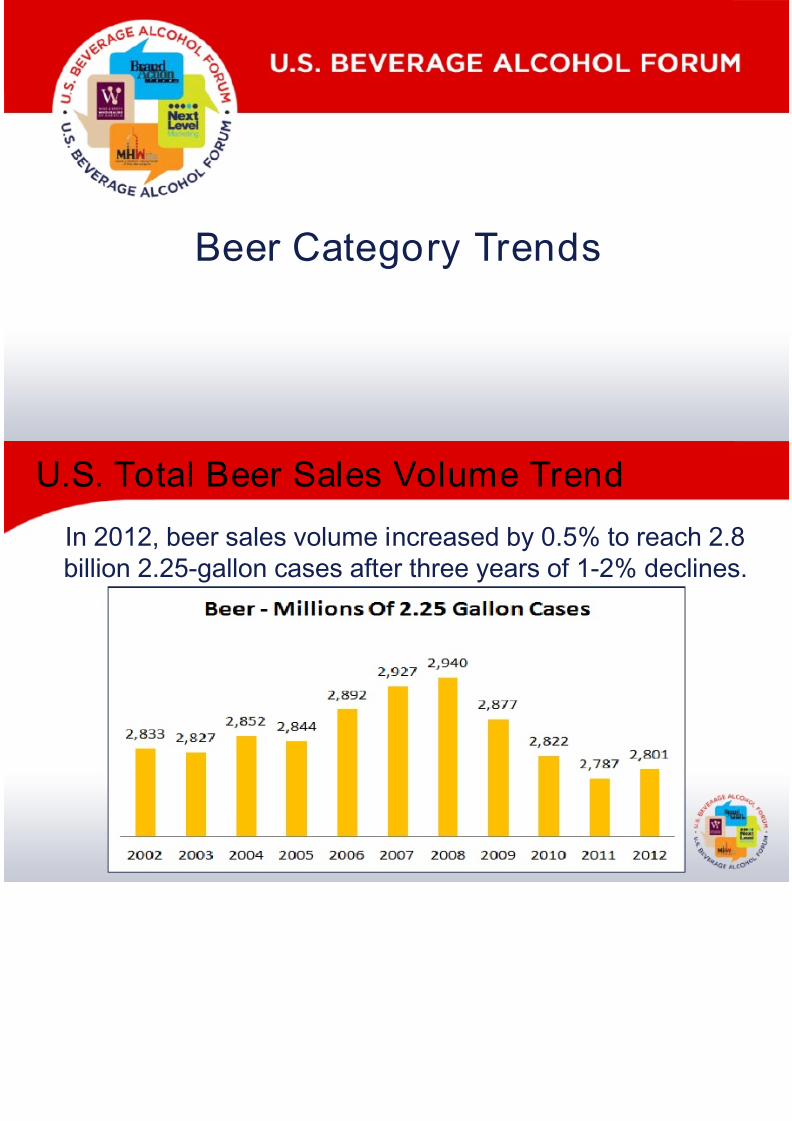
Beer Category Trends
8/20/2019 U.S. Beverage Alcohol Trends
http://slidepdf.com/reader/full/us-beverage-alcohol-trends 15/40
In 2012, beer sales volume increased by 0.5% tobillion 2.25-gallon cases after three years of 1-2%
U.S. Total Beer Sales Volume Trend

8/20/2019 U.S. Beverage Alcohol Trends
http://slidepdf.com/reader/full/us-beverage-alcohol-trends 16/40
Light beer dominates at 52% of volume, followed by13%, premiums at 11%, super-premium/craft at 10%
grew by 9.8% with imports up 1.2% and declines in
2012 Beer Category Shares By Type
8/20/2019 U.S. Beverage Alcohol Trends
http://slidepdf.com/reader/full/us-beverage-alcohol-trends 17/40
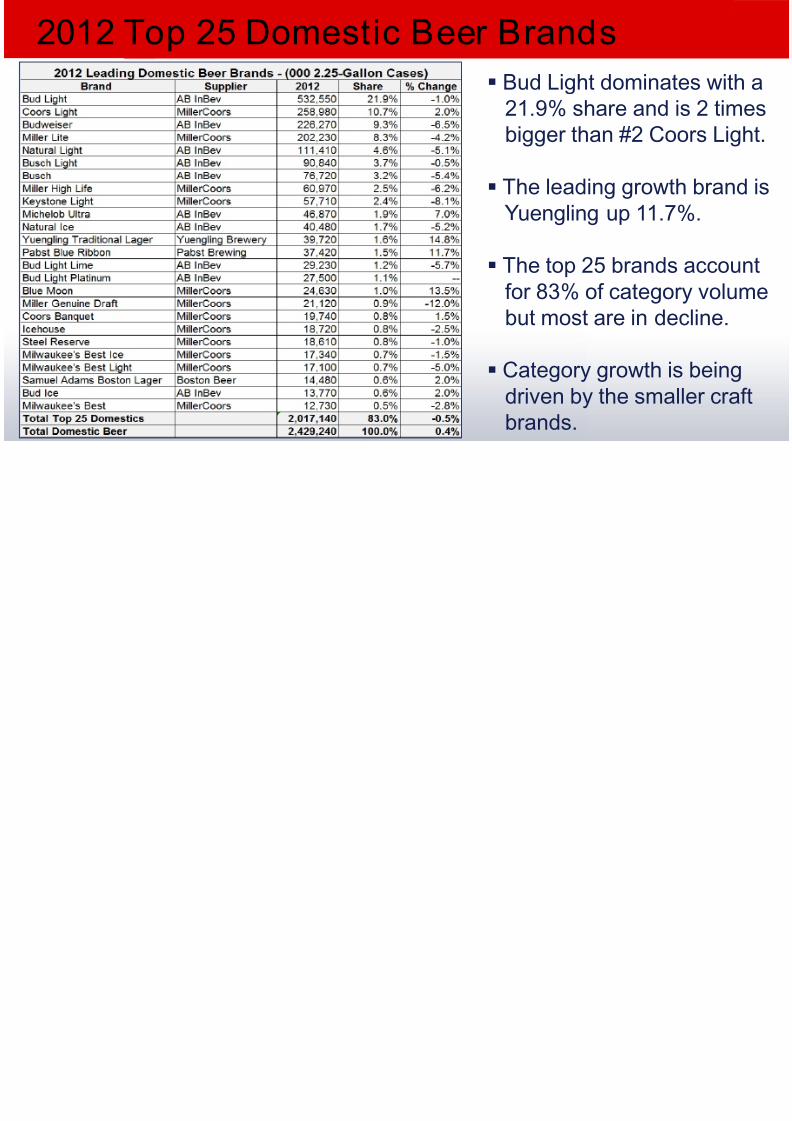
2012 Top 25 Domestic Beer Brands
Bud Light dom21.9% share
bigger than #
The leading gYuengling up
The top 25 brfor 83% of cabut most are
Category growdriven by the
brands.
8/20/2019 U.S. Beverage Alcohol Trends
http://slidepdf.com/reader/full/us-beverage-alcohol-trends 18/40
2012 Top 25 Imported Beer Brands
Corona domin27.1% share
bigger than #
Mexican speTecate Light, Dos Equis as
Artois are thegrowth brand
The top 25 brfor 91% of caand are drivin
category grow
T 10 B C ti St t
8/20/2019 U.S. Beverage Alcohol Trends
http://slidepdf.com/reader/full/us-beverage-alcohol-trends 19/40
The top 10 states account for 53% of U.S. Beer volume anslightly slower than the total U.S. in 2012.
Top 10 Beer Consumption States
8/20/2019 U.S. Beverage Alcohol Trends
http://slidepdf.com/reader/full/us-beverage-alcohol-trends 20/40
Wine Category Trends
U S T t l Wi S l V l T d

8/20/2019 U.S. Beverage Alcohol Trends
http://slidepdf.com/reader/full/us-beverage-alcohol-trends 21/40
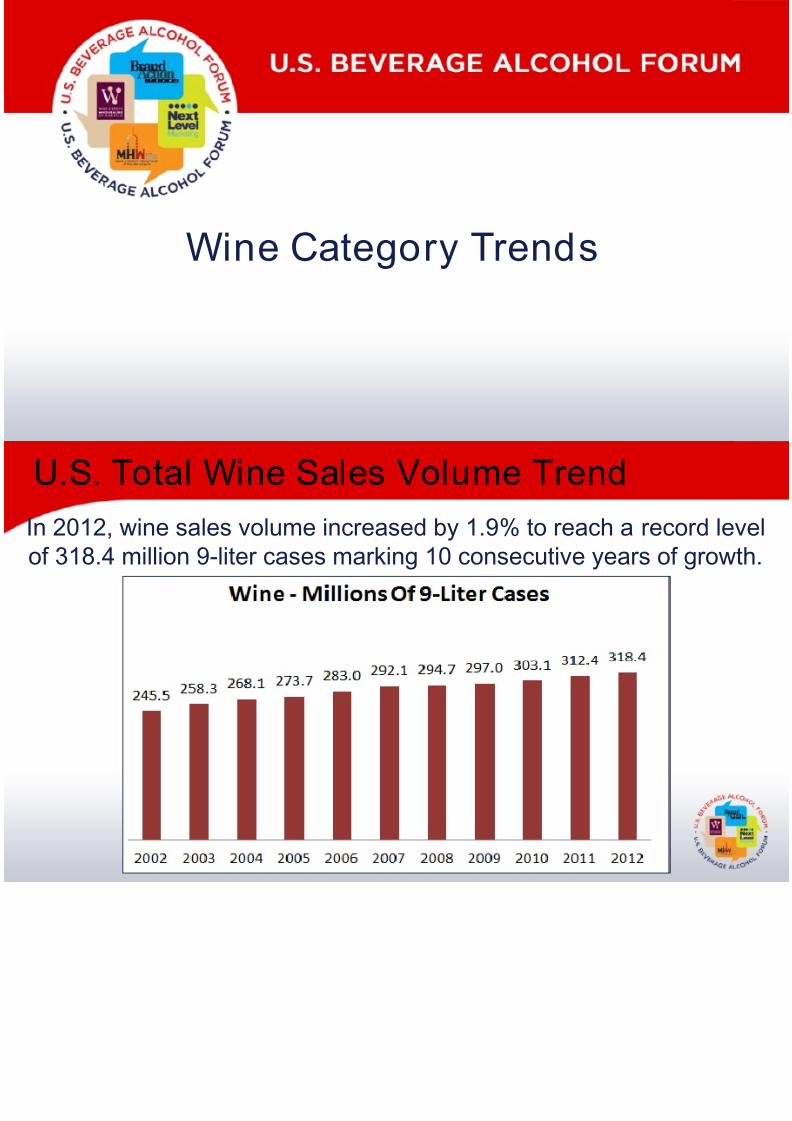
In 2012, wine sales volume increased by 1.9% to reach aof 318.4 million 9-liter cases marking 10 consecutive yea
U.S. Total Wine Sales Volume Trend
2012 Wi C t Sh B T
8/20/2019 U.S. Beverage Alcohol Trends
http://slidepdf.com/reader/full/us-beverage-alcohol-trends 22/40
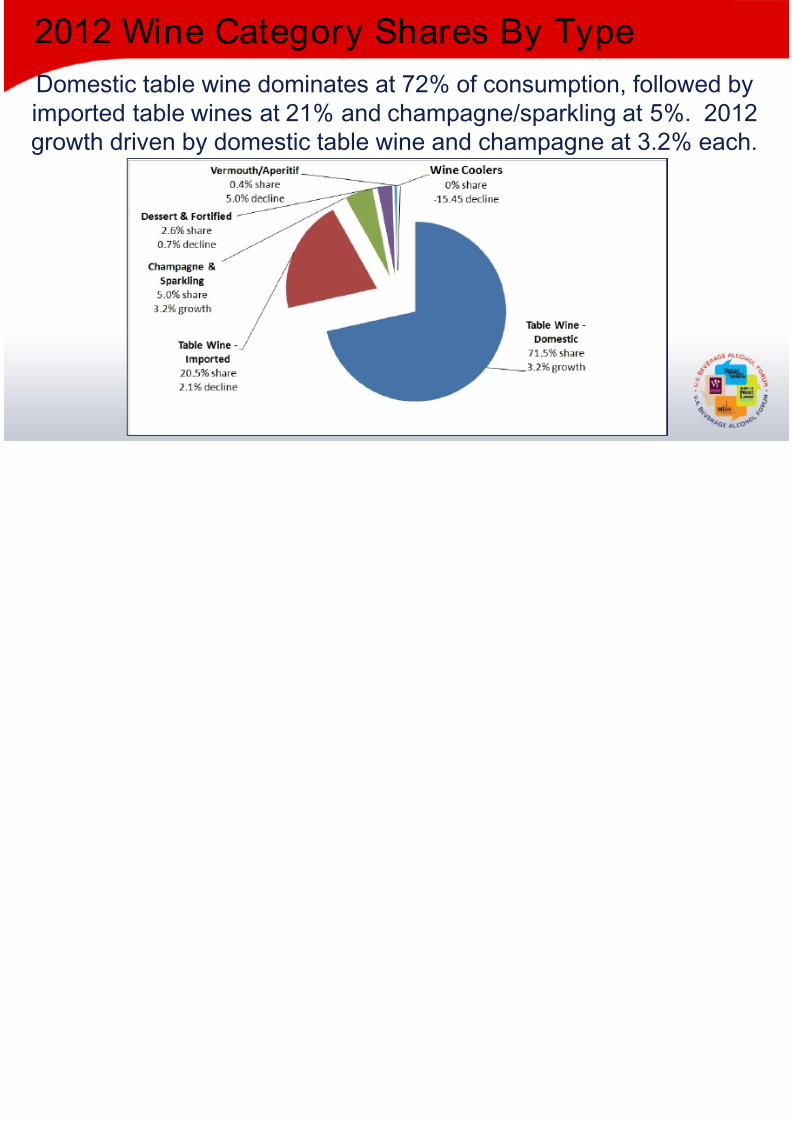
Domestic table wine dominates at 72% of consumption, imported table wines at 21% and champagne/sparkling a
growth driven by domestic table wine and champagne at
2012 Wine Category Shares By Type
2012 T 25 D ti T bl Wi B
8/20/2019 U.S. Beverage Alcohol Trends
http://slidepdf.com/reader/full/us-beverage-alcohol-trends 23/40
2012 Top 25 Domestic Table Wine B
The top selling as Franzia, Ba
and Carlo Rosall economy prselling betweemillion cases.
Premium pricedKendall-JacksoChateau Ste MMénage a Troithe 25 and aregrowth drivers.
2012 Top 25 Imported Table Wine Br

8/20/2019 U.S. Beverage Alcohol Trends
http://slidepdf.com/reader/full/us-beverage-alcohol-trends 24/40
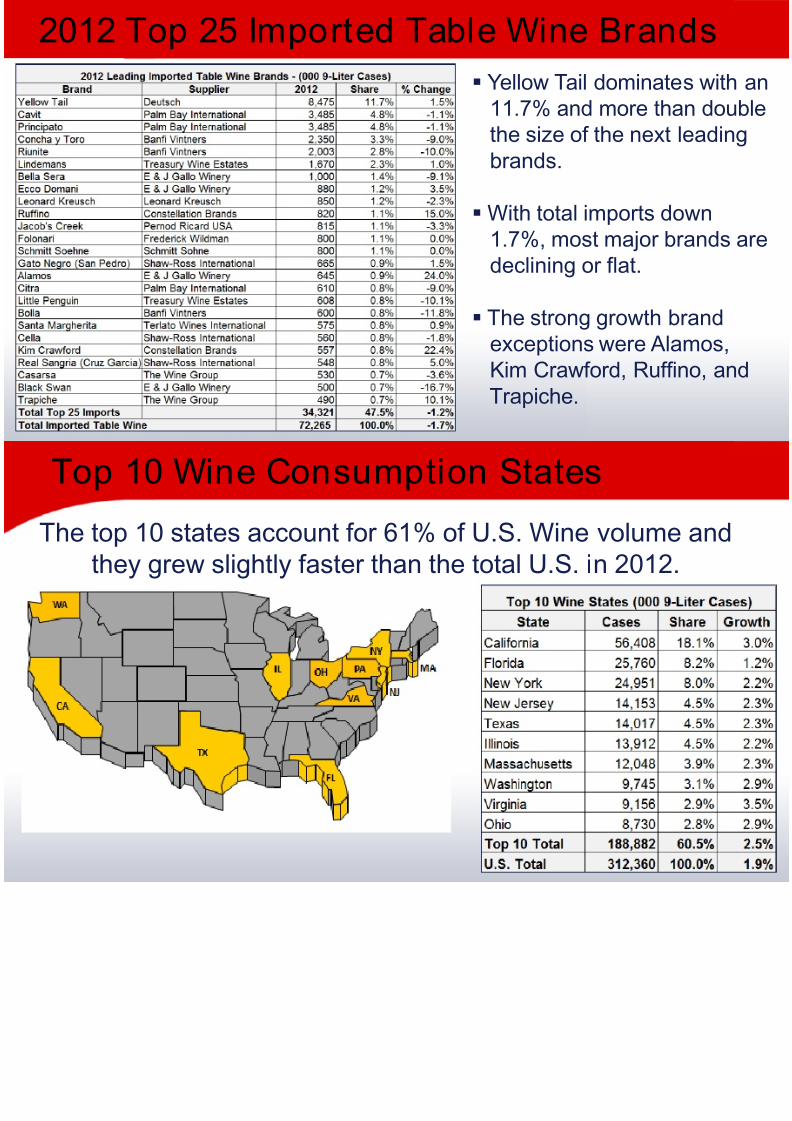
2012 Top 25 Imported Table Wine Br
Yellow Tail dom11.7% and mo
the size of the brands.
With total impo1.7%, most madeclining or fla
The strong growexceptions werKim Crawford, Trapiche.
Top 10 Wine Consumption States
8/20/2019 U.S. Beverage Alcohol Trends
http://slidepdf.com/reader/full/us-beverage-alcohol-trends 25/40
The top 10 states account for 61% of U.S. Wine volthey grew slightly faster than the total U.S. in 2
Top 10 Wine Consumption States
Wine Imports By Country
8/20/2019 U.S. Beverage Alcohol Trends
http://slidepdf.com/reader/full/us-beverage-alcohol-trends 26/40
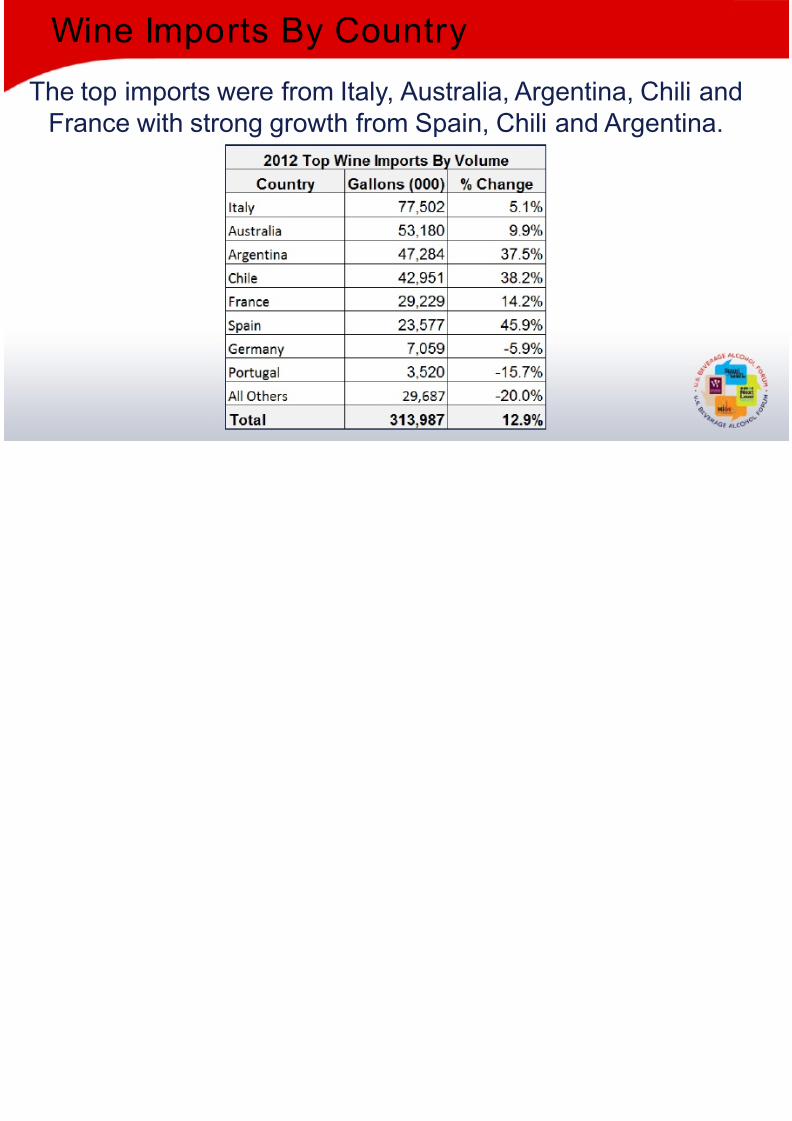
Wine Imports By Country
The top imports were from Italy, Australia, ArgentinaFrance with strong growth from Spain, Chili and Ar
8/20/2019 U.S. Beverage Alcohol Trends
http://slidepdf.com/reader/full/us-beverage-alcohol-trends 27/40
Spirit Category Trends
U S Total Spirits Sales Volume Tre
8/20/2019 U.S. Beverage Alcohol Trends
http://slidepdf.com/reader/full/us-beverage-alcohol-trends 28/40
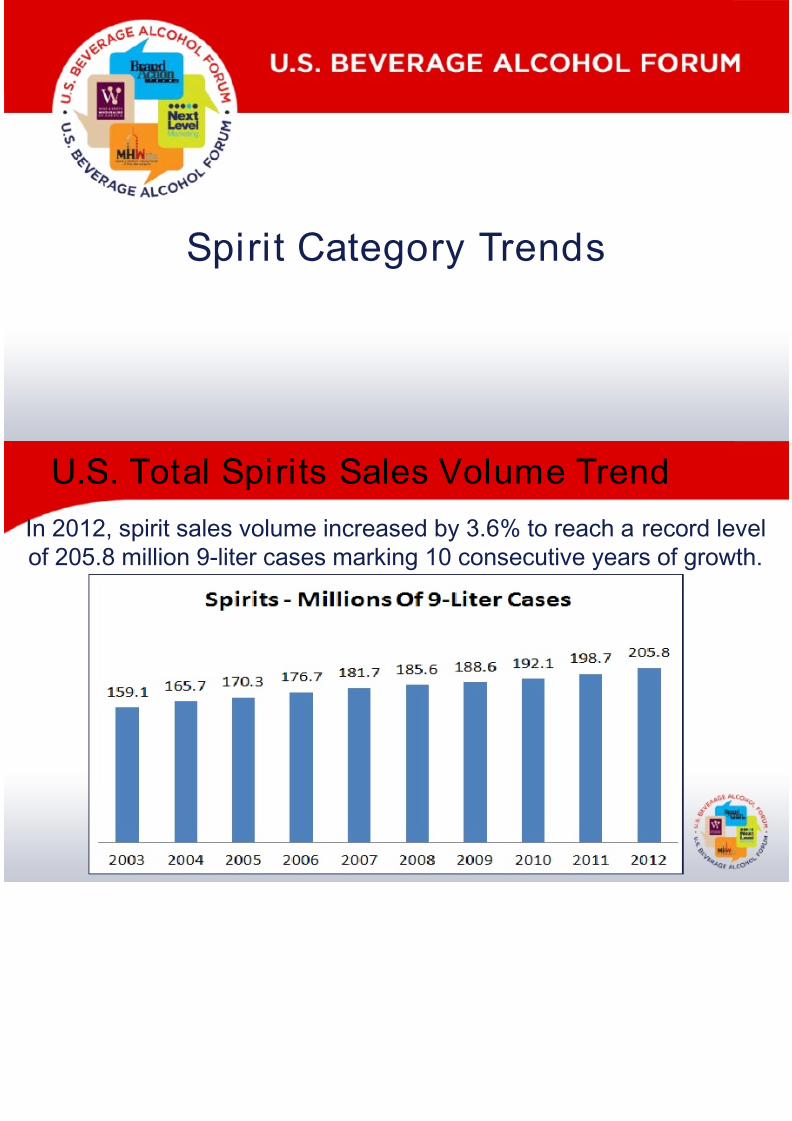
In 2012, spirit sales volume increased by 3.6% to reach aof 205.8 million 9-liter cases marking 10 consecutive yea
U.S. Total Spirits Sales Volume Tre
2012 Spirits Category Shares By Ty
8/20/2019 U.S. Beverage Alcohol Trends
http://slidepdf.com/reader/full/us-beverage-alcohol-trends 29/40
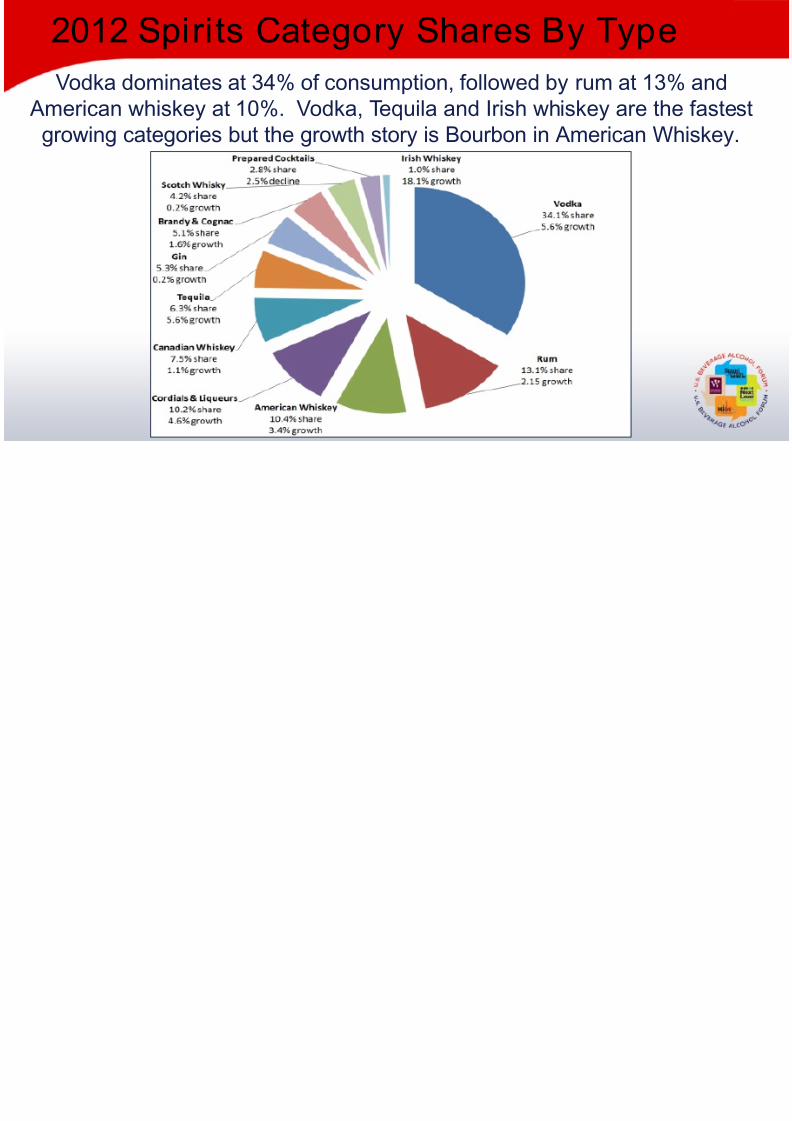
Vodka dominates at 34% of consumption, followed by rum a American whiskey at 10%. Vodka, Tequila and Irish whiskey a
growing categories but the growth story is Bourbon in America
2012 Spirits Category Shares By Ty
2012 Spirit Trends By Price Segmen
8/20/2019 U.S. Beverage Alcohol Trends
http://slidepdf.com/reader/full/us-beverage-alcohol-trends 30/40
2012 Spirit Trends By Price Segmen
The Super-premium and Ultra-premium segments account fspirits volume and continue to be the fastest growing segm
consumers look to trade-up across total spirits.
Source: 2013 Beverage Information Group Handbook Advance for volume share and Nielsen: XAOC+Liq+Conv+Mil – ex WA; through 01/05/13
Flavored Spirits Driving Category G

8/20/2019 U.S. Beverage Alcohol Trends
http://slidepdf.com/reader/full/us-beverage-alcohol-trends 31/40
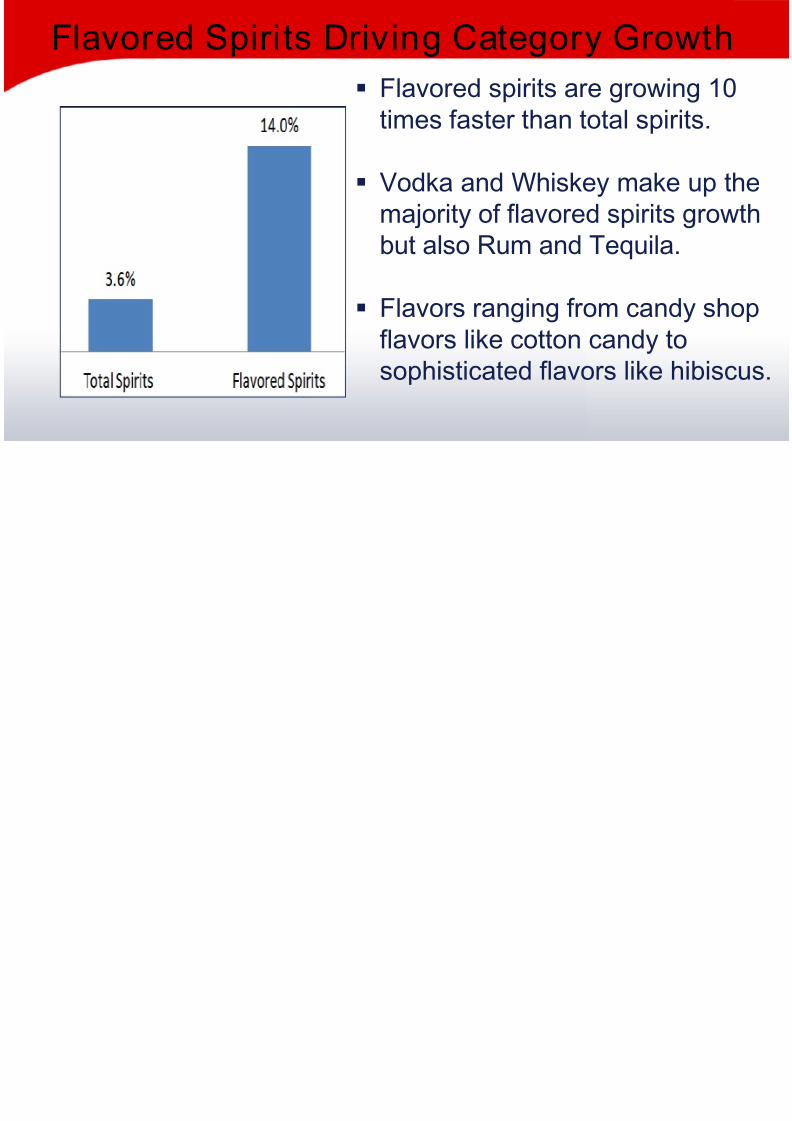
Flavored Spirits Driving Category G
Flavored spirits are grtimes faster than total
Vodka and Whiskey mmajority of flavored spbut also Rum and Teq
Flavors ranging from cflavors like cotton cansophisticated flavors l
2012 Top 25 Spirit Brand Trends

8/20/2019 U.S. Beverage Alcohol Trends
http://slidepdf.com/reader/full/us-beverage-alcohol-trends 32/40
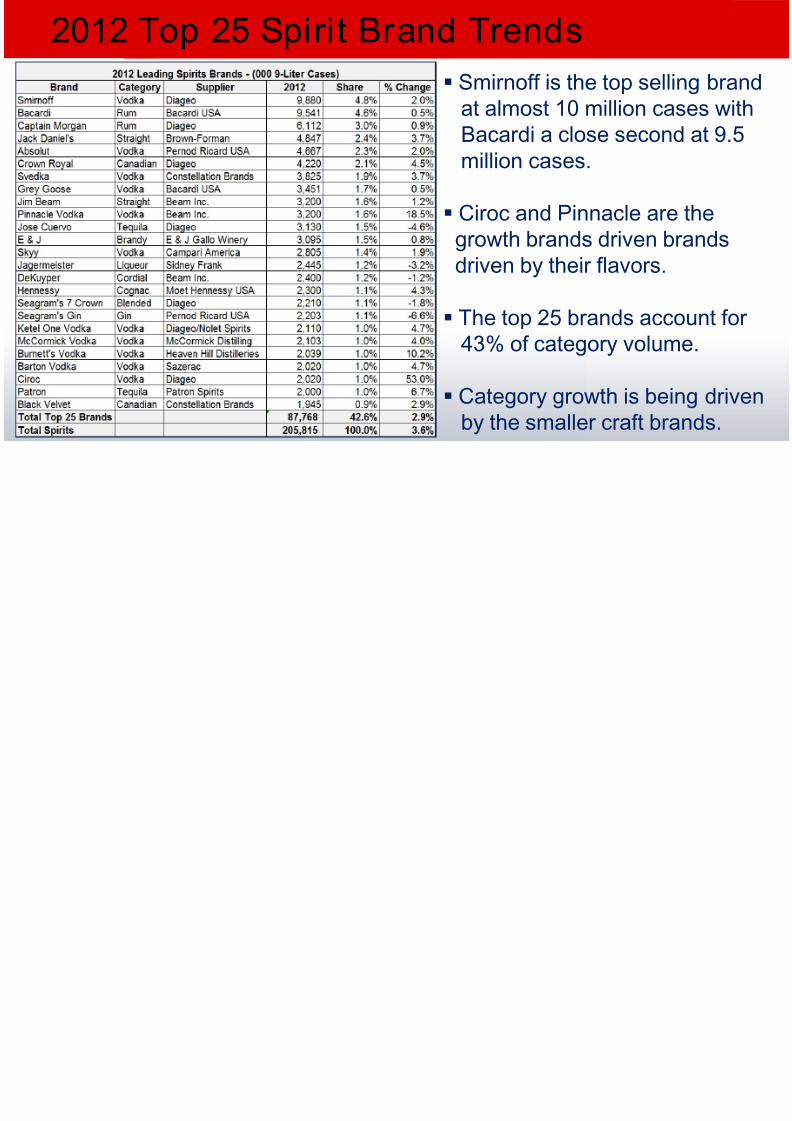
2012 Top 25 Spirit Brand Trends
Smirnoff is the topat almost 10 millioBacardi a close semillion cases.
Ciroc and Pinnaclgrowth brands drivdriven by their flav
The top 25 brands43% of category v
Category growth i
by the smaller cra
2012 Top Vodka Brands

8/20/2019 U.S. Beverage Alcohol Trends
http://slidepdf.com/reader/full/us-beverage-alcohol-trends 33/40
2012 Top Vodka Brands
Total of 70.2
34.1% of to
Growth of 5
Top 10 branfor 51% of c
Pinnacle is
growing bradriven by th
All other braccount forcategory an
2012 Top Rum Brands

8/20/2019 U.S. Beverage Alcohol Trends
http://slidepdf.com/reader/full/us-beverage-alcohol-trends 34/40
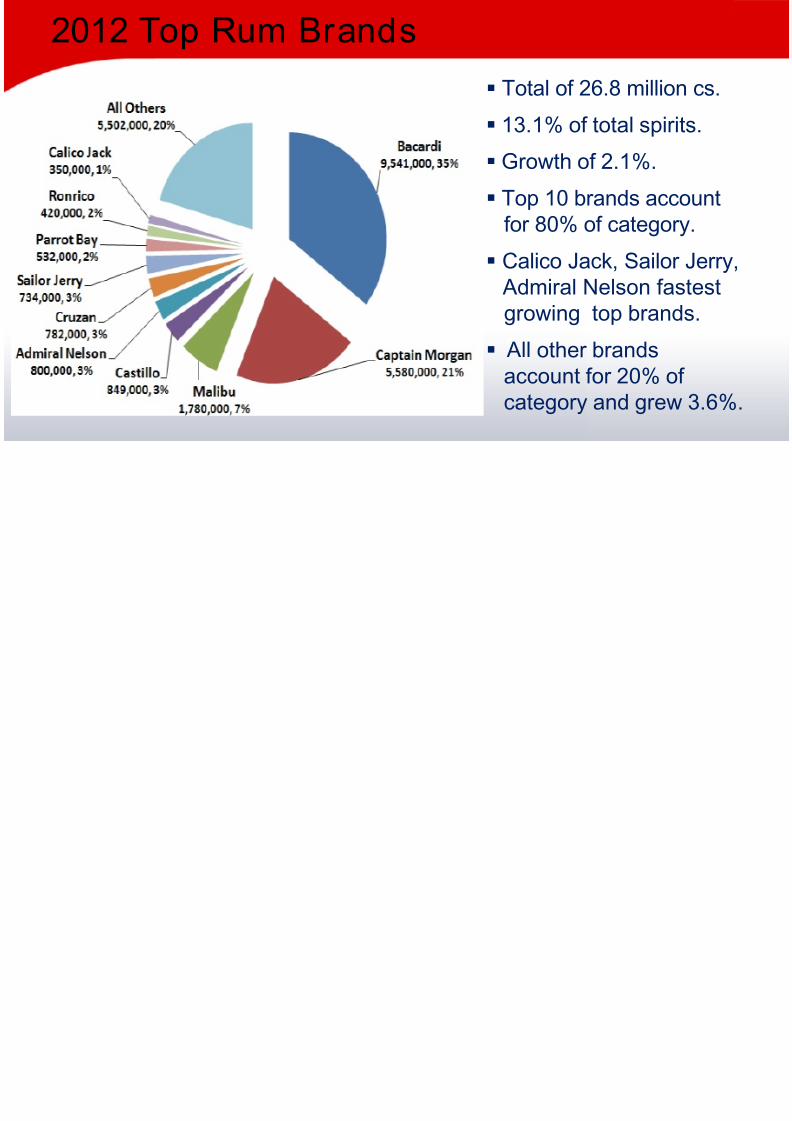
2012 Top Rum Brands
Total of 26.8 m
13.1% of tota
Growth of 2.1
Top 10 brandfor 80% of ca
Calico Jack, S
Admiral Nelsogrowing top
All other branaccount for 2category and
2012 Top Cordial / Liqueur Brands

8/20/2019 U.S. Beverage Alcohol Trends
http://slidepdf.com/reader/full/us-beverage-alcohol-trends 35/40
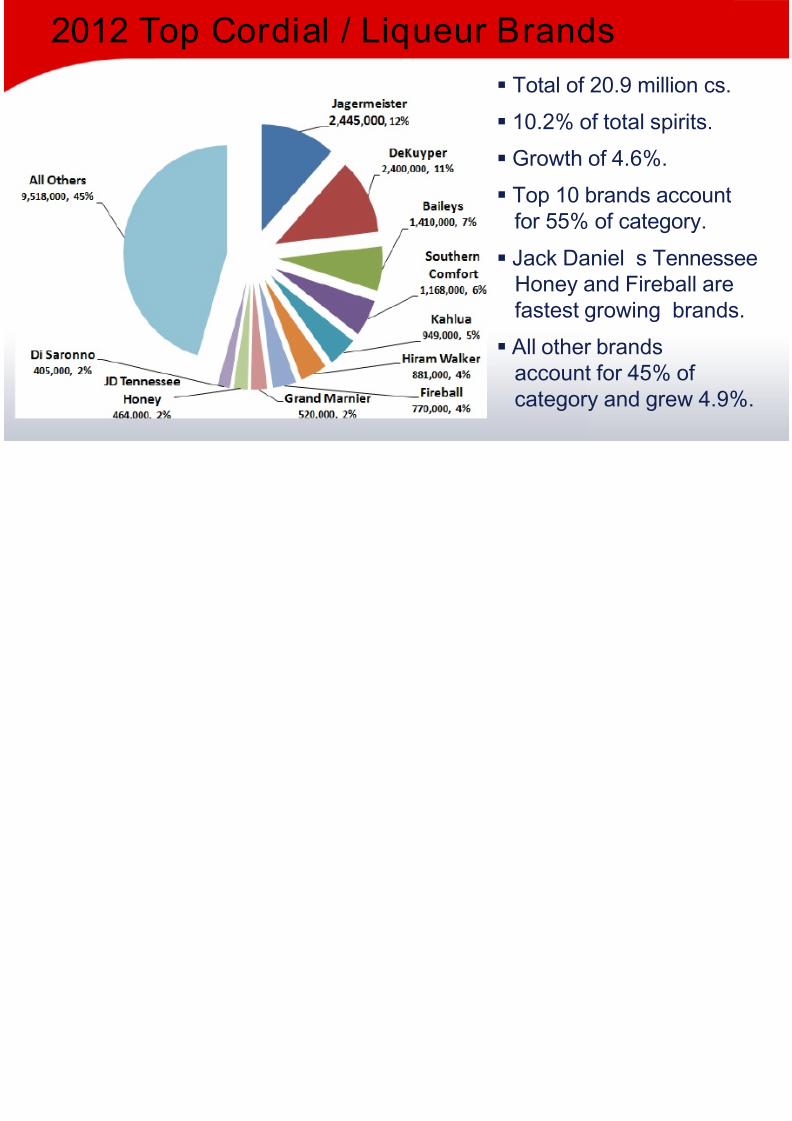
2012 Top Cordial / Liqueur Brands
Total of 20.9
10.2% of tota
Growth of 4.
Top 10 brandfor 55% of c
Jack Daniel’
Honey and Ffastest grow
All other braaccount for 4category and
2012 Top Straight American Whiske

8/20/2019 U.S. Beverage Alcohol Trends
http://slidepdf.com/reader/full/us-beverage-alcohol-trends 36/40
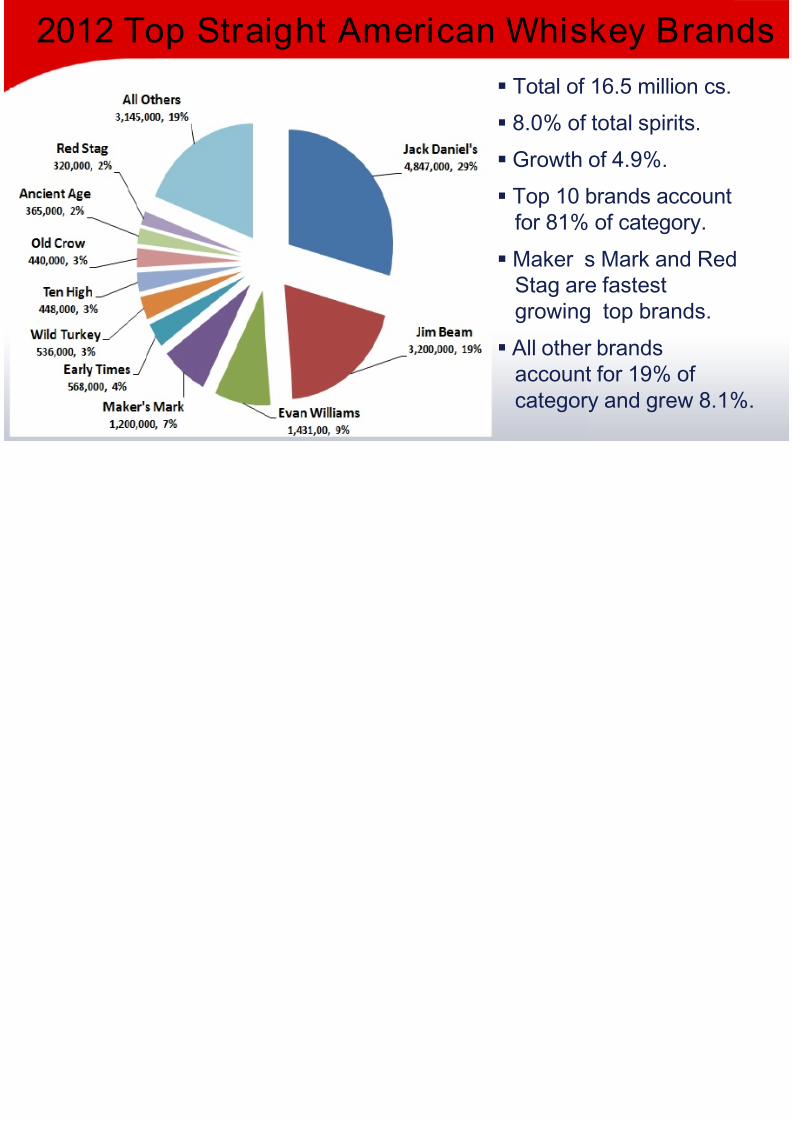
2012 Top Straight American Whiske
Total of 16.5
8.0% of tota
Growth of 4.
Top 10 brandfor 81% of c
Maker ’s Ma
Stag are fasgrowing top
All other braaccount for category an
2012 Top Tequila Brands

8/20/2019 U.S. Beverage Alcohol Trends
http://slidepdf.com/reader/full/us-beverage-alcohol-trends 37/40
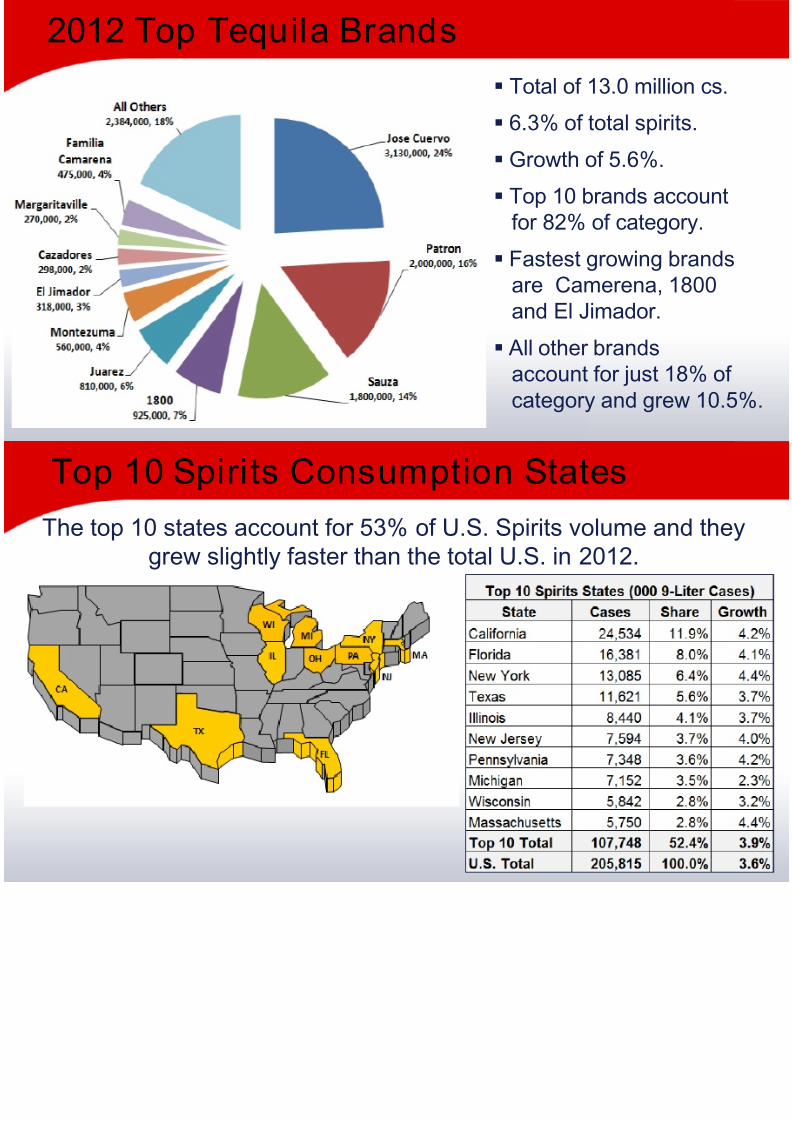
2012 Top Tequila Brands
Total of 13.0
6.3% of total
Growth of 5.6
Top 10 brandfor 82% of ca
Fastest grow
are Camereand El Jimad
All other branaccount for jcategory and
Top 10 Spirits Consumption States

8/20/2019 U.S. Beverage Alcohol Trends
http://slidepdf.com/reader/full/us-beverage-alcohol-trends 38/40
The top 10 states account for 53% of U.S. Spirits volumgrew slightly faster than the total U.S. in 2012
Top 10 Spirits Consumption States
Mixology Trends Shaping The Indus

8/20/2019 U.S. Beverage Alcohol Trends
http://slidepdf.com/reader/full/us-beverage-alcohol-trends 39/40
Mixology Trends Shaping The Indus
Continued growth of the Vodka Category
Resurgence of the Bourbon category
Premiumization across all categories
The explosion of flavor across all categories
Micro distilleries, breweries and wineries
Dramatic increase in new product innovation
Mixology Panel

8/20/2019 U.S. Beverage Alcohol Trends
http://slidepdf.com/reader/full/us-beverage-alcohol-trends 40/40
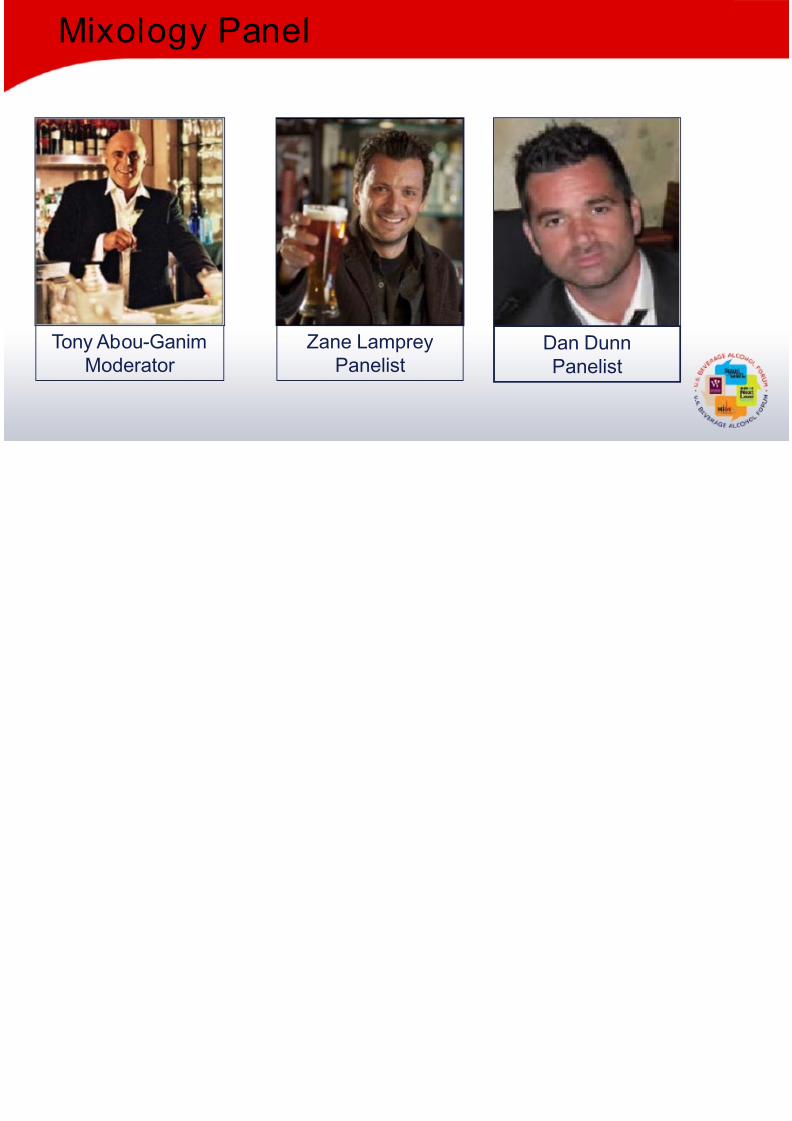
Mixology Panel
Tony Abou-GanimModerator
Zane LampreyPanelist
Dan DunnPanelist