U.S. Army Land Condition-Trend Analysis (LCTA) Plot ... · PDF fileFIGURES Number Page 1 U.S....
64
AD-A247 931 USACERL Technical Report N-92/03 February 1992 US Army Corps of Engineers Construction Engineering Research Laboratory U.S. Army Land Condition-Trend Analysis (LCTA) Plot Inventory Field Methods ~DTIC byIC David J. Tazik ___I_ Steven D. Warren U ELECT . of Victor E. Diersing MAR27 1992 Robert B. Shaw D Robert J. Brozka Calvin F. Bagley William R. Whitworth The U.S. Army is faced with a unique challenge in managing the lands on its installations, in meeting its needs for training land, and also in meeting environmental compliance recommen- dations and requirements. The Land Condition- Trend Analysis (LCTA) program uses standard methods to collect, analyze, and report natural resources data, and is the Army's standard for land inventory and monitoring. This report outlines standard methods for col- lecting and maintaining a permanent LCTA data base on the condition of Army land resources. Included are lists of equipment needed for data collection, and detailed procedures for establish- ing permanent field plots, collecting plant speci- mens, inventorying wildlife populations, and maintaining the data bases by periodic short- and long-term monitoring of the field plots. 92-07793 Approved for public release; distribution is unlimited. 1 11 iiliIiIuliI1il!U
Transcript of U.S. Army Land Condition-Trend Analysis (LCTA) Plot ... · PDF fileFIGURES Number Page 1 U.S....

AD-A247 931USACERL Technical Report N-92/03February 1992
US Army Corpsof EngineersConstruction EngineeringResearch Laboratory
U.S. Army Land Condition-TrendAnalysis (LCTA) Plot InventoryField Methods
~DTICbyICDavid J. Tazik ___I_
Steven D. Warren U ELECT . ofVictor E. Diersing MAR27 1992Robert B. Shaw DRobert J. BrozkaCalvin F. BagleyWilliam R. Whitworth
The U.S. Army is faced with a unique challengein managing the lands on its installations, inmeeting its needs for training land, and also inmeeting environmental compliance recommen-dations and requirements. The Land Condition-Trend Analysis (LCTA) program uses standardmethods to collect, analyze, and report naturalresources data, and is the Army's standard forland inventory and monitoring.
This report outlines standard methods for col-lecting and maintaining a permanent LCTA database on the condition of Army land resources.Included are lists of equipment needed for datacollection, and detailed procedures for establish-ing permanent field plots, collecting plant speci-mens, inventorying wildlife populations, andmaintaining the data bases by periodic short-and long-term monitoring of the field plots.
92-07793Approved for public release; distribution is unlimited. 1 11 iiliIiIuliI1il!U

The contents of this report are not to be used for advertising, publication,or promotional purposes. Citation of trade names does not constitute anofficial endorsement or approval of the use of such commercial products.The findings of this report are not to be construed as an officialDepartment of the Army position, unless so designated by other authorizeddocuments.
DESTROY THIS REPORT WHEN IT IS NO LONGER NEEDED
DO NOT RETURN IT TO THE ORIGINATOR

REPORT DOCUMENTATION PAGE Form Appov.I OMB No. 0704-0188
Publc rsporting burdin for this colecton i dinfoaration in etimated to aoseage I hour Per response. including the time for reviewing inetuoidons, searching existing data sourcos.gatherng and mintaining the data needed, and oorrngeling and revwing the oollktion of intornation. Send coninunts regarding this burden stirnmte or any other aspect o thiscokedion d knfrmeio inud ntg s"gesions for mducng this burden. to Washington Headquartem SerMe. Diretorae for inforrmti Operations and Reports. 1215 JeffersonDavis Highway. Suie 1204. Adington, VA '2 2.4302- and to the Offioe of Maragement and Budget. Peoawork Reduction Proeot (0704-016118). Washington. DC 20503.
1. AGENCY USE ONLY (Leave Blank) 2. REPORT DATE REPORT TYPE AND DATES COVERED
February 1992 Final4. TITLE AND SUBTITLE 5. FUNDING NUMBERS
U.S. Army Land Condition-Trend Analysis (LCTA) Plot Inventory Field
Methods FAD No. 89-080046
6. AUTHOR(S)
David J. Tazik, Steven D. Warren, Victor E. Diersing, Robert B. Shaw,Robert J. Brozka, Calvin F. Bagley, William R. Whitworth
7. PERFORMING ORGANIZATION NAME(S) AND ADDRESS(ES) 8. PERFORMING ORGANIZATIONREPORT NUMBER
USACERL USACERL TR N-92/03PO Box 9005Champaign, IL 61826-9005
9. SPONSORING/MONITORING AGENCY NAME(S) AND ADDRESS(ES) 10. SPONSORINGtMONITORING
AGENCY REPORT NUMBER
U.S. Army Engineering and Housing Support CenterATrN: CEHSC-FNFort Belvoir, VA 22060
11. SUPPLEMENTARY NOTES
Copies are available from the National Technical Information Service, 5285 Port Royal Road,Springfield, VA 22161.
12a. DISTRIBUTION/AVAILABILITY STATEMENT 12b. DISTRIBUTION CODE
Approved for public release; distribution is unlimited.
13. ABSTRACT (Maximum 200 words)
The U.S. Army is faced with a unique challenge in managing the lands on its installations, in meeting its needs for trainingland, and also in meeting environmental compliance recommendations and requirements. The Land Condition-Trend Analysis(LCTA) program uses standard methods to collect, analyze, and report natural resources data, and is the Army's standard forland inventory and monitoring.
This report outlines standard methods for collecting and maintaining a permanent LCTA data base on the condition of Armyland resources. Included are lists of equipment needed for data collection, and detailed procedures for establishing permanentfield plots, collecting plant specimens, inventorying wildlife populations, and maintaining the data bases by periodic short- andlong-term monitoring of the field plots.
14. SUBJECT TERMS 15. NUMBER OF PAGES
land use 66land condition-trend analysis is. PRICE CODE
17. SECURITY CLASSIFICATION 1l SECURITY CLASSIFICATION 19. SECURITY CLASSIFICATION 20. LIMITATION OF ABSTRACT
OF REPORT OF THIS PAGE OF ABSTRACT
Unclassified Unclassified Unclassified SARNSN 7540-01-280-5500 Statdard Form 298 (Rev. 2-8)
Pmecebod by ANSI Sd 239-1829.102

FOREWORD
The LCTA field procedures outlined in this report were developed at the request of the U.S. ArmyEngineering and Housing Support Center (USAEHSC), Fort Belvoir, VA, under Funding AcquisitionDocument (FAD) No. 89-080046, "Land Condition-Trend Analysis." The technical monitor was Mr.Donald M. Bandel (CEHSC-FN).
Research leading to the LCTA methods was performed by the Environmental Division (EN) of theU.S. Army Construction Engineering Research Laboratory (USACERL). The USACERL principalinvestigator was Victor E. Diersing. Thanks are given to the several researchers, field crew leaders, andtechnical assistants who contributed to the success of the LCTA program by helping to refine themethods, including USACERL personnel Mr. Timothy Blechl, Mr. Jeffrey Courson, Mr. Paul Dubois,Mr. Keith Harris, Dr. David Price, and Mr. V. Lyle Trumbull; and Colorado State University (CSU)personnel Ms. Christine Gordon, Mr. Eamon O'Regan, Ms. Dana Quinney, Mr. Keith A. Schulz, andMr. Gene Weglinski. Ms. Chris M. Bern, of CSU, and Ms. Cynthia Abrahamson, Mr. David Kowalski,and Mr. William Sprouse, of USACERL contributed to development of LCTA standardized analyses andreporting procedures. Special thanks are given to Mr. Dennis Herbert, of Fort Hood and Mr. ThomasWarren, of Fort Carson, who cooperated extensively in the preliminary development of the LCTAmethods. Dr. E.W. Novak is Acting Chief, USACERL-EN. The USACERL technical editor was Mr.William J. Wolfe, Information Management Office.
COL Daniel Waldo, Jr., is Commander and Director of USACERL, and Dr. L.R. Shaffer isTechnical Director.
2

CONTENTSPage
SF 298 1FOREWORD 2LIST OF FIGURES AND TABLES 4
INTRODUCTION ................................................... 7Background 7Objective 9Approach 9Mode of Technology Transfer 12
2 FIELD PLOT ESTABLISHMENT ..................................... 13Core Plots 13Special Use Plots 14Plot Establishment 14Plot Location Notebook 17Soil and Topographic Information 28
3 PLANT COLLECTION ............................................. 32
4 PLOTINVENTORY ................................................ 35Land Use 35Line Transect 35Belt Transect 41Wildlife Inventory 42
5 M ONITORING ................................................... 55Short-Term Monitoring 55Long-Term Monitoring 58
6 CONCLUSION .................................................... 60
METRIC CONVERSION TABLE 60
REFERENCES Accesion For 60
DISTRIBUTION NT.S CRA&IDiryU ,.o'.; .ef [
8 y
D i,; t ,,i ,-3 ." ..... . . . . . ..r

FIGURES
Number Page
1 U.S. Military Installations That Have Begun or Plan To Implement Land Condi-tion-Trend Analysis 10
2 Example of Core Plot Locations at the Pohakuloa Training Area, HI 15
3 Diagram of the Flanged Permanent Stake for Establishing the Location of AllLCTA Plots 16
4 Plot Map Form 19
5 Plot Inventory and Monitoring Log 20
6 Plot Locator 21
7 USGS Composite Map Key for Fort Riley, KS 23
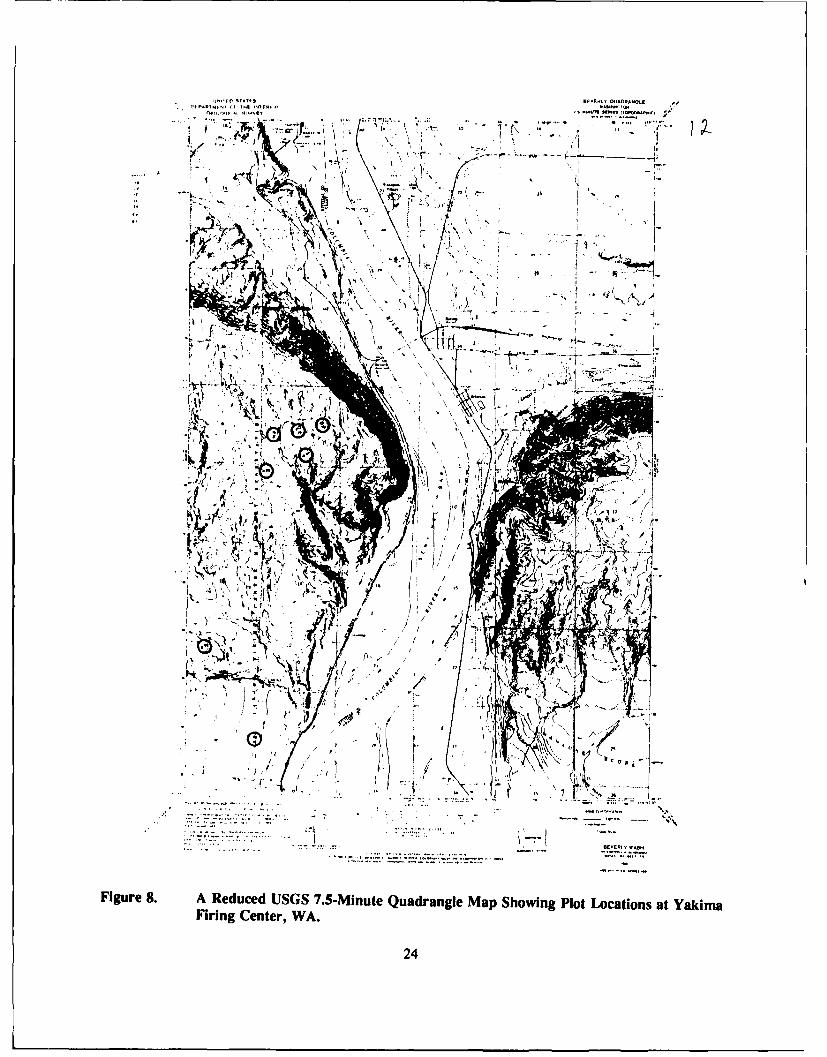
8 A Reduced USGS 7.5-Minute Quadrangle Map Showing Plot Locations at YakimaFiring Center, WA 24
9 A Plot Map Form of Fort Leonard Wood, MO With Sketches for the GeneralLocation Map and Specific Location Map 25
10 A Plot Map Form of Fort Hood, TX With an Enlarged Photocopy of a Part of theInstallation Map Substituted for a Hand-Sketched General Location Map 26
11 Photo Log 27
12 Rubber Stamp for Labeling the Back of LCTA Photographs 28
13 Photo Negative Log 29
14 Examples of Slope Length Measurements 31
15 A Pressed Herbarium Specimen With Label 33
16 Plant Collection Log 34
17 Land Use Form 36
18 The Eight Ground Cover Categories and the 1-m Measuring Rod Graduated inDecimeters Used To Quantify Ground and Aerial Cover 38
19 First Page of the Line Transect Form 39
20 First Page of the Belt Transect Form 43
4

FIGURES (Cont'd)
Number Page
21 LCTA Bird Survey Data Form 46
22 Small Mammal Trapping Configuration 48
23 LCTA Small Mammal Summary Data Form 49
24 LCTA Medium-Sized Mammal Data Form 50
25 LCTA Bat Survey Data Form 52
26 Pitfall Trap Configuration To Capture Reptiles and Amphibians on LCTA Plots 53
27 LCTA Herpetofauna Survey Data Form 54
28 Short-Term Monitoring Belt Transect Form 57
29 First Page of the Short-Term Monitoring Line Transect Form 59
TABLES
I Materials Needed To Establish LCTA Plots 16
2 Random Numbers (1-360) for Selecting Line Transect Azimuths for LCTA Plots 18
3 Materials Needed To Inventory LCTA Plots 35
4 Categories of Physical Disturbance Recorded on the Line Transect Form 40
5 Categories of Ground Cover Recorded on the Line Transect Form 40
6 Categories of Canopy Cover Recorded on the Line Transect Form 42
7 Criteria for Determining Belt Transect Width for Abundant Species on LCTAPlots 42
8 Materials Needed To Conduct LCTA Wildlife Inventories 45
9 Categories of Mated Status Recorded on the LCTA Bird Survey Data Form 47
10 Equipment Needed for Short-Term Monitoring of LCTA Plots 55
I1 Categories of Ground Cover and Canopy Cover Recorded During Short-TermMonitoring of LCTA Plots 58
5

U.S. ARMY LAND CONDITION-TREND ANALYSIS(LCTA) PLOT INVENTORY FIELD METHODS
1 INTRODUCTION
Background
The U.S. Army Land Condition-Trend Analysis (LCTA) program was developed at the U.S. ArmyConstruction Engineering Research Laboratory (USACERL) under the sponsorship of the U.S. ArmyEngineering and Housing Support Center (USAEHSC). LCTA uses standard methods to collect,analyze, and report natural resources data, and is the Army's standard for land inventory andmonitoring.' It is a major component of the Integrated Training Area Management (ITAM) program,also developed at USACERL. The three other components of ITAM include: (1) EnvironmentalAwareness, (2) Land Rehabilitation and Maintenance, and (3) Training Requirements Integration.
LCTA promotes the principles of sustained yield, land stewardship, and multiple use of militaryland resources. The major objectives of LCTA are to: (1) evaluate the capability of land to meet themultiple-use demands of the U.S. Army on a sustained basis, (2) delineate the biophysical and regulatoryconstraints to use of the land, (3) monitor changes in land resource condition and evaluate change interms of current land use, (4) develop and refine land management plans to ensure long-term resourceavailability, (5) characterize installation natural resources, and (6) implement standards in collection,analysis, and reporting of the acquired data that enable Army-wide data compilation.
Development and Army-wide implementation of the LCTA program has been driven by fourmajor factors: the Army's unique land management challenge, the need for sufficient training land,recommcndations of natural resource experts, and environmental compliance requirements.
The Unique Land Management Challenge
The U.S. Army is responsible for managing 12.4 million acres of land on 186 major installationsworld-wide. 2 While many of these lands are used for a variety of military training and testing activities,they also are managed for many nonmilitary uses, including fish and wildlife, forest products, recreation,agriculture, and grazing. Proper land management supports the military mission and multiple useactivities, but also presents the Army with a unique challenge as public land steward. Furthermore,Army installations span all North American ecoregions and habitat types, yielding a complex and diversemanagement challenge.
Technical Note 420-74-3, Army Land Inventory and Monitoring Procedures on Military Installations (U.S. Army Engineeringand Housing Support Center IUSAEHSCI. Fort Belvoir, VA, 1990).U.S. Dcpartmcnt of the Army (DA), Facilities Engineering and Housing Annual Summary of Operations, Fiscal Year 1989
(Office of the Assistant Chief of Engineers IOACE], USAEHSC. 1989).
7

Training Land Needs
The land area available to the Army is inadequate to meet existing training mission requirements. 3
This is a result of the need for more area to test and train personnel in the use of modem weaponsystems. The area now necessary to train a division is roughly 10 times that needed for trainingcomparable units in the mid-1940s.4 Furthermore, increased use of training lands in recent years hasled to reports of a general deterioration in the condition of the U.S. Army's natural resources.-
Expert Recommendations
In the spring of 1984, the U.S. Army convened an independent panel of natural resources expertsto evaluate and recommend changes to natural resource management programs on selected militaryinstallations and civil works projects. 6 The panel included experts in range science, wildlife manage-ment, and forestry. Among the 12 recommendations, four were to form the basis for development ofstandard inventory procedures for Army lands: (1) match training loads with land capabilities, (2) baseland management plans on current resource inventories and monitoring procedures, (3) require naturalresource inventories on all military installations, and (4) establish personnel at each military installationto minimize soil erosion and manage vegetation resources.
Environmental Compliance
The Army must comply with a variety of environmental regulations based on such legislation asthe National Environmental Policy Act, the Endangered Species Act, and the Clean Water Act. 7
Compliance requires a detailed record of the status of natural resources as well as change in response toland use over time. Furthermore, the Secretary of Defense has called upon the military to be the leaderin environmental compliance and natural resource management.! And, the commanding general of theU.S. Army Corps of Engineers stated that the Corps' service to the military should be measured by theCorps' success in environmental leadership and a commitment to go "beyond compliance" withenvironmental laws. 9
3 Training Circular (TC) 25-1. Training Land (DA, Washington. DC, 1978).4 TC 25-1.5 V.E. Dicrsing and W.D. Severinghaus, The Effects of Tactical Vehicle Training on the Lands of Fort Carson, CO-An
Ecological Assessment, Technical Report (TR) N-85/03/ADA152142 (U.S. Army Construction Engineering ResearchLaboratory [USACERL], December 1984); W.D. Goran, L.L. Radke, and W.D. Severinghaus, An Overview of the EcologicalEffects of Tracked Vehicles on Major US. Army Installations, TR N-142/ADA126694 (USACERL, February 1983); F.L.Johnson. "Effects of Tank Training Activities on Botanical Features at Fort Hood, Texas," Southwest Naturalist No. 27(1982). pp 309-314; D.J. Schaeffer et aL., TR N-86/22/ADA174502, Preliminary Study of Effects of Military ObscurantSmokes on Flora and Fauna During Field and Laboratory Exposures (USACERL, 1986); W.D. Severinghaus and W.D.Goran, TR N-1 16/ADAI 11201. Effects of Tactical Vehicle Activity on the Mammals, Birds, and Vegetation at Fort Lewis,Washington, (USACERL, November, 1981); W.D. Severinghaus, R.E. Riggins, and W.D. Goran, TR N-77/ADA073782Effects of Tracked Vehicle Activity on Terrestrial Mammals, Birds and Vegetation of Fort Knox, KY (USACEkL. July 1979).
6 L.R. Jahn, C.W. Cook, and J.D. Hughes, An Evaluation of US. Army Natural Resource Management Programs on .,-tectedMilitary Installations and Civil Works Projects (Unpublished) Report to the Secretary of the Army, U.S. Department of theArmy (1984).
7 M. Donnelly and J.G. Van Ness, "The Warrior and the Druid--DOD and Environmental Law," Federal Bar News andJournal, Vol 33, No. 1 (1986), pp 37-43.
S R. Cheney, Memorandum for Secretaries of the Military Departments. Subject: Environmental Management Policy(Washington. DC, 10 October 1989).
9 LTG H.J. Hatch, Memorandum, Subject: Strategic Direction for Environmental Engineering (Headquarters, U.S. Army Corpsof Engineers [HQUSACE, Washington, DC, 14 February 1990).
8

Preliminary development of LCTA field methods began in the summer of 1984 at Fort Carson, COand Fort Hood, TX. After evaluation and refinement of techniques in the fall and winter of 1984, a pilotimplementation program was begun at the Piflon Canyon Maneuver Site, CO and expanded at FortCarson and Fort Hood. A workshop was held at Fort Hood, TX in May of 1987 to review progress inprogram development, obtain input from installation natural resource personnel concerning the usefulnessof the information, and make plans for implementation on other installations. In 1987, USAEHSCrecommended Army-wide implementation.
Review of the LCTA program by the U.S. Army Land Inventory Advisory Committee found thatthe methods were technically sound, and that the information generated had applications for landmanagers and trainers, environmental compliance documentation, and land acquisition evaluation. Thecommittee also reported that it would be less costly to implement the program than to restore trainingland resources lost or damaged through noncompliance."
The LCTA program has the support of the Assistant Secretary of the Army"1 as well as a varietyof organizations including the National Military Fish and Wildlife Association 2 and the DefenseNatural Resources Council.' 3 Over 50 military installations and training areas in the United States andGermany have begun or plan to implement the program (Figure 1 shows thirty-nine of these). FortCarson, one of the first locations to implement LCTA, recently won the National Wildlife Federation'sNational Conservation Achievement Award, 4 and Fort Sill won the 1989 DOD Natural ResourcesConservation Award with the help of the ITAM and LCTA programs.' 5
Part of the success of the LCTA program is due to its systematic approach to land management,and commitment to careful collection and maintenance of land condition-trend data over time. To begina land condition-trend analysis, Army installation resource personnel must first establish core plots anda standardized system for gathering and analyzing data, which will be maintained as a permanent database.
Objective
The objective of this report is to describe standard methods to establish LCTA field plots; collectdata on soils, vegetation, and wildlife; and maintain that data for short- and long-term use.
Approach
The LCTA plot inventory employs standard methods, permanent field plots, stratified randomsampling, and emphasizes multiple applications of the data collected.
U.S. Army Land Inventory Advisory Committee, Report of LCTA Review (Washington, DC, 1989).
J.W. Shannon, Memorandum for Director of the Army Staff. Subject: Land Management-Action Memorandum (Washington,D)C. 18 August 1987).
"National Military Fish and Wildlife Association, "Resolution 2-Military Land Inventory and Monitoring," Fish and WildlifeNews. Vol 5. No. 2 (1988).
"C. Ramsey. Memorandum for Deputy Director, Defense Research and Engineering. Subject: Training Area ManagementTechnology (Washington, DC, 1 March 1989).
" U.S. Army Engineering and Housing Support Center (USAEHSC), "Fort Carson Wins National Conservation AchievementAward," DEll Digest, Vol 2, No. 3 (Fort Belvoir, VA, 1989). p 28.P. Schmitt. "Corps Program Helps with Award for Fort Sill," Engineer Update, No. 14 (1990).
9

00
CL CC
ACO z0 0
MWQ
I.- w 0
0 n CL0N
00
4.,u
LL CC
UI-
<~ m 0 0 .. 5ow 00
0'
Ow 06 La cc3
2A LL.
P.10
Standard data collection and recording methods are summarized to allow Army-wide datacomparability, and to enable data summary at MACOM and DA levels, and database systemcompatibility. This also minimizes system development and maintenance costs. Such standardizationalso helps lessen the negative effect of turnover of Army natural resources management personnel,minimizes program training needs, and creates a common natural resources language.
Procedures are given for establishing permanent field plots to quantify the condition of and trendsin installation natural resources. Permanent plots are advantageous in regard to both cost and the powerof statistical analysis. Time and labor are saved by allowing a return to the same location each year thusavoiding the need to reestablish sample plots annually. Statistical analyses are made more effective byeliminating variability in the data attributable to spatial variation, thus facilitating the detection of trends.This reduces the total number of plots necessary to determine trends, resulting in additional cost savings.Data are collected on soils, slope, aspect, surface disturbance, vegetation cover, botanical composition,wildlife, and land use.
The procedures were designed to include random sampling, which allows statistical inferences tobe made based on the data collected, and permits characterization of installation natural resources as awhole. Sampling is stratified on the basis of soils and land cover types (derived from satellite imagery),facilitating analysis of natural resource status and land capability by those spatial elements.
The ability to derive multiple interpretations of the data has been a foremost considerationthroughout the development and implementation of LCTA. The data can be used to quantify land use,ground cover, and surface disturbance, 6 allowable use and carrying capacity, 7 tactical concealment,soil stability and soil erosion, 8 land rehabilitation effectiveness, 9 plant community compositionwildlife populations and habitats 20 and endangered species habitats.2
1 It can also be used to ground-truth geographic information system and satellite imagery data.'
16 R.B. Shaw and V.E. Diersing. "Tracked Vehicle Impacts on Vegetation at the Pifion Canyon Maneuver Site. Colorado,"Journal of Environmental Quality, No. 19 (1990), pp 234-243; R.B. Shaw et al., "U.S. Army Land Condition/Trend Analysisof the Pohakuloa Training Area, Hawaii," Proceedings of the International Symposium on Tropical Hydrology (AmericanWater Resources Association. Bethesda, MD. 1990). pp 455-46.
" V.E. Diersing, R.B. Shaw, S.D. Warren, and E.W. Novak. "User's Guide for Estimating Allowable Use of Tracked Vehicleson Non-Wooded Military Training Lands," Journal of Soil and Water Conservation, No. 43 (1988), pp 191-195; R.B. Shawand V.E. Diersing, "Allowable Use Estimates for Tracked Vehicular Training on Pifion Canyon Maneuver Site. Colorado,USA," Environmental Management, No. 13 (1989), pp 773-782.
18 S.D. Warren, V.E. Diersing. P.J. Thompson, and W.D. Goran, "An Erosion-Based Land Classification Scheme for MilitaryInstallations." Environmental Management, No. 13 (1989), pp 251-257.R.B. Shaw and V.E. Diersing, Unpublished Report, Evaluation of Pitting and Seeding on the Pihon Canyon ManeuverSite. ('olorado (LISACERL. 1987).D.J. Tazik, W.R. Whitworth. and V.E. Diersing. "Using the LCTA Relational Database for Plant Community Classificationand Wildlife Management," Abstract presented at the Annual Meeting of the American Society of Agronomy. Las Vegas, NV(1989).
2 K.A. Schulz. R.B. Shaw, and D.J. Tazik, "Status of Ilaplopappusfremonii A. Gray subsp. monocephalus (A. Nels.) H. M.Hall (A.teraceae) on the U.S. Army Pifion Canyon Maneuver Site, Colorado, Phytologia (submitted for publication. 1991).
2 S. Ribansiky. Draft TR, Monitoring Vegetation Change With SPOT Satelhte Imagery (USACERL, December 1990).
11

Mode of Technology Transfer
It is recommended that LCTA be' incorporated into Army Regulation (AR) 420-74, NaturalResources-Land, Forest, and Wildlife Management, which is currently under revision. The U.S. ArmyEngineering and Housing Support Center (USAEHSC) sponsors annual LCTA training workshops,conducted by USACERL staff, for Army Resource Management personnel.
12

2 FIELD PLOT ESTABLISHMENT
The standard size of the LCTA permanent plot is 100 x 6 m with a 100-m line transect formingthe longitudinal axis. The elongated, rectangular plot shape is preferred because it exhibits lowervariance and greater sampling efficiency compared to other shapes,2 3 and tends to include more speciesthan plots with a lower perimeter to area ratio.24 Land use is recorded on each plot, and woody plantsare recorded to provide density estimates and document trends in tactical and wildlife cover. The linetransect is used to quantify ground cover, canopy cover, and surface disturbance. Wildlife data arecollected at a subsample of these plots.
Core Plots
Core plots are used to evaluate the condition of natural resources on the installation, and serve asthe basis for the national inventory, including MACOM and DA summaries. They are located in anobjective, random manner, to ensure that the data are representative of the installation as a whole.
Placement of Core Plots
Core plot locations are chosen using an automated site selection process designed to ensureobjectivity, randomness, and representation. 25 The procedure incorporates SPOT (Systeme Probatoirepour l'Observation de la Terre) satellite imagery,* digital soil surveys, and the Geographic ResourcesAnalysis Support System (GRASS) geographic information system (GIS). The first step is to acquiresatellite imagery for the installation. The date of the imagery should correspond to peak phytomass. Anunsupervised classification is performed on the image allowing the selection of up to 20 landcovercategories based on reflectance values in the green, red and near infrared wavelength bands. Thesebands are among the best for distinguishing differences in plant biomass, cover, and species composi-tion."
Within GRASS, the resulting landcover data layer is superimposed on a digital soil survey of thearea. Each unique landcover/soil combination is recognized as a separate category, and the occurrenceof each landcover/soil combination, called a polygon, is identified. Polygons of less than 2 hectares areeliminated because, in practice, they are difficult to locate in the field.
Core plot locations are selected using a procedure that assigns plots randomly to the array of allpolygons that comprise each landcover/soil category, resulting in a random stratification by soil and landcover type. The number of plots assigned to each category is proportional to the land area included ineach. For example, a landcover/soil category covering 10 percent of the installation would receive 10percent of the plots. This procedure helps ensure that the data collected are representative of the
C.W. Cook and J. Stubbendieck, eds.. Range Research: Basic Problems and Techniques (Society for Range Management,Denver, CO. 1986).C.D. Bonham, Measurement of Terrestrial Vegetation (John Wiley & Sons, New York, 1989).
2* S.D.Warren, M.O. Johnson, W.). Goran, and V.E. Diersing, "An Automated, Objective Procedure for SelectingRepresentative Field Sample Sites," Photogrammetric Engineering and Remote Sensing, No. 56 (1990), pp 333-335.
* LANDSAT imagery also may be used. On small installations, available aerial photography may be used, in which caseland cover is delineated manually.J.H. Jensen. Introductory Digital Image Processing (Prentice-Hall. Englewood Cliffs. NJ. 1986).
13

installation as a whole. Field crews are provided with plastic overlays registered to U.S. GeologicSurvey (USGS) 7.5-minute quadrangle maps. The overlays are color-printed with all eligible polygons.Large symbols identify the locations of the core plots (Figure 2). The field crews are responsible forestablishing the plots as near as possible to the locations identified on the overlays. Global positioningsystems, which triangulate signals from satellites, are useful in areas where landmarks are scarce. Whena plot location is inaccessible, the field crew leader may substitute a comparable location that has thesame landcover/soil combination and similar aspect and slope.
Number of Core Plots
The number of core plots established at any given installation should be based on the size andvariability of the area. Unfortunately, variability is difficult to evaluate prior to field sampling. As arule of thumb, there should be approximately one plot per 200 hectares. For large installations, wherethis results in an unmanageable number of plots, a limit of 200 core plots is suggested. This is about asmany plots as two field crews can establish and inventory during a single field season.
Special Use Plots
As the name implies, special use plots are for use in special situations. They do not comprise partof the national inventory and should be excluded when making installation-wide evaluations of landcondition. Special use plots are used to deal with specific issues that cannot be addressed by core plots-determining the success of land rehabilitation efforts, documenting the effects of burning, assessingnatural recovery of degraded lands, characterizing and monitoring habitat of threatened and endangeredspecies and wetlands, etc.
Special use plots can be used as control plots if they can be placed in areas that receive little or nomilitary impact. Such plots can be used to differentiate changes documented on core plots caused byland uses and environmental factors. There is no rule for determining the number of control plots. Onsome military installations, it may be difficult to find unused areas.
Plot Establishment
Once the plot has been located in the field, the line transect is established with the beginning pointset as close as possible to the Universal Transverse Mercator (UTM) coordinates provided. Table 1 listsequipment needed to establish permanent plots. The beginning point is marked with a threaded 0.5-in."interior diameter pipe with a 3.5-in. floor flange attached to the top. The flange serves to make the pipeeasier to locate with a metal detector. The length of the stake is approximately 0.5 m, but may beshorter in areas with shallow soil.
A small, 5 to 8-cm deep depression is dug and the pipe driven into the ground until the flange isflush with the bottom of the depression (Figure 3). Another pipe is placed on the center of the floorflange and struck with the hammer to avoid breaking the flange. A steel rod is then driven through thecenter of the pipe until about 2 cm remains above the soil surface. The depression is refilled so thatonly the top of the rod is visible.
A metric conversion table is included on p 60.
14

< CC
caw
CPC
Orr
LC
I L-
Ir 7..
15

Table 1
Materials Needed To Establish LCTA Plots
• Small spade or mattock* Permanent stake• 4-lb hammer* Five 0.5-m lengths of 6-am steel rod per plot* Sighting compass* 100-m measuring tape
I 1 to 4 heavy-duty clips* 35-mm camera with color print film (100 ASA preferred)* Plot map forms* Photo logs* Clipboard* #2 lead pencil
I 1-liter sealable plastic bags for soil samples* Aluminum tags• Clinometer* Handheld computer (recommended)* Global positioning system (optional)
5-8 cm (2-3") Depression 6mm (1/4") Smooth RodSoil Surface - cm Soil Surface
8cm (3 1/2") DiameterFloor Flange
Inset v., 1.3cm (1/2") DiameterPipe Pipe 0.45m (18") Long
Figure 3. Diagram of the Flanged Permanent Stake for Establishing the Location of All
LCTA Plots.
16

It is important to make LCTA plots as inconspicuous as possible. Fence posts, flags, and coloredmarkers may attract attention and create a bias in the land uses in the area of the plots. Although theplots are inconspicuous, they can be relocated by field crews using properly prepared maps, metaldetectors and, if necessary, a global positioning system (see "Plot Location Notebook," p 17).
After the beginning point has been established, the azimuth of the plot is selected randomly.Standing over the stake, a circle is envisioned around the point with a radius of 100 m. Portions of thecircle falling outside the landcover/soil polygon are eliminated and the arc of the remaining portion ofthe circle is determined. A pencil point is blindly placed on a random number table (Table 2) and thenearest number is selected. If this number represents an azimuth that falls within the acceptable arc, itbecomes the azimuth of the plot. If the number falls outside the arc, the process is repeated until anacceptable azimuth is selected. If a handheld computer is available, it can be programmed to selectrandom azimuths automatically.
Once the azimuth of the plot has been selected, the measuring tape is attached to the beginningstake. One person unreels the tape on the selected azimuth, oriented by a second person standing overthe stake with a sighting compass. It is important to unreel the tape as straight and as close to theground as possible. Field crews may find it convenicnt for the person unreeling the tape to also carryfour steel rods and the hammer. When the 100-m point is reached and the correct azimuth verified, asteel rod is hammered into the ground at the 100-m mark until approximately 1 cm protrudes above thesurface. The tape is clipped to this rod. The remaining three steel rods are driven at the 75, 50, and 25-m points along the tape and the tape is clipped to them. Rods that cannot be driven completely into theground due to an underlying rock layer are bent over to prevent flat tires and injuries.
In tall, dense scrub and woodlands, it may be necessary for the person unreeling the tape to carrya telescoping pole, extending it vertically to provide a target for the person with the sighting compass.In such cases, or if there is a strong wind, it may be necessary to lay out the line in 25-m segments. Inall cases, care must be taken to ensure that the line is as straight as possible.
Plot Location Notebook
To ensure the LCTA plots can be relocated, accurate site descriptions and maps must be preparedand photographs taken. Most of the descriptive infbrmation and maps are recorded on the Plot MapForm (Figure 4) during the initial inventory. This information, along with photographs taken at theinitial inventory and in later years, is organized in a Plot Location Notebook. The notebook providesinstructions so someone without prior knowledge of the site can relocate the beginning stake andresurvey the plot. The photographs document the condition of the plot over time. Depending on thenumber of plots, the plot location notebook may consist of one or more volumes. A separate notebookis assembled for special use plots.
Descriptive Information
Each volume begins with a title page listing installation name, notebook category (core or specialuse plots), volume number, and plot numbers. A Plot Inventory and Monitoring Log follows the titlepage (Figure 5). This form specifies the initial inventory and subsequent monitoring dates for each plotcontained within that volume. Next is the installation Plot Locator (Figure 6) listing each plotsequentially along with installation training area number, UTM coordinates, and USGS 7.5-minutequadrangle map name.
17

Table 2
Random Numbers (1-360) for Selecting Line Transect Azimuths for LCTA Plots
297 287 100 154 293 191 312 306 9 170 277 267 218 214 22097 123 109 133 197 328 248 300 88 79 238 330 250 120 241
172 269 293 296 175 113 27 31 235 304 143 226 323 87 335315 344 223 144 57 247 275 113 193 277 177 245 271 355 264191 285 116 31 220 173 4 160 99 307 126 305 209 152 220112 119 124 358 242 61 289 19 158 158 81 355 96 102 6307 218 261 197 222 198 78 277 15 336 207 32 265 245 263256 128 216 353 247 230 88 211 343 353 338 110 97 65 268135 12 196 93 317 306 122 102 311 206 213 28 28 193 33225 235 323 69 170 103 134 62 39 3 340 267 193 320 15889 331 272 251 6 205 61 26 274 257 275 201 179 216 8
242 329 113 16 298 164 115 224 212 146 108 355 275 331 15632 35 58 83 264 328 118 126 180 162 205 126 337 137 28255 351 147 347 191 81 16 236 289 302 283 256 110 105 25245 19 102 151 119 44 284 318 315 351 119 45 28 23 10716 121 147 352 4 59 28 129 103 193 128 86 218 103 12099 11 317 198 41 113 241 65 38 18 18 266 254 249 3517 319 174 327 71 138 26 139 231 223 152 135 279 116 67
167 177 196 357 99 141 340 106 80 162 112 79 262 188 241226 357 50 328 251 88 175 344 153 239 163 259 352 301 128261 88 8 86 16 183 4 133 159 52 132 286 70 185 23366 117 14 125 268 112 321 302 231 108 259 314 189 98 186
312 238 88 264 54 297 104 96 296 62 313 201 311 79 163289 355 287 86 204 167 273 304 284 360 92 116 323 189 167285 270 49 311 323 186 91 324 289 173 324 226 24 182 492 295 190 270 43 73 267 190 221 137 95 352 25 170 121
257 21 267 251 144 110 214 43 124 60 92 328 348 327 11152 17 80 173 113 203 270 38 357 234 208 205 294 156 140
306 238 83 134 273 351 151 101 281 321 30 302 178 199 102149 186 82 179 87 84 134 290 226 13 345 154 351 243 114142 241 283 66 91 217 234 295 235 160 138 243 179 319 348214 86 136 151 347 261 159 57 168 129 89 124 268 113 154282 21 189 281 297 184 28 178 25 245 355 92 324 260 196174 17 213 335 316 255 284 337 9 7 253 193 193 92 87212 264 296 24 145 56 256 33 144 116 336 98 335 116 17371 167 348 208 280 318 172 270 8 36 20 327 351 344 100
202 48 289 231 318 156 123 277 127 129 171 168 261 176 157260 71 238 261 19 357 28 184 5 141 34 47 7 83 42225 287 305 336 280 61 192 121 252 13 13 121 291 333 26152 286 50 356 253 293 273 98 342 163 278 88 126 124 348315 238 109 124 310 262 149 52 92 236 327 69 107 114 23161 140 193 209 21 103 100 58 289 31 84 288 165 31 136
317 30 306 14 125 7 344 132 302 245 181 265 312 326 1902 218 85 109 148 25 40 140 257 294 71 261 35 232 290
295 278 59 81 144 132 252 313 119 314 149 159 263 185 68191 352 329 79 355 74 121 212 115 90 205 165 9 145 895 66 286 22 4 347 13 341 25 163 232 145 88 92 53
142 192 223 62 312 253 2 344 65 148 109 20 80 2 162237 17 167 176 197 335 180 215 54 190 262 179 323 156 340231 127 249 248 312 59 37 327 173 150 288 79 345 117 188273 20 62 247 194 62 276 55 164 82 223 345 262 122 99116 42 13 359 28 153 208 3 101 200 316 147 99 186 75
18

E~ E
00LAI MeIx L4
00
U-U
0. 19

PLOT INVENTORY AND MONITORING LOG
INSTALLATION_____________________________
NOTEBOOK______________ VOLUME_____________
PLOT INVENTORY MONITOR DATE (d/m/y)# DATE (d/m/y) METHOD (S=short-term or L--long-term)
Figure 5. Plot Inventory and Monitoring Log.
20

PLO0T LOCATOR
INSTALLATION NAME________________________
~TR~TAINING EstUTM's NotigI QUADRANGLE NAME
Figure 6. Plot Locator.
21

Maps
The first map in the plot location notebook is a Composite Map Key (Figure 7) showing thelocation and the name of each USGS 7.5-minute quadrangle map covering the installation. Next is areduced copy of each quadrangle map (Figure 8) showing the location of all plots located within thatquadrangle. This is followed by a Plot Map Form (Figure 9) for each LCTA plot that includes aGeneral Location Map and a Specific Location Map.
The General Location Map is completed in the field by sketching roads and landmarks that willaid in relocating the plot. A photocopy of the relevant portion of the installation map or the USGS mapmay be attached to the Plot Map Form in place of the sketch (Figure 10) with the plot location and mapscale indicated. Either method is acceptable if care is taken to provide sufficient detail for relocation.Additional maps may be included in the Plot Location Notebook as needed.
The Specific Location Map also is completed in the field. It is an enlarged portion of the GeneralLocation Map, providing transect azimuth, azimuths and measured distances to at least two nearbylandmarks, and other information needed to relocate the plot (Figures 9 and 10). Separate Plot MapForms with labeled dividers make it easier to locate information on specific LCTA plots.
Photographs
Each Plot Map Form is accompanied by a transparent plastic page containing photographs taken atthe time of plot establishment. All photographs are 1.5 x 5-in. color prints. A minimum of threephotographs is required. The first documents the approach to the plot from the nearest road; the secondthe approach to the plot by foot; and the third is a panoramic view of the transect from the beginningstake. Other photographs may be taken as necessary. It is important that the exact location of the stakebe visible in all photographs except the panoramic view of the transect. This can be accomplished byplacing pin-flags around the stake or by having someone stand over the stake.
Each photograph is recorded in a Photo Log when it is taken (Figure 11). After developing thefilm, each photograph is labeled on the back with information from the Photo Log (i.e., the installationname or abbreviation, year, roll number, frame number, plot number, azimuth, and view description). Arubber stamp is available for labeling the back of each print (Figure 12).
Photographs taken when the plots are monitored must always include a panoramic view of thetransect taken from the beginning stake. This provides a visual record to supplement the transect data inassessing change. Other photographs may be necessary to aid in future relocation if significant changeshave occurred in the surrounding landscape.
Negatives of all photographs are stored in transparent plastic pages in a separate volume with atitle page identifying the contents. Following the title page is a Photo Negative Log (Figure 13)containing the roll number and year the photographs were taken for each set of negatives in the volume.The negatives from each roll of film are stored on separate pages. The Photo Log prepared in the field,which contains a short description of each photograph, is placed with the corresponding negative page.Additional LCTA negatives may also be stored in this notebook, thus providing a library of supplemen-tal photo records for each installation.
22

USGS COMPOSITE MAP KEY
INSTALLATION FORT (ZILF -y"1A
QUARANGLE INDEX
Figure 7. USGS Composite Map Key for Fort Riley, KS.
23
UN~,! ~r~rS 5E~DF LY O4ADRAMOLE t
4
3A1
t S I S P
S S
j ?4"~ ~ .5,J
A N1
J" .5
Fiue8. ARdue SG .- int uarnleM pSown lo oaosa Yakim
Firin Centr, WA
24

E y
0
* -.
F6 ct
/t
E~'-~~81 .
U,
o - 19U- -~ -jn C,
.1 y~ED
25

Sl 0
cc /l
'U
a. 0.
cnm ,-n '
li- t
o - t2IL cs
C. *' ~ 26

Photo LogFilm Type Roll No.
ASA
Ex. Date Plot No. Azimuth Locaton/Descripion
I
2
3
4
5
6
7
8
9
10
11
12
13
14
l5
16
17
18
19
20
21
22
23
24
Figure 11. Photo Log.
27

ICTA
CODE .. aInatalltIon V. poll *No*.
PLOT _ AZIMUTH
APPROACH TO PLOT BY: 0 ROAD 0 FOOT
L PANORAMA VIEW OF PLOT
01 OTHER
Figure 12. Rubber Stamp for Labeling the Back of LCTA Photographs.
Soil and Topographic Information
Soil Depth Estimation
Soil depth can have a significant effect on plant productivity and botanical composition. Shallowsoils are generally less productive, more susceptible to damage and more difficult to reclaim than deepersoils. An estimate of soil depth is made for each LCTA plot by noting how deep it was possible todrive each of the steel rods into the soil. The average depth is recorded on the Plot Map Form (Figure4). Care should be taken not to underestimate soil depth in rocky soils.
Soil Samples
A composite soil sample is taken at each plot. Five small samples are taken approximately I mfrom the line transect at the zero, 25, 50, 75, and 100-m points. All litter is removed from the surface.With a narrow spade or mattock, a small pit approximately 15 cm deep is dug. A vertical slicecomprising approximately 0.2 1 of soil is taken from the side of each pit and roots and plant crowns areremoved. The samples are combined in a scalable plastic bag along with a double-faced aluminum taginscribed with the installation name or abbreviation and plot number. Sealed bags are boxed andshipped to the USDA National Soil Survey Laboratory in Lincoln, Nebraska for analysis of selectedphysical and chemical soil characteristics that affect site erodibility, productivity, and botanicalcomposition. A record of all samples shipped must be maintained.
Aspect
Aspect, which can influence soil moisture, botanical composition, and vegetation cover, isdetermined for plots while standing at the 50 in point and estimating the general direction that waterwould flow across the site. Using a compass, aspect is estimated to the nearest octant, and this directionis circled on the Plot Map Form (Figure 4). If the average slope is less than 5 percent, aspect isconsidered unimportant and "level" is circled on the form.
28

PHOTO NEGATIVE LOG
INSTALLATION_______________ VOLUME________
ROLL DATE ROLL DATE ROLL DATENUMBER NUMBER NUMBER
Figure 13. Photo Negative Log.
29

Aspect
Aspect, which can influence soil moisture, botanical composition, and vegetation cover, isdetermined for plots while standing at the 50 m point and estimating the general direction that waterwould flow across the site. Using a compass, aspect is estimated to the nearest octant, and this directionis circled on the Plot Map Form (Figure 4). If the average slope is less than 5 percent, aspect isconsidered unimportant and "level" is circled on the form.
Slope Length and Gradient
Slope length and gradient are measured at the zero, 50, and 100-m points and recorded on the PlotMap Form (Figure 4). Slope length is the straight-line distance runoff travels across each sample point.It is measured from the point of origin of runoff to a point where a barrier or significant reduction inslope causes overland flow to be diverted into a defined channel or causes suspended sediment to bedeposited. The points of origin and diversion or deposition may result from a variety of obstructions orgeographic features: (1) ridgetops and valley bottoms, (2) rivers, streams and gullies, (3) roads and trails,(4) deep ruts, (5) ditches, foxholes, and other excavations, (6) dense fence rows, shrub mottes or forestedareas that significantly impede runoff (Figure 14).
Slope length is estimated by pacing the distance between point of origin and point of deposition.Slope gradient is measured with a clinometer to the nearest half percent. (Do not record in degrees.)
30

0a-
' K
311

3 PLANT COLLECTION
A primary goal of the LCTA program is to assemble a complete collection of all vascular plantsthat occur on an installation, and to produce a comprehensive, annotated list of all taxa present,including threatened and endangered species. Three specimens of each taxon are collected. Onespecimen is accessioned to a public herbarium to serve as a voucher. The remaining two specimens arelaminated in plastic with a label (Figure 15) and included in a reference collection to be housed at theinstallation. The laminated specimens can then be taken into the field to aid in species identification byLCTA crew and natural resources personnel. Though the majority of taxa are collected in I to 3 yearsby a plant taxonomist contracted specifically for this task, species not yet included in the collection maybe added any time by the field crew leader.
Every reasonable effort is made to collect specimens in flower and/or with fruit, in addition tostems, leaves, and, where they will aid in identification (e.g., grasses and forbs), roots. Specimens,which should not be collected on the line transect, are placed between sheets of newsprint labeled withthe collection number, then between blotters and ventilators and into a standard plant press and driedthoroughly. For each specimen collected, a log sheet (Figure 16) is completed. Positive identification ismade by comparison with herbarium specimens and published floras for the region, and verified by aqualified taxonomist.
Nomenclature and classification conform to the National List of Scientific Plant Names (USDASoil Conservation Service, Publication SCS-TP-159, 1982).
32

FLORAOF FORT CHAFFEECWouan yw, Aanaa
C-o- on , .0gan@Cor'ops grndi~bm Hogg ex Sweo
NE of lftareedon. FL Smith V4. & AAbwv, Ad. (UTrM03'?70061). Shale Wing oult loam.; ievel upian'd.Old Mild; abocIaa with i m nsaeaoa.in Sftwbone-no, Aw copaYinh. Lonlwcn jlookA. NalbeosousperennWal 30-W0cm tail. Plow,, yslW.ILAL Thonm9Un. IL ftjwm &F L AhN M., COW 12 Mv 1ag0
Figure 15. A Pressed Herbarium Specimen With Label.
33

Plant Collection Log
STATE:_____ INSTALLATION: __________COUNTY:_______
SPECIFIC LOCALITY:* ____________________________
DMC/UTM __ _ _ _ _ _ _ _ _ _ _ _ _ _ _ _ _ _ _ _ _ _ _ _ _ _ _ _ _
ELEVATION: ___ _____meters DATE: _______________
DAY MONTH YEARCOLLECTOR(S):
SUBSTRATE & TOPOGRAPHY:________________________
ASSOCIATED TAXA/HABITAT ______________________
Record Family, Genus, Species, and Au~thor
Space below name is reserved for description of plant (e.g. corolla color & markings; root structure;habit; height; abundance, etc.)
# ___ NAME:
NAME.
N______NAME:
# NAME.
0 ___ NAME:
I ~NAME:__ _ _ _ _ _ _ _ _ _ _ _ _ _ _ _ _ _ _ _ _ _ _ _
NAME:
Figure 16. Plant Collection Log.
34

4 PLOT INVENTORY
Data collection is divided into three phases: initial inventory, short-term monitoring, and long-term monitoring. The initial inventory provides a detailed accounting of land use and site conditions.Subsequent monitoring is conducted annually to document trends in land use and condition ofinstallation natural resources. Inventory procedures are detailed below. Short- and long-term monitoringare treated in the next chapter.
The plot inventory is conducted over a 2- to 3-month period during the peak of the growingseason. Materials required to complete the inventory are listed in Table 3. All data can be entered onhandheld computers in the field, bypassing the need for data forms and subsequent data transcription.The initial inventory consists of four major elements: land use assessment, line transect, belt transect,and wildlife sampling.
Land Use
The Land Use Form (Figure 17) documents recent land uses and maintenance activities, as well asevidence of wind and water erosion that can be observed within the boundaries of the 100 x 6-m plot.These data are used to relate land use and maintenance activities to changes in vegetation and soilerosion rates.
Conditions observed on areas adjacent to but not within the plot proper are not checked on theLand Use Form. However, if noteworthy, such conditions may be recorded under the AdditionalComments section of the form.
Table 3
Materials Needed To Inventory LCTA Plots
• Clipboard• #2 pencil" Land use form* Line transect form" Belt transect form" Handheld computer (recommended)" Global positioning system (optional)• Metal detector" 100-m measuring tape" 1-m steel measuring rod (6-mm diameter) graduated in decimeter
increments• 7.5 m telescoping range pole
35

Land Use FormInstallation Plot Number Date
Military Land Uses Non-Military Land UsesNone NoneWheeled GrazingTracked sheepExcavation cattleFoot otherBivouac Row CropDemolition ForestryOther Hay(describe) Other
(describe)
Maintenance ActivitiesNone SeedingBurning* Tree Planting
prescribed Chemical Applicationaccidental (type)
Tillage OtherMowng
Wind Erosion Water ErosionNo evidence No evidenceDrifting Sheet/RillScouring Active GullyPedestal plants Pedestal plants
Debris dams
'Enter "C" if burn was within last 12 months; enter "P" if older.
Additional Comments:
Figure 17. Land Use Form.
36

Line Transect
The line transect documents ground cover, canopy cover, and surface disturbance. Data arerecorded using a modified point intercept method." The point intercept method has been shown to bemore efficient than other sampling techniquese' and is more universally applicable to a wide range ofhabitat types. Information derived from the line transect is used to evaluate soil erosion status, militaryconcealment cover, wildlife habitat, and botanical composition, and for ground-truthing remotely sensedimagery.
One hundred points are sampled along the line transect beginning at the 0.5-m point and continu-ing at 1-m intervals along the measuring tape. The 1-m measuring rod is placed plumb to the ground ateach point to determine ground cover, surface disturbance, and vertical distribution of vegetation up toI m (Figure 18). Canopy cover above I m is measured using the telescoping range pole.
If a plant species is encountered that cannot be identified, a specimen is collected away from thetransect and assigned a number for future identification. The specimen number is entered on the LineTransect Form. The correct species code can be entered once proper identification is made. Plantcollection procedures are discussed in Chapter 3.
Surface Disturbance
If a point has been disturbed, the nature of the disturbance is determined and the appropriatecategory circled on the "Disturbance" line on the Line Transect Form (Figure 19). The categories ofdisturbance are described in Table 4. A point is considered disturbed if there is physical evidence ofdisruption of the soil surface or if the vegetation has been obviously crushed at that point. The fact thata site is in poor condition does not constitute evidence of disturbance. In the case of vehicle tracks, theability to distinguish a general direction of travel is a prerequisite to establishing evidence ofdisturbance.
Ground Cover
The second entry for each point on the Line Transect Form is for ground cover. Only material incontact with the ground at the tip of the measuring rod is recorded, i.e., the point at the center of therod. Ground cover categories are listed in Table 5.
Canopy Cover
The vertical distribution and composition of canopy cover is recorded on the Line Transect Form(Figure 19) by recording vegetation contacts within each decimeter interval on the 1-m measuring rod asit is held plumb to the ground. For vegetation above 1 m, the rod is replaced by a telescoping rangepole.
r E.B. Levy and E.A. Madden. "The Point Method for Pasture Analysis," New Zealand Journal of Agriculture, No. 46 (1933).
pp 267-279; D.W. Goodall, "Some Considerations in the Use of Point Quadrants for the Analysis of Vegetation," AustralianJournal of Scientific Research, Series B. No 5 (1952), pp 1-41; - "Point-Quadrant Methods for the Analysis ofVegetation," Australian Journal of Botany, No. 1 (1953), No. 1. pp 457-461; D. Mueller-Dombois and H. Ellenberg, Aimsand Methods of Vegetation Ecology (John Wiley & Sons. Inc.. New York, 1974).II.F. Heady. R.P. Gibbens. and R.W. Powell, "A Comparison of the Charting, Line Intercept, and Line Point Methods ofSampling Shrub Types of Vegetation," Journal of Range Management, No. 12 (1959), pp 180-188.
37

w~ cc
0*
wIcc
w
0 L4
Cu _
C Cc
z
cmcc
38

LINE TRANSECT Plot No
installation Date
Trans Loc, 05 15 25 35 4.5 5.5 65 75 85 95
Disturbance N RTPO N RTPO N-RTPO N-RTPO N-RTPO N-RTPO N RTPO N-RTPO N-RTPO N-RTPO
Cover
<1
1-2 1-.2
23 2
3.4 .3-4
4-5 4-5
56 15-6
6-7 6-7
1'.8 7-8
89 8-9
9-10 91 0
1 0.1 1 10.1,1
1.1.1 2 11-12
1213 1.2-1.3
13-1 4 13-1.4
14-1 5 1.4-15
15.16 15-16
161 7 1,6-1.7
17-18 1.7-1.8
1819 1.8-1.9
19-20 1.9-2.0
2.025 2.0-2.5
2.5-30 2.5-3.0
3.035 30-3.5
3540 3.5-4.0
4.045 4.0-4.5
4550 4.5-5.0
50-5 5 5.0-5.5
55-60 5.5-6.0
6.065 6.0-6.5
6570 6.5-7.0
70-7 5 7.0-7.5
7580 7.5-8.0
80 85 8.0-8.5
>85 >85
Figure 19. First Page of the Line Transect Form.
39

Table 4
Categories of Physical Disturbance Recorded on the Line Transect Form
Type Code Description
None N No evidence of physical disturbance to the soil surface or crushed vegetation.
Road R Permanent or semipermanent traffic route receiving periodic maintenance.
Trail T Semipermanent traffic route receiving no maintenance.
Pass P A random vehicle track that does not follow an established traffic pattern.
Other 0 Evidence of soil disturbance from nonvehicular sources such as excavation, demolition, bivouacactivity, etc.
Table 5
Categories of Ground Cover Recorded on the Line Transect Form
Category Code Description
Basal cover That part of a plant where the leaves and/or stem join the roots at the soil surface.Vascular plants are recorded by species code.* Record microphytes as MOSS.LICHEN or ALGAE.
Prostrate Attached leaves, stems, stolons, etc. in contact with the soil surface away from theplant crown.
Dead wood DW Detached, fallen woody material > 2.5 cm in at least two dimensions.
Litter LG.LF Detached herbaceous plant parts of any size, and woody material < 2.5 cm in atLS,LT least two dimensions. The second letter code identifies the source of litter (i.e.,
G=grass, F=forb, S=shxub and T=tree).
Duff DG.DF Accumulations of litter > 2.5 cm in depth. The second letter in the code identifies theDS.DT source of litter (i.e.. G=grass, F=forb. S=shrub and T=tree).
Rock RO Rock ..r.i other nonbiodegradable material > 7.5 cm in any dimension.
Gravel GR Gravel and other nonbiodegradable material 2 2mm in any dimension and < 7.5 cm inall dimensions.
Bare ground BG Exposed soil.
* See National List of Scientific Plant Names (USDA Soil Conservation Service, 1982).
40

Canopy cover is recorded in decimeter intervals to a height of 2 m. Above 2 m, it is recorded in0.5-m intervals up to 8.5 m. Canopy cover contact is recorded only if vegetation appears as though itwould be intercepted by the center of the rod or pole. Canopy cover above 8.5 m also is recorded aspresent if an imaginary extension of the range pole above 8.5 m would contact vegetation.
Canopy cover categories are listed in Table 6. Only one category is recorded per interval. If twoor more species or categories contact the rod in the same interval, only the one at the highest pointwithin the interval is recorded. If more than one species is present over 8.5 m, record only the topmostspecies.
Belt Transect
The belt transect is intended to characterize species composition, density, and height distribution ofwoody and succulent vegetation. These data serve as the basis for: (1) documenting the availability ofconcealment resources for realistic military training; (2) characterizing tree and shrub growth rates;(3) establishing a continuous forest inventory (CFI); (4) assessing wildlife habitat; and (5) monitoringpopulations of endangered plant species.
The belt transect extends the length of the 100-m line transect. Although the belt has a standardwidth of 6 m (3 m to either side of the line transect), the width may be reduced for high density speciesaccording to the guidelines in Table 7. Any adjustments in the belt transect width are noted on the BeltTransect Form.
Using the measuring tape as a longitudinal scale and a range pole as a lateral scale, the location ofall woody plants above a predetermined minimum height are mapped on the Belt Transect Form (Figure20). In nonwooded areas (i.e., grasslands, savannahs, deserts, etc.) where most woody plants are lessthan I n high, the minimum height of species recorded is 0.1 m. In woodlands and forests wherewoody plants commonly exceed I m in height, the minimum height of species recorded is 1.0 m. Theminimum height used for each plot is recorded on the Belt Transect Form.
All rooted shrubs and trees are recorded regardless of whether they are live or dead. All cacti,regardless of height, are recorded. No suffretescent (partly woody) species are recorded. For liveindividuals, a solid dot is used to mark their locations on the Belt Transect Form; an "x" is used torecord the location of dead individuals. The species code2 9 and height (to the nearest 0.1 m) of eachindividual is recorded beside the symbol used to mark its location. The height of individuals > 8.5 mtall is recorded as "8.5+".
Some woody plants tend to produce multiple stems from a common root system. Although theymay appear to be separate plants, these multi-stemmed plants are recorded as a single individual. Forplants that form dense stands by means of root sprouts, adventitious roots, or rhizomes, the entire clump(motte) is regarded as one individual. A dashed line is used to delineate the boundaries of such clumpson the data form. The height of the clump is determined by measuring the tallest stem within theclump. As a reference for future surveys, the natural resource manager on each installation should listall species treated as clonal, and define what constitutes a clump.
U.S. I)eparticrit of Agriculture (USI)A) Soil Conservation Service (SCS), SCS Technical Publication No. 159, National ListoJ Scientli ic Plant Names (1982).
41
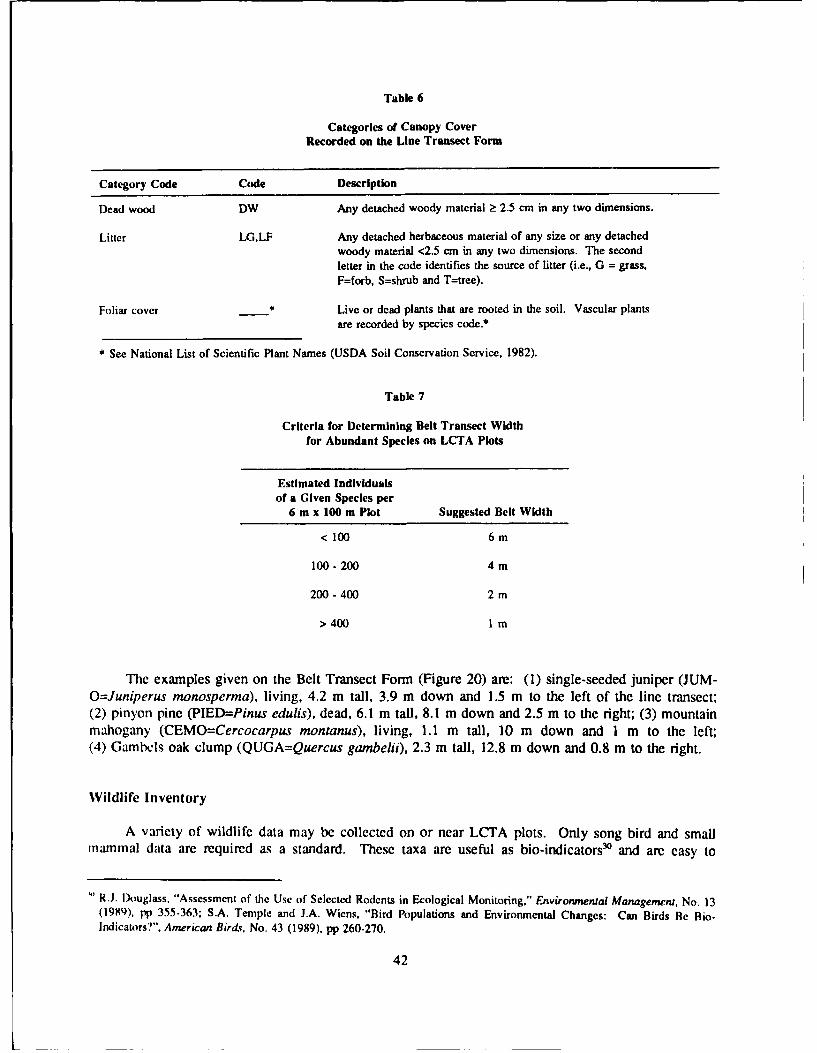
Table 6
Categories of Canopy CoverRecorded on the Line Transect Form
Category Code Code Description
Dead wood DW Any detached woody material ? 2.5 cm in any two dimensions.
Liter LG.LF Any detached herbaceous material of any size or any detachedwoody material <2.5 cm in any two dimensions. The secondletter in the code identifies the source of litter (i.e., G = grass,F=forb, S=shrub and T=tree).
Foliar cover Live or dead plants that are rooted in the soil. Vascular plantsare recorded by species code.*
* See National List of Scientific Plant Names (USDA Soil Conservation Service, 1982).
Table 7
Criteria for Determining Belt Transect Widthfor Abundant Species on LCTA Plots
Estimated Individualsof a Given Species per
6 m x 100 m Plot Suggested Belt Width
<100 6m
100 -200 4 m
200 -400 2 m
>400 I m
The examples given on the Belt Transect Form (Figure 20) are: (1) single-seeded juniper (JUM-O=Juniperus monosperma), living, 4.2 m tall, 3.9 m down and 1.5 m to the left of the line transect;(2) pinyon pine (PIED=Pinus edulis), dead, 6.1 m tall, 8.1 m down and 2.5 m to the right; (3) mountainmahogany (CEMO=Cercocarpus montanus), living, 1.1 m tall, 10 m down and 1 m to the left;(4) Gambels oak clump (QUGA=Quercus gambelhi), 2.3 m tall, 12.8 m down and 0.8 m to the right.
Wildlife Inventory
A variety of wildlife data may be collected on or near LCTA plots. Only song bird and smallmammal data are required as a standard. These taxa are useful as bio-indicators3° and are easy to
R.J. Douglass, "Assessment of the Use of Selected Rodents in Ecological Monitoring," Environmental Management, No. 13(1981)), pp 355-363; S.A. Temple and J.A. Wiens, "Bird Populations and Environmental Changes: Can Birds Be Rio-Indicators?". American Birdv, No. 43 (1989). pp 260-270.
42

BELTTRANSECT
instalation Cdo
PloiNo./
Date- r 74eL~b7__
Transect WOdh
Exce_____
Mium Height__ _
.lm___ 1.0m PIV
9.Z1
Pape I low
Figure 20. First Page of the Belt Transect Form.
43

sample at the scale of the LCTA plot. Other data that may be collected include medium-sized mammal,carnivore, amphibian, reptile, invertebrate, ungulate pellet group, and browse utilization data.
Standard wildlife inventories are conducted on a subsample of approximately one-third of the coreplots, up to a total of about 60. Core wildlife plots are selected in a stratified random fashion from
among all the established core plots so as to represent the major soil and land cover types in proportion
to their occurrence on the installation. This constitutes the minimum sampling required. More coreplots are added as necessary to represent all soil and land cover types with at least one wildlife plot.
Additional sampling may be desirable to generate a more complete species list. This is done byincreasing the number of core plots sampled, and by sampling special use plots and other unique habitatsnot included in the core plot allocation. These supplemental inventories follow the same methodsprescribed for core plots to ensure data compatibility. Also, using the same methods on all core andspecial use plots permits a more extensive analysis of the relationships between wildlife, habitat, landuse, and range condition and trend.
Materials needed to conduct wildlife inventories are listed in Table 8. Standardized commonnames31 and associated vertebrate species codes (a list is available from USACERL) are used whenrecording field data. If any previously unknown threatened or endangered species are observed on aninstallation, the exact location of the sighting and other pertinent information should be recorded andrelayed through the installation Natural Resources Office to state and federal wildlife agencies.
Standard wildlife data are collected during each of the first 3 years of LCTA implementation toestablish a baseline for monitoring long-term trends. Resurveys are performed periodically thereafter asdescribed in the next chapter.
Birds (Standard)
Birds are censused at each plot using a modified point-count transect technique. 32 Each plot iscensused once in the morning and once in the evening by slowly walking the length of the LCTA plotin 6 minutes, recording all birds seen or heard within 100 m of the plot (Line Out in Figure 21). Uponreaching the end of the plot, the observer stops for 8 minutes and again records all birds seen or heardwithin 100 m (End Point). Finally, the observer walks back to the starting point in a period of 6minutes again recording any birds detected within 100 m of the plot (Line In). All morning censuses areconducted between 0.5 hour before and 4 hours after sunrise on relatively calm, rainless days. Theevening census is conducted during the 4 hours prior to sunset. Generally, four or five plots can becensused each morning and evening, thus requiring 12 to 15 days to inventory 60 plots. The inventoryis conducted within a 2- to 4-week period corresponding to the seasonal peak in breeding bird activity,generally between 15 April and 30 June.
All birds detected are recorded on the LCTA Bird Survey Data Form (Figure 21) using standardcommon names and species codes (available from USACERL). Numbers of each species are recordedfor each segment of the survey using the codes for mated status shown in Table 9. This information isused to infer the number of pairs present on the plot. A singing male, male/female pair, or adult
3' R.C. Banks, R.W. McDiarmid, and A.C. Gardner, Checklist of Vertebrates of the United States, the U.S. Territories, and
Canada (U.S. Department of the Interior. Fish and Wildlife Service, Washington, DC, 1987).32 j. Blondel, C. Ferry, and B. Frochet, "Point Counts With Unlimited Distance," Studies in Aviation Biology, No. 6 (1981),
pp 414-420.
44

Table 8
Materials Needed To Conduct LCTA Wlldllfe Inventories
Small manmals (for up to 10 plots per night) (required)* State wildlife collecting permits* 400 museum special snap traps* 100 rat traps* Snap trap carrying bag* Rolled oats and peanut butter for snap traps* Scalable plastic bags for specimens* Aluminum tags
Birds (required)* 7 to 10 power binoculars* Watch
Medium-sized mammals (optional)* State wildlife collecting permits* 8 to 10 medium-sized cage traps (e.g., Havahart)* Bait (sardines, chicken eggs, or scrap meat)* Fatty acid scent (FAS) disks* 1-meter circular form* 1-1/2 nm soil sieve
Bats (optional)* State wildlife collecting permits* 5 or more mist-nets* 10 8-10' net poles
Reptiles/amphibians (optional) (for 60 plots)* State wildlife collecting permits* 240 5-gallon buckets with lids* 800 feet of aluminum flashing for drift fences* 250 wooden or metal stakes* 36 to 60 box or funnel traps (recommended)* Shovel, pick, and post hole digger
accompanied by young indicates one pair present. Presence of additional pairs can be inferred only ifadditional singing males, male/femalc pairs, or same sex adults accompanied by young are observed. Anindividual nonsinging male, lone female, or individual of unknown sex or age indicates presence of thespecies but may not indicate a second pair. Flyovers of birds not using the plot, and other birdsobserved outside the plot limits are enumerated in the OTHER column. In the MAX PAIR column, themaximum number of pairs observed among the three segments of the survey is recorded. For flocks,record the total estimated number observed regardless of age and sex. For each segment, care must betaken not to record the same individuals more than once.
Small Mammals (Standard)
Small mammals are surveyed by setting two rows of 20 museum special traps and five rat trapsparallel to the long axis of each LCTA plot (Figure 22). Trap stations are spaced approximately 7.5 inapart; trap lincs are spaced 30 in apart. Snap traps are baited with a mixture of rolled oats and peanutbutter and runi for two nights for a total of 100 trap nights per plot. Traps are set during the late:flcfloon or evening of the first day, checked early the next morning, reset during the late afternoon or
45

-4
0
0
00
44
CV
0 E4
00
0 00 U0 4.3
to 0-4 4
0 :3U4 ) F.E &4
to 0P11 0
- X4.
o1 0
rI~P- 4.300
04.)
0 4 H ((a0 -4 1
u C 00
V) 4J 0 ~a (a -40 U
~ u OE
-46

Table 9
Categories of Mated Status Recorded on theLCTA Bird Survey Data Form
Code Mated Status
* Singing male
pr Adult male/female pairm Nonsinging malef Female onlyu Unknown sex and agey Young of the year**Flock Flock of unknown sex and age
**If adults are accompanied by young, enter
a 'y' in addition to other codes.
evening of the second day, and checked and collected on the following morning. While in the field,captures for each site and day arc placed in separate sealable plastic bags, labeled and then frozen orstored on ice until they can be examined for positive identification. All specimens are recorded on theLCTA Small Mammal Summary Data Form (Figure 23).
Usually, four to six plots can be trapped each night, thus requiring about 12 to 17 consecutivedays to inventory 60 plots. Trapping must be completed in as short a time as possible during anexpected regional peak in small mammal diversity and abundance. In most areas, late spring or earlyfall is favorable. In the southeastern United States, winter (January to February) is preferable to summerbecause of fewer ant problems and greater responsiveness of animals to bait. The season selected mustbe consistent from year to year. The use of snap traps for censusing small mammals is discussed inDavis." The presence of threatened or endangered small mammal species on the installation maynecessitate the use of live traps and a Federal permit.
Medium-Sized Mammals (Optional)
Wire mesh cage traps are placed at selected plots and sites to document the presence of medium-sized mammals such as skunks, raccoons, opossums, etc., and to control predation by such species oncaptured small mammals. This can be conducted in conjunction with the small mammal trapping, buttraps should be placed away from areas where they may be vandalized. Cage traps are typically baitedwith sardines, chicken eggs, or scrap meat. All mammals captured in the cage traps are recorded on theLCTA Medium-Sized Mammal Data Form (Figure 24), and usually released.
An alternative to live-trapping is the use of scent stations, developed primarily to monitorcarnivore populations in the western United States. 4 Each station consists of a 1-m diameter circle offinely sifled soil with a fatly acid scent (FAS) disk, or other scent, in the center. Tracks left in the sifted
Davis. I).., CRC landbAok of Ccn.%u. Method'for Terrestrial Vertebrates (CRC Press, Inc., Boca Raton, FL, 1983).' M.C. Conner, R.F. Labisky, and I).R. Progulske, Jr., "Sccnt-Station Indices as Measures of Population Abundance for
Bobcats. Raccoons, Gray Foxes, and Opossums." Wildlife Society Bulletin, No. 11 (1983), pp 146-152; F.G. Undzey andF.F. Knowlton, "l)etermining the Relative Abundance of Coyotes by Scent Station Lines," Wildlife Society Bulletin, No. 3(1975). pp 119-124; R.I). Roughton and M.W. Sweeny, "Refinements in Scent-Station Methodology for Assessing Trends inCainvore Populations," Journal oJ Ihddlife Managenwi. No. 46 (1982). p1' 217-229.
47

LCTA* * TRANSECT * *
~~-mlOOm UI-oom
* U
* U
• O 00
* U
* U
* U
U 7. 5 m
t I
15m
•-Museum Special Trap
S-Rat Trap
Figure 22. Small mammal Trapping Configuration.
48

LCTA SMALL MAMMAL SURVEY PLOT SUMMARY
Installation LCTA Plot Number
UTM Coordinates (E) (N)
Collector(s)
Collecting Dates
Traps Used Total Trapnights
Bait(s) Used
GENERAL WEATHER CONDITIONS OVER THE TRAPPING PERIOD:
Temp (C0 ) High Low
Cloud Cover (%)
Precipitation
SPECIMENS COLLECTED
SPECIES CODE MALE FEMALE UNKNOWN TOTAL
Other mammalian species identified while at plot (tracks, scat, etc.):
Provide a detailed map showing the location of the site if traps were notassociated with an LCTA plot (use back of sheet).
Figure 23. LCTA Small Mammal Summary Data Form.
49

LCTh MEDIUM-SIZED MAINDL PLOT SBWOIRY
Installation LCTA Plot Number
UTM Coordinates (E) (N)
Collecting Dates
Collector(s)
Type and Number of Traps Set
Total Number of Trapnights at Site
Bait(s) Used
SPECIMENS CAPTURED
SPECIES CODE MALES FEMALES UNKNOWN TOTAL
OTHER MAMMALIAN SPECIES IDENTIFIED WHILE IN AREA (TRACKS, SCAT, ETC.):
PROVIDE A DETAILED MAP SHOWING THE LOCATION OF THE SITE IF TRAPS WERE NOTASSOCIATED WITH AN LCTA PLOT (USE BACK OF SHEET IF NECESSARY).
Figure 24. LCTA Medium-Sized Mammal Data Form.
50

soil are identified to species, if possible. Scent station surveys are not performed concurrently withsmall mammal trapping to avoid depredation of small manmal captures. Each station is monitored onenight and ';paced to avoid attracting the same animal to more than one station.
Bats (Optional)
Bats typically are surveyed using mist nets placed over a perennial water source about 1 hourbefore dusk. Nets must be checked frequently, preferably every 15 minutes.3" Net length, mesh size(usually 1.5 in.), and setup duration are at the discretion of the biologists conducting the survey. Allcaptured bats are recorded by species on the LCTA Bat Survey Data Form (Figure 25).
Reptiles and Amphibians (Optional)
Reptiles and amphibians are censused using a pitfall trapping array with optional box traps36 inassociation with the LCTA transects (Figure 26). The central bucket of each pitfall array is locatedapproximately 75 m from the origin of the LCTA line transect, and at a random azimuth within a 180degree arc opposite the azimuth of the transect. The array must be in the same soil type and landcovercategory as the LCTA transect. The 100-m point may be used as the point of origin if necessary to keepthe array within the correct soil type and landcover category. The four 5-gallon plastic buckets areburied so the lip is flush with the soil surface. A cover is placed above the bucket, supported by rocksor wood blocks, to provide shade to any trapped animals. Aluminum drift fences 8 to 12 in. high,buried 2 to 3 in. in the ground and held in place by wooden or metal stakes are used to funnel animalsinto the buckets. The fence should be painted to blend with surroundings to make it less conspicuousand less prone to disturbance. The fence must overlap the lip of the bucket by about I in. to force theanimals into the bucket and prevent them from moving around the end of the aluminum.
Captured animals are removed from the pitfalls once daily, if possible, with some specimens beingretained as vouchers. All other should be marked in some manner and released unharmed near the pointof capture. If possible, each array should remain open for 7 to 14 days during periods of high amphibi-an/reptile activity. Because peak activity periods for reptiles and amphibians differ depending onspecies, establishing and monitoring pitfall arrays on all wildlife plots (typically 60 plots) for the entirefield season is frequently not practical. In such cases, it is recommended to survey a subset of thewildlife plots (e.g., 30 to 40 plots) for the full 7 to 14 days rather than to survey all plots for a shorterperiod. The subset of plots should include two or more plots in each major vegetation/soil type toestimate variability within the habitat.
Supplemental censusing techniques such as noosing, road riding, or use of funnel or box traps maybe combined with the pitfall arrays to provide a more complete species list, since the pitfall trappingnlthod is not effective for all species. Alternative trapping arrays, including linear configurations of one1o four traps, are being investigated.
S.P. Cross, "BaL,'" in A.Y. Cooperrider, R.J. Boyd, and H.R. Stuart, eds., Inventory and Monitoring of Wildlife Habitat (U.S.Department of the Interior. Bureau of Land Management Service Center, Denver. CO. k986), pp 497-517.K.R. Jones, Technical Note 353. Distribution, Ecology, and Habitat Management of the Reptiles and Amphibians of theHlualapai-Aquarius Planning Area, Mohave and Yavapai Counties, AZ (U.S. Department of the Interior, Bureau of LandManagement. Denver, CO. 1981).
51
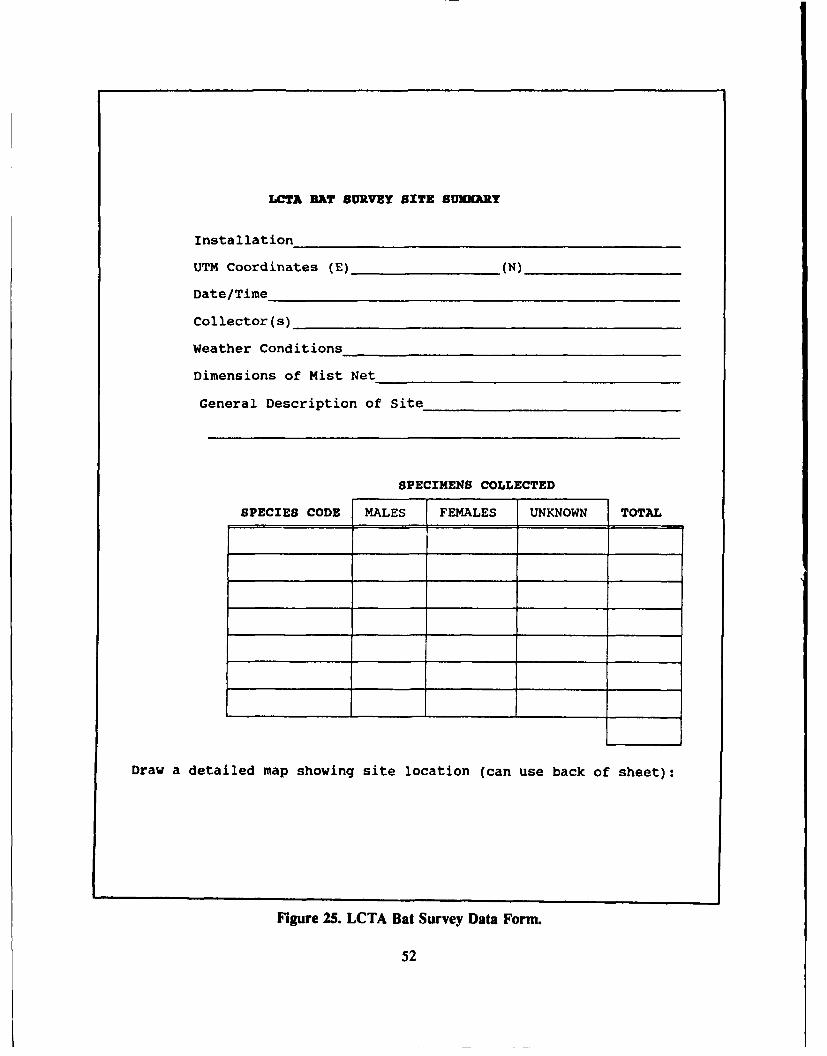
LCTA HAT SURVEY BITE SUMIARY
Installation
UTM Coordinates (E) (N)
Date/Time
Collector(s)
Weather Conditions
Dimensions of Mist Net
General Description of Site
SPECIMENS COLLECTED
SPECIES CODE MALES FEMALES UNKNOWN TOTAL
Draw a detailed map showing site location (can use back of sheet):
Figure 25. LCTA Bat Survey Data Form.
52

~- wood stakesOptional Box - o*20
Traps CENTRAL BUCKET
U)
00 0 800
(1)bucketz
4
100
Figure 26. Pitfall Trap Configuration To Capture Reptiles and Amphibians on LCTA Plots.
53

LCTA HERPETOFAUNi PLOT SUIARY FORM
Installation LCTA Plot Number
Azimuth from 0 or 100 meter point (circle one)
Survey Dates
Surveyor(s)
IF INCIDENTAL COLLECTING, STATE COLLECTING METHOD(S):
GENERAL WEATHER CONDITIONS OVER THE SURVEY PERIOD:
TEMP (C0 ) HIGH LOW
% CLOUD COVER
WIND CONDITIONS
SPECIMENS COLLECTED
SPECIES CODE MALES FEMALES UNKNOWN TOTAL
Other Reptilian/Amphibian Species Identified While at Plot:
Figure 27. LCTA Herpetofauna Survey Data Form.
54

5 MONITORING
To detect changes in land use, disturbance, ground cover, canopy cover, species composition,woody plant density, etc., the permanent plots established in the initial inventory must be monitored ona regular basis (usually once per year). This "Short-Term Monitoring" is a scaled-down version of theinitial inventory. Depending on the nature and intensity of land use, the plots are completely resurveyedevery 3 to 5 years. This is called "Long-Term Monitoring" and entails data collection on the line andbelt transects just as in the initial inventory. Short- and long-term monitoring must be conducted duringthe same time of year as the initial inventory.
Short-Terni Monitoring
The field procedures used in Short-Term Monitoring yield much the same information as those inLong-Term Monitoring, but in lesser detail, particularly with regard to species composition. Theobjective is to gather sufficient information to detect annual changes while minimizing demands on staff.Consequently, the procedures are streamlined and less time-consuming than in Long-Term Monitoring.A list of equipment needed for Short-Term Monitoring is provided in Table 10.
Plot Relocation
Depending on the distance between plots and the nature of the vegetation, up to seven plots can bemonitored in a day. Careful daily planning will minimize travel time between plots. A two-person crewis most cfficient for Short-Tenn Monitoring.
Table 10
Equipment Needed for Short-TermMonitoring of LCTA Plots
" Metal detector" Global positioning system (optional)" Plot relocation notebook" Mattock or shovel" 100-m measuring tape" Compass" Heavy duty clips" 35-mmn camera with print filn (ASA 100 preferred)- 1-in measuring rod with 0.1 m graduations" 7.5-in telescoping range pole" Clipboard- #2 lead pencil" Land use form" Short-term monitoring line transect form* Short-term monitoring belt transect form* Photo log- Plant collection log* Replacement stakes and rods* 4-lb hammer
P hnt press* Hand-held data recorder (optional)
55

Using the Plot Location Notebook, the field crew drives as close as possible to the plot. Referringto the General Location Map, the Specific Location Map and the plot photos, it should be possible towalk to within a few meters of the permanent stake marking the beginning of the transect. (MagneticNorth may vary a few degrees over time, so adjustments must be made to compensate for differencesfrom the azimuths noted on the location maps). In remote areas with few landmarks, a globalpositioning system may be needed to navigate to the site.
Once the search area has been narrowed down to a few square meters, a metal detector and a pickor shovel are used to locate the stake. When the stake has been located, the 100-m measuring tape ishooked to the metal rod and stretched out on the chosen azimuth. The metal detector is used to locatethe rods at the 25, 50, 75, and 100-m points and the tape is clipped to them.
Plot Location Notebook Updates
The plot location maps must be updated to reflect any changes in landmarks since the originalmaps were drawn. Greater detail may have to be added to compensate for the loss of landmarks (suchas a specific tree). Lost or damaged stakes are replaced. If the appearance of the area has changedmarkedly, photographs are taken to replace those in the Plot Location Notebook to aid in relocating theplot. Regardless of apparent changes, a panoramic photograph of the plot is always taken while standingdirectly over the beginning stake. This photo can be compared to the panoramic photograph taken at thetime of initial inventory. All photographs are recorded on a Photo Log (Figure 11).
Land Use Form
The Land Use Form (Figure 17) is completed in the same manner as during the initial inventory,documenting conditions as they exist on the 6 x 100-m plot.
Line Transect
Data are gathered on the line transect using the point-intercept method as in the initial inventory,except in lesser detail. At 1-m intervals, beginning at the 0.5-m point, the tip of the 1-m measuring rodis used to determine the presence and type of disturbance. This is entered onto the Short-TermMonitoring Line Transect form (Figure 28) using the same codes as in the initial inventory (Table 4).Ground cover is recorded using codes from Table 11. Plant species identification is not necessary forShort-Term Monitoring. The presence or absence of canopy cover at any height is determined for eachpoint and recorded as shown in Table 11.
B[lt Transect
Rather than recording the location and height of each woody plant as in the initial inventory,Short-Term Monitoring of the belt transect entails only a tally of each species by 1-m height classes upto 4 m, and a single class for plants higher than 4 m. The same transect width and minimum heightspecified in the initial inventory must be used. Dead but rooted plants are recorded separately, byspecies and height class. The data form is illustrated in Figure 29.
56

LAND CONDITION TREND ANALYSISShort-Term Monitoring
Line Transect
Installation Disturbance N, R,T, P,OPlot Number Ground Cover B, L, R, P, MDate Canopy N, A, and/or P
Tran. Tran.Loc. Dist. Coy. Can. Loc. Dist. Cov. Can.
0.5 25.51.5 26.5
2.5 27.53.5 28.54.5 29.55.5 30.56.5 31.5
7.5 32.58.5 _33.5
9.5 34.5
10.5 _35.5
11.5 _36.5
12.5 _37.5
13.5 _38.5
14.5 _39.5
15.5 40.516.5 41.5
17.5 42.5
18.5 43.519.5 44.5
20.5 45.5
21.5 46.522.5 47.523.5 48.524.5 49.5
Page I
Figure 28. Short-Term Monitoring Belt Transect Form.
57

Table 11
Categories of Ground Cover and Canopy CoverRecorded During Short-Term Monitoring of LCTA Plots
Category Code Description
Ground CoverBare ground B Exposed soilRock R Any rock or gravel > 2 nunLitter L Any detached plant parts, including dead woodPlant P Any attached part of a rooted vascular plantMicrophyte M Any moss. lichen or algae
Canopy CoverNone N No canopy cover above the pointAnnual A Only annual and/or biennial plant cover above the pointPerennial P Only perennial plant cover above the pointBoth A/P Both annual and perennial plants above the point
Wildlife
Short-term wildlife monitoring consists of annual song bird censuses following proceduresdescribed for the initial plot inventory. This provides a minimum level of wildlife information to assessany trends and the relationship of wildlife trends to land use and habitat change.
Long-Term Monitoring
Every 3 to 5 years, a complete Long-Term Monitoring resurvey of the plots is conducted. This isthe basis for documenting overall change in the condition of Army installation natural resources. Thismonitoring is identical to the initial inventory in the reading of the line and belt transects, and surveyingwildlife. However, it proceeds more quickly because the stakes are already established, no maps need bedrawn (other than updating existing maps), no soil samples are taken, and no topographic measurementsare taken. Species identification is facilitated by reference to data from the initial inventory and thelaminated plant collection.
The plot is relocated in the same fashion described for Short-Term Monitoring. Maps are updatedand stakes are replaced as necessary. A panoramic photograph of the plot is taken while standing at thebeginning stake, and the photograph is logged. The Land Use Form is completed, the line and belttransects inventoried, and standard bird and small mammal data collected according to proceduresdescribed for the initial inventory.
58

LAND CONDITION TREND ANALYSISShort-Term Monitoring
Belt Transect
Installation Transect Width (m) I 2_4_6Plot Number Except
Date Minimum Height (in) 0.1 -1.0
Height (meters)
Species Min-I.0 1.0-2.0 2.0-3.0 3.0-4.0 >4.0
Figure 29. First Page of the Short-Term Monitoring Line Transect Form.
59

6 CONCLUSION
This report outlines methods that evaluate the capability of land to meet the multiple-use demandsof the U.S. Army on a sustained basis through short- and long-term monitoring. By establishingrepresentative core and special plots, it is possible to monitor changes in land resource condition and toevaluate change in terms of current land use. Data from regular monitoring of established field plots canbe used to characterize installation natural resources and delineate biophysical and regulatory constraintsto use of the land. Implementing -t:.ndards in collection, analysis, and reporting will make Army-widedata compilation feasible. Over time, this recordkceping system will provide the information needed todevelop and refine land management plans that ensure long-term resource availability.
METRIC CONVERSION TABLE
I in. = 25.4ammI ft = 0.305m
1 acre = 0.4047 hectareI gal = 3.781
REFERENCES
Banks. R.C., R.W. McDiarmid. and A.C. Gardner, Checklist of Vertebrates of the United States, the U.S. Territories, andCanada (U.S. Department of the Interior, Fish and Wildlife Service, Washington, DC, 1987).
Blondel, J.. C. Ferry. and B. Frochet.. "Point Counts With Unlimited Distance," Studies in Aviation Biology, No. 6 (1981), pp
414-420.
Bonham, C.D., Measurement of Terrestrial Vegetation (John Wiley & Sons, New York, 1989).
Cheney. R., Memorandum for Secretaries of the Military Departments. Subject: Environmental Management Policy(Washington, DC, 10 October 1989).
Conner. M.C., R.F. Labisky, and D.R. Progulske. Jr., "Scent-Station Indices as Measures of Population Abundance for Bobcats.Racoons, Gray Foxes, and Opossums." Wildlife Society Bulletin, No. 11 (1983), pp 146-152.
Cook. C.W., and J. Stubbendieck. eds.. Range Research: Basic Problems and Techniques (Society for Range Management,Denver, CO. 1986).
Cross. S.P., "Bats," in A.Y. Cooperrider. R.J. Boyd, and H.R. Stuart. eds., Inventory and Monitoring of Wildlife Habitat (U.S.Department of the Interior. Bureau of Land Management Service Center, Denver, CO. 1986), pp 497-517.
Davis. D.E., CRC Handbook of Census Methods for Terrestrial Vertebrates (CRC Press, Inc., Boca Raton, FL, 1983).
Diersing. V.E., and W.D. Severinghaus, The Effects of Tactical Vehicle Training on the Lands of Fort Carson, CO-AnEcological Assessment Technical Report (TR) N-85/03/ADAI52142 (U.S. Army Construction Engineering ResearchLaboratory IUSACERL]. December 1984).
Diersing, V.E., R.B. Shaw, S.D. Warren. and E.W. Novak, "User's Guide for Estimating Allowable Use of Tracked Vehicles onNon-Wooded Military Training Lands," Journal of Soil and Water Conservation, No. 43 (1988), pp 191-195.
Donnelly, M.. and J.G. Van Ness, "The Warrior and the Druid-DOD and Environmental Law." Federal Bar News and Journal,Vol 33. No. 1 (1986), pp 37-43.
60

REFERENCES (Cont'd)
Douglass, R.J.. "Assessment of the Use of Selected Rodents in Ecological Monitoring," Environmental Management, No. 13(1989), pp 355-363.
Goodall. D.W., "Some Considerations in the Use of Point Quadrants for the Analysis of Vegetation. Australian Journal ofScientiflc Research. Series B. No 5 (1952), pp 1-41.
Goodall, D.W.. "Point-Quadrant Methods for the Analysis of Vegetation." Australian Journal of Botany, No. 1 (1953), pp 457-461.
Goran, W.D., L.L. Radke, and W.D. Severinghaus, An Overview of the Ecological Effects of Tracked Vehicles on Major US.Army Installations, TR N-142/ADA126694 (USACERL. February 1983).
Hatch, Gen. H.J.. Memorandum, Subject: Strategic Direction for Environmental Engineering (Headquarters. U.S. Army Corpsof Engineers IHQUSACEJ, Washington, DC, 14 February 1990).
Heady, H.F.. R.P. Gibbens. and R.W. Powell. "A Comparison of the Charting. Line Intercept, and Line Point Methods ofSampling Shrub Types of Vegetation." Journal of Range Management. No. 12 (1959), pp 180-188.
Jahn, L.R.. C.W. Cook, and J.D. Hughes. An Evaluation of U.S. Army Natural Resource Management Programs on SelectedMilitary Irttallations and Civil Works Projects, (Unpublished) Report to the Secretary of the Army, U.S. Department ofthe Army (1984).
Jensen. J.R., Introductory Digital Image Processing (Prentice-Hall, Englewood Cliffs. NJ, 1986).
Johnson, F.L.. "Effects of Tank Training Activities on Botanical Features at Fort Hood, Texas," Southwest Naturalist, No. 27(1982), pp 309-314.
Jones. K.B, Technical Note 353. Distribution, Ecology, and llabitat Management of the Reptiles and Amphibians of thellual:pai-Aquarius Planning Area, Mohave and Yavapai Counties, AZ (U.S. Department of the Interior. Bureau of LandManagement, Denver, CO. 1981).
Levy. E.B.. and E.A. Madden. "The Point Method for Pasture Analysis." New Zealand Journal of Agriculture, No. 46 (1933).pp 267-279.
Lindzey. F.G., and F.F. Knowlton. "Determining the Relative Abundance of Coyotes by Scent Station Lines," Wildlife SocietyBulletin, No. 3 (1975). pp 119-124.
Mueller-i)ombois, D., and H. Ellcnberg. Aims and Afethods of Vegetation Ecology (John Wiley & Sons, Inc., New York, 1974).
National Military Fish and Wildlife Association, "Resolution 2-Military Land Inventory and Monitoring." Fish and WildlifeNe.s, Vol 5. No. 2 (1988).
RkanscN. C., Memorandum for l)',puty Director, Defense Research and Engineering. Subject: Training Area Management"Tcchnology (Washington, D', 1 Mlach 1989).
Ribansky. S., Draft Technical Rclxrt, Molnitoring Vegetation Change With SPOT Satellite Imagery (USACERL, DecemberI k)QO }.
Roughton, R.D.. and M.W. Sween) , "Refinements in Scent-Station Methodology for Assessing Trends in CarnivorePopulations." Journal of Wildii Managemnent, No. 46 (1982). pp 217-229.
Schaeffer, D.J.. et al.. TR N 86/22/ADA174502. Preliminary Study of Effects of Military Obscurant Smokes on Flora andFauna During Field and Laboraory Exposures (USACERL, 1986).
Schmitt. P, "Corps Program Helps With Award for Fort Sill," Engineer Update, No. 14 (1990).
61

REFERENCES (Cont'd)
Schulz. KA.. R.B. Shaw, and D.J. Tazik. "Status of llaplopappusfremontii A. Gray subsp. monocephalus (A. Nels.) H. M.Hall (Asseraceae) on the U.S. Army Pifhon Canyon Maneuver Site. Colorado," Phytologia (submitted for publication.1991).
Severinghaus. W.D.. and W.D. Goran, TR N-116/ADA111201, Effects of Tactical Vehicle Activity on the Mammals. Birds, andVegetation at Fort Lewis, Washington (USACERL, November 1981).
Severinghaus, W.D.. R.E. Riggins. and W.D. Goran. TR N-77/ADA073782, Effects of Tracked Vehicle Activity on TerrestrialMammals. Birds and Vegetation of Fort Knox, KY (USACERL, July 1979).
Shannon. J.W., Memorandum for Director of the Army Staff. Subject: Land Management-Action Memorandum (Washington.DC, 18 August 1987).
Shaw. R.B., and V.E. Diersing. Unpublished Report, Evaluation of Pitting and Seeding on the PifAon Canyon Maneuver Site,Colorado (USACERL. 1987).
Shaw, R.B.. and V.E. Diersing, "Allowable Use Estimates for Tracked Vehicular Training on Pifion Canyon Maneuver Site,Colorado, USA." Environmental Management, No. 13 (1989), pp 773-782.
Shaw, R.B., and V.E. Diersing, "Tracked Vehicle Impacts on Vegetation at the Piflon Canyon Maneuver Site, Colorado,"Journal of Environmental Quality, No. 19 (1990). pp 234-243.
Shaw, R.B.. et al.. "U.S. Army Land Condition/Trend Analysis of the Pohakuloa Training Area, Hawaii." Proceedings of theInternational Symposium on Tropical Hydrology (American Water Resources Association. Bethesda, MD, 1990), pp455-46.
Tazik. D.J., W.R. Whitworth, and V.E. Diersing, "Using the LCTA Relational Database for Plant Community Classification andWildlife Management," Abstract presented at the Annual Meeting of the American Society of Agronomy, Las Vegas,NV (1989).
Temple, S.A., and J.A. Wiens, "Bird Populations and Environmental Changes: Can Birds Be Bio-ndicaors?", AmericanBirds. No. 43 (1989). pp 260-270.
Technical Note 420-74-3, Army Land Inventory and Monitoring Procedures on Military Installations, (USAEHSC, Fort Belvoir,VA, 1990).
U.S. Army Engineering and Housing Support Center. "Fort Carson Wins National Conservation Achievement Award." DEll
Digest. Vol 2, No. 3 (Fort Belvoir, VA, 1989), p 28.
U.S. Army Land Inventory Advisory Committee. Report of LCTA Review (Washington, DC. 1989).
U.S. Department of Agriculture (USDA) Soil Conservation Service (SCS), SCS Technical Publication No. 159, National List ofScientific Plant Names (1982).
U.S. Department of the Army. Training Circular (TC) 25-1. Training Land (Washington, DC, 1978).
U.S. Department of the Army. Facilities Engineering and lousing Annual Summary of Operations, Fiscal Year 1989 (Office ofthe Assistant Chief of Engineers [OACE]. USAEHSC. Fort Belvoir, VA, 1989).
Warren. S.D., V.E. Diersing, P.J. Thompson, and W.D. Goran. "An Erosion-Based Land Classification Scheme for MilitaryInstallations," Environmental Management, No. 13 (1989). pp 251-257.
Warren. S.D., M.O. Johnson, W.D. Goran. and V.E. Diersing, "An Automated, Objective Procedure for Selecting Representa-tive Field Sample Sites," Photogrammetric Engineering and Remote Sensing, No. 56 (1990). pp 333-335.
62

DISTRIBUTION
Chief of Engineers FORSCOM (20)ATTN: CEHEC-IM-LH (2) ATTN: Envr OfficeATTN: CEHEC-IM-LP (2)ATTN: CERD-L TRADOC (16)
ATTN: Envr OfficeCEIISC 22060ATTN: CEHSC-FN NAVFAC (7)
ATTN: Envr/Natural Res OfcUS Air Force Command
ATTN: Envr/Natural Res Ofc Fort Belvoir, VAAndrews AFB 20031 A'ITN: CECC-R 22060Wright-Patterson AFB 45433Randolph AFB 78150 Defense Technical Info. Center 22304Maxwell AFB 36112 ATTN: DTIC-FAB (2)Elmendorf AFB 99506Scott AFB 62225Itickam AFB 96853 90Peterson AFB 80914 06/91Offutt AFB 68113Langely AFB 23665Boiling AFB 20332
JIQ USAEUR & 7th ArmyATTN: AEAEN-FE-E 09403
V Corps 09079ATTN: AETV-EHF-R
Information Systems CommandATTN ASI-DEII-B
USAMC Instal & Srvc ActivityATTN: AMXF.N-U 61299
Air Forcc -ngr & Srvc CtrATTN: Envr/Naural Res Ctr
HtQ, US Army - Pacific (USARPAC)IDCSt-NGR - A'IT'N: APEN-IV
Fort Shatter, 111 96858Fort Richardson, AK 99505Fort Wainight, AK 99703Fort Grecly, AK 98733
AMC - Dir., Inst., & Svcs.ATTN: Envr Office (18)