New Literacies That make Schools Today Different Than in the Past

U.S. AQUACULTURE: THE PAST,
TODAY AND THE FUTURE …
Chris Weeks
North Central Regional Aquaculture Center
Michigan State University
2013 NIAA Annual Conference
Aquaculture/Aquatic Livestock Committee
April 16, 2013, Louisville, KY

Aquaculture
Aquaculture is defined as the farming of
aquatic organisms in inland and coastal areas,
involving intervention in the rearing process
to enhance production and the
individual or corporate ownership of the stock
being cultivated
(FAO, 2006) Government

Rise of US Aquaculture
1762, overfishing had eliminated striped bass and sturgeons from the Exeter River, New Hampshire
1776 The United States officially declares independence from the British Empire
1790 dams blocked the spawning runs of the alewife and destroyed the fishery at Exeter River

Rise of US Aquaculture
1812 Fishery science began in the U.S.
Philadelphia Academy of Science
curriculum in aquaculture for undergraduates at Cornell University.
1831 -1872 early descriptions of rearing fish in US involved introduction of the common carp into US waters by private residents.
1853 two Cleveland physicians, Theodatus Garlick and H. A. Ackley, performed the first successful artificial fertilization of fish eggs in the United States in 1853.

Early US Aquaculture
1864 Seth Green - 1st trout hatchery Caledonia, New York.
1870 the culture and sale of brook trout.
Also Atlantic salmon, American shad, lake trout, largemouth
bass, lake whitefish, and yellow perch were being cultured
in hatcheries within19 of the then 37 states.
1871 newly formed American Fish
Culturists' Association lobbied Congress
to create the Commission on Fisheries,
Spencer Baird first Commissioner.

Early US Aquaculture
1882 report to Congress, carp fingerlings distributed to applicants in every state and territory in the U.S. in 1478 counties.
Nutrition - one of the main issues by fish culturists Early feeds - raw or cooked fish; boiled lean meat; egg yolk; liver; clabbered milk; a mixture of ground heart, liver, and lungs of beef and pork; and live minnows, worms, and insects (including maggots).
Early 1900’s fisheries upper education programs expanded.

Early US Aquaculture
1932 Auburn University, began experimenting
with fish in small ponds in Alabama. Cornell University established fisheries program.
1934 Auburn began research on the culture of goldfish, fathead minnows and golden shiners as market potential realized for baitfish.
1900 – 1930 fish transportation moved from rail (fish cars) to truck and air.
1950s U.S. Department of Agriculture encouraged farmers to build ponds to conserve soil and water. The potential for these ponds to support sport fishing was quickly realized.

Early US Aquaculture
1958 first dependable dry-pellet diet for trout.
1950 - 1960, annual trout production was estimated at 2 million #/year / essentially no production of channel catfish.
1963 – 1969 surface area for catfish ponds expanded from 948 to16,000.
1966 Fish farming became the fastest growing segment in agriculture in the state of Arkansas. Chanel catfish moved from sport fish to food fish.
1970 Mississippi became the largest catfish producing state.
1985: 49,000 ha in catfish ponds, a 300-fold in 25 years.

Aquaculture Legislative History
1954: Saltonstall-Kennedy Act provides authority for NOAA to support
fisheries research and development including harvesting, processing,
aquaculture, marketing, and associated infrastructures.
1968: National Sea Grant College Program Act provides NOAA with
authority to conduct research, extension, education, and communications
to achieve a sustainable environment and to encourage the responsible
use of America's coastal, ocean, and Great Lakes resources, including
support for aquaculture.
1973: Endangered Species Act requires NOAA to take various actions to
protect and recover all threatened and endangered species under the
Department of Commerce. This includes actions to address potential
impacts from marine aquaculture facilities.

Aquaculture Legislative History
1980: National Aquaculture Act established the policy that it is our nation's
interest, and it is the national policy to encourage the development of
aquaculture in the United States.
Secretary of Commerce is authorized to provide advisory, educational, and technical
assistance and to encourage the implementation of aquaculture technology in
rehabilitation and enhancement of publicly owned fish and shellfish stocks, and in
the development of private commercial aquaculture enterprises.
1985: National Aquaculture Improvement Act amended one section of the
national aquaculture act. (3) Section 2 (a)(7) of the National Aquaculture
Act of 1980, 16 U.S.C. 2801, was amended by this act by inserting
"scientific" before "economic", and by inserting "the lack of supportive
government policies" immediately after management information.

Addressing Concerns for Water Quality Impacts
from Large-Scale Great Lakes Aquaculture
Roundtable Habitat Advisory Board of the Great Lakes Fishery Commission,
Great Lakes Water Quality Board of the International Joint Commission
• Caged aquaculture operations in the Great Lakes are
currently limited by available technology and suitable sites.
• The aquaculture industry is interested in achieving
economically- viable and environmentally-sustainable
operations.
• Both the aquaculture industry and governments want to limit
water quality and habitat impacts.
• Neither caged nor land-based aquaculture is expected to
grow substantially.
August, 1999

US Catfish Production Courtesy: Catfish Institute
0
20
40
60
80
100
120
140
0
100
200
300
400
500
600
700
1983
1985
1987
1989
1991
1993
1995
1997
1999
2001
2003
2005
2007
2009
Cen
ts/lb
Qty
an
d V
alu
e (
foo
d s
ize)
Million lbs
Cents/lb

US Shellfish Production

US Rainbow Trout Production Courtesy: Clear Springs Foods, Inc.
40
45
50
55
60
65
70
75
80
85
1983
1985
1987
1989
1991
1993
1995
1997
1999
2001
2003
2005
2007
2009
2011
Qty
an
d V
alu
e (
foo
d s
ize)
Million lbs
Million $

US Salmon Production www.Maine.gov
0
20
40
60
80
100
120
1983
1985
1987
1989
1991
1993
1995
1997
1999
2001
2003
2005
2007
2009
Qty
an
d V
alu
e
Million lbs
Million $

US Baitfish Production
0
10
20
30
40
50
60
70
80
1983
1985
1987
1989
1991
1993
1995
1997
1999
2001
2003
Qty
an
d V
alu
e
Million lbs
Million $

Catfish 33%
Other Foodfish 14%
Trout 15%
Crustaceans 4%
Mollusks 17%
Ornamental 4%
Baitfish 1%
Sport/Game 6%
Other non-food 6%
$1.0-1.4 Billion
US 2007 Agriculture Census
Source: 2007 USDA Census of Agriculture
Includes State, Federal and Tribal Hatcheries
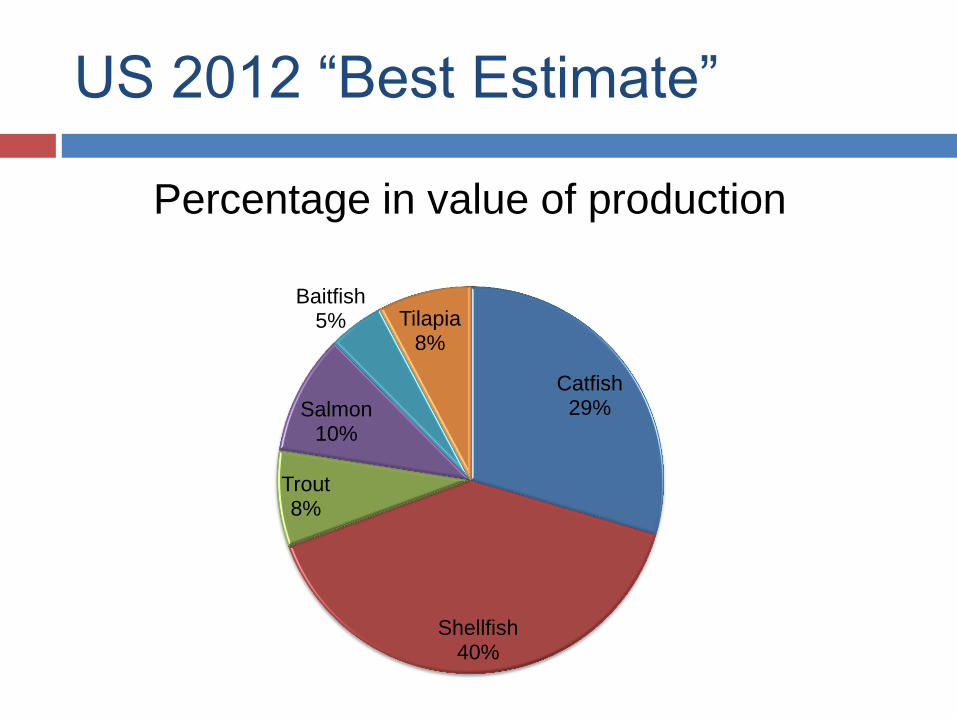
Catfish 29%
Shellfish 40%
Trout 8%
Salmon 10%
Baitfish 5% Tilapia
8%
US 2012 “Best Estimate”
Percentage in value of production

Africa
2%
Americas (-US) 7%
US 1%
China 49%
Asia (w/o China) 32%
Europe 8%
Oceania 1%
Source FAO 2013 database
Total $119 Billion USD
2010 Value Aquaculture Worldwide

70 national fish hatcheries
300 state hatcheries
4,000 commercial aquaculture facilities
US Aquaculture Today

0
0.1
0.2
0.3
0.4
0.5
0.6
Valu
e $
US
D b
illio
n
2000
2010
1.9%
Annual
Increase Source FAO 2013 database
US Aquaculture Today

0
0.1
0.2
0.3
0.4
0.5
0.6V
alu
e $
US
D b
illio
n
US Aquaculture
2000
2010
0
10
20
30
40
50
60V
alu
e in
US
D
billio
n
Global Aquaculture
2000
2010
Africa, Americas, Asia, Europe, Oceania
14.3% Value
Annual Increase
1.9% Value
Annual Increase
Source FAO 2013 database

• Production of aquatic organisms for human consumption;
• Compensate or strengthen the natural population;
• Production of bait fish,
• Production of aquarium fish,
• Mussels for the pearl industry
• Algae for chemical, medicine and food industries
• Research
• Water purification
• Control of aquatic weeds and pests.
Aquaculture Today – a Diversity of Opportunities

Salmon Ranching - Alaska
1971 Alaska Legislature created the
Fisheries Rehabilitation Enhancement
and Development (FRED) Division
within ADF&G
1974 the legislature passed the
Private Nonprofit (PNP)
Hatchery Act.
1988 the legislature authorized
operation of state hatcheries to
be contracted to PNP hatchery
corporations.
Source: NOAA

Pond and Flow Through Systems

Solids Clarifier
Settling basin and siphon
Microscreen drum filter
Serial Re-Use Discharge

Shellfish aquaculture currently
makes up about two-third of
U.S. marine aquaculture.
Pictured here is oyster
aquaculture in Tomales,
California.
Credit: NOAA

Recirculating Aquaculture Systems
New ADFG Anchorage Salmonid RAS Facility

Blue Ridge Aquaculture, Virginia, USA
largest-producing indoor fish farm
in the world

Live feed systems
Rotifers, monia, copepods, etc…
• New algal strains high in DHA for enhancement of live feeds
• Freeze dried algae for ponds and green water systems
• Computer automated marine larvae feeding systems
• Rotifer counter for first feeding (Norway)
• Artemia nauplii rotating drum filters (Taiwan)
• Disinfection methods for live feeds (Scotland)

Aquaponics Systems
Growing Power
integrated systems combining fish, water
gardening plants, vegetables, effluent
treatment,…

AQUACULTURE OF BIOMEDICAL SPECIES
Sponges, soft corals, tunicates,
and bryozoans, have been
harvested for key compounds
extracted for medical and
cosmetic uses.
Treatment of cancer, infectious
diseases, inflammation,
and enhancing immune response.
Study effects of disease – e.g. zebrafish
Harbor Branch Oceanographic

Aquaculture - Today
Aquaculture accounts for 50% of all seafood consumed in the World, and the proportion is growing quickly!
Global Aquaculture Production is valued at $100 Billion.
US Aquaculture production is currently just under $1 Billion.

Aquaculture - Today
US Consumers eat an average of 15 lbs. of fishery products per capita.
2010 USDA Dietary Guidelines for Americans recommends 26 lbs seafood annually per capita.
Global per capita consumption of seafood is 17kg (34 lbs)
Americans consumed 4.7 billion pounds of seafood in 2011, 91% of which was imported (86% in 2010).

U.S. Economic Impact
Farm-gate value: $0.94 Billion
Total value: $5.6 Billion
181,000 full-time jobs
One of the fastest growing sectors of
U.S. agriculture since 1980’s
Source: FAO Fishstat Plus Version 2.30 & Economic-wide impacts of U.S.
aquaculture

2010 US Seafood Deficit
0
2
4
6
8
10
12
14
16
Billions of Dollars
US Seafood Imports
US Seafood Exports
US Seafood TradeDeficit
The current US trade deficit in fisheries products is $10.9 Billion.

Emerging/ Non Traditional in US
Caviar/roe
Cobia
Sea Bass
Meagre
Sea bream
Grouper
Pompano
Yellow and Bluefin Tuna

Emerging
Algae
Sea Vegetables
Sea cucumbers
Kelp
Nori
Dulse

Hot Research Areas
Breeding for Omega-3s
Norway
IMTA Integrated Multi-Trophic Aquaculture
Nutrition Nutrition Nutrition

Source: University of Washington

Hot US Issues
Aquaponics
Sustainability
Energy Energy Energy

Trends RAS
Denitrification
Microbial flocs
De-phosphorus
flocculation
“Zero discharge”
Tilapia in
microbial floc
Nitrifier and
phosphorus
treatment
Anaerobic
denitrification
drum screen
discharge

Hot US Issues
Shellfish industry
+ 12.8% annual increase 1998 - 2008
Catfish industry
- 32% 2007 to 2011
AIS / ANS
Asian Carp
Grass carp (most states sterile only)
Regulations Regulations Regulations
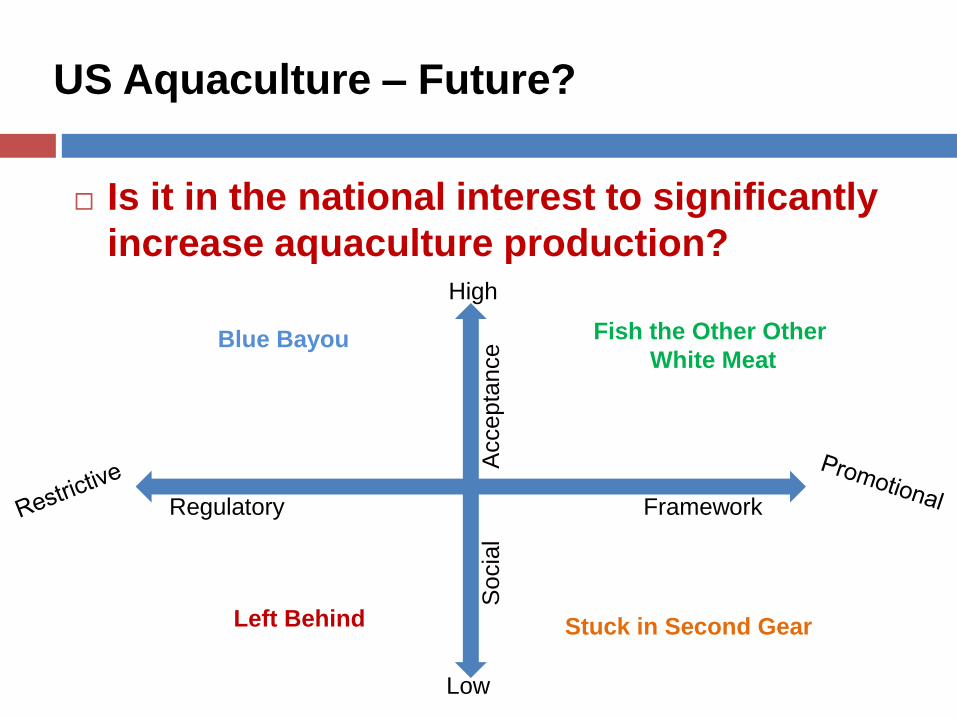
US Aquaculture – Future?
Is it in the national interest to significantly
increase aquaculture production?
Socia
l A
ccepta
nce
Regulatory Framework
High
Low
Fish the Other Other
White Meat Blue Bayou
Left Behind Stuck in Second Gear

Less fishing
Do not see much of PETA
- should expect issues in EU to move in.
Strong momentum for aquaponics
More opportunity for locally grown products
Rising concerns for safe and healthy seafood
BUT – also overwhelming influence of cheaper
available seafood
Trends in US Aquaculture
0.60.81
1.21.41.61.8
1965
1975
1985
1995
2005
MI F
ish
ing
L
ice
nse
s (m
illi
on
)

Major producers tend to be older in age and
highly productive new facilities are rare
Increased burden due to restrictive regulations
Financing through lenders extremely difficult to
obtain
Trends in US Aquaculture

Regulatory Trends
Regulation through restriction rather than
promotion
Increasing use of regulations,
especially Lacey
Complex and redundant

0
2
4
6
8
10
12
14
16
US public laws and acts for invasive species
Lacey Act
1900
Executive Order 13112
1999 NANPCA
1990
National Invasive
Species Act (NISA)
1996
Asian Carp
Prevention and
Control
2010 Num
ber

NCR States Live Fish Importation
Health Certification Guide State (links to
summaries)
OIE Blue
Book
Import
Permit
Listed VHS
at-risk state
Salmonids
(testing - see
below *)
VHS for susceptible
species from non at-
risk states
Baitfish Cool/warm
water fish
species
Illinois c
a
b
d
Indiana e
a
f
Iowa h
g
g
Kansas i
i
Michigan w
w
j
a
k
m
Minnesota o
a
n
o
n
Missouri p
Nebraska s
q
q
q,r
North Dakota t
t
t
t
Ohio u
a
South Dakota
Wisconsin a
v
Footnotes and salmonid testing requirements provided belowhttp://www.ncrac.org/roadmap/regulations.html

Michigan Permits
MDARD
Aquaculture Facility Registration, 1 month
Aquaculture Research Permit, TBD
Prior Entry Permit, < 1 week
DNR
Private Stocking /Public Waters, <15 days
Salmonid Importation, <30 days
Wholesale Minnow Dealer License, <15 days
DEQ
NPDES, 180 days
Groundwater Discharge, 180 days
Water withdrawal, 180 days
Wetland, Inland Lakes & Streams, 2-6 months
Non-Community Water Supply
Potable, well construction
NPDES – Construction, upon reciept
Soil/Sediment Control: local government, TBD
Great Lakes Bottomland, TBD No established process
Federal Bird/Wildlife Depravation As needed, USDA WS &
DOI F&W
http://www.aphis.usda.gov/wildlife_damage/states/pennsylvania/migratory_birds
.shtml
New/Expanding Facility: Priority
Permits

MI Water Discharge
See the MADA Act of 1996, List of Species
– Appendix C
Discharge outlet
To a private or municipal water
treatment facility
No State/DNR permitting needed,
proceed to discharge load arrangement
with your discharge
Ground discharge
Advance to Groundwater
Discharge
See www.michigan.gov/d
eq/0,4561,7-135-3313_4117---,00.html
Irrigation of effluent on cropland
???? Can we address in Irrigation
GAAMP???
To “Waters of the State”
NPDES Process
http://www.michigan.gov/deq/0,4561,7-
135-3313_3686_3728---
,00.html - see Part 4 & Part 8 Rules –
bottom right
This process/rule could benefit from an
assessment tool
Projected Facility production of
>100,000 lbs of fish or > 20,000 lbs
coldwater fish of aquatic species
annually
Yes
Advance to NPDES Permit Application, via the DEQ Surface Water Assessment
Section
See http://www.michigan.gov/deq/0,4561,7-135-3313_3686_3728---
,00.html
No Free to operate without NPDES
discharge permit
Note – unresolved is the question about if
the addition of treatment chemicals will require NPDES
permitting

Bunker survival mode / under the radar??
Waiting to see what the next regulation to be proposed is going to be
Food fish production being seriously outpaced by other countries
Trends towards decreases in recreational fishing likely to add additional burden to baitfish sectors
Trends in Commercial Aquaculture
and Baitfish Sectors

Seeking legitimacy
Certifications
Best Management Practices
Biosecurity Plans
AIS HACCP
Certification?
e.g. certifiable body /3rd party
Industry asking/should have a seat at the table
Trends in Commercial Aquaculture
and Baitfish Sectors

“Aquaculture will be the most likely source of food
fish going into the 21st century. With increasing
seafood demand and declining capture fisheries,
global aquaculture production will have to increase
by 500 percent by the year 2025, to meet the
projected needs of a world population of 8.5 billion.”
USDA Agriculture Research Service 2007

A World in Crisis?
Number of hungry people in the world 2010


Areas of Physical and Economic Water Scarcity
Source: Water for Food, Water for Life. London and International Water Management Colombo: Institute, 2007

United Nations 2010,
Duarte 2009.
FAO Projections 2050

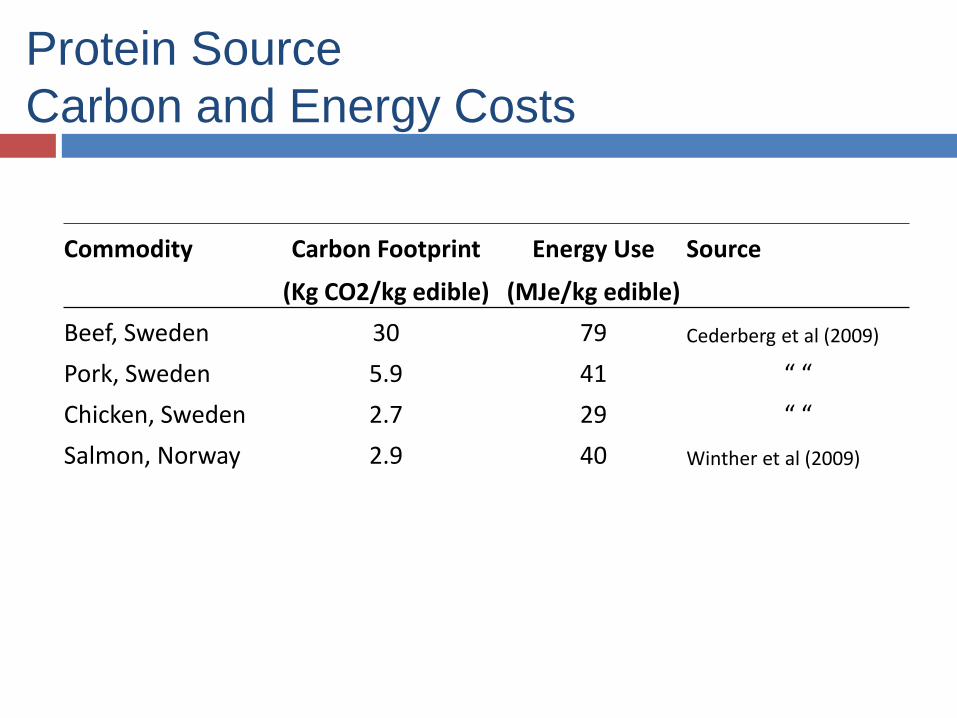
Protein Source
Carbon and Energy Costs
Commodity Carbon Footprint Energy Use Source
(Kg CO2/kg edible) (MJe/kg edible)
Beef, Sweden 30 79 Cederberg et al (2009)
Pork, Sweden 5.9 41 “ “
Chicken, Sweden 2.7 29 “ “
Salmon, Norway 2.9 40 Winther et al (2009)

Protein Conversions and Efficiencies
Protein conversion from grain (protein to protein)
1 kg fish – 13.5 kg grain
1 kg pork – 38 kg grain
1 kg beef – 61 kg grain
Protein efficiency values for major food commodities (%)
Source: Hall et al. 2011, Blue Frontiers
05
1015202530354045
Pro
tein
Eff
icie
ncy (
%)

Health Risks -vs- Benefits

• High-value protein.
• High in Polyunsaturated omega-3 fatty acids
(docosahexaenoic acid -DHA and eicosapentaenoic acid
- EPA).
• Low in saturated fats, carbohydrates and cholesterol.
• Contains a wide range of essential micronutrients
(vitamins A, B, D) and minerals (calcium, iodine, zinc,
iron and selenium.)
Small quantities of fish can have a significant positive
nutritional impact by providing essential amino acids, fats
and micronutrients that are scarce in vegetable-based
diets.
Attributes of Fish as Food Source

Evidence of beneficial effects of fish consumption in
relation to:
• coronary heart disease
• stroke
• age-related macular degeneration
• mental health
• growth and development, in particular for women
and children during gestation and infancy for
optimal brain development of children.
Attributes of Fish as Food Source

http://www.gaalliance.org/update/GOAL10/ChinaMarket.pdf

http://www.gaalliance.org/update/GOAL10/ChinaMarket.pdf
08 09

Growing per capita seafood consumption
FAO, Seafood summit.org
World
China
Hong Kong

0
10
20
30
40
50
60
70
80
90
100
1910 1930 1950 1970 1990 2010
Per
cap
ita a
vail
ab
ilit
y (
lbs)
Beef
Pork
Chicken
Seafood
Source USDA (2010)
US Consumption Share
Minimum seafood
recommended
by FDA

Global Trends – should expect!
Increasing seafood consumption
Increasing seafood production
Increasing pressure from environmental groups
Regulations – health and importation
Animal Welfare
Aquaculture and seafood certification programs “Eco-labels”
Examples, MSC, GAP, Whole Foods

Investments in Aquaculture coming from a
diverse set of investors and sources.
Global Trends – should expect!

US Aquaculture – Future?
Socia
l A
ccepta
nce
Regulatory Framework
High
Low
Fish the Other Other White Meat Blue Bayou
Left Behind Stuck in Second Gear
0
5
10
15
20
Billions of Dollars
US SeafoodImports
US SeafoodExports
US SeafoodTrade Deficit
• Limited expansion shellfish industry
• Catfish continuous decline
• Deficit $100+ Billion
• US shortage of seafood
• Slight expansion of shellfish industry
• Small hobby fish farms and aquaponics
thrive
• Little realized ROI
• Regulatory clarity / streamlined
• US major exporter fish and shellfish
• US per capita consumption in line
with rest of the world
• Multi-billion $ industry

http://www.ncrac.org/
NCR Fish Culture List Serve
(http://www.ncrac.org/node/406)
Aquaculture Information List Serve
Questions?
Chris Weeks
(517) 353-2298