US Antarctic Program McMurdo Consolidated Airfields Study · Number of days that the air...
121
ERDC/CRREL TR-13-5 US Antarctic Program McMurdo Consolidated Airfields Study Phase I, Basis of Design Cold Regions Research and Engineering Laboratory Robert B. Haehnel, Kevin Bjella, Margaret A. Knuth, and Lynette Barna January 2013 Approved for public release; distribution is unlimited.
Transcript of US Antarctic Program McMurdo Consolidated Airfields Study · Number of days that the air...

ERD
C/CR
REL
TR-1
3-5
US Antarctic Program
McMurdo Consolidated Airfields Study Phase I, Basis of Design
Cold
Reg
ions
Res
earc
h an
d En
gine
erin
g La
bora
tory
Robert B. Haehnel, Kevin Bjella, Margaret A. Knuth, and Lynette Barna
January 2013
Approved for public release; distribution is unlimited.

US Antarctic Program ERDC/CRREL TR-13-5 January 2013
McMurdo Consolidated Airfields Study Phase I, Basis of Design
Robert B. Haehnel, Kevin Bjella, Margaret A. Knuth, and Lynette Barna Cold Regions Research and Engineering Laboratory US Army Engineer Research and Development Center 72 Lyme Road Hanover, NH 03755
Final report Approved for public release; distribution is unlimited.
Prepared for National Science Foundation, Office of Polar Programs Washington, DC

ERDC/CRREL TR-13-5 ii
Abstract The US Antarctic Program has an air support system that includes as many as three airfields, the Sea Ice Runway, Williams Field, and Pegasus Runway, to support air operations into and out of McMurdo Station, Antarctica (MCM). These airfields are located on sea ice, snow and glacial ice on the McMurdo Sound, and the Ross Ice Shelf. The airfields are configured to sup-port both wheeled and ski-equipped aircraft during the Austral summer from late August until early March. This study explores the feasibility of consolidating air operations at MCM to a single airfield complex (SAC). This should improve airfield operation efficiency by reducing cost and redun-dancy of facilities and personnel across simultaneously operating multiple airfields. As part of this study, a conceptual design for a SAC is proposed. Our work shows that implementation of a SAC is feasible and can likely be provided for the same cost or less than existing operations. However, more detailed design in the areas of 1) runway location and configuration, 2) fuel delivery, 3) potable water supply, 4) waste handling, and 5) updating of contingency plans for adverse and warm weather need to be provided.
DISCLAIMER: The contents of this report are not to be used for advertising, publication, or promotional purposes. Citation of trade names does not constitute an official endorsement or approval of the use of such commercial products. All product names and trademarks cited are the property of their respective owners. The findings of this report are not to be construed as an official Department of the Army position unless so designated by other authorized documents. DESTROY THIS REPORT WHEN NO LONGER NEEDED. DO NOT RETURN IT TO THE ORIGINATOR.

ERDC/CRREL TR-13-5 iii
Table of Contents Abstract ................................................................................................................................................... ii
List of Figures and Tables ..................................................................................................................... vi
Preface ....................................................................................................................................................ix
Unit Conversion Factors ......................................................................................................................... x
Abbreviations ..........................................................................................................................................xi
Executive Summary ............................................................................................................................. xiv
1 Introduction ..................................................................................................................................... 1 1.1 Background .................................................................................................................... 1 1.2 Project objectives .......................................................................................................... 5
2 Analysis of Three-Airfield to Two-Airfield Operations ................................................................. 7 2.1 Three-airfield system (2001−08) ................................................................................. 7 2.2 Two airfields (2008−09) ............................................................................................... 9
2.2.1 Benefits ........................................................................................................................... 9 2.2.2 Issues ............................................................................................................................ 10 2.2.3 Costs ............................................................................................................................. 11
2.3 Two airfields (2009−10) ............................................................................................. 12 2.3.1 Benefits ......................................................................................................................... 12 2.3.2 Issues ............................................................................................................................ 13 2.3.3 Costs ............................................................................................................................. 13
2.4 Performance comparisons .......................................................................................... 14 2.5 Cost comparisons ........................................................................................................ 17
2.5.1 Time and effort to construct airfield ........................................................................... 17 2.5.2 Aircraft maintenance ................................................................................................... 20 2.5.3 Shuttle service .............................................................................................................. 22 2.5.4 Other cost measures .................................................................................................... 24 2.5.5 Summary ...................................................................................................................... 24
2.6 Review of road and airfield deterioration during 2008−09 ...................................... 24
3 Current Performance Requirements for McMurdo Airfield Operations ................................. 29 3.1 Safety ........................................................................................................................... 29
3.1.1 White-out landing area................................................................................................. 29 3.1.2 Aircraft rescue and firefighting (ARFF) ........................................................................ 30 3.1.3 Mass casualty incident procedure .............................................................................. 30 3.1.4 Inclement weather sheltering ...................................................................................... 30 3.1.5 Environmental considerations ..................................................................................... 31
3.2 Availability .................................................................................................................... 32 3.3 Airframes supported.................................................................................................... 33

ERDC/CRREL TR-13-5 iv
3.4 Payload capacity .......................................................................................................... 33 3.5 PAX capacity ................................................................................................................. 35 3.6 Flexibility ....................................................................................................................... 36
4 Issues or Concerns that Need to be Addressed to Establish a Single Airfield Complex at McMurdo .................................................................................................................. 38 4.1 Showstoppers .............................................................................................................. 38
4.1.1 Airfield and road maintenance .................................................................................... 38 4.1.2 Fuel transportation ...................................................................................................... 42
4.2 High priority issues ...................................................................................................... 44 4.2.1 Airfield design and support .......................................................................................... 45 4.2.2 Transportation .............................................................................................................. 46 4.2.3 Local fuel transport and storage ................................................................................. 47 4.2.4 Infrastructure ............................................................................................................... 48 4.2.5 Operation of the long-duration balloon (LDB) facility ................................................. 52
4.3 Future considerations ................................................................................................. 53 4.4 Benefits ........................................................................................................................ 53
5 Results of 2009−11 Field Experiments and Observations ..................................................... 54 5.1 Snow survey ................................................................................................................. 54 5.2 Skiway and runway monitoring ................................................................................... 57
5.2.1 Airfield maintenance .................................................................................................... 57 5.2.2 Runway and skiway surface and subsurface temperature measurements ............. 58 5.2.3 Strength and density measurements ......................................................................... 61 5.2.4 Results .......................................................................................................................... 62
6 Concept of Design ........................................................................................................................ 74 6.1 Location........................................................................................................................ 74 6.2 Configuration ............................................................................................................... 75 6.3 Infrastructure ............................................................................................................... 77
6.3.1 Air traffic control and ground control .......................................................................... 77 6.3.2 Fuel supply and distribution ........................................................................................ 78 6.3.3 Electric power supply and Communication ................................................................ 78 6.3.4 PAX terminal and on-site cargo storage ..................................................................... 79 6.3.5 Food services and water supply .................................................................................. 79 6.3.6 Waste handling ............................................................................................................ 80
6.4 Contingency operations............................................................................................... 80 6.5 Cost analysis ................................................................................................................ 81
7 Conclusions and Recommendations ......................................................................................... 82
References ............................................................................................................................................ 84
Appendix A: Data, Three-Airfield Operation ...................................................................................... 86
Appendix B: Data, Two-Airfield Operations ....................................................................................... 88
Appendix C: Summary of 27 May 2009 McMurdo Airfield Stake Holders Meeting .................... 90

ERDC/CRREL TR-13-5 v
Appendix D: Correlation of Airfield Air Temperature Data with the McMurdo Station Data ................................................................................................................................................ 94
Appendix E: Pegasus Condition Procedures for 2010−11 Season ................................................ 98
Appendix F: Warm weather procedures for Pegasus Airfield ...................................................... 102
Report Documentation Page

ERDC/CRREL TR-13-5 vi
List of Figures and Tables
Figures
Figure 1-1. General layout of roads and airfields at MCM for the summer season of 2005−2006 ........................................................................................................................................ 3
Figure 2-1. Comparison of airfield load for the three airfields from 2007−10. ................................. 16
Figure 2-2. Total number of maintenance related cancellations from 2002−10 .............................. 21
Figure 2-3. Maintenance hours for LC-130s at McMurdo for 2006−10 ............................................ 21
Figure 2-4. Comparison of the average daily air temperature at Pegasus Airfield during the summer seasons of 2008−09 and 2009−10 to the average daily air temperature over the period of record (1973−2008). ........................................................................................ 26
Figure 2-5. Number of days that the air temperature is over −5°C at Pegasus airfield ................... 28
Figure 4-1. Use of challenger trailers to deploy flexible pipeline between Scott Base and PEG. ................................................................................................................................................... 44
Figure 4-2. Road network at McMurdo during the 2009−10 season ................................................. 47
Figure 4-3. Planned waste handling system. ......................................................................................... 51
Figure 4-4. Wastewater generated at the Pegasus airfield during the 2009–10 season. ............... 52
Figure 5-1. Location of the poles installed between PEG and WF during the 2009–10 season. .............................................................................................................................................. 55
Figure 5-2. Summary of snow accumulation studies taken between PEG and WF. .......................... 56
Figure 5-3. Subsurface structure of the snow pack in the Ross Ice shelf at several locations between PEG and WF. ...................................................................................................... 57
Figure 5-4. Location of temperature monitoring strings installed in the skiway and WI runway at PEG during the 2009–10 summer season. ................................................................. 60
Figure 5-5. Cone and tip geometry for the Rammsonde and Russian Snow Penetrometer ............. 61
Figure 5-6. Measured subsurface temperature for all six monitoring locations in the PEG WI runway. ......................................................................................................................................... 64
Figure 5-7. Vertical temperature profiles measured on 17 January 2010 at the 2000-ft mark on the WI runway. ................................................................................................................... 65
Figure 5-8. Estimated hourly surface temperature and depth of 0°C isotherm on the PEG white ice runway 2009−10 season. ............................................................................................... 65

ERDC/CRREL TR-13-5 vii
Figure 5-9. Strength measurement profiles for the PEG white ice runway using the RSP. ............... 67
Figure 5-10. Temperature and strength of the WI runway during the summer of 2009–10. .......... 69
Figure 5-11. Measured runway strength as a function of the average daily temperature of the runway at the 10 cm (4-in.) depth at the 2000-ft runway marker ......................................... 70
Figure 5-12. Extrapolated surface temperatures of the skiway at PEG, based on the measured subsurface temperature data. ...................................................................................... 71
Figure 5-13. Extrapolated depth to which the 0°C isotherm reaches based on the measured subsurface temperature data. ...................................................................................... 72
Figure 5-14. Strength measurements taken on the skiway ay PEG. ................................................... 73
Figure 6-1. Initial design concept for the SAC. ....................................................................................... 76
Tables
Table 2-1. Intercontinental flights for season 2007−08 ........................................................................ 7
Table 2-2. Missions canceled or aborted for season 2007−08 ............................................................ 7
Table 2-3. Intercontinental flights for season 2008−2009. .................................................................. 9
Table 2-4. Missions canceled or aborted for season 2008−2009. ...................................................... 9
Table 2-5. Intercontinental flights for season 2009−2010. ................................................................. 12
Table 2-6. Missions canceled or aborted for season 2009−2010 (RPSC 2009−2010). ................. 12
Table 2-7. Comparison of payload and PAX transported, and missions flown, through the McMurdo Airfield system from 2004−2010. ................................................................................. 14
Table 2-8. Effort needed to open airfields at McMurdo, Antarctica. ................................................... 18
Table 2-9. Total effort to operate the airfields in terms of man-hours.. .............................................. 19
Table 2-10. Total effort in terms of man-hours to operate all of the airfields ..................................... 19
Table 2-11. Distances to airfields via McMurdo road system. ............................................................. 23
Table 2-12. Average PAX and cargo shuttle distance for airfield operations during the 2007−2010 seasons. ...................................................................................................................... 24
Table 3-1. Weight of payload delivered from 2004 to 2010. ............................................................. 34
Table 3-2. Comparison between payload offered and delivered in millions of lb. ............................. 34
Table 3-3. PAX moved from 2004 to 2010 ............................................................................................ 36

ERDC/CRREL TR-13-5 viii
Table 4-1. Comparison of effort for transferring fuel at the McMurdo airfields. ................................ 43
Table 5-2. Initial and final depth of the top temperature sensors placed in the runway and skiway at PEG. ................................................................................................................................... 60
Table 5-3. Summary of the density measurements taken at the PEG airfield prior to opening for mainbody flight operation ........................................................................................... 63

ERDC/CRREL TR-13-5 ix
Preface
This report was prepared by Dr. Robert B. Haehnel, Terrestrial and Cryospheric Sciences Branch (CEERD-RR-G); Kevin Bjella, Force Projec-tion and Sustainment Branch (CEERD-RR-H); Margaret A. Knuth, Force Projection and Sustainment Branch; and Lynette Barna, Force Projection and Sustainment Branch; Research and Engineering Division (CEERD-RR); US Army Engineer Research and Development Center/Cold Regions Research and Engineering Laboratory (ERDC/CRREL).
The authors thank Angela Yuan, for her assistance in making runway and skiway strength measurements, collecting data from the field instruments, and documenting field conditions during the 2009–10 summer season at McMurdo, and Brian Tracy, CRREL, for accessing satellite imagery and providing GIS support.
At the time of publication, the Chief of the Terrestrial and Cryospheric Sci-ences Branch was Janet P. Hardy; the Chief of the Force Projection and Sustainment Branch was Dr. Edel Cortez; and the Chief of the Research and Engineering Division was Dr. Justin B. Berman. The Deputy Director of ERDC-CRREL was Dr. Lance D. Hansen and the Director was Dr. Rob-ert E. Davis.
COL Kevin J. Wilson was the Commander and Executive Director of ERDC, and Dr. Jeffery P. Holland was the Director.

ERDC/CRREL TR-13-5 x
Unit Conversion Factors
Multiply By To Obtain
British thermal units (International Table) 1,055.056 joules
degrees Fahrenheit (F-32)/1.8 degrees Celsius
feet 0.3048 meters
gallons (US liquid) 3.785412 E-03 cubic meters
inches 0.0254 meters
knots 0.5144444 meters per second
miles (US statute) 1,609.347 meters
pounds (force) per square inch 6.894757 kilopascals
pounds (mass) 0.45359237 kilograms

ERDC/CRREL TR-13-5 xi
Abbreviations ACL Allowable Cargo Load
AMC Air Force Air Mobility Command
ARFF Aircraft Rescue and Fire Fighting
ATCT Air traffic control tower
ATV All-terrain vehicles (e.g., Deltas and terrabus)
CHC Christchurch, New Zealand
CL centerline
Comms communication
CRREL Cold Regions Research and Engineering Laboratory, Hanover, NH
DNF Do not freeze
FEMC Facilities Engineering, Maintenance and Construction
IFR Instrument Flight Rules
KBA Kenn Borek Air , Ltd.
LDB Long Duration Balloon
Mainbody Transportation of the main body of passengers and cargo through McMurdo This starts annually around 1 October and lasts through late February
MCM McMurdo Station, Antarctica
MCx maintenance related flight cancellations
MEDEVAC Medical emergency evacuation
MRSF Mobile runway support facility
MRE meals-ready-to-eat
MLS Microwave landing system
NAVAID Navigational aid
NPX Amundsen–Scott South Pole Station

ERDC/CRREL TR-13-5 xii
NYANG Air Force New York 109th Air National Guard
NSF National Science Foundation
PAX Passenger transport (via land or air).
PEG Pegasus Runway
OPP Office of Polar Programs
OPTEMPO Operations tempo
RPSC Raytheon Polar Services Company
RSP Russian Snow Penetrometer
SAC Single airfield complex
SIR Sea ice runway
SPAWAR Space and Naval Warfare Systems Command
SPoT South Pole Traverse
SPRINGFLY Spring fly-in of support crew and cargo that ordinarily takes place annually at the end of winter (late August). Occasionally this fly-in of support crew and cargo occurs in early September and is referred to as SPRINGFLY.
SPSM South Pole Station Modernization
SRT Snow Roads and Transportation
TACAN Tactical Radar system
TERPS Terminal instrument approach procedures
TLS Transponder landing system
USAF US Air Force
USAP United States Antarctic Program
VFR Visual flight rules
VMF Vehicle maintenance facility
WI White ice, specifically snow that has been compacted to a density that approaches that of ice.
WO White-out; specific reference to fog or blowing snow conditions that produce zero visibility.

ERDC/CRREL TR-13-5 xiii
WINFLY Winter fly-in of support crew and Cargo. This takes place annually at the end of winter (late August).
WF Williams field
WWTF waste water treatment facility

ERDC/CRREL TR-13-5 xiv
Executive Summary
The US Antarctic Program has an air support system that includes as many as three airfields, the Sea Ice Runway (SIR), Williams Field (WF), and Pegasus Runway (PEG), to support air operations into and out of McMurdo Station, Antarctica (MCM). These airfields are located on sea ice, snow and glacial ice on the McMurdo Sound, and the Ross Ice Shelf, respectively. The airfields are configured to support both wheeled and ski-equipped aircraft during Austral summer from late August until early March. These three airfields have been developed to accommodate the changing environmental conditions and still maintain an airfield as close as possible to MCM through the summer season.
This study explores the feasibility of consolidating air operations at MCM to a single airfield complex (SAC). This should improve the efficiency of airfield operations by reducing cost and redundancy of facilities and per-sonnel across multiple airfields operating simultaneously. To help in this assessment, we use data from the 2008−10 seasons, in which the number of airfields operated was reduced from three to two. During the 2008−09 season, WF and PEG were operated simultaneously all season long. Dur-ing the 2009−10 season, there was a sequential operation of first the SIR, followed by a switch over to PEG in early December. Additionally, we eval-uated the impact of potential problems that may make it difficult to estab-lish a SAC at MCM, which were identified by the stakeholders in the air operations at MCM, namely, the National Science Foundation (NSF), US Air Force (USAF), New York Air National Guard (NYANG), Space and Na-val War Systems Command (SPAWAR), and the NSF prime contractor for Antarctic Operations (Raytheon Polar Services Company or RPSC, at the time of this study). Finally, a field program was initiated during the 2009−10 season to better understand the problems related to establishing a SAC as well as to explore methods to resolve the identified problems. Da-ta from all of these sources were used to analyze the feasibility of establish-ing a SAC.
By comparing the performance of the operations as the airfield configura-tion transitioned from three airfields (2007−08 season and earlier) to two (during the 2008−09 and 2009−10 seasons), we found no adverse impact on meeting required payload demands. In fact, the payload handled with

ERDC/CRREL TR-13-5 xv
the two-airfield operations was on par with the maximum throughput dur-ing three-airfield operations in almost all categories. Furthermore, during seasons with two-airfield operations, the annual payload transferred to in-land camps exceeded that handled during recent (2000−08) performance of the three-airfield operations. This was likely not attributable to any in-trinsic limitation of the three-airfield system; rather, it demonstrates the flexibility of the system to handle the increasing demand, in spite of in-cremental variations in airfield configuration.
One area that was greatly affected during the transition from three-airfield operations to two-airfield operations is the snow roads, which deteriorated during the 2008−09 season. It is unclear whether this was solely or pri-marily a result of the continuous use of the roads (from 30 September through 22 February) or the statistically warmer weather experienced dur-ing that season. This issue was not laid to rest during the following season (2009−10) owing to it being a statistically cooler summer during which the roads performed well all season.
A review of the relative cost of seasonal airfield construction indicates a 38% potential savings in construction costs by transitioning to a SAC. However, no noticeable savings have been realized in the near term with the transition from a three-airfield to a two-airfield configuration. Fur-thermore, cost savings in one area, such as airfield construction, could be offset by increases in another area, such as increased shuttle service costs because of increased fuel and road and vehicle maintenance necessitated by increasing transit distance.
As part of this study, a conceptual design for a SAC is proposed. It is rec-ommended that it should be established on the Ross Ice Shelf, as close to MCM as is possible, while still providing a runway sited on the glacial ice to support landing of wheeled aircraft. According to available snow accu-mulation data, this means that the SAC would likely be located at or near the current location of PEG, as the amount of snow that accumulates on the Ross Ice Shelf increases rapidly east of PEG. In the proposed design, two skiways would be constructed, in addition to a white ice runway; the main skiway would be oriented with the prevailing wind, and the second crosswind skiway would be aligned with the storm winds, and be parallel to the white ice runway. This would allow the LC-130s to land on a skiway separate from the white ice runway during cross wind conditions, thereby avoiding excessive soot being deposited on the white ice runway. The loca-
ERDC/CRREL TR-13-5 xvi
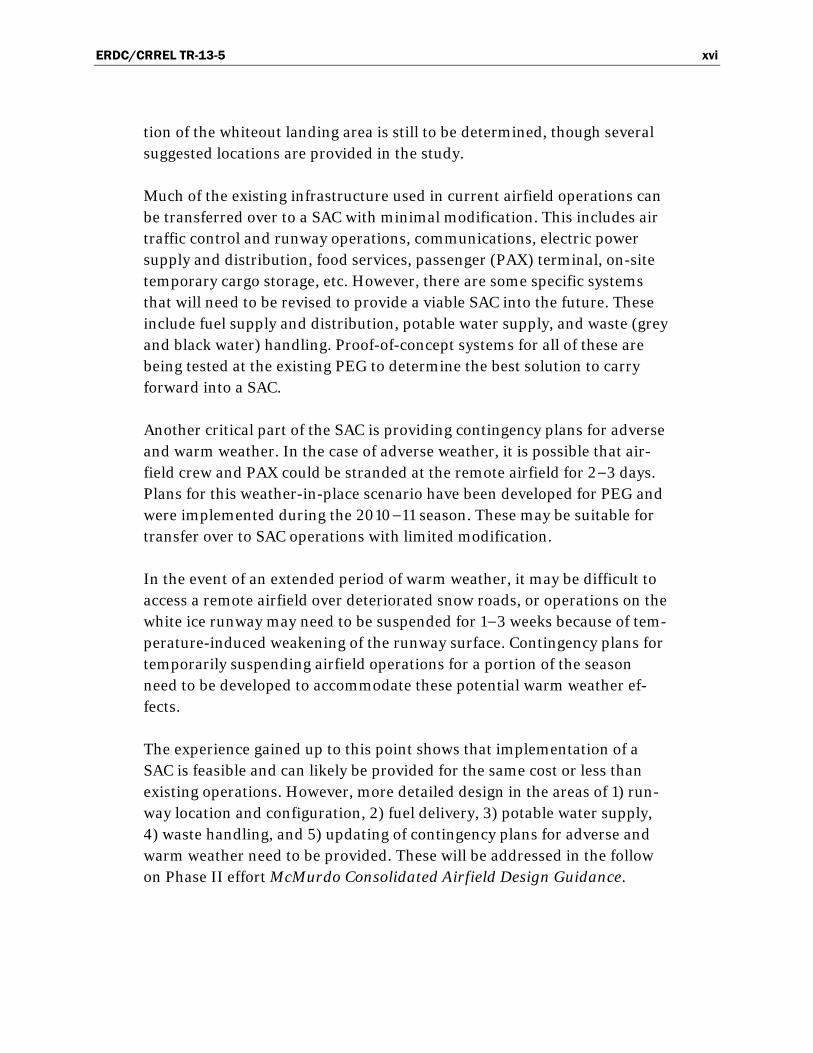
tion of the whiteout landing area is still to be determined, though several suggested locations are provided in the study.
Much of the existing infrastructure used in current airfield operations can be transferred over to a SAC with minimal modification. This includes air traffic control and runway operations, communications, electric power supply and distribution, food services, passenger (PAX) terminal, on-site temporary cargo storage, etc. However, there are some specific systems that will need to be revised to provide a viable SAC into the future. These include fuel supply and distribution, potable water supply, and waste (grey and black water) handling. Proof-of-concept systems for all of these are being tested at the existing PEG to determine the best solution to carry forward into a SAC.
Another critical part of the SAC is providing contingency plans for adverse and warm weather. In the case of adverse weather, it is possible that air-field crew and PAX could be stranded at the remote airfield for 2−3 days. Plans for this weather-in-place scenario have been developed for PEG and were implemented during the 2010−11 season. These may be suitable for transfer over to SAC operations with limited modification.
In the event of an extended period of warm weather, it may be difficult to access a remote airfield over deteriorated snow roads, or operations on the white ice runway may need to be suspended for 1−3 weeks because of tem-perature-induced weakening of the runway surface. Contingency plans for temporarily suspending airfield operations for a portion of the season need to be developed to accommodate these potential warm weather ef-fects.
The experience gained up to this point shows that implementation of a SAC is feasible and can likely be provided for the same cost or less than existing operations. However, more detailed design in the areas of 1) run-way location and configuration, 2) fuel delivery, 3) potable water supply, 4) waste handling, and 5) updating of contingency plans for adverse and warm weather need to be provided. These will be addressed in the follow on Phase II effort McMurdo Consolidated Airfield Design Guidance.

ERDC/CRREL TR-13-5 1
1 Introduction 1.1 Background
A system of airfields exists at McMurdo Station (MCM), Antarctica, to support the operation of the US Antarctic Program (USAP). This system has historically consisted of three airfields: the Sea Ice Runway (SIR), Wil-liams Field (WF), and Pegasus Runway (PEG). Each airfield has special characteristics that make it ideal for particular aircraft and for a particular time of the operating season. This system has evolved over the years to handle much larger payload aircraft from the early days of Operation Deep Freeze, but remains somewhat unchanged in the fundamentals of aircraft movement to and from MCM.
All of these airfields service cargo and passengers (PAX) traveling between MCM and Christchurch (CHC), New Zealand. These missions are intercon-tinental flights, and are currently serviced by the wheeled C-17 Globemaster III operated by the US Air Force (USAF) and the LC-130 Hercules ski-equipped aircraft operated by the New York Air National Guard (NYANG). Prior to the C-17, the C-141 Star Lifter and C-5 Galaxy1 were used, in addition to the LC-130. The airfields also service cargo and PAX between MCM and inland locations, i.e., Amundsen–Scott South Pole Station (NPX) and other research locations on the Antarctic continent re-ferred to as “inland camps” or “deep field camps.” These intracontinental missions are primarily accommodated with the LC-130s, and secondarily with the de Havilland DHC-6 Twin Otter and Basler DC-3T aircraft oper-ated by Kenn Borek Air, Ltd. (KBA). All the intracontinental aircraft are outfitted with skis on all missions.
Additional aircraft that operate less frequently at the MCM airfields are the C-130 and L-100 Hercules, Airbus A319, Boeing 757, and P3 Orion; these are all wheeled aircraft. Thus, owing to the type of aircraft serviced at MCM, aircraft that land on wheels and skis must be handled at the MCM airfields.2
1 The C-5 is still available for transporting heavy cargo. However, it has not been used in many years
owing to the lack of need to transport large or heavy freight. 2 Additionally, helicopters are used to support missions and operations of the USAP, though their re-
quirements for airfield support are minimal in comparison to fixed wing aircraft.

ERDC/CRREL TR-13-5 2
The research field season begins with the winter fly-in (WINFLY) in late August. This is a preseason boost in station personnel approximately 6 weeks before the beginning of the main season or “mainbody.” WINFLY was traditionally handled by LC-130s flying from CHC to MCM and land-ing on the skiway at WF, east of MCM on the Ross Ice Shelf (right side of Fig. 1-1). Williams field is approximately 7 miles driving distance from MCM, with about 2 miles of that transit on gravel road on Ross Island, and the remaining distance on ice and snow roads.
Following WINFLY, the SIR is constructed on the sea ice in McMurdo Sound near MCM (upper left, Fig. 1-1) to support the initial flow of cargo and PAX during the early part of mainbody, which starts around 1 Octo-ber. The SIR has a sufficiently strong surface to land wheeled aircraft and services all missions during this time. Using a sufficiently hard surface during mainbody allows the heavier payload aircraft to be used for heavy lifts between CHC and MCM, while also allowing for intracontinental flights by the LC-130s and the smaller aircraft operated by KBA. Access to the SIR is via the sea ice transition (indicated as the “VXE-6 transition” in Fig. 1-1); the travel distance to the SIR from MCM is very short, typically 1 to 2 miles for approximately a 15-minute travel time. The SIR does not remain operational for the full summer season for two reasons:
1. As temperatures increase to near freezing during the summer season, the ice becomes too weak to support airfield operations.
2. The sea ice is broken up by icebreaker in this area during January to allow fuel and cargo carried on sea-going vessels to reach McMurdo Station in late January, early February.
The actual location of the SIR has varied from year to year to avoid un-workable annual or multi-year ice. Figure 1-1 shows where it was located in 2005−06, and Figure A-1 (Appendix A) shows how the location of this runway has varied from year to year. Until 1993, when operations ceased at the SIR around the first week of December, all aircraft operations were returned to WF, meaning all intercontinental flights were then handled by the smaller and less fuel efficient LC-130s during the last part of mainbody (approximately 15 December–late February).

ERDC/CRREL TR-13-5 3
Figure 1-1. General layout of roads and airfields at MCM for the summer season of 2005−2006 (Scanniello RPSC).
PEG (located at lower left of Fig. 1-1) was put into service in 1993 on the glacial ice near the former Outer Williams Field, which was operated by the US Navy during the early years of Operation Deep Freeze (the current airfield takes its name from the C-121 aircraft “Pegasus,” which crashed on landing at the SIR and was towed to this location to serve as an ad hoc shelter). Details of the siting, construction, and certification of this airfield are given in Blaisdell et al. (1998) and Air Force (2002). The initial pur-pose for this new runway was to support landing of wheeled aircraft dur-ing the last part of the summer season after the SIR was closed; before 1993 there was no capability to operate wheeled aircraft in and out of MCM year-round. The runway’s basic construction consists of a thin cap of compacted snow (per the Engineer Technical Letter [ETL] no more than 5 in. thick) on top of level graded glacial ice. The “snowcap” is provided to protect the underlying glacial ice from deterioration via absorption of solar radiation. The white snow has a higher albedo than the glacial ice and, therefore, reflects more incoming solar radiation. The snowcap is com-pacted into a hard ice layer to support the high contact pressure of wheeled aircraft.

ERDC/CRREL TR-13-5 4
Access to this new airfield can be via two routes. In the early part of the season, while it is still safe to transit across the sea ice, PEG is accessed via the “Pegasus Shortcut” road (Fig. 1-1), a distance of approximately 8 miles from MCM to PEG. After the Pegasus Shortcut is closed down in mid-season because of warming weather, PEG is accessed via the 15.9-mile route that follows the 2.1-mile gravel road from MCM to the Scott Base transition, then on to Willy Road, Pegasus Cut-across, and the Pegasus Road (Fig. 1-1) (Seman 2009).
Introduction of PEG in 1993 changed operations at MCM from two air-fields to a three-airfield system. WINFLY was still handled at WF and the start of mainbody took place at the SIR. After closing of the SIR, opera-tions were then split between PEG and WF, with the intercontinental flights being handled mainly with heavier wheeled aircraft (C-141 early on and now the C-17) landing at PEG, and the intracontinental flights being serviced out of WF with ski-equipped LC-130s and smaller KBA aircraft. During the later part of mainbody, when WF and PEG are operated simul-taneously, the bulk of the activity was concentrated at WF where the LC-130s flew four−six missions per day while PEG serviced two−three flights per week (mainly C-17s flying between CHC and MCM) (Blaisdell 2008). Starting in 2001 there was a shift in operations, with WINFLY operating out of PEG rather than WF. This allowed WINFLY to use the larger and more efficient C-17s. Otherwise, the three-airfield system operated largely unchanged from 1993 to 2008.
The 2008−09 summer season saw the first major change to airfield opera-tions at MCM in over a decade. During this season the SIR was not operat-ed; this was done to study the effect of eliminating one airfield on the overall cost of airfield operations at MCM. As normal, WINFLY was ser-viced through PEG, and then mainbody was serviced via WF and PEG, with the NYANG and KBA operating out of WF and the USAF landing C-17s at PEG. This was the first time that either WF or PEG had been operat-ed for the full summer season. Several problems were encountered during this pilot study, and these are discussed in Section 3. However, one of the biggest problems during this season was the deterioration of roads and airfields. There was also a question about cost reduction to the USAP by not operating the SIR, as it has been historically one of the least costly air-fields to build and operate at MCM. Greater cost savings might be realized if operation of WF was suspended; estimates put the cost of running WF at two–three times that of running the SIR (Blaisdell 2009).

ERDC/CRREL TR-13-5 5
In light of the experience gained during the 2008−09 season, airfield op-erations were modified for the 2009−10 field season. Operations were again limited to two airfields, but this time it was sequential operation of the SIR and PEG airfields. WINFLY was operated out of PEG, and the SIR was opened 29 September for the start of mainbody. PEG was then used for mainbody flights starting 7 December 2009, with operation continuing at PEG for the balance of the season. WF was constructed with minimal airfield service (lights, etc.) to provide an alternate landing site if weather conditions prevented ski-equipped aircraft from landing at PEG. In the past, the LC-130s operated out of WF, and this would be the first time they would be regularly flown out of PEG. As control of the snow albedo is criti-cal to preservation of a hard white-ice runway at PEG during the warm pe-riod, the runway has to be protected from dark particles (soot, soil, etc.), yet the LC-130s are notoriously dirty aircraft and emit large amounts of soot during operation. To isolate this soot from the white-ice runway needed to support heavy wheeled aircraft, a skiway was constructed at PEG to support LC-130 operation. Additionally, the townsite was expand-ed and relocated to accommodate the skiway and the greater number of people (PAX and airfield crew) that would operate out of PEG.
The layout of the Pegasus airfield with this new skiway is shown in Figure B-1 (Appendix B). The new PEG airfield still has the original cross-wind white ice runway built on the glacial ice. The new skiway is aligned with the prevailing winds. This allows the LC-130s and other ski-equipped air-craft to use the white ice runway during periods when the cross wind on the skiway is above flight minimums (greater than 15 knots for the LC-130). In the event that the ski equipped vehicles need to use the white-ice runway, they land or take-off on wheels as this is the preferred mode of operation where practical (i.e., runway or skiway strength supports wheeled operation).
1.2 Project objectives
These incremental changes in airfield operations at MCM have allowed a better understanding of the operational envelope within the current sys-tem. The transition from the three-airfield system, used until the 2007−08 summer season, to a two-airfield system starting in 2008−09 has demon-strated that changes can be made to the air logistics system at MCM while maintaining the required level of service for the USAP.

ERDC/CRREL TR-13-5 6
The objective of this Phase I study is to explore the feasibility of migrating from the currently evolving two-airfield system to a single airfield complex (SAC). In Section 2, we give a detailed review and analysis of the perfor-mance and cost savings of the two-airfield system used during 2008−10 in comparison to the previous three-airfield system. This information is then used to project the possible cost savings that can be realized with the pro-posed SAC. In Section 3, we provide a summary of the airfield system re-quirements that are needed to support the USAP. These represent perfor-mance metrics that need to be achieved with a SAC. In Section 4, we provide a detailed discussion of the issues that need to be overcome to im-plement a SAC. These give an outline of where effort needs to be focused as a detailed design of the SAC is developed. In Section 5, we summarize the results of the field observations and experiments conducted in associa-tion with this effort starting in the 2009−10 summer season at PEG. Sec-tion 6 is a preliminary concept design for the SAC, based on lessons learned and material outlined in Sections 2−5. This design would be fur-ther refined under the Phase II: Airfield Design Guidance effort that is proposed to start in the last half of 2010. Conclusions and recommenda-tions are provided in Section 7.

ERDC/CRREL TR-13-5 7
2 Analysis of Three-Airfield to Two-Airfield Operations
2.1 Three-airfield system (2001−08)
A summary of the most recent three-airfield operation (2007−2008) summer season is given in Tables 2-1 and 2-2. WINFLY began on 20 Au-gust 2007 at PEG and lasted through 28 August. This included normal WINFLY operations being carried out from 20−25 August and an un-scheduled MEDEVAC on 28 August. Mainbody started on 2 October 2007. The SIR was in operation from 2 October to 1 December. PEG started op-erations for intercontinental flights on 4 December and concluded flight operations on 25 February 2008. WF started operations on 3 December for intracontinental flights and concluded flight operations on 14 February 2008. A total of 88 intercontinental and 378 intracontinental (South Pole and inland camps) missions were flown.
Table 2-1. Intercontinental flights for season 2007−08 (RPSC 2008).
Aircraft Missions flown, WINFLY (PEG) Missions flown,
Mainbody SIR PEG WF C-17 4 54 26 28 0 LC-130 0 25 11 0 14 C-130 0 3 2 1 0 Airbus A-319 0 2 2 0 0 Total 4 84 41 29 14
Table 2-2. Missions canceled or aborted for season 2007−08 (RPSC 2008).
Reason
Intercontinental, southbound
Intercontinental, northbound
Intracontinental
WINFLY Weather 1 0 --
Mainbody Weather 29 0 149 Mechanical 18 1 9 Other 2 0 0 Total 50 1 157
ERDC/CRREL TR-13-5 8
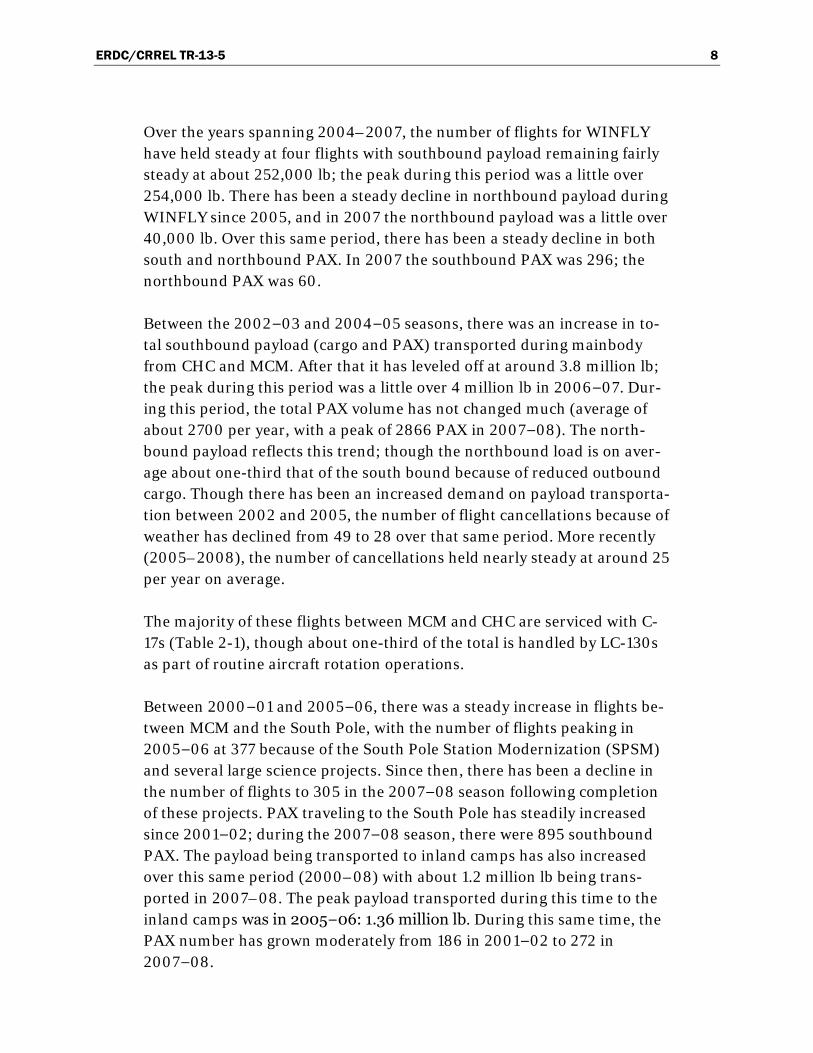
Over the years spanning 2004–2007, the number of flights for WINFLY have held steady at four flights with southbound payload remaining fairly steady at about 252,000 lb; the peak during this period was a little over 254,000 lb. There has been a steady decline in northbound payload during WINFLY since 2005, and in 2007 the northbound payload was a little over 40,000 lb. Over this same period, there has been a steady decline in both south and northbound PAX. In 2007 the southbound PAX was 296; the northbound PAX was 60.
Between the 2002−03 and 2004−05 seasons, there was an increase in to-tal southbound payload (cargo and PAX) transported during mainbody from CHC and MCM. After that it has leveled off at around 3.8 million lb; the peak during this period was a little over 4 million lb in 2006−07. Dur-ing this period, the total PAX volume has not changed much (average of about 2700 per year, with a peak of 2866 PAX in 2007−08). The north-bound payload reflects this trend; though the northbound load is on aver-age about one-third that of the south bound because of reduced outbound cargo. Though there has been an increased demand on payload transporta-tion between 2002 and 2005, the number of flight cancellations because of weather has declined from 49 to 28 over that same period. More recently (2005–2008), the number of cancellations held nearly steady at around 25 per year on average.
The majority of these flights between MCM and CHC are serviced with C-17s (Table 2-1), though about one-third of the total is handled by LC-130s as part of routine aircraft rotation operations.
Between 2000−01 and 2005−06, there was a steady increase in flights be-tween MCM and the South Pole, with the number of flights peaking in 2005−06 at 377 because of the South Pole Station Modernization (SPSM) and several large science projects. Since then, there has been a decline in the number of flights to 305 in the 2007−08 season following completion of these projects. PAX traveling to the South Pole has steadily increased since 2001−02; during the 2007−08 season, there were 895 southbound PAX. The payload being transported to inland camps has also increased over this same period (2000–08) with about 1.2 million lb being trans-ported in 2007–08. The peak payload transported during this time to the inland camps was in 2005−06: 1.36 million lb. During this same time, the PAX number has grown moderately from 186 in 2001−02 to 272 in 2007−08.

ERDC/CRREL TR-13-5 9
2.2 Two airfields (2008−09)
For the 2008−2009 season, the initial flights were about 2 weeks later than usual. This so called SPRINGFLY started on 4 September at PEG and lasted through 11 September with a total of five flights. Mainbody started on 30 September 2008 at PEG and concluded on 22 February 2009. The WF operations began on 2 November 2008 and lasted through 15 Febru-ary 2009. A total of 94 intercontinental flights (including five SPRINGFLY flights) and 289 intracontinental missions were flown through the 2008−2009 season. About half the flights between MCM and CHC were serviced by C-17s (see Table 2-3). The total number of canceled or aborted flights during the 2008−09 season was about half the prior season (Tables 2-2 and 2-4).
Table 2-3. Intercontinental flights for season 2008−2009.
Aircraft Missions flown,
SPRINGFLY (PEG) Missions flown,
Mainbody PEG WF C-17 5 47 47 0 LC-130 0 23 0 23 C-130 0 6 6 0 SAFAIR L-100 0 5 5 0 Airbus A-319 0 8 8 0 Total 5 89 66 23
Table 2-4. Missions canceled or aborted for season 2008−2009.
Reason Intercontinental,
southbound Intercontinental,
northbound Intracontinental SPRINGFLY
Weather 1 0 -- Mainbody
Weather 21 0 61 Mechanical 7 2 14 Other 0 0 0 Total 29 2 75
2.2.1 Benefits
In addition to eliminating the financial and logistical burden of the SIR, removal of the SIR from the MCM airfield system eliminated the need to reestablish Terminal Instrument Procedures (TERPS) required allowing

ERDC/CRREL TR-13-5 10
operation with instrument flight rules (IFR) on that runway1. This is ordi-narily an annual task because the SIR moves from year to year (see Fig. A-1, Appendix A), requiring re-computing of TERPS. By eliminating the SIR, the number of TERPS configurations required for MCM was reduced from 104 to 60 during the 2008−09 season.
2.2.2 Issues
During this season the stakeholders identified several issues:
1. Road and airfield deterioration. 2. Aircraft Rescue Firefighting (ARFF) demands. 3. Increased wear on the LC-130s.
Each of these will be discussed in turn.
Field season 2008−2009 was the first year for continuous usage of the roads between MCM, WF, and PEG throughout the summer season and the roads deteriorated significantly. This includes ponding of water at the Scott Base transition and road failures at other locations. In particular the Scott Base transition severely deteriorated during the warm period of this season, more so than had been observed in recent years. Whether this de-terioration was a result of continuous use of the roads or was weather re-lated is not entirely clear and will be discussed further below.
In addition, a large melt pond developed on the east side of the PEG run-way, and near the end of the flight season this pond had encroached on the east edge of the runway. It was feared that this pond would overlap the runway and force the shutdown of the airfield. Fortunately, it did not ad-vance far enough to cause any change to aircraft operations. Initially, it was thought that the melting was attributable to heavy, continuous use at PEG during the 2008−09 season. However, discussions with the airfield manager2 suggest that the source of the melt pond was the reworking of the snow in that region to reshape a snow berm that was too high and steep (based on ETL requirements) on the east side of the runway. Exten-sive reworking of the snow can reduce the albedo of that snow surface, thereby accelerating snowmelt. This experience underscored the need to
1 Even though all MCM airfields operate under visual flight rules (VFR) only, establishing TERPS for land-
ing and take-off options for all runways greatly increases the safety of operations. 2 Discussions with Gary Cardullo and Kent Colby, 27 May 2009, NSF offices, Arlington, VA.

ERDC/CRREL TR-13-5 11
time major manipulation of the snow around the runways during the early summer season, before opening the airfield, or after the airfield is closed, allowing time for fresh snow to cover the modifications.
Operating these two runways at the same time put a strain on the ARFF resources, as they had to be spread across two airfields (separated by 7 miles) for the full season. During three-airfield operations, the ARFF teams are only needed at two airfields simultaneously during the latter part of the season after the SIR is closed down (i.e., 3 months of dual cov-erage versus 5 during 2008-09).
Another issue raised was the possibility of increased maintenance and wear on the LC-130s during this summer season from flying out of WF for the entire season, which required operation on skis more than usual. The rationale is that taking off on skis requires more power so they had to op-erate at full throttle more often, thus increasing wear and tear on the air-craft engines. Also, the increased use of the skis and the forces of the skis on the landing gear may increase wear on these components as well. We will discuss this further in Section 2.5.
2.2.3 Costs
Two factors had a potential influence on the cost of airfield operations dur-ing the 2008−09 season:
1. The simultaneous operation of two airfields (WF and PEG) during the early season required crews to support both airfields and roadways. This may have prevented cost savings over operating only the SIR dur-ing that same time, even when the reduced cost of the construction of the SIR is factored in.
2. Furthermore, because WF and PEG are more remote, there is increased cost (fuel and road maintenance) associated with the shuttle services (PAX and cargo) traveling the longer distance.
We were unable to quantify these costs in this study owing to a lack of fi-delity of the financial data available. To improve our understanding of costs and potential savings, airfield costs were tracked by RPSC in greater detail during the 2009−10 season. These impacts, however, are lumped into the overall cost comparison provided in Section 2.5.
ERDC/CRREL TR-13-5 12
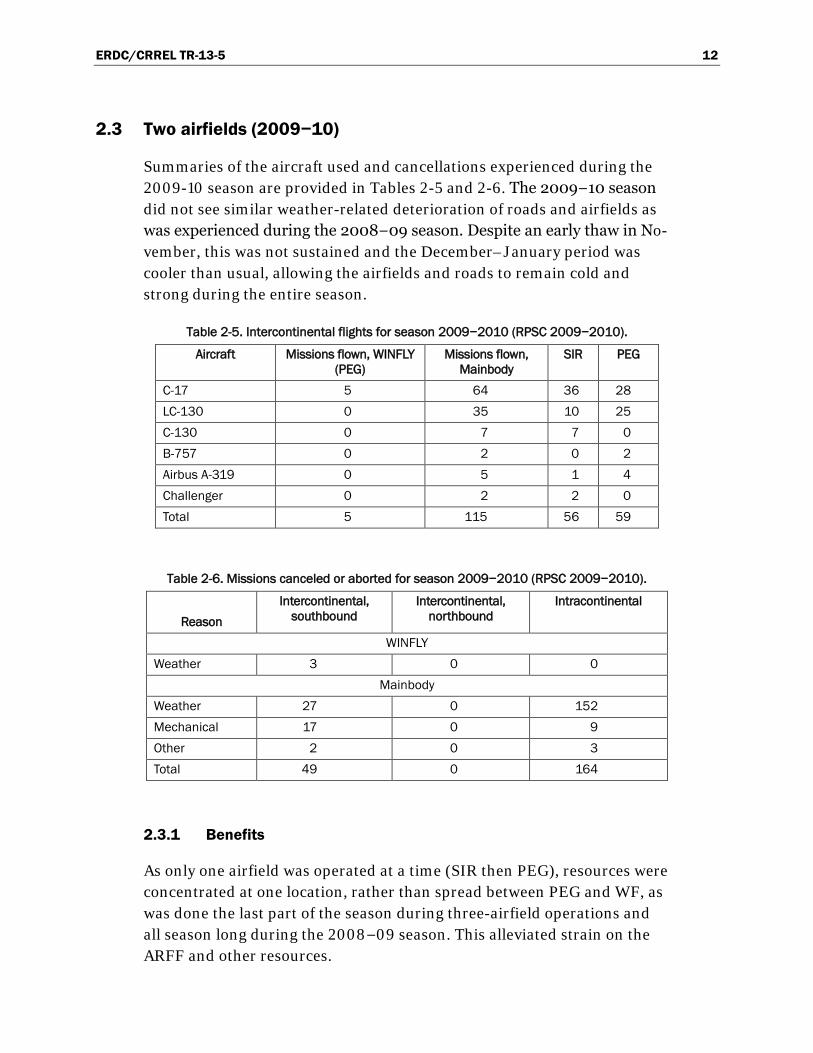
2.3 Two airfields (2009−10)
Summaries of the aircraft used and cancellations experienced during the 2009-10 season are provided in Tables 2-5 and 2-6. The 2009−10 season did not see similar weather-related deterioration of roads and airfields as was experienced during the 2008−09 season. Despite an early thaw in No-vember, this was not sustained and the December–January period was cooler than usual, allowing the airfields and roads to remain cold and strong during the entire season.
Table 2-5. Intercontinental flights for season 2009−2010 (RPSC 2009−2010).
Aircraft Missions flown, WINFLY (PEG)
Missions flown, Mainbody
SIR PEG
C-17 5 64 36 28 LC-130 0 35 10 25 C-130 0 7 7 0 B-757 0 2 0 2 Airbus A-319 0 5 1 4 Challenger 0 2 2 0 Total 5 115 56 59
Table 2-6. Missions canceled or aborted for season 2009−2010 (RPSC 2009−2010).
Reason
Intercontinental, southbound
Intercontinental, northbound
Intracontinental
WINFLY Weather 3 0 0
Mainbody Weather 27 0 152 Mechanical 17 0 9 Other 2 0 3 Total 49 0 164
2.3.1 Benefits
As only one airfield was operated at a time (SIR then PEG), resources were concentrated at one location, rather than spread between PEG and WF, as was done the last part of the season during three-airfield operations and all season long during the 2008−09 season. This alleviated strain on the ARFF and other resources.

ERDC/CRREL TR-13-5 13
2.3.2 Issues
Though this season successfully demonstrated that the fuel could be transported by pipeline to PEG (through rigid pipe from MCM to the Scott Base transition and then flexible hose the remaining distance to PEG), there are several issues that need to be resolved if this is going to be a long-term solution. First, an appropriate spill response needs to be formu-lated to handle leaks. This is discussed in more detail in Section 4.1.2. A second concern is the need for a personnel warming hut at the fuel auxilia-ry pump station (near mile 7 on the Williams Field to Pegasus Road). It is recommended that this be done for future years.
During operation at PEG during the 2009−10 season, there was insuffi-cient “do not freeze” (DNF) storage at the airfield. This can be a problem as there is a long transit to MCM from PEG and insufficient DNF storage increases the transportation pressure to get these temperature sensitive items into a warm location for longer term storage. This also is taken as an action item to improve operations at PEG in future years.
One service that was not properly executed before 2009−10 operations at PEG was infrastructure for handling waste (gray and black water) at the airfield. Prior to the 2009−10 season, the population (crew and PAX) at PEG was typically small (as there were only two or three flights operating at the airfield per week) and, as a result, the amount of waste generated at PEG was also small and was handled by transferring it to 55-gal. drums that were then sent by ship back to the US for treatment. While the small volume generated at PEG in prior years was readily handled this way, this approach was inadequate for the volume of waste produced during the 2009−10 season at the PEG. This issue and remedies are discussed in de-tail in Section 4.2.4.
2.3.3 Costs
One potential cost increase with this airfield system, over prior years, is transportation of cargo, PAX, and crew to PEG, which can be twice the dis-tance in comparison to WF. This impact was partially reduced during the 2009−10 season by use of the Pegasus “shortcut road” during early opera-tion of PEG. Use of this shortcut typically cut transit time by a factor of 2 in comparison to transit times experienced later in the season when the shortcut needed to be shut down; this is discussed in further detail in Sec-tion 4.2.2. Unfortunately, we may not be able to rely on this after 1 De-

ERDC/CRREL TR-13-5 14
cember in future years if the weather is warmer through December and January as is the norm.
2.4 Performance comparisons
We summarize the performance of the several airfield configurations spanning 2004–2010 in Table 2-7.
Table 2-7. Comparison of payload and PAX transported, and missions flown, through the McMurdo Airfield system from 2004−2010. Data compiled by RPSC (2008−2010). The table entries listed for three-airfield operation are average values, with the maximum value given in parentheses.
Three–airfield (2004 through 2008)
Two–Airfield 2008−09 2009−10
WINFLY / SPRINGFLY Missions flown 4 5 5 Aborts/Cancellations 1 1 3 Payload (lb) Southbound 252k avg (254k max) 308k 298k Northbound 64k (82k) 60k 33k PAX Southbound 296 (in 2007) 250 363 Northbound 60 (in 2007) 49 37
Mainbody: Intercontinental, Southbound Missions flown 84 89 115 Aborts/Cancellations 50 29 49 Payload (lb) 3.8M (4.03M) 3.2M 3.9M PAX 2700 (2899) 2476 2817
Mainbody: Inland operations Missions flown 436 276 319 Aborts/Cancellations 157 75 164
Mainbody: South Pole, Southbound Payload (lb) 9.0M (9.99M) 5.4M 6.0M PAX 800 (880) 796 799
Mainbody: Inland camps, Southbound Payload (lb) 1.2M(1.36M) 1.6M 2.2M PAX 194(272) 170 312
As we look across all categories tabulated, we find no systematic trends with respect to number of flights, cargo or PAX, and airfield configuration. That is, the number of missions flown and the amount of cargo and PAX

ERDC/CRREL TR-13-5 15
handled by the system either held steady, or in some cases increased, as the airfield configuration changed from three airfields to the two iterations of a two-airfield system. This suggests that transition from a three-airfield operation to a two-airfield operation did not impede USAP flight opera-tional tempo at MCM.
Figure 2-1 shows the number of flights handled at each airfield over the last three seasons (airfield usage); the blue lines show the missions flown out of the SIR, and green lines are associated with the PEG white ice run-way. The red lines are all flights flown on the skiways, either at WF (2007−09) or at the skiway located at PEG (2009−10). This figure illus-trates the heavy use (missions per week) of these runways and the possible implication for runway deterioration if there are too many flights landing on the runway during the warm−melt period (mid-December to mid-January). This shows a nearly constant number of flights handled per week on the PEG white ice (WI) runway during its operation for all three seasons.
The runway that may be most critically affected by a higher aircraft usage is PEG WI. Typically, the SIR is operated early in the season when the temperatures are low and the sea ice is strong. The SIR is shut down by late November or early December (around week 10, Fig. 2-1) before the ice strength deterioration compromises flight safety, and operation of the wheeled and ski-equipped aircraft is moved over to PEG or WF. The skiways at WF, and now PEG, are still serviceable because the aircraft can land on skis even when the surface strength is lower during the warm pe-riod. The WI runway is the only runway that is available to support land-ing of wheeled aircraft once the SIR is closed. Higher use during the warm period may cause portions of the runway to degrade, necessitating modify-ing flight schedules or severely curtailing intercontinental transport until the runway strength can be restored by a temperature decrease or mainte-nance.
ERDC/CRREL TR-13-5 16
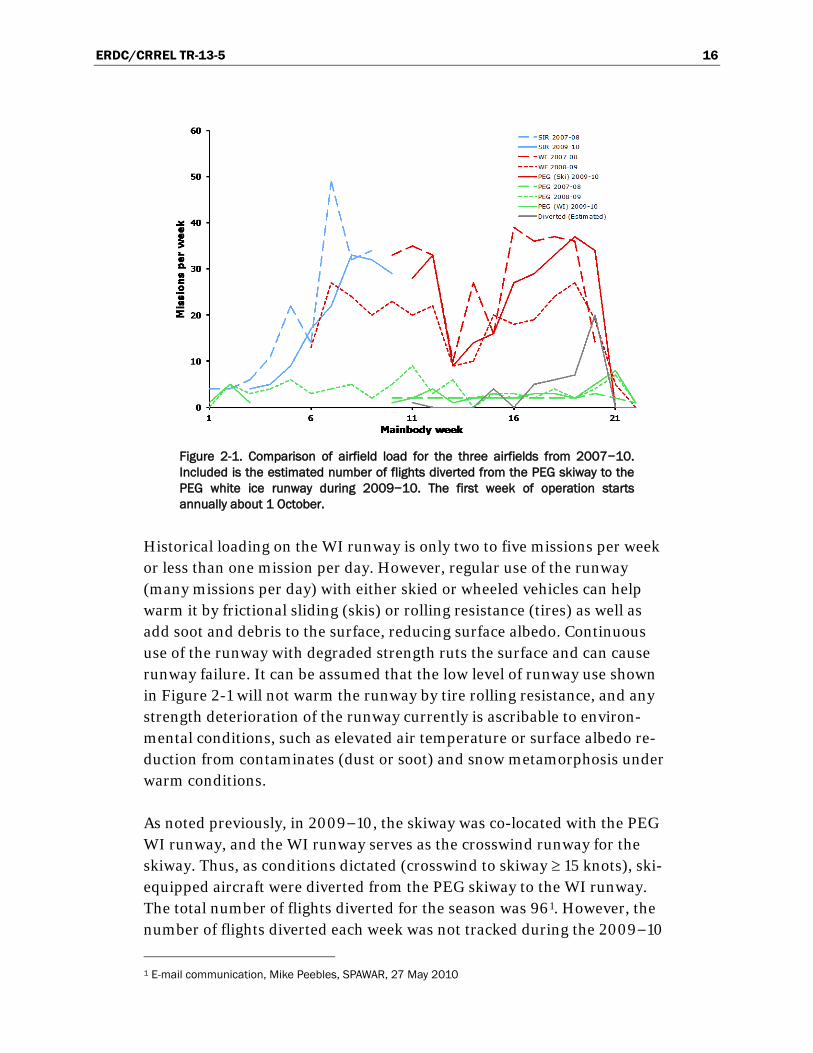
Figure 2-1. Comparison of airfield load for the three airfields from 2007−10. Included is the estimated number of flights diverted from the PEG skiway to the PEG white ice runway during 2009−10. The first week of operation starts annually about 1 October.
Historical loading on the WI runway is only two to five missions per week or less than one mission per day. However, regular use of the runway (many missions per day) with either skied or wheeled vehicles can help warm it by frictional sliding (skis) or rolling resistance (tires) as well as add soot and debris to the surface, reducing surface albedo. Continuous use of the runway with degraded strength ruts the surface and can cause runway failure. It can be assumed that the low level of runway use shown in Figure 2-1 will not warm the runway by tire rolling resistance, and any strength deterioration of the runway currently is ascribable to environ-mental conditions, such as elevated air temperature or surface albedo re-duction from contaminates (dust or soot) and snow metamorphosis under warm conditions.
As noted previously, in 2009−10, the skiway was co-located with the PEG WI runway, and the WI runway serves as the crosswind runway for the skiway. Thus, as conditions dictated (crosswind to skiway ≥ 15 knots), ski-equipped aircraft were diverted from the PEG skiway to the WI runway. The total number of flights diverted for the season was 961. However, the number of flights diverted each week was not tracked during the 2009−10
1 E-mail communication, Mike Peebles, SPAWAR, 27 May 2010
ERDC/CRREL TR-13-5 17
season. We estimated the number of flights diverted per week (the gray line in Fig. 2-1) based on the recorded wind data. This indicates that the majority of diversions likely occurred late in the season when tempera-tures are low and the runway is strong. However, the total number of es-timated flight diverts is 43; the estimate is low by over a factor of two in comparison to the 96 reported above. The exact temporal distribution of the “missing” diverted flights is unknown and cannot be assumed because the causes of these additional diverts are also unknown. Yet, Figure 2-1 shows that the number of diversions can be significant, with as many as 20 flights diverted per week near end of the season. Taken together with the normal traffic, the total is more than five times the number of flights typi-cally seen on the WI runway. If this number of diversions happened during the warm period, it has the potential to seriously affect runway strength and performance by warming the runway by the tires rolling across the snow surface, but also because the LC-130s emit more soot than the C-17s, making the runway surface darker and reducing surface albedo.
2.5 Cost comparisons
One of the reasons for considering a consolidation of the airfields is cost savings by reducing redundant effort or services at multiple airfields. Here, we compiled available data to determine the potential for cost sav-ings if a consolidation is done. The sources of costs come from many areas and extend beyond airfield construction and operations. Also, we expect some costs to increase while others may be reduced. For example, consoli-dating to a single airfield may reduce the ARFF crew and requirements be-cause it is not distributed over multiple airfields. However, if the final lo-cation of the consolidated airfield is farther from MCM than the present configuration, the cargo and PAX shuttle fuel and maintenance costs will rise.
Here, we have tried to enumerate some of the costs that are more easily captured. This is not all-inclusive, but should give an indication of the po-tential costs or savings associated with operating at a single airfield.
2.5.1 Time and effort to construct airfield
Table 2-8 gives the approximate effort it takes to establish each airfield every season. In terms of man-hours, there are two sources of data availa-ble to compare effort for establishing the runways. The first is data pre-sented at the Single Airfield Complex, Phase I Kick-off meeting, 27 May

ERDC/CRREL TR-13-5 18
2009. The second is data compiled by RPSC for operations during the 2009−10 season. The data obtained from both sources agree well for con-struction of PEG and SIR; the more recent PEG data show that the effort to construct the airfield is a little lower than prior data, while the new SIR data are a little higher than what was previously reported. We cannot compare WF data between these two sources because only minimal prepa-rations and services were provided at that airfield during the 2009−10 season. These data suggest that if airfield operations were consolidated to PEG, there is a potential savings of about 24,000 man-hours by eliminat-ing the construction of the SIR and maintaining WF at a minimal level for contingency operations.
Table 2-8. Effort needed to open airfields at McMurdo, Antarctica.
Preparation time
Weeks
Man-hours
Historical Aug 2009−Feb
2010† WINFLY Pegasus Airfield 3* N/A 956 Mainbody Sea ice runway 6* 6,000−8,000* 9,363 Williams Field 8* 18,000* 232 Pegasus Airfield 6* 9,000* 6,977
*Based on information provided at Single Airfield Complex, Phase I Kick-off meeting, 27 May 2009. † Compiled from WINFLY 2009 and Mainbody 2009−10 data provided by RPSC. N/A - Data not available
In Tables 2-9 and 10 we have compiled available data on operation and construction costs for the three cases discussed so far—three airfields (2007−08 and before), two simultaneous airfields (2008−09), and two se-quential airfields (2009−10). First, we consider Table 2-9. These types of data were only available for the 2007−08 and 2009−10 seasons. The three-airfield operations during 2007−08 show that the most costly air-field to operate was WF. In 2009−10, this cost was not eliminated, but transferred to PEG. This suggests that the bulk of the cost is associated with intracontinental flight ops, and whether this is handled out of a sepa-rate airfield (WF) or is co-located with another airfield (PEG), these costs are not eliminated entirely.

ERDC/CRREL TR-13-5 19
Table 2-9. Total effort to operate the airfields (construction and operation) in terms of man-hours. Compiled from data provided by RPSC.
Sea ice runway Williams Field Pegasus Three-airfield operations
WINFLY (Aug 2006) -- -- 2158 Mainbody Average for summers 2005−06 and 2006−07)
19,719 31,603 8150
Two-airfield operations 2008−09 (PEG/WF)
WINFLY -- -- N/A Mainbody -- N/A N/A
2009−10 (SIR/PEG) WINFLY -- -- 2817 Mainbody 22,706 976 35,311 -- Not applicable N/A Data not available
Table 2-10. Total effort in terms of man-hours to operate all of the airfields. Compiled from data sources provided by RPSC.
WINFLY Mainbody Total Three airfield Aug 2005−Feb 2006 -- 53,690 -- FY06 Totals (Summer 2005−06 and WINFLY 06)
-- -- 62,681
Aug 2006−Feb 2007 7204 56,044 63,247 FY08 (Summer 2007−08 and WINFLY 08)
-- -- 60,685
Two-airfield FY09 (Summer 2008−09, WINFLY 09)
9680 N/A N/A
Aug 2009−Feb 2010 9680 52,130 61,810 -- Not reported in the source from which these data were extracted. N/A Data not available
In Table 2-10 we have tabulated the total effort required to operate the en-tire airfield system, for both the three- and two-airfield scenarios. This shows that, for the years for which we have data for three-airfield opera-tions, there has been little change in the total cost to run the airfields; the average cost for these 3 years is about 63,000 man-hours. The total cost
ERDC/CRREL TR-13-5 20
for the most recent two-airfield system is not significantly different (61,810 man-hours). Taking together the data compiled in Tables 2-8 and 9, we could estimate a potential savings we might expect for operating two airfields (SIR and PEG) and migrating to a single airfield. From Table 2-8 we estimate the potential cost savings for eliminating the construction of WF at 18,000 man-hours. Thus, we might expect a cost savings of 18,000/63,000 = 29%. These savings clearly did not occur during the first season of eliminating full services at WF. This suggests that it may take a few years to realize the full potential savings projected for converting to a SAC. This is not surprising, as during the 2009−10 season, construction of the new skiway at PEG may have offset any cost savings realized by not operating at WF.
2.5.2 Aircraft maintenance
As discussed in Section 2.2.2, there was a concern that continuous opera-tion on skis would increase aircraft maintenance. Figure 2-2 gives the maintenance related flight cancellations (MCx) for the past eight seasons; the average number of MCx is 22 per season. During the 2005−06 and 2008−09 seasons, the MCx were higher than average. The unusually high number of MCx reported during the 2008−09 season may contribute to a perception that continuous use of skis leads to higher aircraft mainte-nance. However, Lt. Col. Mark Doll, NYANG, elaborated on this issue at the SRT/SAC review meeting on 4−5 May 2010 at CRREL. He stated that operation of the engines at full throttle did not have a negative effect on engine life because the engines are designed to operate at full throttle. Thus, we do not expect continuous operation on skis to affect propulsion related MCx.
We propose an alternate explanation for the trends shown in Figure 2-2 based on discussions with the NYANG at the above mentioned review meeting. Figure 2-3 shows the man-hours expended on maintenance for the last four seasons. The orange bars indicate the portion of the season during which the LC-130s operated on the SIR (wheel operations), while the blue bars indicate the time that the LC-130s operated on a skiway (ski operation), either at WF or PEG. There seems to be an inverse correlation between maintenance hours and MCx shown in Figure 2-2. For example, the years that maintenance hours were high (e.g., 2006−07), the MCx were low. During 2008−09, the sum of the maintenance hours is much lower than any other year and the MCx are the highest of the 8 years shown in Figure 2-2. Thus, based on available information, it appears that

ERDC/CRREL TR-13-5 21
the most important factor for reducing MCx may be the amount of regular maintenance given the aircraft, a conclusion that was also suggested by the NYANG at the SRT/SAC review meeting on 4−5 May 2010.
Figure 2-2. Total number of maintenance related cancellations from 2002−10. Compiled from data supplied by NYANG.
Figure 2-3. Maintenance hours for LC-130s at McMurdo for 2006−10 (DeConno et al. 2010).
From the data presented both here and at the SRT/SAC review meeting on 4−5 May 2010, it is not clear that operation on skis would increase propul-sion related MCx; in fact, it may have no effect. It may, however, increase

ERDC/CRREL TR-13-5 22
MCx for the landing gear (skis and hydraulic systems), but there are not enough available data to show that conclusively either.
2.5.3 Shuttle service
There are three potential additional costs associated with shuttle service to a proposed SAC: fuel consumption, shuttle maintenance, and transit time. All three of these are tied to the travel distance; the last two are strongly tied to road quality as well. Poor roads potentially “beat up” the vehicles more, leading to suspension, and engine and chassis mount failures, for example. Also, poor roads reduce the vehicle transit speed. To the extent possible, we attempt to quantify the costs related to shuttle services in this section.
We were unable to get direct costs for fuel consumption and shuttle maintenance to compare between three- and two-airfield operations. First, the fuel consumption data are not tracked at that level. We were able to obtain records of shuttle maintenance costs, broken down by year and what vehicle received maintenance. However, it was difficult to find any trends in the data because vehicle repairs are the result of wear and tear that is longer than a single season. For example, engine overhauls are typi-cally scheduled based on the result of total miles logged on the engine. Even if the overhaul, or other repairs, is a result of a failure, it may very well be the result of cumulative degradation spanning several seasons of use.
In lieu of better hard data, we attempt to quantify the effects of changing airfield operations on fuel, maintenance, and transit time, at least on a rel-ative basis, by determining the average seasonal transit distance for pay-load transported between the airfields and McMurdo. This is a payload weighted average computed as follows:
DAVE = (PSIRDSIR+PWFDWF+PPEGDPEG)/PTOT
where DAVE is the seasonal average distance that payload (PAX and Cargo) is transported by ground between the airfields and MCM, P is the payload, D is the distance to the several airfields from MCM and the subscripts re-fer to the various airfields (e.g., PSIR is the payload that is brought through the SIR and DSIR is the distance from MCM to the SIR). PTOT is the total payload handled by the MCM airfield system for that year. We exclude any payload handled during WINFLY in this calculation because WINFLY is

ERDC/CRREL TR-13-5 23
always handled through PEG regardless of the airfield configuration after that point.
For the 2009−10 season, part of the time operating out of PEG, the Pega-sus Shortcut Road was used, which is a shorter distance than the normal route to PEG. Thus, for the 2009−10 season the “Pegasus” term in the above equation is split into PPEG1DPEGSC+PPEG2DPEG with 1 and 2 referring to the time that transit was over the Pegasus Shortcut (PEGSC) and the normal route to PEG, respectively1.
Table 2-11 provides a summary of the transit distances used in this calcula-tion. The results are given in Table 2-12; in this latter table, we find a clear increase in the average transit distance as operations were changed from a three-airfield to a two-airfield system, with the average distance increasing by about 50%. This table shows how important the use of the Pegasus Shortcut was to operations during 2009−10. Without it, the transit dis-tance would have been almost double, and, by inference, we assume that fuel consumption, maintenance cost, and transit times would increase proportionally.
To apply this cost analysis to a potential SAC configuration is, of course, much more straightforward, as it would by definition be a single airfield operating out of one location all season long. Therefore, in principle, it would be a fixed transit distance all season long (e.g., 15.9 miles if the SAC were located at the current PEG site). However, if multiple routes are used at different times during the season, as was done during the 2009−10 sea-son to get to the SAC, this procedure could be used to estimate a new aver-age transit distance for the proposed SAC.
Table 2-11. Distances to airfields via McMurdo road system.
Transit route to: Distance (miles) Sea ice Runway, DSIR 2 Williams Field, DWF 7 Pegasus Airfield, DPEG 15.9 Pegasus Airfield via Shortcut, DPEGSC 8
1 This will slightly underestimate the computed average transit distance because it is known that the
light vans were not allowed to operate on the Pegasus Shortcut most of the time that it was open dur-ing the operation of PEG. However, there were no data available that would allow us to separate the payload split between the light vehicles and ATVs during this time. The calculation for the 2009−10 season represents a best-case scenario; the actual average distance for that year is larger, but still less than the 15.9 miles to PEG.
ERDC/CRREL TR-13-5 24
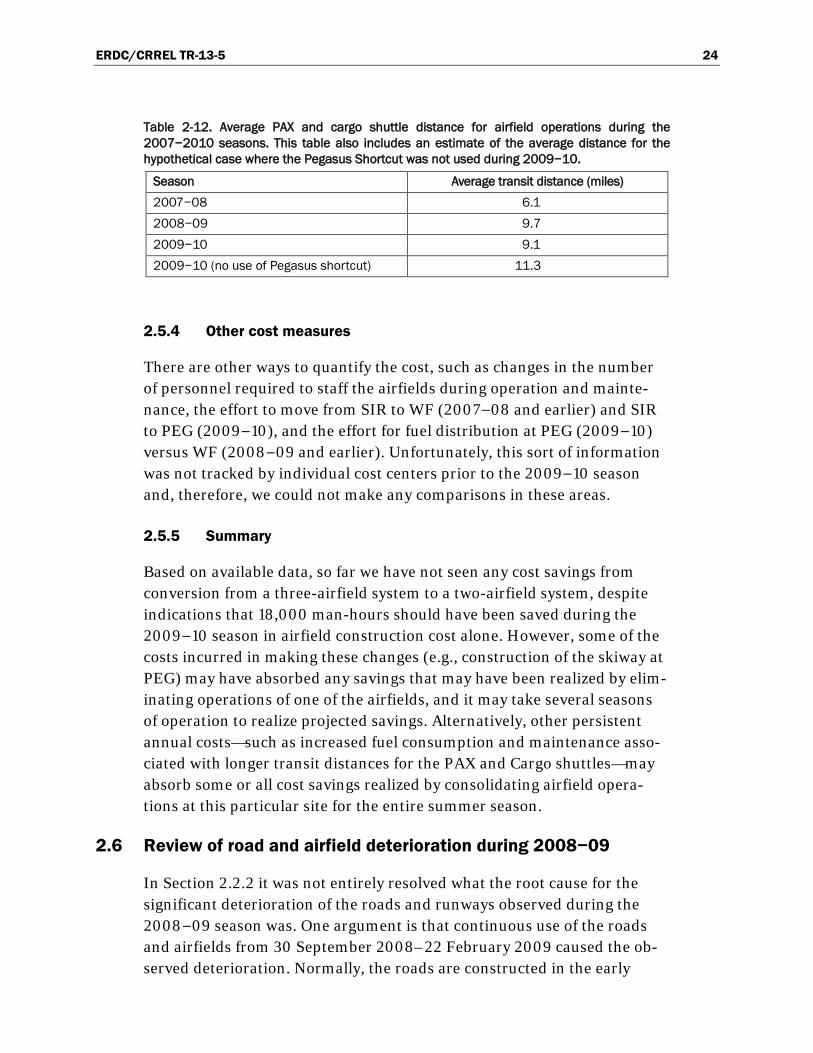
Table 2-12. Average PAX and cargo shuttle distance for airfield operations during the 2007−2010 seasons. This table also includes an estimate of the average distance for the hypothetical case where the Pegasus Shortcut was not used during 2009−10.
Season Average transit distance (miles) 2007−08 6.1 2008−09 9.7 2009−10 9.1 2009−10 (no use of Pegasus shortcut) 11.3
2.5.4 Other cost measures
There are other ways to quantify the cost, such as changes in the number of personnel required to staff the airfields during operation and mainte-nance, the effort to move from SIR to WF (2007−08 and earlier) and SIR to PEG (2009−10), and the effort for fuel distribution at PEG (2009−10) versus WF (2008−09 and earlier). Unfortunately, this sort of information was not tracked by individual cost centers prior to the 2009−10 season and, therefore, we could not make any comparisons in these areas.
2.5.5 Summary
Based on available data, so far we have not seen any cost savings from conversion from a three-airfield system to a two-airfield system, despite indications that 18,000 man-hours should have been saved during the 2009−10 season in airfield construction cost alone. However, some of the costs incurred in making these changes (e.g., construction of the skiway at PEG) may have absorbed any savings that may have been realized by elim-inating operations of one of the airfields, and it may take several seasons of operation to realize projected savings. Alternatively, other persistent annual costs—such as increased fuel consumption and maintenance asso-ciated with longer transit distances for the PAX and Cargo shuttles—may absorb some or all cost savings realized by consolidating airfield opera-tions at this particular site for the entire summer season.
2.6 Review of road and airfield deterioration during 2008−09
In Section 2.2.2 it was not entirely resolved what the root cause for the significant deterioration of the roads and runways observed during the 2008−09 season was. One argument is that continuous use of the roads and airfields from 30 September 2008–22 February 2009 caused the ob-served deterioration. Normally, the roads are constructed in the early

ERDC/CRREL TR-13-5 25
summer season but see little use until the SIR is closed down in early De-cember (except for light traffic attributable to operations at the Long Du-ration Balloon [LDB] site and other intermittent road use). This allows the roads to remain in a nearly pristine condition until early December, being strong and clean (devoid of dirt from vehicle passage) and in good condi-tion prior to the start of the warm season (mid-December through mid-January). This may allow them to survive the warm period better than was observed in the 2008−09 season, during which the roads were in use about 2 months longer than usual. However, this reasoning does not factor in the weather for that season.
In Figure 2-4 we show estimated temperature statistics for the Pegasus airfield (details of this analysis are given in Appendix D). In this analysis the average maximum and minimum air temperature is determined for each day in the year over the period of record (a cyclic analysis). Overlaid on this analysis are the air temperature data acquired at this same station for the summer seasons of 2008−09 and 2009−10, the first 2 years during which the MCM airfield system operated with only two airfields.
Several things are clearly evident in this figure. First, during the historical-ly warmest part of the summer season, approximately 15 December–15 January, the air in 2008−09 was typically warmer than average and in some cases (around 24 December) nearly as warm as the maximum ob-served. Second, during the 2009−10 season, the air early in the season (about 12 November–5 December) was also much warmer than in an aver-age year, but during the historical “warm” period the air temperature was lower than average. In light of these observations the question then that needs to be answered is “how do these temperature variations affect air-field and road performance?”
To answer this question, we turn to available observations of ice melt at-tributable to solar radiation and surface albedo. This was studied exten-sively by Haehnel et al. (1996, 1999a, b), Prowse et al. (1990), Williams (1967), Spetsov (1965), Bonin and Teichmann (1949), and others. One of the findings in these studies was that little deterioration in ice strength is realized until the air temperature rises above about −2°C (28°F). However, observations made with instrumented buoys placed in the Arctic show that snow and ice surface ablation starts at an average air temperature of about −5°C provided that there are clear skies and the sun is in the sky (Weath-erly and Helble 2010). We plot in Figure 2-4 horizontal lines indicating

ERDC/CRREL TR-13-5 26
this range of −5 to −2°C. This shows that in an “average” year the air tem-perature is at about −5°C from about 24 December to 15 January, which corresponds well to what is considered the warm period for MCM (i.e., mid- to late December to mid-January).
Figure 2-4. Comparison of the average daily air temperature at Pegasus Airfield during the summer seasons of 2008−09 and 2009−10 to the average daily air temperature over the period of record (1973−2008). The red line is the average over the period of record measured at MCM (WMO ID 896640) that has been adjusted to the PEG by subtracting 3.13°C (see Appendix D). This adjustment has also been made for the max. and min. air temperatures for the 2009−10 season. The 2008−09 data are the actual temperature measured at PEG.
What is noticeable about the 2008−09 season is that the warm period starts earlier (7 December) than in an average year (with a brief 4-day cool period on 14–17 December) and is as much as 5−7°C higher than average. This unusually warm weather that lasted almost 2 weeks longer than usual may be the main cause for the deterioration of the airfields and roads. Ad-ditionally, operations such as reworking the snow berms on the east side of the PEG runway (see Section 2.2.2) or using the airfield access roads long-er than usual simply exacerbated what already was going to be a “bad” year even if there was no change in operations.
Figure 2-4 also tells the story about the 2009−10 season; the warming started even earlier during the 2009−10 season than the previous year, with an extended warm period starting 13−17 November and then resum-

ERDC/CRREL TR-13-5 27
ing on 25 November and lasting through 11 December. This early warming in November prompted development of plans to advance the timetable for the switch over from the SIR to PEG. However, cooler weather in mid- to late November allowed the transition to proceed on the normal schedule, with PEG operations starting on 7 December. What followed was a cooler than usual period starting on 12 December and continuing through Janu-ary with only a short spike in temperature around the start of the calendar year. These lower than normal temperatures during what is historically the warm period at MCM resulted in a much more manageable airfield opera-tion season, with minimal problems at the airfields or on the access roads.
In Figure 2-5 we show the estimated number of days that the air tempera-ture was above −5°C (23°F) for each season since 1998. What we find is that, even though the 2008−09 season does not show an unusually high number of days that the temperature was above −5°C, this was considered a bad year in terms of road and airfield deterioration. The most recent sea-son, 2009−10, exhibited minimal deterioration of the roads and airfields, yet had more days over −5°C than in 2008−09. This seems to indicate that it is not the number of warm days that determine the severity of road and airfield deterioration during of a given season, but rather the timing of when the warm days occur. If the ice is cold, the effect of a few warm days will warm the ice, but the ice will not weaken severely because the bulk of the ice mass itself is still cold (less than 0°C). However, once the ice is near or at the freezing point, the effect of air temperatures greater than −5 to −2°C on ice and snow strength can be profound. This emphasizes a need to monitor not just the air temperature, but also the ice and snow tempera-tures as a tool to determine when the strength of roads and runways can be compromised.

ERDC/CRREL TR-13-5 28
Figure 2-5. Number of days that the air temperature is over −5°C at Pegasus airfield (Weatherly and Helble 2010). For this analysis the temperature at Pegasus was estimated from the data record at McMurdo adjusted by −3.13°C as described in the text.

ERDC/CRREL TR-13-5 29
3 Current Performance Requirements for McMurdo Airfield Operations
To maintain the current level of performance in air logistics at MCM, min-imum requirements need to be met. Based on feedback from stakeholders and data on the current performance at MCM, we have identified six es-sential criteria or performance requirements that need to be met by air op-erations at MCM to adequately support the USAP mission.
1. Safety. 2. Availability. 3. Airframes supported. 4. Payload capacity. 5. PAX capacity. 6. Flexibility.
The specific requirements that need to be met in each of these areas are outlined below, along with the justification for the requirement.
3.1 Safety
The three recent configurations of airfields at MCM have maintained an excellent safety record, despite operating on austere airfield surfaces. This can be attributed to the measures put in place to handle the many circum-stances that arise in the Antarctic environment, including the ability to forecast dangerous, sudden weather events, and having plans in place for appropriate contingencies (e.g., white-out landing areas). For future air-field configurations, such as a SAC, the present systems, procedures, and forecasting will need to be maintained to ensure that safety remains para-mount. These include the following facilities and procedures.
3.1.1 White-out landing area
Severe weather at MCM can occur quickly, with little advance warning, and bring blowing snow or fog. These conditions can cause near white-out, or white-out conditions that produce nearly zero visibility. To allow for landing in these zero visibility conditions, a large “white-out landing area” has been established on the McMurdo Ice Shelf where ski-equipped air-
ERDC/CRREL TR-13-5 30
craft can begin a very gradual decent (100–200 ft/min. descent rate1) in zero visibility, eventually touching down and coming to a stop, without up-set (it is hoped). The existing white-out area is beaconed by using the TACAN for the existing WF and is large enough to allow for many miles of relatively featureless terrain in which to touch down.
3.1.2 Aircraft rescue and firefighting (ARFF)
The system includes staffing of dedicated personnel and equipment at the active airfields, 24 hours a day, 7 days a week. During simultaneous opera-tions of multiple airfields, the ARFF resources are stretched across both airfields. This requires crews and equipment to be at each location simul-taneously, requiring manpower shuffling, and pre-positioning or last mi-nute positioning of equipment. Though this stretching of resources has been managed for a number of years with the simultaneous operation of WF and PEG, it is preferable to have only one airfield operating at a time to reduce manpower requirements and shuffling of equipment between separated airfields.
3.1.3 Mass casualty incident procedure
In the event of an aircraft mass casualty on an airfield, MCM has the capa-bility to handle some level of basic response. Because of planning and training, there exists a moderate level of medical care and there is orga-nized manpower and equipment to move patients from the incident to treatment areas. Proximity of the airfield to MCM can greatly affect the success of such an operation. Therefore, there are advantages to locating the airfields as close as practical to MCM, especially considering that road degradation between the airfield and MCM can further hamper evacuation efforts.
3.1.4 Inclement weather sheltering
Currently, the provisions and procedures for sheltering a large number of people (crew and PAX) from sudden, severe weather are minimal or lack-ing for any of the airfields. Although a rarity, personnel and passengers can be stranded at an airfield until the weather subsides and roads are made passable. The farther the airfield is from McMurdo Station, the harder it is to evacuate back to the station when bad weather suddenly
1 Personal communication with COL Gary James, NYANG, 29 December 2010.

ERDC/CRREL TR-13-5 31
emerges, making it imperative that such procedures and provisions be es-tablished and maintained. A few buildings at the airfields have equipment and provisions for this scenario, such as the ARFF building, where meals-ready-to-eat (MRE), a refrigerator, microwave, and beds are available. However, the ARFF building does not have sufficient capacity or resources to handle a large number of people. Other buildings, such as the PAX ter-minal and Galley, would have much more capacity to provide housing for a large number of people stranded at the airfield for 2 or more days, provid-ed sufficient supplies (e.g., sleeping bags, food, and water) are available.
3.1.5 Environmental considerations
Additionally, operation of an airfield in a harsh environment and built on ice needs to be adequately considered. For example, all of the airfields are established on floating ice, and that can pose a challenge in some instanc-es. This is less of an issue for WF and PEG, which are both on the Ross Ice Shelf; however, the SIR is located on the annual sea ice formed on McMurdo Sound. Though the thick ice has the ability to instantaneously support heavy loaded aircraft, such as the C-5 and C-17, upon landing and taxiing, under a static load (e.g., parked aircraft) the ice will begin to de-form visco-elastically, with the result being the sagging of the ice sheet at the location of the load. This “creep” is a function of thickness and ice temperature and is generally of no concern if the deflection does not ex-ceed the freeboard of the floating ice (the distance between the top of the ice and the water level, for free floating ice the freeboard is about 10% of the ice thickness); once the freeboard is exhausted, the ice can fail rapidly, owing to the progressive damage of the ice during creep
When heavy aircraft are parked on the ice, monitoring of the freeboard is required to ensure that the deflection of the ice under this load does not equal or exceed the freeboard. This has traditionally been done with a sur-vey level and rod, and requires that the survey team make frequent meas-urements while the aircraft is unloaded, loaded, and serviced.
Another environmental consideration is the strength of the runway sur-face. Because the skiways and runways are constructed from snow and ice, their strength degrades as the air temperature approaches the melting temperature of ice; solar radiation augments the runway deterioration once the air temperature gets close to freezing, as discussed in Section 2.6. The solar radiation can also create subsurface melt pools that have a thin ice layer over them that will not support an aircraft. If the runway surface
ERDC/CRREL TR-13-5 32
becomes too weak, wheeled aircraft can no longer safely land or takeoff. To reduce the effects of warmer ice and incoming solar radiation, the white ice runway at PEG is capped with high-albedo fresh snow to reflect as much radiation as is possible, thereby minimizing runway strength degra-dation. Furthermore, to find subsurface melt pools, proof carting of the runway is required when the runway surface temperature rises above −4°C; if these are discovered, they are repaired according to the proce-dures outlined in the ETL for the Pegasus Airfield (Air Force 2002).
Safe air operations at MCM also rely on high quality weather forecasts to minimize the number of weather-related mission cancellations, and to avoid launching a mission when weather does not support it.
The multiple airfield scenario that currently exists allows flexibility in the event incoming aircraft must divert. This redundancy is only available for short periods of time with some of the airfields, such as for a week or so after the SIR has ceased mid-season operation and WF has begun opera-tion. LC-130s have been diverted to the SIR because of dense, localized fog at WF. Similarly, operating PEG simultaneously with SIR or WF also pro-vides flexibility in the system.
3.2 Availability
The current dates of operation for the airfields at MCM have remained nearly unchanged from the early years of Operation Deep Freeze. The so called “station open” (begin summer operation) and “station close” (begin winter operation) dates coincide with first arrival and last departure flights of the mainbody season; this is preceded by the short lived WINFLY air-field operation in late August. MCM traditionally opens the first week of October, and MCM typically closes the last week of February. These key operation benchmarks have long been established, primarily based on weather trends that set the availability for longer duration outdoor work. WINFLY traditionally takes place the first or second day after the Austral Winter sunrise, which is 19 or 20 August. For a few years in its history, the beginning of winter operations has been pushed into March to allow con-struction projects to be completed and for busy research seasons. As con-ditions warrant, scheduled delays in the start of WINFLY could occur in the future as well (as demonstrated by the 2008 “Springfly”).
Based on these key dates, any scenario of airfield operations at MCM must allow for an efficient return to service for use at WINFLY (closely following

ERDC/CRREL TR-13-5 33
the Antarctic sunrise) and Mainbody (approximately 1 October–28 Febru-ary). Additionally, the ability should exist to efficiently establish the air-field for MEDEVAC during the darkest and possibly coldest time of mid-winter.
3.3 Airframes supported
A wide range of aircraft have flown into MCM, both wheeled and ski equipped (e.g., see Tables 2-1, 2-3, and 2-5), since the early years of Opera-tion Deep Freeze. These aircraft are either used extensively for the USAP, or have only visited once. Each new aircraft visiting MCM requires certifi-cation to ensure that characteristics such as maximum weight, tire pres-sure, and landing gear configuration are compatible. In the past, the C-5 Galaxy (800,000 lb maximum gross weight) was certified for use at the SIR and used at the beginning of mainbody for cargo and PAX shipment. Currently, the heaviest airframe certified for the SIR and WI runway is the wheeled C-17 (585,000 lb). The LC-130 Hercules (155,000 lb) is the most common for all runways and skiways.
The heavier payloads have traditionally been flown on wheeled aircraft (C-5, C-141, C-17), and intercontinental flights will always require aircraft with wheels for landing in CHC. However, the bulk of the intracontinental missions are flown with the LC-130, which has bi-modal gear, wheel and ski; we assume that intracontinental flights will always require skis to al-low landing on unprepared surfaces at the inland camps on the continent. However, future use of a snow pavement at South Pole could allow wheeled aircraft with heavier payloads to land at this location.
Therefore, a minimum requirement for USAP airfield operations is sup-port of both wheeled and ski-equipped aircraft with a maximum payload of 100,000 lb (C-17 max payload) and tire pressure of 210 psi (design con-dition for A-319 operations) for wheeled aircraft and maximum payload of 20,000 lb (LC-130 max payload) for aircraft landing on skis.
3.4 Payload capacity
The ability to move payload (cargo and PAX) to and from MCM is a critical component to the operation of the USAP. The amount of cargo has in-creased since the beginning of Operation Deep Freeze, and has recently seen all-time highs with the amount of material moved through to South Pole Station (NPX) for the SPSM. This allowed for an unprecedented look

ERDC/CRREL TR-13-5 34
at what the maximum cargo movement through MCM could be, even though a good portion of the materials were moved by vessel to MCM, then by intracontinental air to South Pole. We assume that the maximum cargo movement through MCM during the heightened years of the SPSM can be used to define the requirement to be met by the MCM airfield sys-tem in general.
In Table 3-1 we compare the weight of cargo moved from CHC to MCM and from MCM to NPX between the 2004–05 and 2009–10 seasons. The maximum payload transported between CHC and MCM by air occurred in 2006–07 and totaled a little over 4 million lb annually, while the maxi-mum transported from MCM to NPX occurred a season earlier and totaled just under 10 million lb annually. Current maximum fuel transported by air is 5.46 million lb annually, or slightly more than half of the payload re-quirement. This may be reduced by increased overland transport of fuel via the South Pole Traverse (SPoT). However, even with declining payload in recent years, which includes the effects of some of the payload being transported overland via SPoT, the proportion of payload that is attributa-ble to fuel transport is still over 50% of the annual total.
Table 3-1. Weight (million lb) of payload (PAX and cargo) delivered from 2004 to 2010.
04–05 05–06 06–07 07–08 08–09 09–10
CHC-MCM 3.87 3.50 4.03 3.80 3.23 3.92
MCM-NPX cargo 8.12 9.99 9.74 7.89 5.51 6.00
MCM-NPX fuel 4.06 4.54 5.46 5.31 3.29 3.93
Table 3-2. Comparison between payload offered and delivered in millions of lb.
07–08 08–09 09–10 CHC-MCM
Offered C17 5.618 5.12 5.92 Actual C17 3.75 3.07 3.90
MCM-NPX Cargo offered 7.01 5.35 5.85 Cargo actual 7.89 5.41 6.00

ERDC/CRREL TR-13-5 35
What is also of interest is how much excess capacity exists in the current CHC-MCM system. To try to quantify this, we tabulate the amount of pay-load transported compared to the amount of capacity offered in Table 3-2. This shows that the payload transported between CHC and MCM is typi-cally 2/3 of the available (offered) payload capacity. However, for transport between MCM and NPX, the actual amount of payload trans-ported exceeds the offered every year, and, in 2007–08, actually exceeded offered by more than 10%. This seems to indicate that the LC-130s flying from MCM to NPX are fully loaded virtually 100% of the time. At first blush this seems to indicate that there is no excess capacity in the system; however, the season-to-season variation suggests an alternate explanation. The maximum transport in 2005–06 (Table 3-1) may indicate approxi-mate upper bounds of the capacity and the subsequent years may indicate operation below that capacity owing to reduced demand and that there is enough flexibility in the system to vary the OPTEMPO to match demand. The actual capacity of the system is unclear, as there is no clear indication if any of the figures provided in Table 3-1 are near the maximum capacity of the airfield system, but they clearly depict what is possible.
The tabulated data suggest that the minimum requirements for payload transport from CHC to MCM by air be no less than 4 million lb annually, and the minimum requirements for payload transport between MCM and NPX is 10 million lb annually. This requirement glosses over any re-strictions based on volume of the payload. For example, a light, large piece of cargo could take up all of the cargo space in a C-17, yet be well below that offered cargo limit in terms of weight.
3.5 PAX capacity
The ability to move high numbers of PAX to and from MCM is also a criti-cal component to the USAP. As with cargo, all time high numbers of pas-sengers have been seen during the years of the SPSM. The PAX movement from CHC to MCM, and MCM to NPX from 2004 to 2010 is shown in Ta-ble 3-3. However, unlike the cargo airlift situation, PAX movement is con-strained by the fixed numbers of beds that exist at MCM, South Pole, or the field stations, and if the beds are full, PAX do not move to the full sta-tion or camp. The MCM bed situation governs all secondary stations; if the beds are full at MCM, available bed space at South Pole and the field camps will not allow more PAX onto the continent until MCM can open those bed spaces. Therefore, unless a temporary project or permanent in-

ERDC/CRREL TR-13-5 36
frastructure addition dramatically increases bed space, the amount of PAX increase is controlled.
Table 3-3 shows the maximum PAX throughput possible, with nearly 2900 PAX transferred through CHC-MCM, almost 900 PAX between MCM-NPX, and over 300 PAX transported to field camps. These numbers pro-vide an initial requirement for PAX transport, with minimum PAX transport between CHC and MCM being 3000 per year, a minimum of 900 PAX between MCM and NPX annually and 350 PAX transported to field camps annually.
Table 3-3. PAX (head count) moved from 2004 to 2010
04–05 05–06 06–07 07–08 08–09 09–10 CHC-MCM 2639 2694 2643 2866 2476 2817 MCM-NPX 738 736 841 880 796 799 Field Camps 116 195 194 272 170 312
3.6 Flexibility
Flexibility is the ability to adapt to changing conditions. This may include response to changes in short-term (e.g., storm time-scale) or long-term (seasonal time-scale) weather conditions, the evolving USAP mission, and accommodation of large construction efforts (e.g., the recently completed South Pole or proposed MCM modernization projects). This is a “soft” re-quirement in that it is difficult to quantify in numbers, but it is essential to the efficient functioning of the USAP.
Handling of short-term weather conditions boils down to a flight safety issue and is addressed in Section 3.1. Longer-term weather conditions re-late more to extended warm periods and the ability to provide service when there is a risk of road or runway failure. In such events there needs to be flexibility to, for example, stop air transport for a period of time (1 or 2 weeks) until cooler weather allows runway use, and still have enough ca-pacity in the system to make up for these delayed missions and maintain the overall season objective, or handle other evolving conditions without jeopardizing the overall USAP mission.
Other aspects of flexibility are to be able to handle non-standard airframes (e.g., C-5) to accommodate delivery of unusually large cargo, or the ability

ERDC/CRREL TR-13-5 37
to readily increase cargo or PAX throughput to support construction pro-jects.
Historically, the airfield system has been shown to be flexible, a trait that needs to be maintained in future airfield configurations.
ERDC/CRREL TR-13-5 38
4 Issues or Concerns that Need to be Addressed to Establish a Single Airfield Complex at McMurdo
To successfully establish a single airfield complex at MCM, there are many hurdles that need to be overcome. To make sure that all of the important issues are identified requires input from all of the stakeholders in airfield operations at MCM. This includes the NSF, USAF, NYANG, SPAWAR, and support contractor. This group brings to bear a huge range of expertise on the design and management of the airfield operations at MCM, including airfield design (TERPS, airfield layout, TACAN siting, town site layout), annual construction (on snow, sea ice, and glacial ice, including installa-tion of mobile buildings, providing power generation and distribution, and communication support) airfield (safety, maintenance, environment) and flight operations (air traffic control), access road construction and mainte-nance, and shuttle operations (PAX, airfield and flight crew, and cargo). One of the methods that we used to identify these issues was holding a meeting with all of the stakeholders on 27 May 2009. During this meeting, stakeholder representatives participated in person or via telecom (a com-plete list of participants can be found in Appendix C). Additionally, discus-sions with the stakeholders continued through the Phase I study period to further clarify and expand the issues that needed to be addressed via regu-larly scheduled weekly teleconference meetings and other discussions. Fi-nally, a field campaign was carried out during this study to observe airfield construction and operations, and included several field experiments to ex-plore our understanding of the scope and severity of the issues identified. The following discussion includes information obtained from these efforts. The issues identified are listed in priority order with “showstoppers” (is-sues that must be resolved or a SAC would not be successful) being listed first.
4.1 Showstoppers
4.1.1 Airfield and road maintenance
The general consensus is that improving techniques for maintaining the strength of the airfields and roads is the highest priority. This is particular-ly important for landing wheeled aircraft. Crucial to this is maintaining a

ERDC/CRREL TR-13-5 39
protective, high-albedo snow covering at the airfield runway, apron, and town site as described by the Air Force (2002). The need for this was demonstrated during the 2008–09 summer season, where both the air-fields and roads deteriorated after operation of WF and PEG for a full sea-son, as discussed in Sections 2.4 and 2.6. To keep the airfield snow and ice surfaces strong, methods for construction and maintenance of these sur-faces need to be improved, as well as some protocols for controlling soot and low-albedo debris on these surfaces. Also, enhancing the techniques and guidelines for warm weather maintenance of the roads needs to be addressed.
From an airfield’s point of view, deterioration at the PEG white ice runway is most critical, as weakening of that runway may necessitate suspending operation of dedicated wheeled aircraft into and out of MCM. This could cause a major disruption to flight operations, perhaps necessitating use of the LC-130s (which can land on skis on a softer runway) to provide inter-continental flights. Such a shift would put an increased burden on the NYANG and the LC-130s that are already operating at a high flight tempo (four–six missions per day) or require suspension of intercontinental flights for 1–2 weeks a year because of the runway being too weak to sup-port wheeled aircraft. Deterioration of the skiway is less of an issue be-cause the aircraft with skis (LC-130s and KBA aircraft) will still be able to operate.
Deterioration of the roads during 2008–09 forced longer than normal use of all-terrain shuttle vehicles (e.g., Deltas, Terrabus). Though these vehi-cles can be used over road sections that are weak, they are much slower than other shuttle vehicles and, therefore, this increases transit time. Fur-thermore, road deterioration slows all vehicles. In the extreme, complete failure of the access roads will necessitate transportation to and from the airfields via helicopter, which is costly, and helicopters are already heavily used for other tasks, potentially creating a backlog in PAX and cargo be-cause of inadequate capacity. During this Phase I study, we concluded that the roads and transportation system that supports the airfield were im-portant enough and have sufficiently large scope that they warranted being broken out as a separate effort. Therefore, the issues and remedies related to road construction and maintenance, and transportation (i.e., shuttle) operations will be addressed under a separately funded sister project McMurdo Transportation Study and will not be discussed further here.
ERDC/CRREL TR-13-5 40
From Section 2.6, it appears that the deterioration of the roads and air-fields experienced during the 2008–09 season was likely a result of an un-usually warm melt period and was not a direct result of operating PEG and WF the entire season. However, this underscores the impact of weather variations on airfield operations and the need to plan for it. Though the 2008−09 season was warmer than usual, it did not break any records; the maximum air temperatures were lower than the maximum on record (Fig. 2-4). However, we cannot overlook the long-term effects of climate change either. The large mass of ice in and around MCM makes it unlikely that the daily temperatures during the summer season will get higher than what has been seen historically; the ice is a large thermal mass, forcing the air temperature to not rise much above the freezing point of water. Rather, what we may expect is more warm days, i.e., more days in which the tem-perature is above 23–28°F (–5 to – 2°C)—the point where significant melt begins—during the summer season. In the near term (next 10 years), the extension of the length of the average melt period should be small (3 to 4 days), though in the long term (80 years), we may see the melt season double from 31 to 62 days (Weatherly and Helble 2010). This signals that we could expect more years like the 2008–09 season in the future. This has two potential effects as identified by Weatherly and Helble (2010):
1. A longer melt season will advance the deterioration of the SIR. Project-ed out 80 years to 2090, the operational span of the SIR could be shortened by as much as 15 to 45 days, leading to closing of the SIR by 15 November in the best case and as early as 15 October in the worst case.
2. Increasing the number of days that the PEG runway is in the melt peri-od will lead to a possible mid-season suspension of runway operations because it is too warm and the runway strength is too weak for landing wheeled aircraft.
To help address potential airfield deterioration, a series of experiments were incorporated into the SAC field program that began during the 2009−10 summer season and continued annually for several seasons. The objective of these experiments was to better understand the scope of the problem and potential methods to improve operations during the melt season. These are as follows:
1. Snow survey: Keeping the albedo high on the airfield runways, aprons, and town site is crucial to minimizing melt and deterioration of these

ERDC/CRREL TR-13-5 41
surfaces. This is done by regularly re-capping these surfaces with fresh, highly reflective snow. Thus, the airfield needs to be located where there is a regular “supply” of fresh snow from the prevailing weather conditions. However, excessive snow accumulation increases the effort to re-establish the airfield every year or resume operations after a summer snowstorm. Thus, there needs to be a balance between having enough snow to maintain the airfield, while not having too much snow that will significantly increase operating cost. An initial estimate of the correct annual accumulation is in the range of 6 in.1 Previous studies by Klokov and Diemand (1995) show that a steep increase of snow accu-mulation exists between PEG and WF. In this study a follow-on survey was conducted to verify the previous data and help identify a possible alternative location for the SAC. Because of constraints imposed by the annual sea ice, relocating the airfield now located at Pegasus (PEG) to-ward Williams Field (WF) is the most realistic alternative. Relocating the airfield to a new location that is closer to MCM would have the added benefit of reducing travel distance and time.
2. Correlate runway temperature, strength, maintenance, and usage: Detailed information is required to allow for a systematic analysis of the existing airfield infrastructure and how it is affected by environ-mental changes, maintenance, and use. This will allow for the creation of maintenance and usage best practices.
3. Control of wind borne dust: Wind driven soil particles from Black Is-land and Brown Peninsula are known to negatively affect the Pegasus airfield by decreasing the albedo, resulting in higher melting rates. We propose trapping the snow upwind of the runway to test a concept to prevent particles that are transported from Black island from reaching the airfield. Though initial planning of this test was conducted during this study it was not completed as part of this Phase I effort.
4. Localized albedo modification attributable to parked aircraft: Sta-tionary vehicles, aircraft, and buildings may modify the solar and long-wave radiation absorbed into the snow and ice surface. This locally en-hanced surface heating, snow and ice melting, and or snow and ice metamorphosis (change in grain size) reduces albedo in the vicinity of the object and degrades the ice and compacted snow surface over time at PEG (e.g., town and aircraft parking areas). Degradation in the ice and snow surface near buildings and aircraft parked for long periods (e.g., 24 hours) has shown reduced albedo and strength, and results in
1 Personal communication with George Blaisdell, NSF.

ERDC/CRREL TR-13-5 42
increased maintenance effort and cost. Full-scale tests were conducted near parked aircraft and buildings over several seasons at PEG to ex-plore the causes of this effect and how it may be mitigated. The results of these tests are reported in a separate report, as they were not com-pleted at the close of this Phase I study.
Full discussion of the results of observations from 1 and 2 listed above is provided in Section 5.
The principal parties responsible for addressing this area of concern are RPSC USAP Airfields Manager (for airfield construction, maintenance and operations) and CRREL (engineering support).
4.1.2 Fuel transportation
The second critical issue is assuring that sufficient fuel can be consistently delivered to the airfield. Initial discussions suggest the SAC may be located at or near where PEG is now; this would require the volume of fuel that has historically been transported to WF be transported as much as an ad-ditional 7 miles out to the new SAC location. The fuel transportation re-quirements at PEG prior to the 2009–10 season have been 5000–10,000 gal./week. For the SAC the estimated weekly requirements would be 175,000–250,000 gal. (average seasonal totals of over 3 million gal.). This has not been viewed as an insurmountable task. As discussed in Section 2, use of a flexible pipeline to transport the fuel over 13 miles from the Scott Base transition to PEG was successful during the 2009–10 summer sea-son. However, the following problems were identified with this mode of fuel transfer:
1. Putting that much hose out greatly increases the risk of damage to the pipeline and possible fuel spills if a line ruptures or is cut. These spills could go undetected for several hours resulting in a large amount of fuel spilled before cleanup is started. There is a lot of fuel stored in the pipes (106,000 gal. in the 13+ miles of pipeline) that can flow out once the spill starts, increasing the possible impact if it goes undetected for a long time. This is mitigated in part by the placement of manual shut off valves every mile in the pipeline. These are only open during fuel trans-fers; therefore, during the time between transfers, the amount of fuel that can be spilled from a single 1-mile long section is about 8000 gal. Yet, during a transfer, the risk for a large spill is higher, as the fuel is not “compartmentalized” during that time. Furthermore, there is no

ERDC/CRREL TR-13-5 43
way to contain the fuel in a similar way that containment measures are installed around pump stations and storage tanks; thus, it is harder to mitigate spill risk with pipelines than with other components in the fuel system.
2. The effort to deploy and pick up the hose is significant. Hose deploy-ment required continuous use of two Challenger trailers and six per-sonnel for 6 weeks (40 days). This may be shortened with experience, however. In Table 4-1 we compare this effort with the effort to deploy the hose at the SIR and WF. This table shows that deployment of the pipeline takes roughly twice as long as the combined deployment effort at SIR and WF. The pick-up time, in terms of weeks, is almost twice as long as well.
3. Similarly, the effort to transfer fuel increases. A comparison of the manpower needed for fuel transfers is also given in Table 4-1; this shows that an extra three people are required to facilitate these fuel transfers over the longer distance to PEG. Depending on the fuel de-mand, these transfers take place one to three times per week. This does not differ much from previous years, where one to two times a week, 9000 gal. of fuel was transported from WF to PEG.
Table 4-1. Comparison of effort for transferring fuel at the McMurdo airfields.
SIR WF PEG Pipeline distance, mi 1–2 5+ 13+
Deployment time, weeks (man-hr) <1 2+ 6 (580)
Personnel required for fuel transfers 5 5 7
Time to conduct transfers, hr 2–5 7–8 11
Pick-up time, weeks (man-hr) <1 1 3 (750 est.)
Another concept that might be used to meet the fuel transport require-ment is trucking the fuel. To test this concept, NSF is purchasing two Cat-erpillar 730 tractors and three trailers (two drop deck and the third would accommodate PAX). These are to be outfitted with low ground pressure tires with the anticipation of eventually replacing existing ATVs (e.g., Del-tas, Terrabus) with the Cat 730 platform. To transport fuel, a 4000-gal. tank will be placed on one of the drop deck trailers. These should be on station in February of 2011 and be available for a fuel transport proof-of-

ERDC/CRREL TR-13-5 44
concept during the 2011–12 summer season. Other possible transport methods are fuel bladders that are similar to what is used in the South Pole traverse. A possible advantage of using trucking is it may be possible to use the trucks that transport the fuel to deliver the fuel directly to the aircraft, eliminating the need to move the aircraft to the fuel pits for refu-eling. Such a change in operations would require further review however.
Figure 4-1. Use of challenger trailers to deploy flexible pipeline between Scott Base and PEG (photo courtesy of Alex Morris, RPSC).
A drawback of trucking the fuel is if there is a road failure that forces PAX, etc., to be shuttled to the airfields by helicopter; it is unlikely that the fuel can be transported that way because of the large volume of fuel required. Thus, there either needs to be a contingency for fuel transport or the air-fields will need to be closed down owing to lack of fuel.
The principal party responsible for resolving this area is RPSC (Special Projects Manager, Fuels Supervisor, Logistics Director).
4.2 High priority issues
The following are other high priority issues that may affect the realization of a SAC. Many of these issues overlap with one another and with the showstoppers given above. The topics that were identified are: airfield de-

ERDC/CRREL TR-13-5 45
sign and support, transportation, local fuel transport and storage, infra-structure, and the Long Duration Balloon (LDB) facility.
4.2.1 Airfield design and support
This area addresses airspace congestion, adequate bandwidth to support all airfield functions, TACAN monitoring at both the air traffic control cen-ter (ATCT) and McMurdo Center, runway maintenance, and providing an alternative landing or emergency divert site. All of these are important parts of airfield operations, but, upon review, there is a consensus that there is sufficient expertise and capability to readily address all of these considerations. With regard to airfield congestion, intracontinental flights dominate the flight schedule, so there will be no more congestion of these flights in comparison to current operations at WF. Collocating operations for intercontinental and intracontinental flights at the same airfield should not pose a problem either, as there are typically only two or three intercon-tinental flights per week (with intermittent peaks of as many as five or six flights per week), which does not increase tempo at the airfield significant-ly, and procedures are already in place to delay flights to avoid congestion.
Providing the necessary bandwidth to support the airfield can be readily accomplished by transferring over the infrastructure that was used at WF to PEG (2009–10) and can be easily done for the SAC in the future (Re-sponsible party: support contractor Information Technology and Comms support). There were issues with telecommunications, VHF communica-tions (comms) for the fuel crew, and degraded VHF comms for the Air Force during the 2009–10 operations at PEG. These were discussed at the Operations Review meeting (4–5 May 2010, CRREL) and the stakeholders determined that none of these comms issues were insurmountable and could be solved by reconfiguration or relocation of comms towers. This is similarly the case with monitoring the TACAN at both the ATCT and MCM, i.e., it can readily be accommodated with current technology (re-sponsible party: SPAWAR, Systems and Maintenance Team Lead).
With regard to runway maintenance, there was a concern regarding split-ting of resources between a SAC and the long duration balloon facility (LDB). However, with appropriate planning, equipment can be shared, even though the airfield and LDB will now be separated by as much as 7 miles instead of LBD and WF being collocated previously. Review of oper-ations during the 2009−10 season showed that this was not a problem, and that these resources could be readily managed to support both loca-
ERDC/CRREL TR-13-5 46
tions (responsible party: support contractor, Fleet Operations Supervisor and USAP Airfields Manager).
Regarding an alternate landing or emergency divert site, the current con-cept of operations for adverse weather for intercontinental flights is that these flights carry enough fuel to return to CHC if poor weather is encoun-tered at MCM en route, so an alternate landing location at MCM is not needed. For intracontinental flights, during the 2009−10 season, WF was prepared and minimal landing aids were maintained there so that this could be used as an emergency divert site. Also, the whiteout landing area at WF could be used if there was low visibility at both WF and PEG. Nei-ther WF proper nor the whiteout area were used during the 2009–10 sea-son. It is recommended that establishment of a whiteout landing area be explored at PEG to allow the whiteout landing area to be collocated with main airfield operations. Similar procedures can be used for a SAC, whether it operates at PEG or a new location. The parties responsible for addressing this issue are USAF (DoD Liaison, NSF/OPP, and 13th AF, Hickam AFB), NYANG, and RPSC (USAP Airfields Manager and Survey Supervisor).
4.2.2 Transportation
This concern primarily focused on shift issues associated with a longer travel time for NYANG, SPAWAR, and airfield crews to a SAC located fur-ther from MCM than WF, as well as increased vehicle maintenance, par-ticularly for the ATVs. These concerns were realized during the 2009–10 season, after the Pegasus shortcut (see Fig. 4-2) was closed on 8 January 2010. The commute times on the Pegasus shortcut were on the order of 30 minutes. However, once the shortcut was closed, the travel route went through the Scott Base transition along the Willy Road, into the Pegasus cut-off and then out the Pegasus Road (Fig. 4-2). The transit time on this longer route, as reported by the NYANG, was 35–50 minutes for the vans, 55–70 minutes on the Deltas, and 65–75 minutes on the Terrabus. This was confirmed by vehicle tracking technology installed in many vehicles throughout the season that showed average travel times of 37 and 62 minutes for the vans and Deltas respectively (Knuth and Shoop 2010). As-sociated with this is passenger heating of the shuttle vehicles on these long commutes. When there are not many people on board, the heating in the Deltas is insufficient in the late season and the passengers can be very cold once they arrive at their destination. As mentioned previously, this is a complex issue that requires further study and is separately funded under

ERDC/CRREL TR-13-5 47
the McMurdo Transportation Study. These problems are more thoroughly addressed under that project (responsible party: RPSC Vehicle Mainte-nance Facility Supervisor, USAP Airfields Manager).
Figure 4-2. Road network at McMurdo during the 2009−10 season (map provided by RPSC).
4.2.3 Local fuel transport and storage
As discussed previously, dealing with fuel is a key topic. In addition to transporting fuel to the airfield, there are logistics involved with storage and distribution at the airfield. This is not a new issue because storage and distribution for multiple airframes needed to be handled at the SIR and WF. What is unique is that this has not been needed for so many different airframes at PEG in the past.
During the 2009−10 season, an initial design for the fuel pit area at PEG was implemented. Though some refinements on the traffic flow around the fuel pits were necessary for the 2010–11 season, this served well for the 2009–10 season and demonstrates that the issues related to this area can

ERDC/CRREL TR-13-5 48
readily be addressed. However, the fuel pit cannot serve the wheeled air-craft and currently fuel needs to be trucked to the white ice runway from the skiway about twice a week to supply the wheeled aircraft. Not only does care need to be taken in properly siting the fuel storage, for both ac-cess and environmental control, but alternative methods for fueling the aircraft (mobile tank truck versus filling stations) should be contemplated as a final SAC design is considered (responsible parties: RPSC [Fuels Su-pervisor, Logistics Director, Environment, Health & Safety Manager, Vehi-cle, Maintenance, Facility Supervisor] and RSA).
4.2.4 Infrastructure
The infrastructure provided at the airfield “town site,” including handling of site sewage and wastewater, dining services, contingency planning, and exercise facilities, are at issue here. Each of these issues will be discussed in turn.
Of all of the issues addressed so far, with the possible exception of airfield and road maintenance (Section 4.1.1), sewerage and wastewater handling is one that may not be readily addressed by transferring existing experi-ence to a new site. For example, at the SIR holes are drilled through the sea ice and the waste is dumped into McMurdo Sound (permits are in place to allow the direct discharge of this untreated waste). At WF, waste was disposed of by using a hot air generator (Herman Nelson) to melt an initial hole into the snow. Waste was then put down this hole and the heat of the waste further melted the snow, creating a larger cavity for subse-quent waste. This method works because WF is situated on a porous snow surface; melting of the snow consolidated the solid fraction and left a void space equal to the pore space in the snow (i.e., about half of the volume is air, by melting snow an air space equal to about half of the melted volume is created). This method would not work as easily in a location where the airfield is founded on glacial ice (e.g., PEG) because the porosity of the ice is nearly zero and no void space is created when the ice is melted. Previous experience at PEG was that there was only a small volume of waste created at this airfield owing to the small number of flights (two or three per week). This was handled by storing the waste in barrels and then shipping the waste back via vessel to the US to be treated.
Possible solutions to this problem were explored in preparation for the 2009–10 summer for operating at PEG the last half of the season. These included:

ERDC/CRREL TR-13-5 49
1. Melting a hole in the ice using a hot water drill, pumping the water out, and then disposing the waste down the bulb in the ice, similar to what is done at the South Pole Station.
2. Using a hot water drill to penetrate through the 100-to 170-ft thick ice shelf to the ocean below and dispose of the waste down this hole.
3. Using an incinerator toilet system. 4. Trucking the waste back to MCM to be treated in the wastewater
treatment facility (WWTF). 5. Storing the waste in 55-gal. drums that can be palletized and shipped
back to the US for treatment.
Options 1 and 2 are the least desirable, as they require disposal of untreat-ed waste into the environment. Furthermore, both of these options have technical hurdles that need to be overcome. For option 1, design and pro-curement of the equipment to create the bulb and determining what to do with the water that was pumped out of the bulb makes it difficult to do this in any expedient fashion. Yet, a rough design of such a system is provided here. For safety reasons, the starting depth for the bulb would likely be on the order of 251–50 ft to provide enough ice thickness for safe surface op-erations over the subsurface void created. This leaves about 100 ft of ice in which to establish a bulb.
The volume of the bulb that would need to be established for a season of waste is about 25,000 gal. (based on design calculations for the 2009–10 season and the actual waste produced during that season of 19,550 gal.). Using the computer code developed for the South Pole Rodwell (Lunardini and Rand 1995), we calculated that it would take about 18 days to establish this volume of water bulb in the ice with a boiler that provides 142,000 btu/hr; the depth of the bulb would extend from 50 ft below the ice surface to 77 ft. The water would then need to be pumped out to provide a void in which to store the waste. The system would need to be run at least annual-ly to establish a new waste storage bulb every year, and need to be set up on a movable sled so it can be readily moved around each season to estab-lish a new bulb. The location of the outfall would likely change annually, and care would need to be taken to assure that new bulbs do not overlap with previous ones. With proper planning, it is possible that water pumped
1 Air Force (2002) specifies that the minimum ice thickness for aircraft operations is 22.3 ft. Though we
do not anticipate that aircraft will park or operate over the void during or after it is in use, making the top of the void at least 25 ft deep will allow safe operations in the event that aircraft or other heavy equipment inadvertently cross over the well.

ERDC/CRREL TR-13-5 50
out could be used as potable water at the SAC by either storing it on the surface in tanks or drawing it out as needed during one or more seasons1, and then using the new void during following seasons for waste.
One could easily conceive that, after several seasons, it will become diffi-cult to find a location close to the airfield to establish a new bulb. This could be ameliorated by creating larger voids that can store several sea-sons of waste; however, the questions of what to do with the excess melt water and the serviceability of a boiler and pump rodwell system that is only used once every 3–4 years would still need to be resolved.
In the case of option 2, though conceptually simple, the seawater that filled the hole could very well be below the freezing temperature of fresh water. Waste dumped down this hole could freeze, blocking the hole from accept-ing more waste. This means that the hole should be lined with a heated pipe that would extend to the bottom of the ice shelf or a little beyond. Therefore, this is not a simple solution and requires proper engineering to resolve all of the technical issues.
The most appealing of these options are 3 and 4. Option 3 is attractive be-cause the waste would not need to be handled at all. It could be pumped directly from the galley and head module to the incinerator and all of the waste would be burned, leaving behind a small volume of sanitized ash. Option 4 is less appealing because the waste would need to be transferred to tanks and trucked back to MCM and then transferred from the tanks to the WWTF. However, using 1000-gal. tanks, transfers would only need to be made about two to three times a week.
We decided that both options 3 and 4 should be fielded to test them in op-eration; both would be used so the system would be redundant. However, the time it took to design these two systems to work in the cold, and pro-cure them, made it impractical to field them for the 2009–10 season. The plan was to test them during the 2010−11 season. A schematic of the sys-tem is shown in Figure 4-3. The gray water from the Galley module could be stored in heated holding tanks or piped directly to the incinerator toi-lets (referred to as Incinolet in Fig. 4-3). Black water from the head mod- 1 It is impractical to consider establishing a single Rodwell at PEG that could provide potable water for
several seasons because 1) the shallow ice thickness would prevent establishing a very large volume and 2) for the well to be maintained from one summer season to the next, it would need to be con-stantly monitored through the winter season, which is not feasible owing to the remote distance of PEG from MCM and the hazard of sending personnel out to the site daily during the winter.

ERDC/CRREL TR-13-5 51
ule can also be transferred to the holding tank or directly to the incinera-tor. A heated vacuum tank (vac tank) system is also being purchased (not shown) that can draw the waste out of the storage tanks and transport it back to the McMurdo WWTF. The holding tanks are sized to accommodate about 1 week of waste in the event both the incinerator and vac tanks are temporarily out of service.
Figure 4-3. Planned waste handling system.
The actual solution used during the 2009–10 season was option 5. Though this was not desirable—because it involved daily handling of the waste with an average of 43 barrels of waste being filled a week—it could be done with existing resources. This was truly a stopgap measure that needs to be avoided in the future. However, the experience gained through the 2009–10 season allowed us to better estimate of the volume of waste that any proposed system would need to handle. Figure 4-4 shows the wastewater volume collected by week during the season. The average wastewater vol-ume was almost 2200 gal., with the peak being 2700 gal.

ERDC/CRREL TR-13-5 52
Figure 4-4. Wastewater generated at the Pegasus airfield during the 2009–10 season.
Another concern is dining services. First, with a longer trip out to Pegasus, the McMurdo dining hall may need to open earlier or stay open later to ac-commodate airfield shift changes and a longer commute. Also, because of the long commute, it is impractical to transit back to McMurdo station for meals, and a full service, on-site galley is desirable. This needs to be con-sidered a long-term goal that would improve the quality of food available to airfield crews, as well as cutting down on the number of trips from the McMurdo dining facility to the consolidated airfield (from daily to weekly). Another quality of life issue is providing a small exercise facility for crews that are located at the airfield all day.
We recognized that as the consolidated airfield may be much further from town than Williams Field, it will be important to have contingency plans if bad weather comes up quickly. This should include emergency berthing, survival bags, and MREs. This is seen as a high priority for current opera-tions at PEG, and the protocols developed for PEG can be transitioned over to a consolidated airfield once sited.
4.2.5 Operation of the long-duration balloon (LDB) facility
The LDB facility is currently located at WF and because of favorable weather conditions (low winds) at this site, we anticipate that this group will continue operation at WF into the foreseeable future. However, be-cause the consolidated airfield may not be located at WF, it may be best in the long term to treat the LDB as an independent science camp that oper-ates separately from the airfields. Currently, LDB has many facilities that

ERDC/CRREL TR-13-5 53
allow it to operate this way, including a full service galley, so moving to a stand-alone facility may not be difficult.
4.3 Future considerations
While the immediate concerns regarding the planning and use of a McMurdo SAC were the primary topic for the May 2009 stakeholders meeting, it was also important to discuss some future directions in which the USAP might head. One of these is the steady increase in large, deep field camps. This would increase the number of flights needed and thus the toll on the runways and airfield infrastructure. Another concern is the increasing number of science events that is being added over time and the effect this increased demand for flights to support this science will have on the runways. This includes use of the runway by UAVs (Unmanned Aerial Vehicles) and additional support, including requests for hanger facilities to support UAV operations. While trends in these activities are hard to pre-dict, they, too, would put stresses on the SAC. As neither of these topics was outside the issues of normal program planning and management, they will continue to be dealt with project-by-project, with the understanding that the integrity of the airfield to support personnel and cargo movement is the primary runway function.
4.4 Benefits
At the May 2009 meeting, as reflected in the pre-meeting questionnaire, there were many benefits and advantages identified for developing and moving to a SAC. This included taking advantage of past experiences and knowledge in the design to being able to further develop airfield efficien-cies and safety. The overall opinion was that a SAC would increase mission capability and safety, reduce training for some jobs, and allow for Aircraft Rescue Fire Fighting (ARFF) and spill response materials to be consolidat-ed. Additionally, there may be a potential for a SAC to provide long-term savings in airfield operations at MCM.

ERDC/CRREL TR-13-5 54
5 Results of 2009−11 Field Experiments and Observations
As discussed in Section 4.1, several field studies were conducted during the 2009–11 seasons. An outline and detailed findings of the studies are pro-vided.
5.1 Snow survey
To measure snow accumulation, nine poles were placed in the snow be-tween PEG and WF. The location for these poles is shown in Figure 5-1. These were placed along roughly the same line as the snow survey that was conducted by Klokov and Diemand (1995), allowing direct comparison with their measurements. The bamboo snow poles were typically 1 mile apart, set back approximately 200 ft from the road; the exception to this is that last two stakes (8 and 9) were 0.69 miles apart. They were all installed on 8 December 2009. When the poles were installed, their height above the snow surface was measured. Periodically through the season, the ac-cumulated snow was determined by measuring the distance from the top of the pole to the new snow surface. These poles were also left in the field over the winter so additional measurements could be made after they were in the field for a year. Klokov and Diemand (1995) also measured the sub-surface stratigraphy of the underlying snow and ice. We took similar measurements at each pole once during the season.
A summary of all of the snow survey data is given in Figure 5-2. In this fig-ure we have normalized all of the data by the number of days over which the snow accumulated. This allows us to compare the measurements that are taken over varying elapsed times and provides an accumulation rate.
Figure 5-2 shows that the data obtained during this study agree well with prior observations, though we tended to measure lower accumulation rates in comparison to Klokov and Diemand (1995). These measurements show that the accumulation rate rises rapidly east of PEG, and then levels off to about 0.1 cm/day (annual accumulation of about 14 in.) for much of the distance between PEG and WF. The accumulation rate seems to rise to about 0.15 cm per day near WF. As previously discussed, the annual accu-mulation of about 6 in. (15 cm) of snow is an estimate of the ideal accumu-

ERDC/CRREL TR-13-5 55
lation depth. The point where the annual accumulation is about 6 in. is approximately within the first half mile of the location of the current air-field (near locations AT4 and 3). This suggests that, based on the available data, the current location of the PEG airfield is very close to ideal, though movement of the airfield a small distance to the east may be advantageous. Further work is required to verify this.
Figure 5-1. Location of the poles (green circles) installed between PEG and WF during the 2009–10 season. The red circles indicate the approximate location of the snow survey locations taken by Klokov and Diemand (1995). (WorldView satellite image taken on 29 October 2009.)
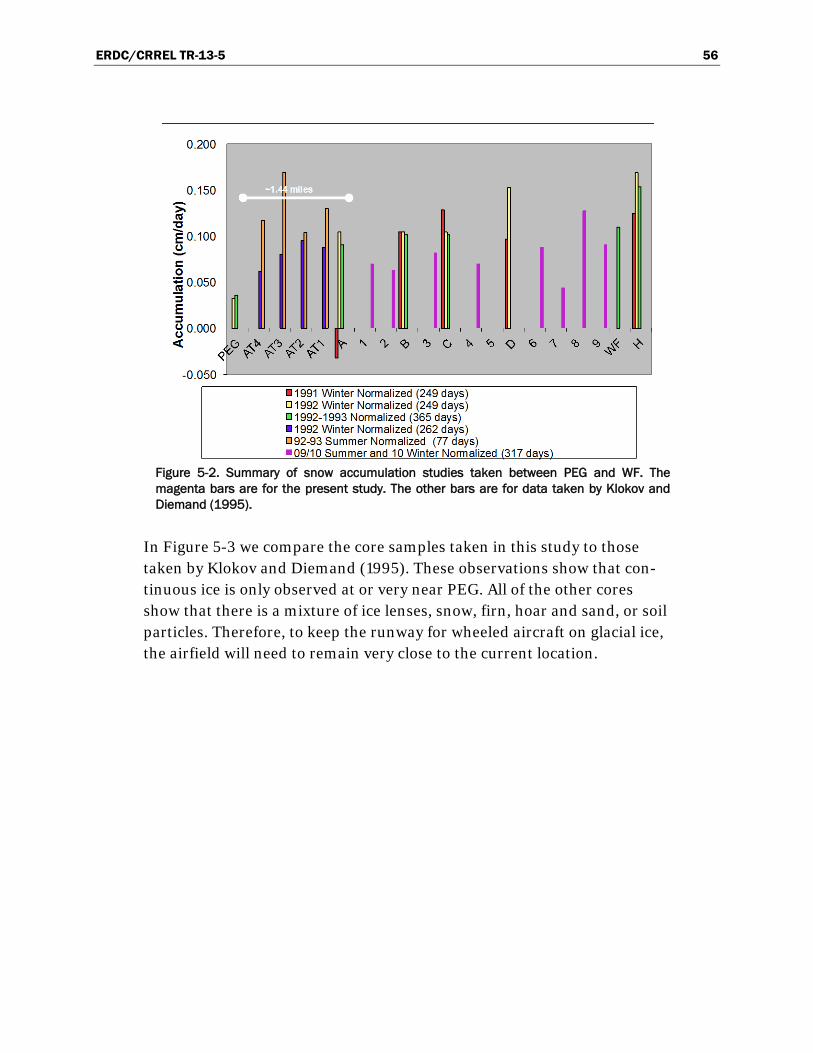
ERDC/CRREL TR-13-5 56
Figure 5-2. Summary of snow accumulation studies taken between PEG and WF. The magenta bars are for the present study. The other bars are for data taken by Klokov and Diemand (1995).
In Figure 5-3 we compare the core samples taken in this study to those taken by Klokov and Diemand (1995). These observations show that con-tinuous ice is only observed at or very near PEG. All of the other cores show that there is a mixture of ice lenses, snow, firn, hoar and sand, or soil particles. Therefore, to keep the runway for wheeled aircraft on glacial ice, the airfield will need to remain very close to the current location.

ERDC/CRREL TR-13-5 57
Figure 5-3. Subsurface structure of the snow pack in the Ross Ice shelf at several locations between PEG and WF. In addition to snow (white), hoar (green), ice (gray) and firn (yellow), sand and soil particles were visible in some of the cores and are indicated by dots (•) in the diagram. Numbered locations are core samples taken during this study. The remaining core samples were reported in Klokov and Diemand (1995).
5.2 Skiway and runway monitoring
The strengths of the runways and skiways are affected by the maintenance methods, air temperature, and solar radiation, and possibly additional sources of heating, such as sliding friction of skis or rolling resistance of tires. To try to quantify these effects, we monitored closely the type of maintenance the airfield was receiving, the environmental conditions, air-field load, and runway and skiway strength. The observation methods are described below.
5.2.1 Airfield maintenance
To document detailed runway and skiway maintenance—information such as time and date, tractor, implement, load, and number of passes—a log sheet was developed for the operators to fill out (see Appendix F). These data are required to correlate maintenance with environmental conditions and runway surface strengths. Additionally, collecting this information
ERDC/CRREL TR-13-5 58
will allow us to assess various maintenance techniques, and understand the time, equipment, and personnel required to maintain the airfield.
Additionally, we wanted to document aircraft movement at the airfield (e.g., aprons, ramps, and runway and skiways). By understanding aircraft movements and pace, we can evaluate aircraft operations against mainte-nance operations and runway performance (captured as strength). There may be times of day, temperatures, etc., that are more “gentle” on the runway surface than others. Understanding the interplay of aircraft movement, maintenance, and environmental conditions may allow devel-opment of successful working strategies to maintain runway performance during high-pace, high-temperature periods. However, it is difficult to get fine detail about aircraft movement on the ground, so, for this initial study, we relied on flight records provided by RPSC. These results are al-ready presented in Figure 2-7. An attempt was made to augment these da-ta using “Super Tracksticks” (www.trackstick.com), GPS receiving devices, placed onboard the aircraft throughout the season. Unfortunately, the combination of receiver location within the plane and satellite coverage around MCM made it impossible to discern any more than when the planes took off and landed and what runway they were using at the time. The resolution needed to track ground movements was not possible with this device.
5.2.2 Runway and skiway surface and subsurface temperature measurements
The strength of the snow and ice is highly temperature dependent (Ashton 1984; Prowse et al. 1990) and the strength of the ice declines as it warms. However, as it warms and just reaches 0°C, it still retains some strength. Once the ice becomes isothermal at 0°C, additional heating (through solar radiation or convection from ambient air) causes melting of the ice (or snow) at the grain boundaries and the strength starts to rapidly decline as complete structural integrity is eliminated. Therefore, it is prudent to monitor runway temperature to provide a diagnostic tool to track airfield degradation. In particular, we would like to know the point at which the top surface of the ice reaches the freezing point, and how far into the ice surface it is isothermal at the freezing point. Additionally, we need to cor-relate runway surface temperature with ambient air temperatures, and we also need to understand the “lag” time associated with diurnal warm up and cool down. These data can help determine optimal times to conduct maintenance operations, and help predict optimum operating times to

ERDC/CRREL TR-13-5 59
avoid snow surface damage during high-pace or high-temperature periods. We may also be able to identify if there are certain maintenance tech-niques that help reduce heat gain during the warm season.
To do this, we installed temperature monitoring nodes at several locations in the skiway and white ice runway at PEG (Fig. 5-4). At each location the temperature was monitored at two points across the width of the runway, and five depths below the runway surface. The lateral locations were at the runway centerline and 50 ft from the edge of the runway. Ideally, it is best to mount the temperature sensor right at the surface, so we can determine when the surface is at the melt point. However, this is impractical because of the high probability that the sensor will be broken by the runway maintenance equipment (graders, rollers, drags, etc.). So, to determine the near surface temperature of the ice and snow, temperature sensors had to be placed at several depths below the snow surface so that the temperature at the surface could be extrapolated from the subsurface temperatures. The initial vertical depths of the sensors at the white ice runway were 4, 7, 10, 15 and 25 in. below the surface before the runway was capped. It is not definitive what the thickness of the compacted snowcap was on the run-way, but estimates are that it was about 1.5 in.; thus, that thickness has to be added to the initial depth of the temperature probes on the runway. At the skiway, the initial vertical depths of each of the temperature sensors were 6, 9, 12, 17, and 27 in. below the surface. The probes at the skiway were placed deeper in the snow to prevent them from being hit by the maintenance equipment as the surface was compacted and graded. The final depth of the top sensors is given in Table 5-2. The table shows that the sensors in the runway varied little in depth because of snow accumula-tion and maintenance (when a storm occurs, the maintenance procedure is to remove the snow from the runway). However, at the skiway, the depth increased over time owing to snow accumulation throughout the season (when a storm occurs, the maintenance procedure for the skiway was typi-cally to groom the surface by compacting and leveling the surface rather than removing the snow completely).

ERDC/CRREL TR-13-5 60
Figure 5-4. Location of temperature monitoring strings installed in the skiway and WI runway at PEG during the 2009–10 summer season.
Table 5-2. Initial and final depth of the top temperature sensors placed in the runway and skiway at PEG.
Location (ft) Distance from
edge (ft) Initial depth (in.) including
snow cap thickness Final depth (in.) Runway
2000 50 (P1) 5.5* 4.25** 100 (P2) 5.5* 4.5**
5000 50 5.5* 4.25** 100 5.5*
8000 50 5.5* 4.5** 100 5.5* 3.25**
Skiway 3000 50 6‡ 9.75§
100 6‡ 7.5§ 7000 50 6‡ 13.5†
100 6‡ 13† * This assumes the capping of the runway was completed at about 25 November 2009 according to the
construction schedule. The original depth of the probes was 4 in. (installed on 15 October 2010). The approximate thickness of the additional cap after compaction was 1.5 in.
**Depth measured 16, 17 January 2010. ‡ Probes installed on 16 October 2009 in skiway. § Depth of probes measured on 7 February 2010. † Depth of probes measured on 31 January 2010.

ERDC/CRREL TR-13-5 61
5.2.3 Strength and density measurements
Strength is the primary indicator of the “success” of maintenance activi-ties, the impact of aircraft operations, and the effect of environmental conditions (temperature, diurnal effects, etc.). To correlate airfield strength with temperature, maintenance operations, etc., airfield strength needed to be regularly measured. These measurements were made gener-ally twice a week from 16 November 2009 through 13 January 2010 on the WI runway. Some earlier measurements were made on the skiway during its construction, starting as early as 27 October 2009. Strength measure-ments at the skiway also ended on 13 January.
Mainly, the strength measurements were taken in the same location as where the temperature strings were installed in the runway and skiway. However, there were additional measurements made at other locations in both the skiway and runway during skiway construction and capping of the WI runway to verify the spatial uniformity of strength.
The runway strength was measured using a Russian Snow Penetrometer (RSP). The geometry and operation of the RSP is given in Air Force (2002). It provides a strength index based on the number of hammer blows required to penetrate a fixed depth.
Figure 5-5. Cone and tip geometry for the Rammsonde (top) and Russian Snow Penetrometer (bottom). The scale on the left is in increments of inches.
The skiway strength was measured using both a RSP and Rammsonde Penetrometer. The Rammsonde also provides a strength index; however,
ERDC/CRREL TR-13-5 62
because of its larger cone and shaft, it is better suited for measuring weak-er soils or less compacted snow (see Fig. 5-5).
In addition to the strength measurements, snow density was measured in the skiway and runway when the construction and capping operations were completed. This was done to verify that adequate compaction was achieved during skiway construction and runway capping.
5.2.4 Results
In Table 5-3 we summarize the density measurements taken at the WI runway and skiway. These measurements were taken early in the season before the PEG airfield was in operation for Mainbody flights. As expected, this shows that the density of the runway surface was quite a bit higher than that of the skiway (0.59–0.86 g/cm3 vs. 0.39–0.58 g/cm3). The high-er compaction that is achieved in the runway is a result of the snow that is blown onto the runway for capping (upper 5.5–7 cm in Table 5-3) being compressed against the hard glacial ice (depths >7 cm) as the weight carts are rolled over the snow. On the skiway the surface snow is being com-pacted over a softer snow sublayer, and even though the snow is churned up with the sheeps foot rollers prior to compaction, it cannot be easily squeezed to as high a density as the snow cap on the runway.
Figure 5-6 shows the subsurface temperature at a depth of 5.5 in. for all of the measurement locations. The measured temperature at all six locations track very closely through most of the season, with the largest variation early in the season. This indicates that for most of the season the runway has a nearly uniform temperature in the horizontal plane. This observation allows us to generalize by using data taken at one location to represent the entire runway. The most complete temperature data set was obtained at the 2000-ft marker, so we will use those data for the remainder of our subsurface temperature observations at the white ice runway.
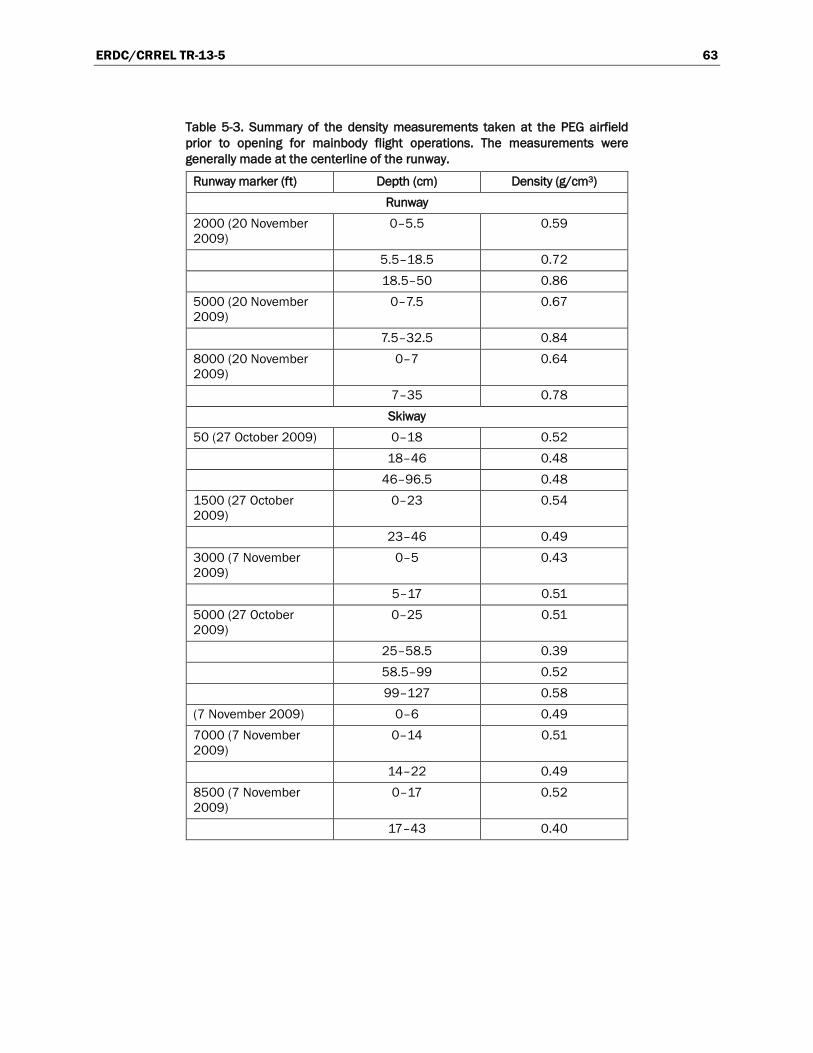
ERDC/CRREL TR-13-5 63
Table 5-3. Summary of the density measurements taken at the PEG airfield prior to opening for mainbody flight operations. The measurements were generally made at the centerline of the runway.
Runway marker (ft) Depth (cm) Density (g/cm3) Runway
2000 (20 November 2009)
0–5.5 0.59
5.5–18.5 0.72 18.5–50 0.86 5000 (20 November 2009)
0–7.5 0.67
7.5–32.5 0.84 8000 (20 November 2009)
0–7 0.64
7–35 0.78 Skiway
50 (27 October 2009) 0–18 0.52 18–46 0.48 46–96.5 0.48 1500 (27 October 2009)
0–23 0.54
23–46 0.49 3000 (7 November 2009)
0–5 0.43
5–17 0.51 5000 (27 October 2009)
0–25 0.51
25–58.5 0.39 58.5–99 0.52 99–127 0.58 (7 November 2009) 0–6 0.49 7000 (7 November 2009)
0–14 0.51
14–22 0.49 8500 (7 November 2009)
0–17 0.52
17–43 0.40

ERDC/CRREL TR-13-5 64
Figure 5-6. Measured subsurface temperature for all six monitoring locations in the PEG WI runway. The initial depth of the probes was 5.5 in. P1 indicates that the sample location is 50 ft from the edge of the runway. P2 is 100 ft from the edge of the runway (runway CL).
Figure 5-7 shows typical vertical temperature profiles taken in the WI runway over the course of a single day. These are consistent with classic thermal conduction response with time varying thermal input at the sur-face; subsurface temperatures lag behind the surface temperature. The near surface temperature is responding to the convective heat transfer at the air−ice interface and radiation thermal input into the top few inches of the ice. The subsurface temperatures are influenced by conduction of the energy input at the surface down to lower depths. The temperature at a depth of 25 in. is nearly constant over time, but the near-surface tempera-ture varies widely through the diurnal cycle.
In principle, we could determine the surface temperature of the runway by extrapolating the data to the surface using a curve fit that has the func-tional form of the time-dependent heat transfer equations. A simpler method would be to estimate the surface temperature using a linear ex-trapolation of the near surface temperatures. We apply this latter method and show the results in Figure 5-8. In this case we use the two data points nearest to the surface to determine the slope and intercept with either the plane of the surface or the 0°C isotherm. If the 0°C isotherm is found to be below the ice surface, then the ice temperature is assumed to be isother-mal at 0°C between the surface and the extrapolated depth of the 0°C iso-

ERDC/CRREL TR-13-5 65
therm. Otherwise, the extrapolated temperature at the surface is reported. The depth of the probe varied through the season as shown in Table 5-2; therefore, we linearly interpolated the probe depth between the two meas-ured depths at the beginning and end of the season. In Figure 5-8 we plot both of these pieces of information. The blue line (and left axis) is the ex-trapolated surface temperature. If the surface temperature is 0°C, the red line (and right axis) indicates the estimated depth in the ice to which the 0°C isotherm extends.
Figure 5-7. Vertical temperature profiles measured on 17 January 2010 at the 2000-ft mark on the WI runway. The legend indicates the time the measurement was made (24-hour clock). The temperature string is located 50 ft. from the runway edge.
a. 25 November 2009 through 16–17 January 2010.
Figure 5-8. Estimated hourly surface temperature and depth of 0°C isotherm on the PEG white ice runway 2009−10 season.

ERDC/CRREL TR-13-5 66
b. 7 December 2009.
Figure 5-8 (cont’d). Estimated hourly surface temperature and depth of 0°C isotherm on the PEG white ice runway during the 2009−10 season. (a) Data shown extend from the time the construction of the snowcap was completed (25 November 2009) until the depth of the temperature probes was measured in the runway (16–17 January 2010),and (b) focuses in on the temperature variations on a single day, 7 December 2009.
Figure 5-8a shows that, during the 2009−10 season, there are only three times (6, 7, and 8 December 2009) that the estimated surface temperature reached 0°C, and all of these times the duration was a few hours. What is surprising is that, in that short period of time, the depth of the 0°C iso-therm can extend to over an inch deep. As has been discussed before, this season was unusually cool. In a more typical year, one might expect that the surface temperature might be at 0°C for longer periods.
In Figure 5-8b, we zoom in on the event on 7 December 2009. This shows that the period the surface temperature was at 0°C occurred later in the day and extended from about 1500–1900 hours. Similarly, on 6 and 8 De-cember, the approximate times the surface temperature reached 0°C were about 1800 and 1600 hours, respectively. The important piece of infor-mation to glean from this is that using the airfield earlier in the day is ad-vantageous because it will be cooler, and stronger, in the morning hours. This would be especially important in warmer years, when the airfield strength is significantly degraded by the runway temperature hovering around 0°C for an extended period.

ERDC/CRREL TR-13-5 67
a. 16 November 2009.
b. 7 December 2009.
Figure 5-9. Strength measurement profiles for the PEG white ice runway using the RSP.
In Figure 5-9 we show some representative strength data taken on the WI runway. The strength measurements shown in Figure 5-9a were taken dur-ing the compaction of the snow cap, while the data shown in Figure 5-9b were taken after the runway construction was complete and shortly after the runway was opened for operation. There is quite a bit of scatter in the strength measurement data. Yet, this shows that, early in the season, the

ERDC/CRREL TR-13-5 68
strength varies little with depth (Fig. 5-9a), but does show a moderate in-crease of strength with depth. However, once the cap is fully compacted (Fig-5-9b), the strength of the runway is considerably higher, and the strength increases rapidly with depth. It is interesting to notice that, for both sets of measurements (Fig. 5-9a and b), the near surface strength is almost identical.
To look at the temporal variation in runway strength, we have averaged the data over depth and spatially and presented them in Figure 5-10. This was done as follows. Because the near surface strength is in general weak-er, the profile was separated into two layers: near surface data, and deeper measurements. The strength values from the three RSP measurement lo-cations were averaged over the depth of these layers. The data set was di-vided into the early season (prior to the runway opening) and the opera-tional season, as indicated by the green vertical line in Figure 5-10 bottom.
For the early season data, the measurements were taken at coarser inter-vals (e.g., 7.5, 17.5, 27.5 cm [3, 7, 11 in.], see Fig 5-9a), so the data taken at the two depths, 7.5 cm (3 in.) (shallow) and 17.5 cm (7 in.) (deep), were averaged spatially but not over depth. During the operational season, measurements were taken at a finer depth resolution, typically 2.5-cm (1 in.) increments. During this later period, the measurements from 0–15 cm (0-6 in.) were averaged over depth and spatially; similar averaging was applied to measurements deeper than 15 cm (6 in.). In Figure 5-10 we also plot error bars showing the range in the strength measurement data. For reference, we plot in Figure 5-10 the times that the runway is rolled with the weight cart (indicated by * in Fig. 5-10), the number of flights per week (red bars at top of Fig. 5-10), and the average strength needed to support C-141 operations (the aircraft with the highest strength requirement). In the upper pane, we plot the air and near surface ice temperature.
What the strength data seem to show is a steady increase in the runway strength through the construction period (grayed area, Fig. 5-10). During airfield operations, there is no clear systematic change in the runway strength, though the data trends show that the near-surface strength ap-pears to decline a little with time, while at greater depths it appears that the strength increases with time. The exact cause of these trends is un-clear, and it is a little dubious to try to infer too much from these apparent trends considering the wide scatter in the data.

ERDC/CRREL TR-13-5 69
There are two points worth noting, however. First, the strength of the runway seems to be most closely tied to runway maintenance (cap con-struction and weight carting) and, second, the measured runway strength in general is above the minimum strength needed for C-141, a conservative standard for airfield operations. There are only a couple of times that any of the strength measurements fall below this value; at no time is the aver-age strength anywhere near this minimum requirement.
Figure 5-10. Temperature and strength of the WI runway during the summer of 2009–10. The air temperature is the reported air temperature at the PEG site. The hourly subsurface temperature was measured at approximately 4−5.5 in. below the runway surface at the 2000-ft marker.

ERDC/CRREL TR-13-5 70
There is no clear trend in strength data associated with air or runway tem-perature in Figure 5-10. The temperature of the runway and air vary a bit during the operation of the PEG airfield, but there are no obvious trends in temperature that coincide with changes in runway strength.
Figure 5-11. Measured runway strength as a function of the average daily temperature of the runway at the 10 cm (4-in.) depth at the 2000-ft runway marker. For the near-surface strength measurements, the extrapolated daily average surface temperature was used. For the deeper strength measurements (17.5 and 15+ cm [7 and 6+ in.]), the daily average temperature near that depth was used.
To explore this possibility further, we have explicitly plotted runway strength against temperature in Figure 5-11. This plot also shows that there is no clear correlation during the 2009−10 season between the run-way temperature and subsurface temperature. However, we hesitate to say that in general there is no correlation. It was colder than normal during the 2009–10 season and, as previously discussed, Ashton (1984) and Prowse et al. (1990) showed that ice strength does decline with increasing temperature; yet, once the ice reaches an isothermal state at 0°C, the strength continues to decline over time with increasing thermal input (through solar radiation, and convective heat transfer from the air to the ice). In a warmer year, where the ice temperature is closer to the melt point, we anticipate that we would be able to observe a tempera-ture−strength relationship up to the point where the ice becomes isother-mal at 0°C. However, once the ice becomes isothermal at the melting point, it is the energy budget of the ice (thermal input) that will signal fur-ther strength declines. Therefore, in future years, it will not only be im-

ERDC/CRREL TR-13-5 71
portant to document the subsurface runway temperature, but also the in-coming solar radiation and the air temperature and wind speed. This latter information will help to quantify the energy budget at the runway surface and provide a better predictor of runway strength deterioration.
The temperature measurements at the skiway were more problematic than at the WI runway, mainly because the depth of the probes increased signif-icantly over the season, as shown in Table 5-2. At the 3000-ft marker, the depth of the probes increased by 1.5 to 3.75 in., which was not too different from the depth variation seen in the WI runway. However, at the 7000-ft marker, the depth of the probes more than doubled over the course of the season. As each of the temperature probes vary in depth below the surface throughout the season, it is impossible to compare the measured tempera-tures directly, except early in the season. Thus, to compare the tempera-tures, all of the data were extrapolated to the surface (Fig. 5-8). The results of this analysis for the skiway data are shown in Figure 5-12. These extrap-olated data are less reliable late in the season, especially at the 7000-ft marker, because the probes are so deep in the skiway and use of linear in-terpolation will be more error prone. Regardless, the temperature data show remarkable agreement at all four sites and also suggest that, like the WI runway, the surface of the skiway is uniform. What these data also seem to show is that there are a few days during which the temperature of skiway surface also reached 0°C. This occurred in early December, around the same time the white ice runway surface reached 0°C.
Figure 5-12. Extrapolated surface temperatures of the skiway at PEG, based on the measured subsurface temperature data.

ERDC/CRREL TR-13-5 72
We also plot in Figure 5-13 the estimated depth that the skiway surface is isothermal at 0°C at all four temperature probe locations. This shows that the isothermal depth in the skiway was estimated to be much deeper than what was seen in the WI runway. This may be ascribable to the snow sur-face being more porous (see density measurements in Table 5-3), allowing the ambient air to be pumped into the skiway surface. We hesitate to draw too many conclusions from these data, however, as the temperature probes were buried over 6 in. below the surface and linear interpolation of the temperature data over such a large depth is error prone.
Figure 5-13. Extrapolated depth to which the 0°C isotherm reaches based on the measured subsurface temperature data.
In Figure 5-14 we show the average of the strength measurements taken in the skiway using the RSP and Rammsonde. The snow is very soft in com-parison to the WI runway and the RSP strength index is very low and has little fidelity. The Rammsonde resolves the strength variations much bet-ter in this softer surface. These data show a different picture from that seen at the WI runway; the surface of the skiway is harder than the deeper snow. This indicates that the top layer is well compacted, but, at greater depths, the snow is not as consolidated and hard. These observations are consistent with the density measurements reported in Table 5-3, where the near surface density is higher in the skiway than the deeper snow. Clearly, after the first season of operation, the skiway surface is not hard enough to support wheeled operations as the measured RSP strength value is typical-ly below 50 and the minimum mean RSP strength value needs to be at or above 55 for C-130 and 60 for the C-17.

ERDC/CRREL TR-13-5 73
Figure 5-14. Strength measurements taken on the skiway ay PEG.

ERDC/CRREL TR-13-5 74
6 Concept of Design
Here we outline the conceptual design for a consolidated airfield operating at MCM. The requirements for such an airfield must meet the current re-quirements of the MCM airfield system as discussed in Section 3. In par-ticular, it must allow both wheeled and ski-equipped aircraft to land, sup-port the current payload and PAX throughput, and provide for mainbody transportation from 1 October−28 February with a WINFLY closely fol-lowing the Austral sunrise, all while maintaining safe and flexible opera-tions.
6.1 Location
The airfield needs to be placed as close as possible to MCM yet have a sur-face that is strong enough to land wheeled aircraft throughout mainbody. Additionally, the runway surface needs to support rapid preparation for wheeled service during WINFLY and allow for expedient preparation for possible emergency MEDEVAC mid-winter. Possible surfaces that can support wheeled aircraft without extensive preparation are ice (seasonal or glacial) or dirt and paved surfaces. The sea ice runway is an example of a seasonal ice surface; the Ross Ice Shelf is glacial ice. Marble Point is an ex-ample of a location where a dirt runway has been sited in the past and is currently the site of a helicopter refueling station. At present, snow surfac-es require considerable annual preparation to establish a skiway to sup-port LC-130 operations. Though often after repeated use the skiway is packed hard enough to allow landing the LC-130s on their wheels, there is no current expedient way to prepare a deep snow surface (greater than 12 in. of new snow) for landing wheeled aircraft. Consequently, barring a rev-olutionary improvement in creating “snow pavement” that would allow rapid runway preparation in deep snow, we will assume that ice and dirt are the only viable surfaces for establishing a SAC at MCM that allows for reliable operation of wheeled aircraft.
Siting the SAC on the sea ice is not feasible because it can only support air operations through early to mid-December before it becomes too weak to safely land C-17s and larger aircraft. Furthermore, icebreakers break up the ice in the McMurdo Sound every January to allow arrival of cargo ves-sels in February. Therefore, an airfield sited on the seasonal sea ice can never support full summer operations at MCM.

ERDC/CRREL TR-13-5 75
Though Marble Point is a flat section of exposed land that is well suited for establishing a runway, it is located approximately 50 miles from MCM across the McMurdo Sound. Use of this airfield would either require transport across the ice in the McMurdo Sound (only sustainable part of the season because of the seasonal ice cover), overland transport across Victoria Land to the Ross Ice Shelf and then to MCM (a treacherous sever-al hundred mile route), or helicopter or hovercraft shuttle. This remote-ness from MCM means it is not a viable option.
The only viable location for a consolidated airfield in the near term is on the Ross Ice Shelf. It is relatively close to MCM and provides a flat, stable surface. Furthermore, the region near the current PEG has minimal snow accumulation (see Section 5.1), allowing for rapid preparation of the air-field for landing wheeled aircraft.
6.2 Configuration
Figure 6-1 is a sketch of the configuration of a SAC concept. This includes a single ice runway for landing of wheeled aircraft built on the glacial ice and capped with snow; this is referred to as the “White Ice Runway.” This would operate in much the same way as the current WI runway at PEG; that is, it would be a crosswind runway, with the understanding that the prevailing wind that acts crosswind to the runway is of low magnitude and is insufficient to prevent landing of large aircraft such as the C-17. The high winds are associated with the storm direction, which is nearly parallel to this runway.
Additionally, a main skiway, oriented parallel to the prevailing wind, would be required for LC-130 operations under most weather conditions. To accommodate LC-130s during excessive crosswinds (> 15 knots), a crosswind skiway would also be required. This would keep the LC-130s from having to use the WI runway to minimize the amount of dark materi-al (e.g., dirt, soot, etc.) deposited on the runway. The configuration of the two skiways in Figure 6-1 is consistent with the historical layout of WF.

ERDC/CRREL TR-13-5 76
Figure 6-1. Initial design concept for the SAC.
A white-out (WO) landing area also needs to be available for landing in ze-ro visibility (whiteout) conditions, such as blowing snow or fog. Historical-ly, this has been maintained off the departure end of the main skiway (skiway 25) at WF (see Fig. B2, Appendix B). The location of a WO area in Figure 6-1 is consistent with the configuration currently maintained at WF. This has the advantage of putting the WO area in a region of increas-ing snow accumulation, allowing for a softer surface to land on in the event a WO landing is necessary. The viability of locating the WO area in the region indicated in Figure 6-1, or, alternately, off the departure end of the WI runway (approximately heading 330° in Fig. 6-1) would need to be determined via an aerial and ground survey of the location where the SAC is planned, with consideration of prevailing and storm winds at the site. As an example of the latter, wind rose data for both PEG and WF are provided in Appendix A. These show that the direction for the high magnitude (storm) winds is predominately from the same direction at both locations; however, the peak magnitude of the storm winds at PEG is about 20 knots, while at WF it is about 16 knots. As the maximum crosswind for the LC-130 is 15 knots, there may be a greater likelihood of needing to use a “crosswind” landing orientation under WO conditions if the WO area is located close to PEG, rather than near WF.
A third possible location for the WO area is to maintain the current area at WF. The disadvantage to this is, if an aircraft needs to use the WO area, it

ERDC/CRREL TR-13-5 77
would land in a remote area away from the main airfield, secured at that location until the weather clears or a recovery vehicle arrives, and then re-covered back to the airfield. Co-locating the WO area with the main air-field decreases the logistics associated with aircraft recovery after a WO landing.
The airfield would also have suitable aprons, taxiways, fuel pits, and a supporting town site. The details of the layout of these individual compo-nents would be determined in the detailed SAC design, a future effort; however, after two seasons (2009−10 and 2010–11) of operating a co-located runway and skiway at PEG, many of the issues about the layout of this part of the airfield have been ironed out and at least portions of that configuration can likely be reused for the SAC design. Furthermore, most of these details fall into the supporting infrastructure that will be dis-cussed in Section 6.3; the details of the snow road approach are beyond the scope of this conceptual design. However, establishing and maintain-ing sustainable snow roads to service the airfield is essential. The details of how this will be accomplished are addressed in the sister project McMurdo Transportation Study.
6.3 Infrastructure
The key infrastructure components needing to be addressed in the overall airfield design include air traffic control, fuel supply and distribution, elec-tric power supply, temporary on-site cargo storage, PAX terminal, potable water supply, food service, and waste handling. Each of these is discussed in turn below.
6.3.1 Air traffic control and ground control
It is beyond the scope of this work to outline air traffic control operations, runway and taxiway marking, or ground control in detail. However, these procedures need to be consistent with current operations at SIR, PEG, and previous operations at WF, and also the ETLs established for airfield oper-ations in Antarctica (Air Force 2002, 2007). Additionally, the TERPS for the SAC will need to be determined by SPAWAR once a final site is select-ed.
ERDC/CRREL TR-13-5 78
6.3.2 Fuel supply and distribution
As discussed in Section 4.1.2, the amount of fuel that has to be transported to the airfields is 175,000–250,000 gal. per week. During the 2009−10 season, it was successfully shown that this could be supplied by pumping the fuel overland through a pipeline from MCM to a distance as far as al-most 15 miles to PEG. This demonstrates that a pipeline is a viable option for supplying a remotely located SAC. As stated in Section 4.1.2, there are several disadvantages to using a pipeline. These include the potential envi-ronmental hazard if the hose ruptures, as well as the effort required to de-ploy and retrieve the hose, and transfer the fuel one to three times per week.
An alternate approach, also discussed in Section 4.1.2, is trucking the fuel overland. The Cat 730 was tested as a proof-of-concept for this approach during the 2011−12 summer season. A tank with a capacity of 4000 gal. can be placed on the drop deck trailer that will come with the Cat 730 plat-form (Blaisdell 2010). With this configuration, 7 to 11 trips per day will need to be made from MCM to the SAC. If the SAC is located a similar dis-tance from MCM as the current PEG airfield, the transit time (one-way) would likely be similar to that of the ATVs currently used—about 60–75 minutes. If takes about 1 hour to load and unload the fuel at each end, a round trip would be approximately 4 hours. Therefore, one Cat 730 could make six trips a day if run 24 hours a day. This suggests that a minimum of two Cat 730s would need to be operated daily to meet the fuel demand at a SAC located up to 15 miles from MCM. These, of course, are prelimi-nary estimates. Following the proof-of-concept during the 2011−12 season, there will be an opportunity to do a more thoroughly evaluate the viability of trucking the fuel to the SAC using the Cat 730 platform, or other meth-ods.
6.3.3 Electric power supply and Communication
We anticipate that the same infrastructure for power and communication (Comms) will be replicated at the SAC. The details of siting Comms towers and the layout of the power distributions will depend on the location and design of the SAC and will be addressed in the final SAC design.

ERDC/CRREL TR-13-5 79
6.3.4 PAX terminal and on-site cargo storage
A dedicated terminal to provide heated shelter for PAX waiting for shuttles after arrival and to board for departure is required. The maximum capacity should accommodate the maximum PAX load carried by a C-17 (approxi-mately 130 PAX).
Additionally, sufficient on-site temporary storage for cargo needs to be provided for staging of cargo to be transported to MCM or waiting to be loaded on departing aircraft. This includes sufficient Do-Not-Freeze stor-age for fresh food (freshies) and other freeze-sensitive cargo.
6.3.5 Food services and water supply
Near term, it is anticipated that a galley would be available on-site that is similar to the current PEG configuration. Food would be prepared in MCM, transported to the airfield, and reheated on-site. Over time this may expand to include limited food storage and preparation capability to cut down on the frequency of food transport, especially if it needs to be moved over a long distance. The details of this are beyond the scope of this work.
In addition to food is maintaining a supply of potable water at the SAC. Currently, non-potable water for operation of the toilet facilities (or head module) is supplied by a snow-melter; potable water is trucked to the air-field. Current estimates are that the amount of potable water needed is 3–4000 gal. per week for the crew and PAX that would be at the airfield. In addition to that, approximately 25001 gal. per week are generated and used for non-potable applications. This gives a total conservative require-ment of as much as 6500 gal. per week of water; this number needs to be further refined with better data from the PEG operations during the 2010–11 season. A portable tank that has about 1000 gal. capacity would require almost daily transport of potable water. There may be better ways to sup-ply the water needed at the SAC. These methods may include desaliniza-tion, treatment of melted snow, and melting of subsurface ice (e.g., a Rodwell as discussed in Section 4.2.4). These and other methods need to be further explored to determine if there is a more efficient way to supply the quantity of potable water required for the SAC. This will be explored in the detailed SAC design. 1 Based on Section 4.2.4 the amount of waste produced at PEG is about 2500 gal. per week. The non-
potable water is used to service the head module, so we know that that amount of water produced by the snow-melter cannot be more than 2500 gal.
ERDC/CRREL TR-13-5 80
6.3.6 Waste handling
As discussed in Section 4.2.4, the grey (from the galley) and black water (from the head module) produced at the SAC needs to be properly han-dled. Based on the 2009–10 season, the approximate amount of waste is at least 2200 gal. per week (average), with a peak of 2700 gal. per week. That would translate to over 55,000 gal. of waste over an approximate 25-week period.
In the near term, two proof-of-concept methods are being tested at PEG: 1) incinerator, and 2) trucking waste to the MCM waste water treatment facility (WWTF) for treatment.
These methods would replace the current method of storing the waste produced at PEG in drums and transporting it to the US for treatment. Both of these methods have the capacity to meet the above demand. The success of these methods will help to determine the best course of action for handling waste at the SAC. The incinerator was operational during the last part of the 2010−11 season. The vac tank required for trucking the waste to the WWTF was on-site.
Other methods, including those discussed in Section 4.2.4, may need to be evaluated pending the outcome of these proof-of-concept tests.
6.4 Contingency operations
As discussed in Section 3.1, appropriate plans, facilities, and supplies need to be established and maintained for providing shelter and food at the SAC for crew and PAX that may be stranded at the site by inclement weather (Appendix F is an example procedure used during the 2010–11 season for PEG). This is temporary shelter that would be provided for the duration of a storm (2–3 days) and would not be appropriate for long-term housing; it therefore, would not replace or augment the housing at MCM.
Also, contingency plans need to be developed for operations when there is a period of excessively warm weather that could compromise airfield strength. Current plans for operating during warm weather are outlined in Appendix G. Additionally, Air Force (2002) recommends proof-carting the runway if the measured surface temperature is above −4°C to find possible subsurface melt-water pools. However, other measures may be required. Flight schedules may need to be shifted so that the C–17s arrive early in

ERDC/CRREL TR-13-5 81
the day when the runway is at its minimum temperature—and the snow cap is at its maximum strength—in the diurnal cycle, maintenance proce-dures may need to be modified to preserve runway strength, or in the ex-treme, the runway may need to be closed for a period of approximately 1–3 weeks. In addition, plans are needed to allow the accumulation of suffi-cient station food and other supplies, with no resupply during the closure, and procedures to catch up on the backlog once the airfield is reopened. In the event of sustained warm weather, the roads would likely be impassible, cutting off access to the airfield for all but helicopters; this possibility must also be included in contingency planning.
Another possible scenario is that the weather at MCM could become warm long enough to make the skiways too soft to use. Though this is possible in the extreme, this is not considered as a highly probable scenario and will not be considered. This assumption implies that air operations will always be sustainable at MCM using LC-130s as the fall back position if the WI runway is shut down by warm weather. Though the capacity will be lim-ited, the LC-130s can provide service from CHC to MCM during a shut-down of the WI runway, provided the roads or helicopters can move cargo and PAX between MCM and the airfield during these warm periods, as was done prior to the opening of PEG.
6.5 Cost analysis
From the analysis provided in Section 2.5.1, we can estimate the potential savings for consolidating the MCM airfield system to a single site. As men-tioned previously, the estimated cost of establishing the SIR and WF is 24,000 man-hours. Elimination of this cost could translate to a potential savings of 24,000/63,000 = 38%. However, the average travel distance to the SAC, if located as far away as the current PEG site, will be 2.6 times longer, translating to 2.6 times higher fuel cost for the shuttles. This does not factor in the additional road maintenance that may also be necessary to preserve access to the airfield. Therefore, it is difficult to determine the overall potential savings that might be realized by converting to a SAC at MCM.

ERDC/CRREL TR-13-5 82
7 Conclusions and Recommendations
This study explores the feasibility of consolidating air operations at McMurdo to a single airfield complex (SAC). This is an effort to improve the efficiency of airfield operations by reducing cost and redundancy of fa-cilities and personnel across multiple airfields operating simultaneously.
By comparing the performance of the operations as the airfield configura-tion transitioned from three airfields (2007–08 season and earlier) to two airfield operations (during the 2008–09 and 2009–10 seasons), we found that there was no adverse impact on meeting the required payload de-mands. In fact, the payload handled with the two-airfield operations was on par with the maximum throughput during three-airfield operations in almost all categories. Furthermore, both seasons during which there was a two-airfield operation, the payload transferred to the inland camps ex-ceeded that handled during recent (2000–08) performance of the three airfields. This was likely not attributable to any intrinsic limitation of the three-airfield system; rather it demonstrates the flexibility of the system to handle the increasing demand in spite of incremental variations in airfield system configuration.
A review of the relative cost of seasonal airfield construction indicates a potential savings in this area of as much as 38% by moving to a SAC. How-ever, no noticeable savings have been realized in the near term with the transition from three airfields to two. Furthermore, cost savings in one area, such as airfield construction, could be offset by increases in another area, such as increased shuttle service costs from increased fuel and maintenance by increasing the transit distance.
As part of this study, a conceptual design for a SAC is proposed. We rec-ommend that it be established on the Ross Ice Shelf as close to MCM sta-tion as is possible, while still providing a runway sited on the glacial ice to support landing of wheeled aircraft. According to available snow accumu-lation data, this means that the SAC would likely be located at or near the current location of the PEG, as the amount of snow that accumulates on the Ross Ice shelf increases rapidly east of PEG. In the proposed design, two skiways would be constructed in addition to a WI runway; the main skiway would be oriented with the prevailing wind, and the second cross-

ERDC/CRREL TR-13-5 83
wind skiway would be aligned with the storm winds, and be parallel to the WI runway. This would allow the LC-130s to land on a skiway that is sepa-rate from the WI runway during cross wind conditions, thereby avoiding excessive soot being deposited on the WI runway. The location of the WO landing area is still to be determined.
Much of the existing infrastructure used in current airfield operations can be transferred over to a SAC with minimal modification. This includes air traffic control and runway operations, communications, electric power supply and distribution, food services, PAX terminal, on-site temporary cargo storage, etc. However, there are some specific systems that will need to be revised to provide a viable SAC into the future. These include fuel supply and distribution, potable water supply, and waste (grey and black water) handling. Proof-of-concept systems for all of these are being tested at the PEG to determine the best solution to carry forward for a SAC.
Another critical part of creating a SAC is providing contingency plans for adverse and warm weather. In the case of adverse weather, it is possible that airfield crew and PAX could be stranded at the remote airfield for 2–3 days. Plans for this weather-in-place scenario have been developed for the PEG and were implemented during the 2010–11 season. These may be suitable for transfer over to SAC operations with limited modification.
In the event of an extended period of warm weather, it may be difficult to access a remote airfield over deteriorated snow roads or operations on the WI runway may need to be suspended for 1–3 weeks because of tempera-ture-induced weakening of the runway surface. Contingency plans for temporarily suspending airfield operations for a portion of the season need to be developed to accommodate potential warm weather effects.
The experience gained up to this point shows that a SAC is feasible and can likely be provided for the same cost or less than existing operations. How-ever, more detailed design in the areas of 1) runway location and configu-ration, 2) fuel delivery, 3) potable water supply, 4) waste handling, and 5) updating of contingency plans for adverse and warm weather need to be provided. These will be addressed in the follow on Phase II effort McMur-do Consolidated Airfield Design Guidance.

ERDC/CRREL TR-13-5 84
References Air Force, US 2002. Design, construction, maintenance and evaluation of the Pegasus
glacial ice runway for heavy wheeled aircraft operations. Engineer Technical Letter (ETL) 02-16, October.
Air Force, US 2007. Design, construction, maintenance and evaluation of the McMurdo Sound (Antarctica) sea ice runway for heavy wheeled aircraft operations. Engineer Technical Letter (ETL) 07-12, September.
Ashton, G. D. 1984. Deterioration of floating ice covers. Proc. 3rd Intl. Offshore Mechanics and Arctic Engineering Symposium, New Orleans 3: 26−33.
Blaisdell, G. L., R. M. Lang, G. Crist, K. Kurtti, J. Harbin and D. Flora. 1998. Construction, maintenance and operation of a glacial runway, McMurdo Station, Antarctica. Monograph 98-1. Hanover, NH: US Army Cold Regions Research and Engineering Laboratory.
Blaisdell, G. L. 2008. McMurdo Station operations. Presented at Antarctic Support Contract Pre-Solicitation Conference, 26−28 August.
Blaisdell, G. L. 2009. Concept for single airfield for McMurdo area. Presented at the Single Airfield Complex, Phase I Kick-off meeting, 27 May 2009. Arlington, VA: National Science Foundation.
Blaisdell, G. L. 2010. Transportation and mobility improvements in the US Antarctic Program. COMNAP 2010 14th Symposium and Workshop, Buenos Aires, Argentina, 9−12 August.
Bonin, J. H and E. O. Teichmann. 1949. Investigation of solar energy for ice melting. Armour Research Foundation, Technology Center, Final Report Project No. 90-688 D.
DeConno, J., M. Doll, C. Souza. 2010. 109AW and Support Forces Antarctica. Presented at SRT/SAC Workshop 4-5 May 2010. Hanover, NH: CRREL.
Haehnel, R. B., C. H. Clark, and S. Taylor. 1996. Dusting river ice with leaf mulch to aid in ice deterioration. Hanover, NH: US Army Cold Regions Research and Engineering Laboratory. CRREL Special Report 96-7.
Haehnel, R. B., L. J. Zabilansky, and C. H. Clark. 1999a. Evaluation of the use of dusting for prevention of ice jams in Minnesota. CON128, prepared for Minnesota Department of Public Safety, June.
Haehnel, R. B., L. J. Zabilansky, and C. H. Clark. 1999b. Evaluation of the use of dusting for prevention of ice jams in North Dakota. CON133, prepared for North Dakota Army National Guard, September.
Klokov, V. and D. Diemand (1995) Glaciology of the McMurdo Ice Shelf in the area of air operations. Contributions to Antarctic Research IV, Antarctic Research Series 67 175-195.

ERDC/CRREL TR-13-5 85
Knuth, M. A., and S. A. Shoop. 2010. Vehicle tracking on snow roads, McMurdo Station, Antarctica. Proceedings of the 9th Asia-Pacific ISTVS Conference, Sapporo, Japan, September 27−30.
Prowse, T. D., N. M. Demuth, and H. A. M. Chew. 1990. Changes in the flexural strength of ice under radiation decay. Nordic Hydrology 21: 341−54.
RPSC. 2008. RPSC Logistics: A summary of passengers and cargo in Antarctica 2007-2008. Denver, CO: Raytheon Polar Services Company.
RPSC. 2009. RPSC Logistics: A summary of passengers and cargo in Antarctica 2008-2009. Denver, CO: Raytheon Polar Services Company.
RPSC. 2010. RPSC Logistics: A summary of passengers and cargo in Antarctica 2009-2010. Denver, CO: Raytheon Polar Services Company.
RPSC. 2009−2010. McMurdo station weekly situation reports for week #1–21 (week ending 10-04-09 thru 02-21-10). Denver, CO: Raytheon Polar Services Company.
Seman, P. 2009. McMurdo transportation system study: Phase I report. Prepared for the National Science Foundation, USAP, by the US Army Engineer Research and Development Center, Cold Regions Research and Engineering Laboratory.
Spetsov, F. A. 1965. Weakening of ice in the spring season by darkening the surface. In Trudy Koordinatsionnykh Soveshchaniy po Godrotrkhnine (Transactions of the Coordinating Conference of Hydraulic Engineers) 17: 212−218.
Weatherly, J. W., and J. Helble. 2010. Projections for future air temperatures and melt season duration for McMurdo Station and Pegasus Runway. Letter Report. US Army Engineer Research and Development Center, Cold Regions Research and Engineering Laboratory, 8 March.
Williams, G. P. 1967. Ice dusting experiments to increase the rate of melting of ice. Ottawa, Canada: National Research Council. Technical Paper No. 239, January.

ERDC/CRREL TR-13-5 86
Appendix A: Data, Three-Airfield Operation
Figure A-1. Location of the sea ice runway over time.
'
i '
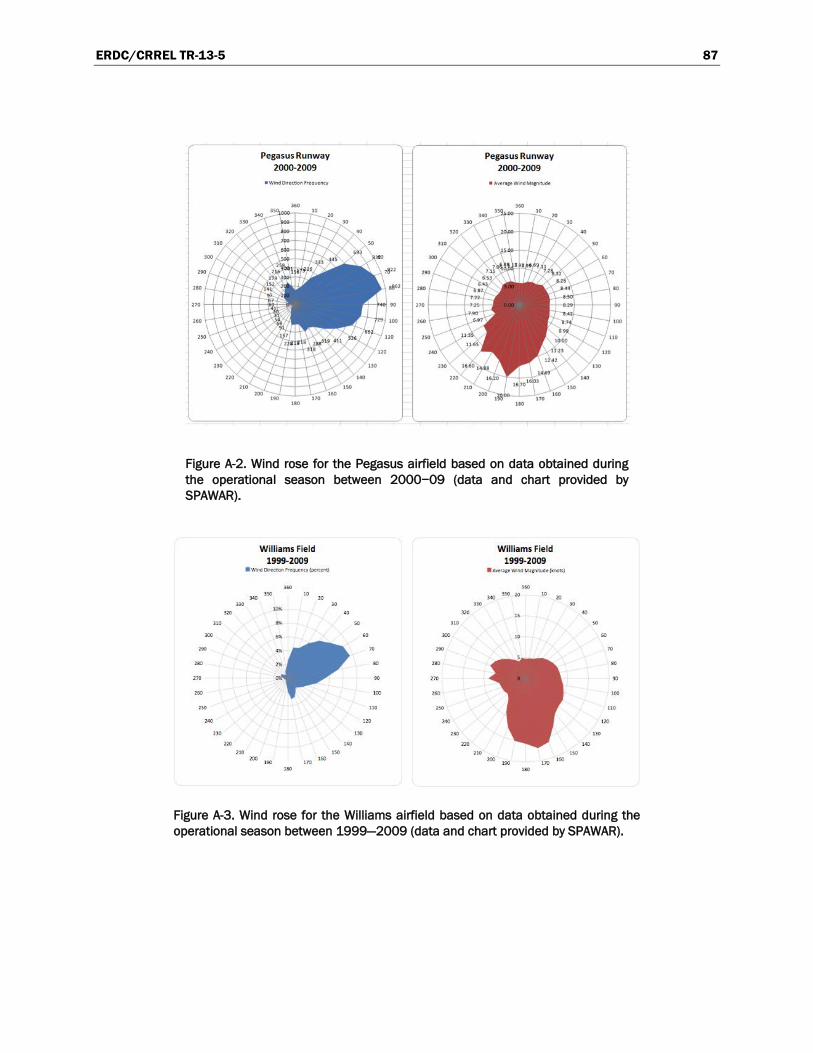
ERDC/CRREL TR-13-5 87
Figure A-2. Wind rose for the Pegasus airfield based on data obtained during the operational season between 2000−09 (data and chart provided by SPAWAR).
Figure A-3. Wind rose for the Williams airfield based on data obtained during the operational season between 1999—2009 (data and chart provided by SPAWAR).

ERD
C/CR
REL TR
-13-5 88
Appendix B: Data, Tw
o-Airfield Operations
Figure B-1. Layout of Pegasus Airfield, Sum
mer 2009—
10.
...., I I I ~\11!.'6~b1umors~ 1
Ot«<RUI''4'A\' 11"51'il?.II?"S 16tt .. ~~.7o/"l:c
C· I?P.MtKJNG
Alltl" . • __ ONCE I>Ot"N"T UNWAY ..... ~~.89" E
PEGASUS COMPACTED SNOW RUNWAY
220FT X lOOOOFT
2
l~kl1NWAY ??"SII"40.2!1""S 1M'"J2'fiSIII'" Io
kOAD TO '4'1LUAMS FIELD I ,._/t.IUROO
~ / c . tJI)AlkCJv.fTI'AkKJNG A~l:lf.1J~Lf'l'ffi
fLAGGt:;O AC'C"ESS FOR TRACKED .- Jl.ESCl.IE VEJJICLES TO MJIH'OJ)IT
.--- OfSKIWAY
I«..A(k SKI Ill' A\' U)(;h M.oUlKUL'I
AT .!:OOOFJ.O)ILY
SKllll' A Y Cl £ARZOI'IE JOOrl'. FROM CENTEJtLINI!.
PEGASUS SKIWAY
ICJO.<.OOSKIWAY 71"'_,1".1-2.17"$ 166~-ttNs 44" E. (i-
WI DISTANCE RfMAI'III'(i MARKF.RS
_ _ 22orr x 1 oooon 1 I --- --r
~~---- -- --_-- - ·:_ :!\~····· .. ... i
AIKFll L.i) RU"Fllnl(f i'QINT ...... ...... '
~l<J:;~; ..... 'J
RED MIIH'ONT MAJI.K.ERS
~~Dil7(~_t{S~If:~p t NIJs =-A~Rb'M'1~~~fuM. QfSkiiiiA\
\~ BLACKRUI'IWAYEOOEMARKfJ.S \ ~ W f DlSTA!IIC'£R.I!.MAI"lNGM.o\RJ<(R:S
3
AT tOOOF"T. lNltRVAI.!i
~fDTIIk.::SIIOt.D MAkKf:.k..'l
~ OOTH o"<oS<JnU'WAY
~ I '\ I \'0\ .,. BLACK LEAIHN MARKERS
EXTEND TO IOOOOtT
I ~ONOOTll ENDSOF RUNWAY ANDSKIWA\'
I I
>
4 5
PEGASUS SINGLE AIRFIELD
- loi.W I"'""
* 6 7 8
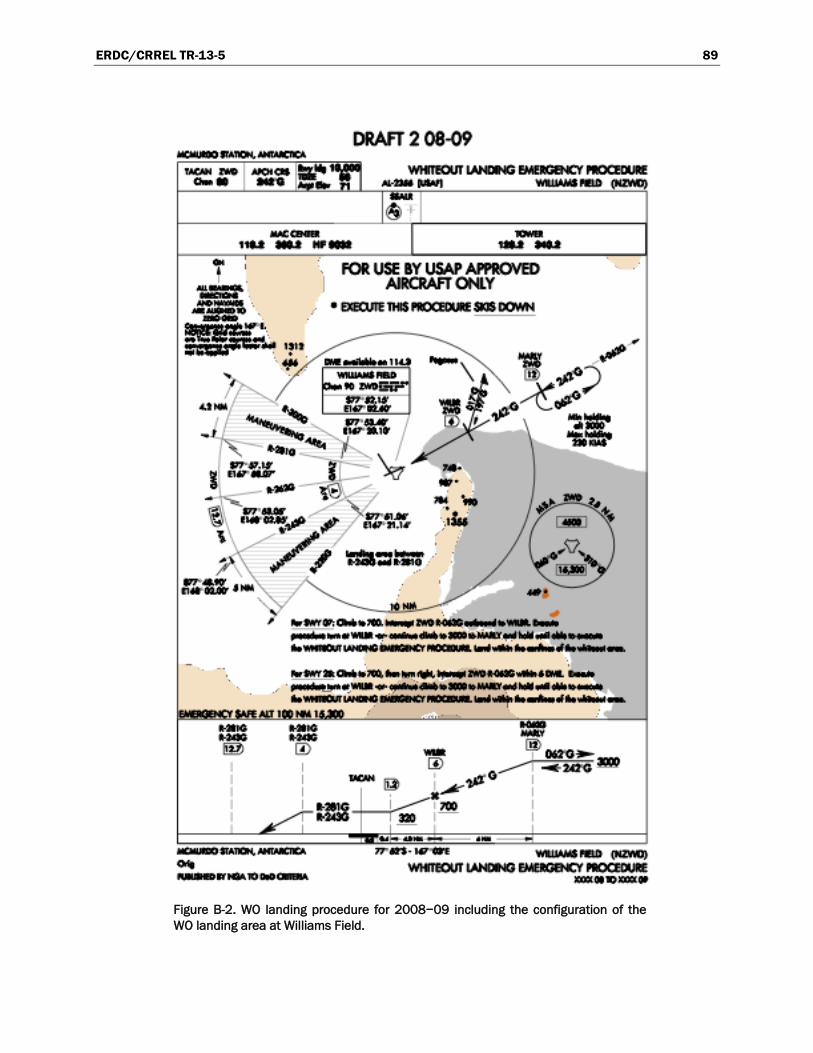
ERDC/CRREL TR-13-5 89
Figure B-2. WO landing procedure for 2008−09 including the configuration of the WO landing area at Williams Field.
-... -'""' .... ·-T , rat~~
/ •lllalilll! 1HB!IIII:O!I\IIIII-IIOWN
-

ERDC/CRREL TR-13-5 90
Appendix C: Summary of 27 May 2009 McMurdo Airfield Stake Holders Meeting
A Single Airfield Complex, Phase I Kick-off meeting was held on 27 May 2009 at the National Science Foundation in Arlington, VA, where all of the major stakeholders were present either in person or by telecom to discuss the concept and concerns related to implementing a SAC at MCM. This meeting was hosted by the Office of Polar Programs (OPP) and led by the US Army Engineer Research and Development Center’s Cold Regions Re-search and Engineering Laboratory (CRREL). Participants included repre-sentatives (participating in person or by phone) from OPP’s Antarctic In-frastructure and Logistics (AIL), CRREL, the current US Antarctic Program (USAP), prime support contractor Raytheon Polar Services Com-pany (RPSC), Space and Naval Warfare Systems Command (SPAWAR), the Air National Guard (ANG), and US Air Force (USAF) among others. A complete list of attendees is provided below.
In preparation for this meeting, a list of seven questions was sent to stake holders (also provided below). Ten responses to this questionnaire were received, though some of the responses were sent by organization and rep-resented the responses of more than one person. Responses were collated and presented at the meeting with the primary discussion revolving around questions, 1, 2 and 7 as presented below.
1. Introductions and Concept overview (Blaisdell). 2. Overview of the performance of traditional three-airfields operations
and reason for the 2008−09 season’s experiment with dual airfield op-erations (Blaisdell).
3. RPSC perspective on two airfield operations: summer 2008−09 (Cardullo). Included reasons for running the two-airfield operation, overview of the operation, discussion of what went right and what went wrong, and a summary of any cost savings realized.
4. USAF and NYANG perspective on two airfield operations: summer 2008−09 (Biggins and Doll). Included summary of major problems encountered during this season as well as positive outcomes seen oper-ating during last season.

ERDC/CRREL TR-13-5 91
5. SPAWAR perspective on two airfield operations: summer 2008−09 (Lehman and Rushing). Included summary of major problems en-countered during this season as well as positive outcomes.
6. Summary of questionnaire responses with discussion (Bjella and Haehnel).
7. Draft field objectives for 2009−10 summer season. What can be learned or tried during the upcoming flight season that will help an-swer questions and concerns regarding the single airfield concept? (Discussion led by Bjella and Haehnel.)
Attendence list
• Biggins, Ian—DoD Liaison, NSF/OPP • Bjella, Kevin—Civil Engineer, CRREL • Blaisdell, George—Operations Manager, NSF/OPP • Brogan, Don—RPSC McMurdo Station Manager, RPSC • Byerly, Dan—FEMC Maintenance Coordinator, RPSC • Cardullo, Gary—USAP Airfields Manager, RPSC • Chuck, Kerry—Senior RPSC Site Representative, RPSC • Colby, Kent—Special Projects Manager, RPSC • Dyer, Michael—Senior RPSC Site Representative, RPSC • Ellis, Tom—Director of Operations, RPSC • German, Col. Tony—109th Wing Commander, ANG • Haehnel, Robert—SAC Project Lead, CRREL • James, Col. Gary—109th Airlift Wing Operations Group Commander,
ANG • Jung, Art—Environmental consultant, AECOM • Karcher, Jim—Safety Officer, NSF/OPP • Knuth, Margaret—Civil Engineer, CRREL • Lehman, Dan—TERPS Manager, SPAWAR • Meyers, John—FEMC Manager, RPSC • Richter-Menge, Jackie—Research Civil Engineer, CRREL • Rushing, Matthew—Systems and Maintenance Team Lead, SPAWAR • Scanniello, Jeff—Survey Supervisor, RPSC • Scheuermann, Mike—Aviation Program Manager, NSF/OPP • Sheppard, Paul—13th AF, Hickam AFB • Turnbull, Bill—Logistics Lead and ATO Manager, RPSC • Vang, Sue—Environmental Policy Specialist, NSF/OPP

ERDC/CRREL TR-13-5 92
Pre-meeting questionnaire
Single Airfield concept (SAC) Pre-meeting questions (email or Fax re-sponses to [email protected] Fax: 603-646-4477).
1. From your perspective, and within your area of responsibility, what is the single most important problem that would need to be over-come to implement single airfield operations at McMurdo (MCM) with the Pegasus site being the location for the single airfield system? I.e. unless this issue could be resolved we cannot go to single airfield oper-ations.
2. What other issues do you see—either within your area of responsibility
or in general—as high priority that need to be addressed?
3. What opportunities can we take advantage if we were to migrate to a
new airfield “design?” I.e. what legacy procedures, etc. may not be needed or what new concepts could be adopted?
4. What advantages could be gained by moving to a semi-permanent facil-
ity?
5. What aspects of the current airfield system cannot be lost as we transi-
tion to single airfield operations?
6. What alternatives (e.g. Navaid technology, new runway surface, loca-
tion, etc.) should be investigated as part of the design space as we con-sider a single airfield concept?

ERDC/CRREL TR-13-5 93
7. Are there any aspects of the USAP in that you might see on the horizon
that could or would impact a single airfield design?
8. Are there other stakeholders that should be involved in the planning of
the single airfield concept that is not on this list?

ERDC/CRREL TR-13-5 94
Appendix D: Correlation of Airfield Air Temperature Data with the McMurdo Station Data
The temperature records at the airfields are generally discontinuous be-cause weather data are logged at these locations only while the airfields are operating. To fill in these gaps in data, we explored the utility of using the temperature records measured at McMurdo Station to provide insight into the trends in air temperature at the airfields during the periods that this information was not recorded there. To do this, we looked at the correla-tion between the temperatures measured at McMurdo and that measured at each of the airfields (SIR, WF, and PEG) at the same time.
Figures D-1 through D-3 show the degree to which the temperature meas-ured at each of the airfields agrees with the measured data at McMurdo. The blue dashed line in each plot indicates where the data should plot if there is one to one correspondence between the two locations. The black line indicates the lease squares fit through the acquired data. In each plot there is a clear offset between the 1:1 correlation line and the actual data. This offset varies between airfields and was determined from the y-intercept of the curve fit through the data (black line). These temperature offsets are tabulated in Table D-1.
Table D-1. Summary of the temperature offsets determined from comparing air temperature data measured at McMurdo Station and the airfields near McMurdo.
Airfield Temperature offset (°C) Coefficient of determination,
R2
Sea Ice Runway −2.28 ± 0.12 0.839
Williams Field −3.32 ± 0.10 0.650
Pegasus Airfield −3.13 ± 0.14 0.847

ERDC/CRREL TR-13-5 95
Figure D-1. Comparison of air temperature measured at McMurdo station to the air temperature measured at the Sea Ice Runway. The black line shows the temperature offset between the two locations as determined by least squares fit. The offset is −2.28°C.

ERDC/CRREL TR-13-5 96
Figure D-2. Comparison of air temperature measured at McMurdo station to the air temperature measured at the Williams Field. The black line shows the temperature offset between the two locations as determined by least squares fit. The offset is −3.32°C.

ERDC/CRREL TR-13-5 97
Figure D-3. Comparison of air temperature measured at McMurdo station to the air temperature measured at the Pegasus Runway. The black line shows the temperature offset between the two locations as determined by least squares fit. The offset is −3.13°C.

ERDC/CRREL TR-13-5 98
Appendix E: Pegasus Condition Procedures for 2010−11 Season

ERDC/CRREL TR-13-5 99

ERDC/CRREL TR-13-5 100

ERDC/CRREL TR-13-5 101
ERDC/CRREL TR-13-5 102
Appendix F: Warm weather procedures for Pegasus Airfield*
* These procedures are extracted from e-mail communication with Gary Cardullo, RPSC, 20 December
2010.

ERDC/CRREL TR-13-5 103
* C-17 approved for ERO operations, all other aircraft must shutdown upon arrival in parking. * Aircrews shall take all practical measures to minimize exhaust/soot damage to airfield surfaces to include minimizing taxi times, shutdown of "synunetrical engines on arrival, taxi with flaps up, etc. * Checklist items will not be skipped. * Do not sit stationary on nmway/skiway/taxiways - Aircraft will cause severe damage to the mnway/skiway surface. * Do not enter the nmway/skiway area until ready for immediate departure. * Keep flaps up wltil departure to the maximum extent possible on Pegasus Field Skiways and Pegasus White Ice Runway. * Minimize grotmd time of aircraft when remaining overnight on the compacted surface. * LC-130 aircraft should minimize engine f\UIS in aircraft parking spots to prevent soot and exha\l~t damage to surface. * LC-130 and other ski-equipped aircraft must enter the snow taxiway on the east side (Grid West) of Pegasus White Ice Runway on ski's only to taxi to the Pegasus Field Skiway and ramp 3. Check with SOF if you have ques tions. * LC-130 or other ski-equipped aircraft diverts shall use the snow taxiway located on the eastside (Grid West) to transition from Pegasus White Ice Rwnvay to the LC-130 parking area Ramp 3. Do not park on Rau1p I (Grid West). * Air Traffic Control Tower is located approach end skiway 26 for all flight operations. * 109 AS SOF shall notify fir e house on all possible or actual weather or em ergency diver t air craft ASAP
* REFER TO NZCM NOT AM FOR INFORMATION REGARDING TRANSPORTATION OF SPECIFIC HAZARDOUS MATERIALS DUE TO ELECTROMAGNETIC RADIATION HAZARD.
Operator r.l.:mte Date Time
0 Hew Cons-truction
0 Gener.~;l
M<~ inten..nee c P003t Storm
Mo:~ intenancE-0
Ru:nw<~v N<lmi>
l cc.ation on Runway
Prim• Movtr
T~d: ' Weight C<lr1 " Tire RoOH " " Tn RoiiH " Sno., Pl<~;ne "
Othe<
Dr<~g Gruder
&O~t Sinkage, depth on blt1de. or othEr observutlons
Nuruber of Pu ses Othtr lnfo:
Air Temp Sno., Surf:tei> Terne (t2Q: 5cm}
Stref'l{lth Den~ity
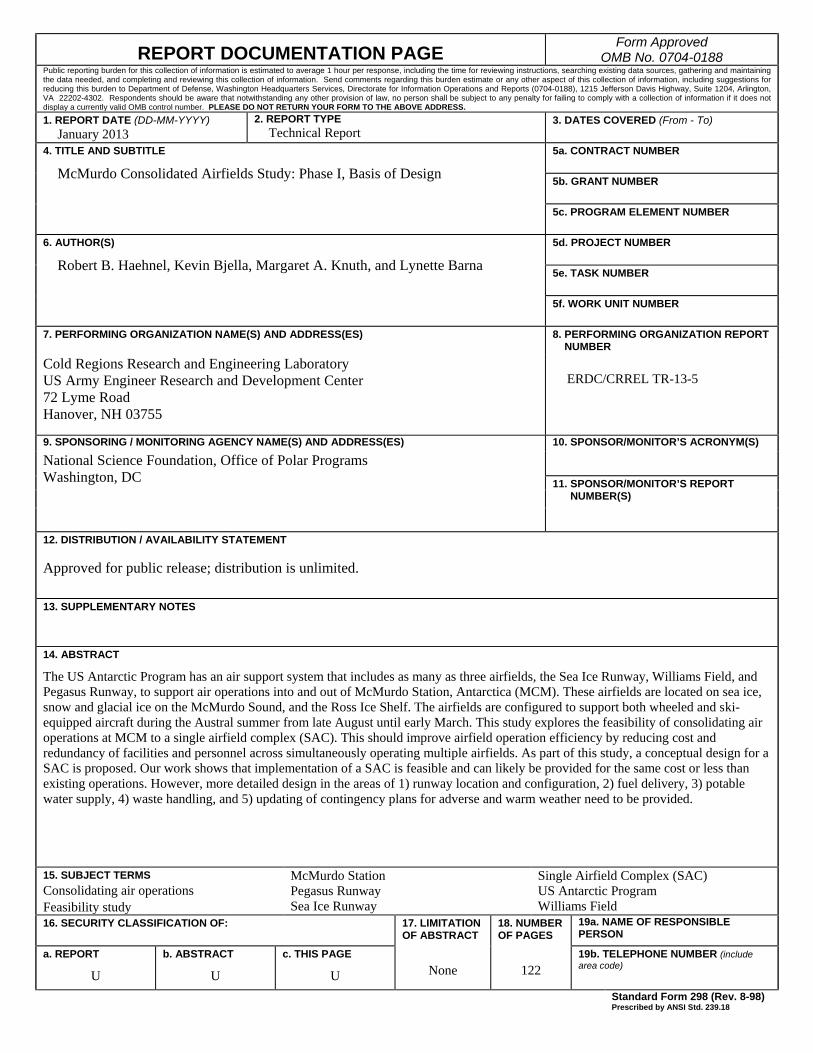
REPORT DOCUMENTATION PAGE Form Approved
OMB No. 0704-0188 Public reporting burden for this collection of information is estimated to average 1 hour per response, including the time for reviewing instructions, searching existing data sources, gathering and maintaining the data needed, and completing and reviewing this collection of information. Send comments regarding this burden estimate or any other aspect of this collection of information, including suggestions for reducing this burden to Department of Defense, Washington Headquarters Services, Directorate for Information Operations and Reports (0704-0188), 1215 Jefferson Davis Highway, Suite 1204, Arlington, VA 22202-4302. Respondents should be aware that notwithstanding any other provision of law, no person shall be subject to any penalty for failing to comply with a collection of information if it does not display a currently valid OMB control number. PLEASE DO NOT RETURN YOUR FORM TO THE ABOVE ADDRESS.
1. REPORT DATE (DD-MM-YYYY) January 2013
2. REPORT TYPE Technical Report
3. DATES COVERED (From - To)
4. TITLE AND SUBTITLE
McMurdo Consolidated Airfields Study: Phase I, Basis of Design
5a. CONTRACT NUMBER
5b. GRANT NUMBER
5c. PROGRAM ELEMENT NUMBER
6. AUTHOR(S)
Robert B. Haehnel, Kevin Bjella, Margaret A. Knuth, and Lynette Barna
5d. PROJECT NUMBER
5e. TASK NUMBER
5f. WORK UNIT NUMBER
7. PERFORMING ORGANIZATION NAME(S) AND ADDRESS(ES) 8. PERFORMING ORGANIZATION REPORT NUMBER
Cold Regions Research and Engineering Laboratory US Army Engineer Research and Development Center 72 Lyme Road Hanover, NH 03755
ERDC/CRREL TR-13-5
9. SPONSORING / MONITORING AGENCY NAME(S) AND ADDRESS(ES) 10. SPONSOR/MONITOR’S ACRONYM(S)
National Science Foundation, Office of Polar Programs Washington, DC
11. SPONSOR/MONITOR’S REPORT NUMBER(S)
12. DISTRIBUTION / AVAILABILITY STATEMENT Approved for public release; distribution is unlimited.
13. SUPPLEMENTARY NOTES
14. ABSTRACT
The US Antarctic Program has an air support system that includes as many as three airfields, the Sea Ice Runway, Williams Field, and Pegasus Runway, to support air operations into and out of McMurdo Station, Antarctica (MCM). These airfields are located on sea ice, snow and glacial ice on the McMurdo Sound, and the Ross Ice Shelf. The airfields are configured to support both wheeled and ski-equipped aircraft during the Austral summer from late August until early March. This study explores the feasibility of consolidating air operations at MCM to a single airfield complex (SAC). This should improve airfield operation efficiency by reducing cost and redundancy of facilities and personnel across simultaneously operating multiple airfields. As part of this study, a conceptual design for a SAC is proposed. Our work shows that implementation of a SAC is feasible and can likely be provided for the same cost or less than existing operations. However, more detailed design in the areas of 1) runway location and configuration, 2) fuel delivery, 3) potable water supply, 4) waste handling, and 5) updating of contingency plans for adverse and warm weather need to be provided.
15. SUBJECT TERMS Consolidating air operations Feasibility study
McMurdo Station Pegasus Runway Sea Ice Runway
Single Airfield Complex (SAC) US Antarctic Program Williams Field
16. SECURITY CLASSIFICATION OF: 17. LIMITATION OF ABSTRACT
18. NUMBER OF PAGES
19a. NAME OF RESPONSIBLE PERSON
a. REPORT
U
b. ABSTRACT
U
c. THIS PAGE
U None 122 19b. TELEPHONE NUMBER (include area code)
Standard Form 298 (Rev. 8-98) Prescribed by ANSI Std. 239.18