U.S. Alcohol and Drug Crash Risk Study
40
U.S. Alcohol and Drug Crash Risk Study Maryland Highway Safety Summit February 25, 2014 Virginia Beach Police Department Sgt. Scott Wichtendahl Pacific Institute for Research and Evaluation John Lacey
Transcript of U.S. Alcohol and Drug Crash Risk Study

U.S. Alcohol and Drug Crash
Risk Study Maryland Highway Safety Summit
February 25, 2014
Virginia Beach Police Department
Sgt. Scott Wichtendahl
Pacific Institute for Research and Evaluation
John Lacey

Sponsors
NHTSA
NIAAA
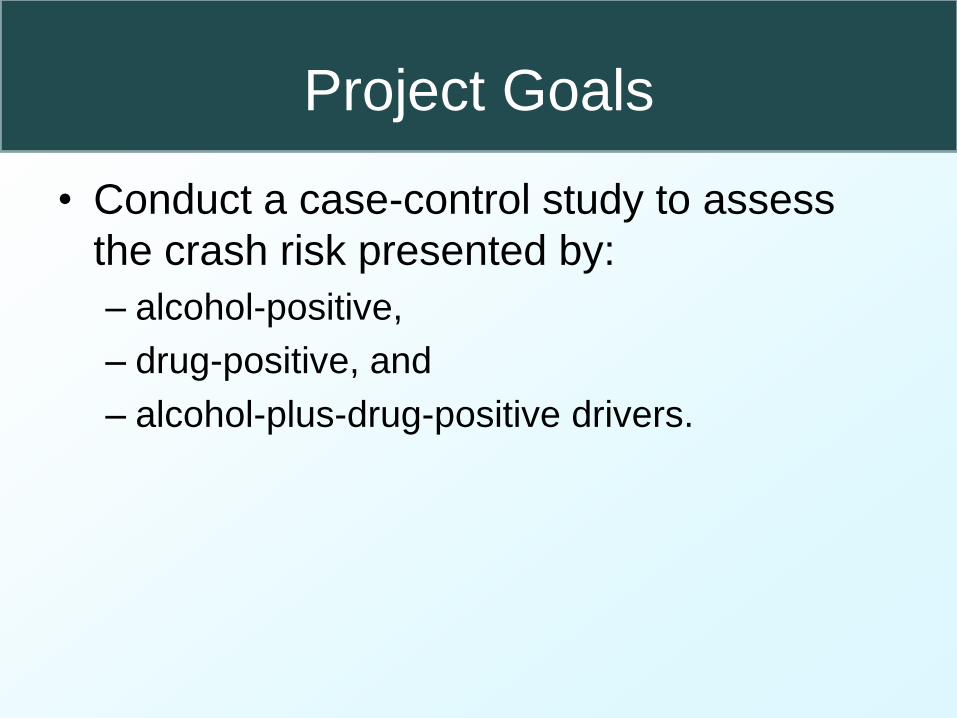
Project Goals
• Conduct a case-control study to assess
the crash risk presented by:
– alcohol-positive,
– drug-positive, and
– alcohol-plus-drug-positive drivers.
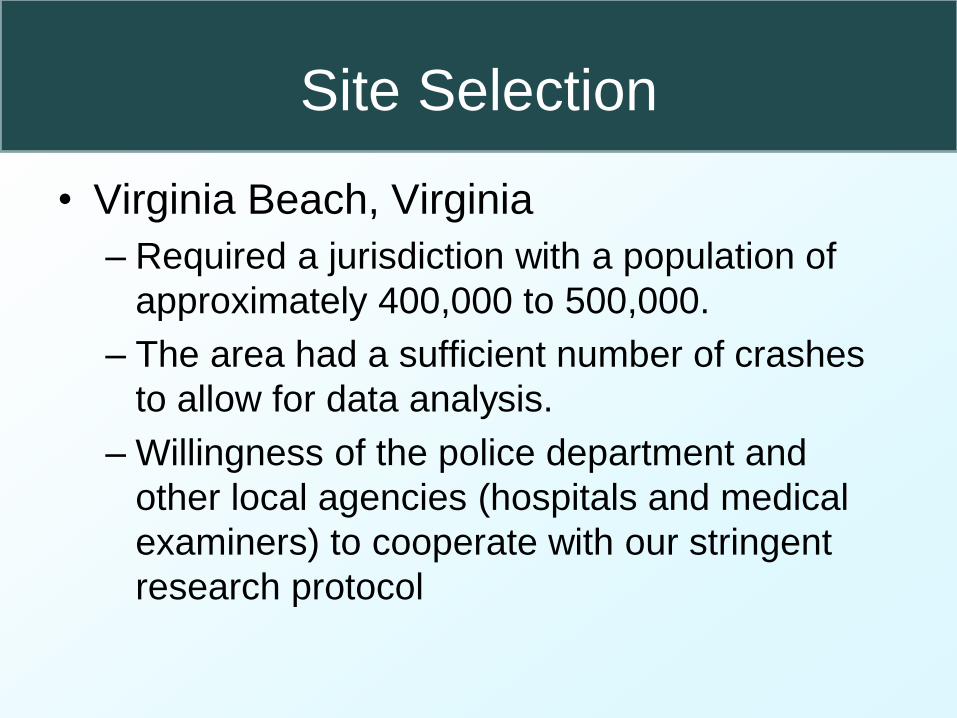
Site Selection
• Virginia Beach, Virginia
– Required a jurisdiction with a population of
approximately 400,000 to 500,000.
– The area had a sufficient number of crashes
to allow for data analysis.
– Willingness of the police department and
other local agencies (hospitals and medical
examiners) to cooperate with our stringent
research protocol
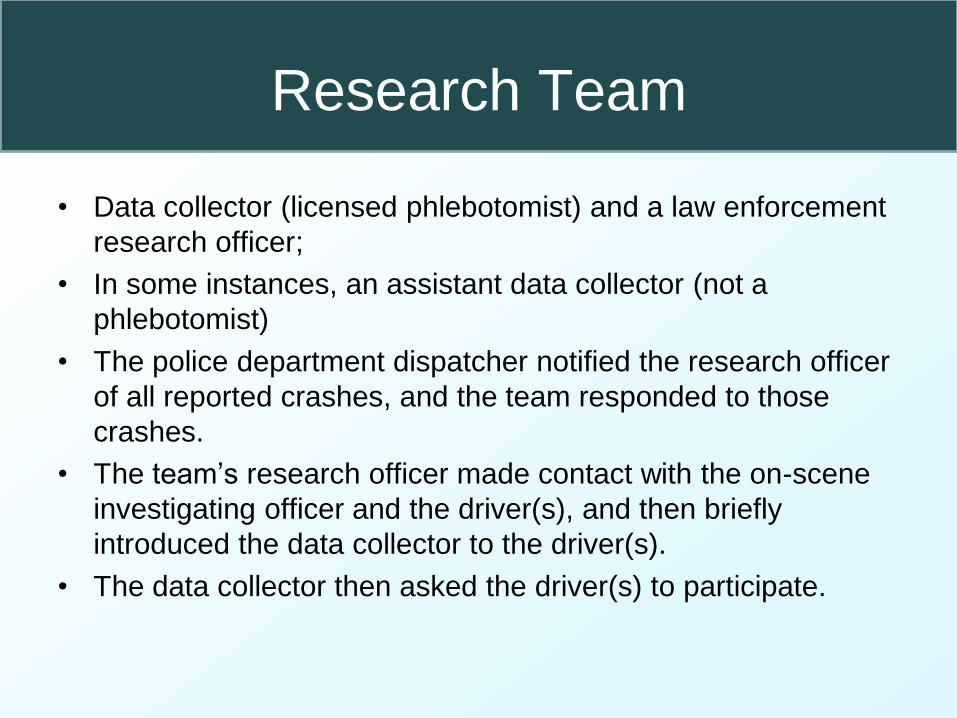
Research Team
• Data collector (licensed phlebotomist) and a law enforcement
research officer;
• In some instances, an assistant data collector (not a
phlebotomist)
• The police department dispatcher notified the research officer
of all reported crashes, and the team responded to those
crashes.
• The team’s research officer made contact with the on-scene
investigating officer and the driver(s), and then briefly
introduced the data collector to the driver(s).
• The data collector then asked the driver(s) to participate.
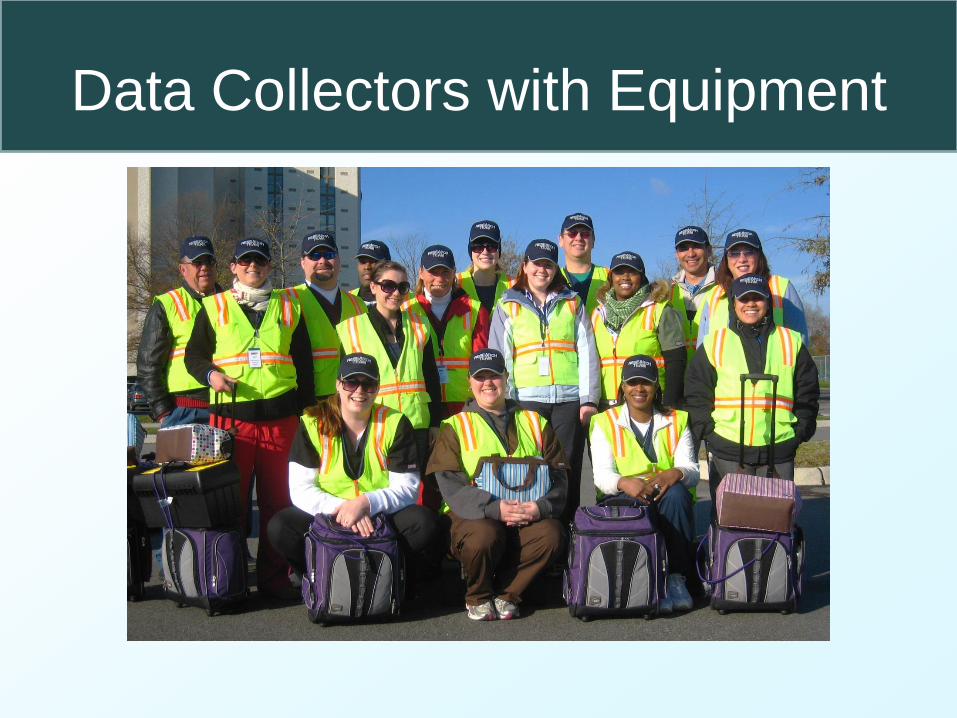
Data Collectors with Equipment

Research Officer
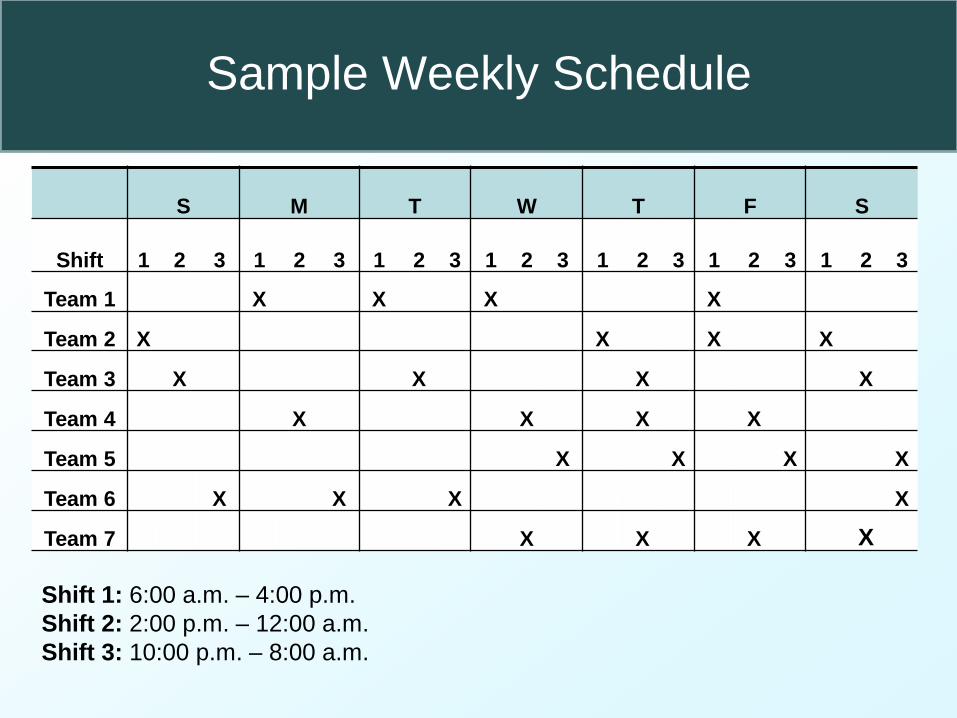
Sample Weekly Schedule
S M T W T F S
Shift 1 2 3 1 2 3 1 2 3 1 2 3 1 2 3 1 2 3 1 2 3
Team 1 X X X X
Team 2 X X X X
Team 3 X X X X
Team 4 X X X X
Team 5 X X X X
Team 6 X X X X
Team 7 X X X X
Shift 1: 6:00 a.m. – 4:00 p.m.
Shift 2: 2:00 p.m. – 12:00 a.m.
Shift 3: 10:00 p.m. – 8:00 a.m.

Example of a Single-Vehicle Crash
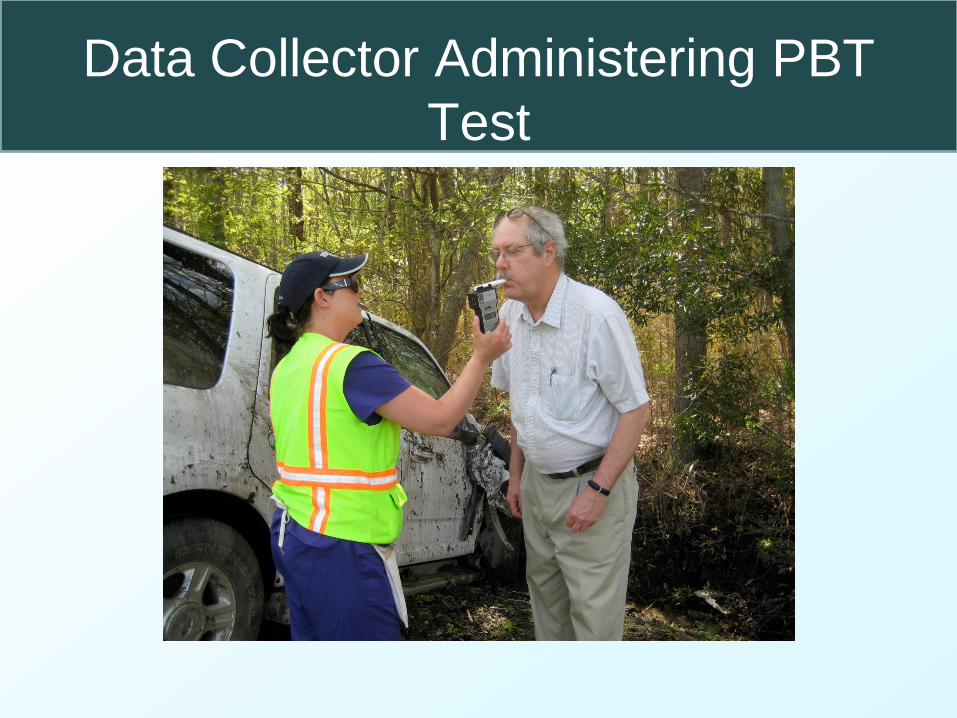
Data Collector Administering PBT
Test

Basic Data Collection Procedure
• Observational data:
– While the officer was speaking to the driver(s), the data collector
recorded observable information about the driver and vehicle
• type of vehicle, number of passengers, seat belt usage, gender of
driver, and likely age range of driver
• First PAS reading:
– If the driver agreed to speak to the data collector, the data
collector obtained an initial passive alcohol sensor (PAS) reading
• Consent for interview:
– Data collector explained the purpose of the interview and that it
was voluntary and confidential.
– Obtained verbal consent for continuing with the interview.
– If driver declined, counted as a refusal but the data collector
asked for a breath sample.

Data Collector Taking Initial
Observational Notes

• Financial incentives:
– Data collector offered incentives for oral and blood sample,
and for completing an Alcohol Use Disorder (AUD) and
Drug Use Disorder screening instrument.
• Survey interview questions:
– Survey included questions regarding general drinking
behavior and driving patterns.
• Second PAS reading:
– Data collector obtained a second PAS reading.
Basic Data Collection Procedure (continued)

Data Collector Taking PAS Reading
Basic Data Collection Procedure (continued)
• Breath test:
– Intoxilyzer PA-400TM, a handheld preliminary breath test
(PBT) device manufactured by CMI, Inc.
– PBT did not display result, stored the result in memory.
• Oral fluid test:
– The Quantisal™ (manufactured by Immunalysis
Corporation) oral fluid collection device was used to obtain
samples.
– Subject placed the oral fluid collection swab in mouth for
approximately 3 to 5 minutes until an indicator changed color
indicating approximately 1 mL of saliva had been collected.

Data Collector Administering PBT
Test
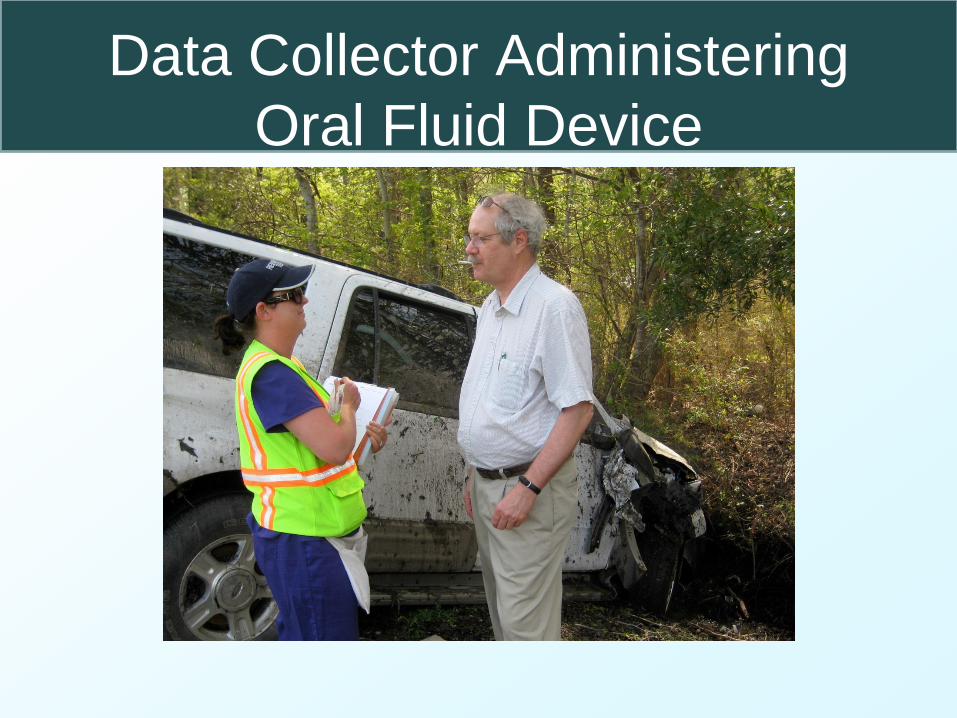
Data Collector Administering
Oral Fluid Device
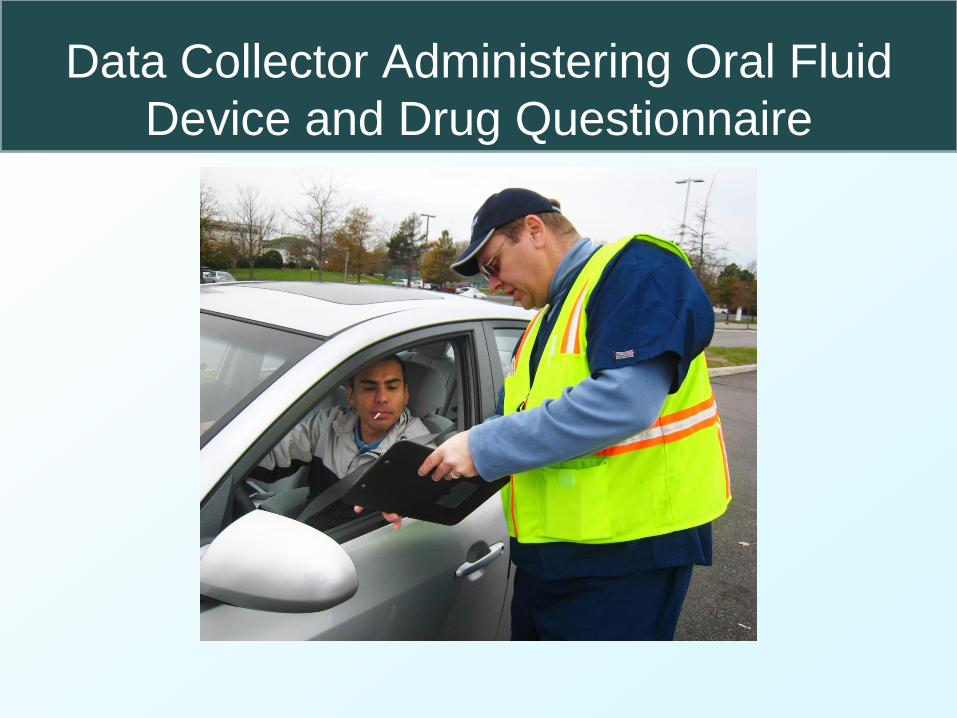
Data Collector Administering Oral Fluid
Device and Drug Questionnaire

Basic Data Collection Procedure (continued)
• AUD and DUD questions: – Self-administered paper-and-pencil AUD screening
instrument and drug use disorder (DUD) completed while the oral fluid swab was in the subject’s mouth.
• Payment: – Subjects were paid $10 for an oral fluid sample and $5 for
completion of the AUD/DUD questionnaire.
• Blood sample: – If the driver consented, the data collector (a certified
phlebotomist) drew blood according to the Occupational Safety and Health Administration (OSHA) standards.
– Subjects were given a $50 money order for the blood sample.
• Completion
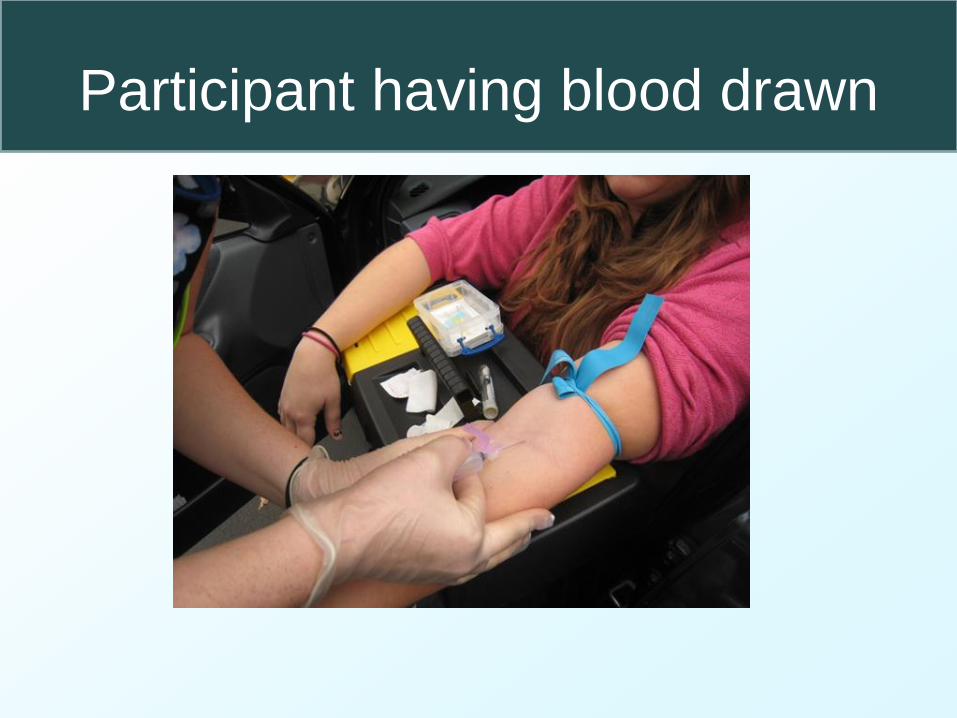
Participant having blood drawn

Basic Data Collection Procedure (continued)
• Impaired driver protocol:
– If driver suspected of being impaired, the data collector
obtained a sample of the driver’s breath using a PBT that
displayed the result.
– If the driver had a BAC of .05 grams per deciliter (g/dL) or
higher, the data collector ensured he or she got home
safely by offering several options.
– These options included, but were not limited to – • calling a taxi,
• calling a sober friend/relative to pick up the driver, and
• calling a tow truck to take the driver and vehicle home.
Drivers Injured, Died, or Hit-and-Run
• To have as complete information on crash risk
as possible, we also wanted data from crash-
involved drivers who were injured or died, and
were transported to the hospital or morgue, or
arrested (for DWI or another offense), or hit-and-
run drivers.
• We developed protocols for data collection in
each of these situations.

Protocol for Injured, Fatal and
Hit-and-Run Drivers • If driver is transported to hospital:
‒ Obtain EMS trip report,
‒ Gather data from subject at the hospital,
‒ If no direct contact with driver, use hospital blood sample,
‒ have an RA conduct follow-up interviews, if necessary.
• If driver fatally injured ‒ Followed up with Medical Examiner to obtain blood
results.
• Attempt to identify hit-and-runs ‒ If found within 3 hours, would attempt to recruit
participation.

Data Collection for Control
Drivers
• Control drivers were randomly selected from – traffic stream one week later,
– at the same time of day,
– at the same location, and
– in the same direction of travel as each crash-involved driver.
• Controls served as comparisons to the crash-involved drivers to be able to examine the risk of being in a crash associated with alcohol or drugs.
• Two control drivers were interviewed for each crash-involved driver.
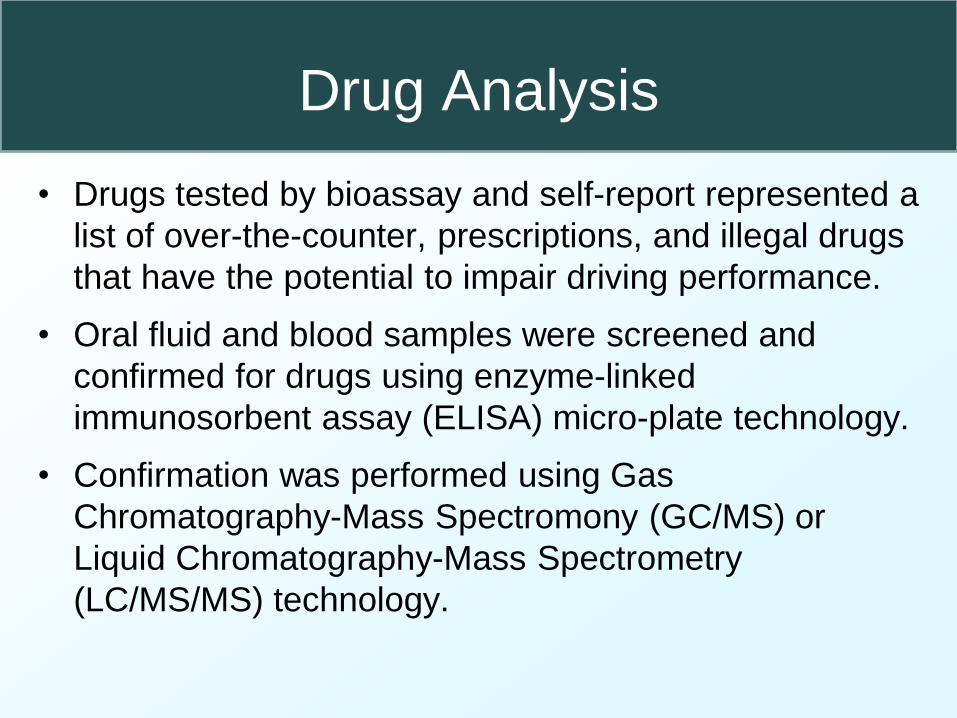
Drug Analysis
• Drugs tested by bioassay and self-report represented a
list of over-the-counter, prescriptions, and illegal drugs
that have the potential to impair driving performance.
• Oral fluid and blood samples were screened and
confirmed for drugs using enzyme-linked
immunosorbent assay (ELISA) micro-plate technology.
• Confirmation was performed using Gas
Chromatography-Mass Spectromony (GC/MS) or
Liquid Chromatography-Mass Spectrometry
(LC/MS/MS) technology.

Drug class
Minimum
concentration
oral fluid (ng/ml)
Minimum
concentration
blood (ng/ml) Self-report item
Screen Confirm Screen Confirm
Cocaine (Cocaine, benzoylecgonine) 20 8 25 10 Cocaine (e.g., crack or coke)
Opiates (6-AM, codeine, morphine, hydrocodone,
hydromorphone) 40 10 25 10
Heroin Morphine or Codeine (e.g.,
Tylenol® with codeine)
Amphetamine/Methamphetamine
(MDMA, MDA, MDEA, Ephedrine,
Pseudoephedrine)
50
50
50
20
20 10
Amphetamine or Methamphetamine (e.g.,
speed, crank, crystal meth)
Cannabinoids (THC, THC-COOH[THCA]) 4 2 10 1 Marijuana (e.g., pot, hash, weed)
Phencyclidine 10 10 10 10 PCP (e.g., angel dust)
Benzodiazepines (oxazepam, nordiazepam,
bromazepam, flurazepam, flunitrazepam, lorazepam,
chlordiazepoxide, temazepam, diazepam,
clonazepam, alprazolam, triazolam, midazolam,
nitrazepam)
20 10 20 10 Benzodiazepines (e.g., Valium® or
tranquilizers)
Barbiturates (Phenobarbital, pentobarb, secobarbital,
butalbital) 50 50 500 500 Barbiturates (e.g., phenobarbital)
Methadone 50 25 50 10 Methadone
Ethyl alcohol .02% .02% .02% .02% Alcohol
Oxycodone (Percocet®) 25 10 25 10
Prescription pain killers (e.g., Percocet®,
OxyContin®, oxycodone, Demerol®,
Darvon®)
Propoxyphene (Darvon®) 10 10 10 10
Tramadol (Ultram®) 50 25 50 10
Carisoprodol (Soma®) 100 50 500 500
Meperidine (Demerol®)
Sertraline (Zoloft®) 50 25 50 10 Anti-depressants (e.g., Prozac®, Zoloft®)
Fluoxetine (Prozac®) 50 25 50 10
Tricyclic antidepressants (amitryptiline, nortriptyline) 25 25 25 10
Zolpidem (Ambien®) 10 10 10 10 Ambien® or other sleep aids
Methylphenidate (Ritalin®) 10 10 10 10 ADHD medications (e.g., Ritalin®,
Adderall®, Concerta®)
Dextromethorphan 50 20 50 20 Cough medicines (e.g., Robitussin®, Vicks
44®, etc.)
Ketamine 10 10 10 10 Ketamine / Special K
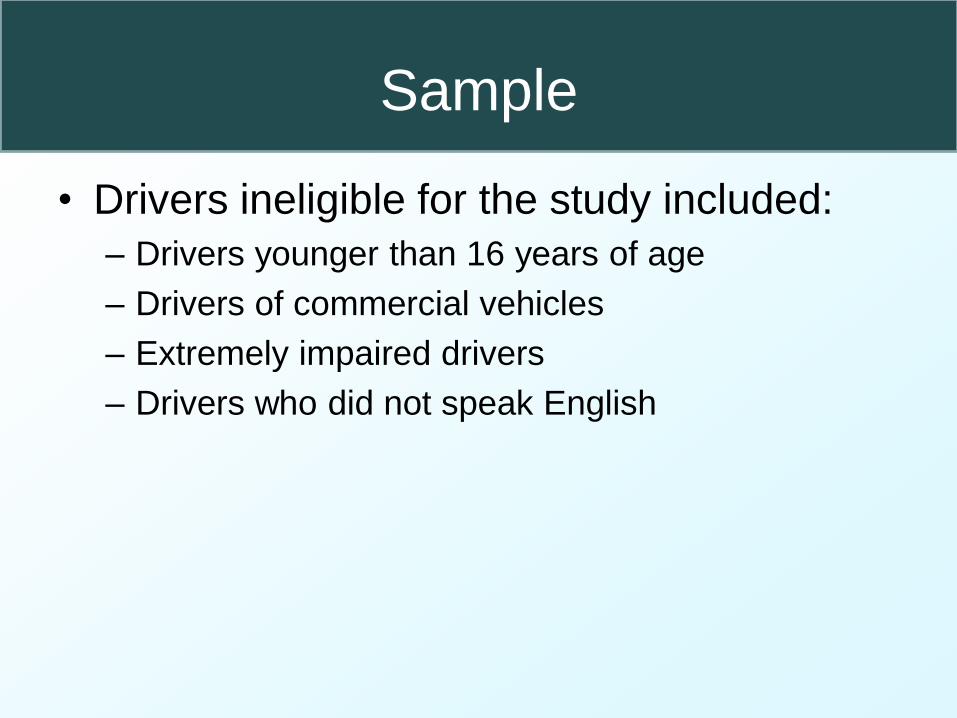
Sample
• Drivers ineligible for the study included:
– Drivers younger than 16 years of age
– Drivers of commercial vehicles
– Extremely impaired drivers
– Drivers who did not speak English
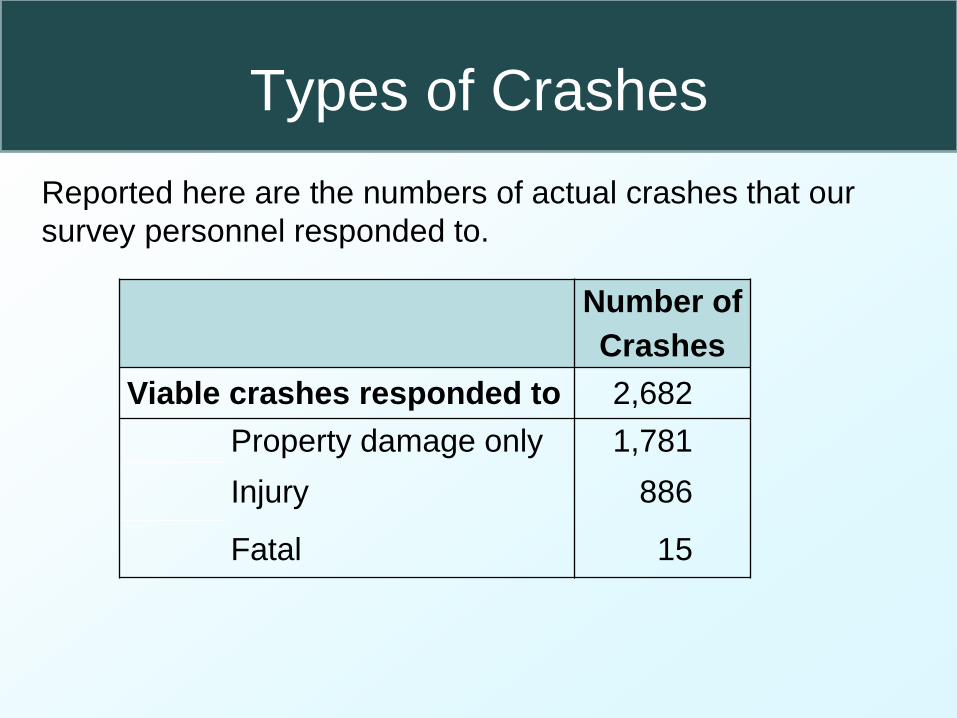
Types of Crashes
Number of
Crashes
Viable crashes responded to 2,682
Property damage only 1,781
Injury 886
Fatal 15
Reported here are the numbers of actual crashes that our
survey personnel responded to.

Results – Viable Drivers
Crash Control
Viable Drivers 5,375 7,415
Eligible Drivers 3,887 7,397
Agreed to Participate 3,682 (94.7%) 7,176 (97.0%)
Breath sample 3,393 (87.3%) 7,079 (95.7%)
Oral Fluid or Blood 3,196 (82.2%) 6,935 (93.8%)

Special Case Drivers
Transported to Hospital 729
Eligible 393
Participated 362 (90.8%)
Drivers Arrested 205
Eligible 120
Participated 109 (90.8%)
Hit and Run Drivers 84
Caught 42
Eligible 27
Participated 24 (88.9%)

Results – Viable Crashes
• 2,682 Usable Crashes
– 33.6% injury or fatality (901)
• Injury 886
• Fatality 15
– 66.4% property damage (1,781)
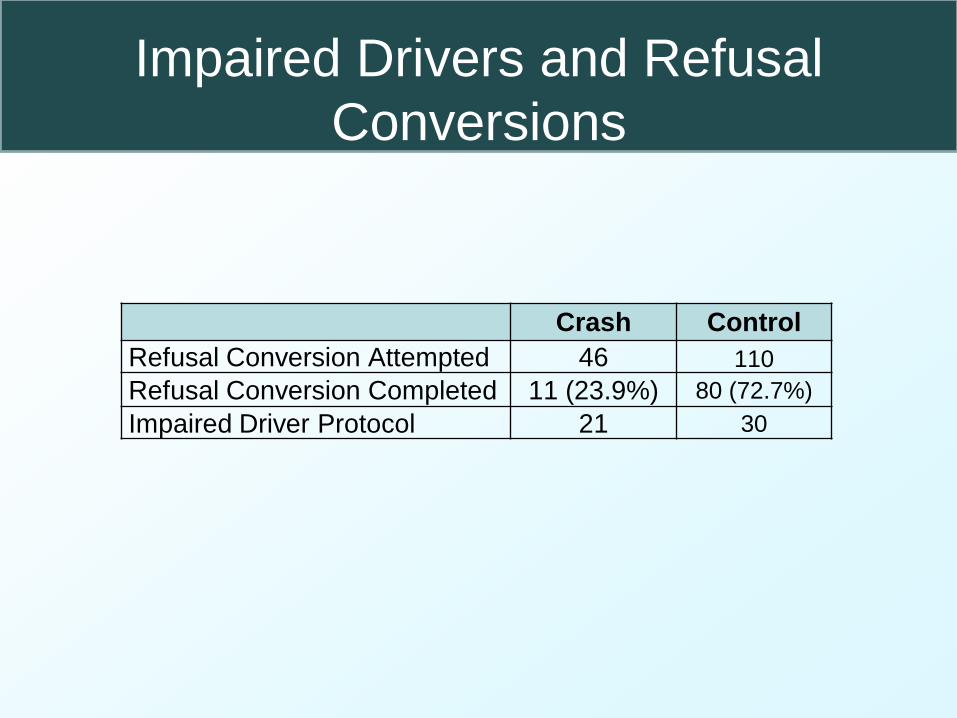
Impaired Drivers and Refusal
Conversions
Crash Control
Refusal Conversion Attempted 46 110
Refusal Conversion Completed 11 (23.9%) 80 (72.7%)
Impaired Driver Protocol 21 30
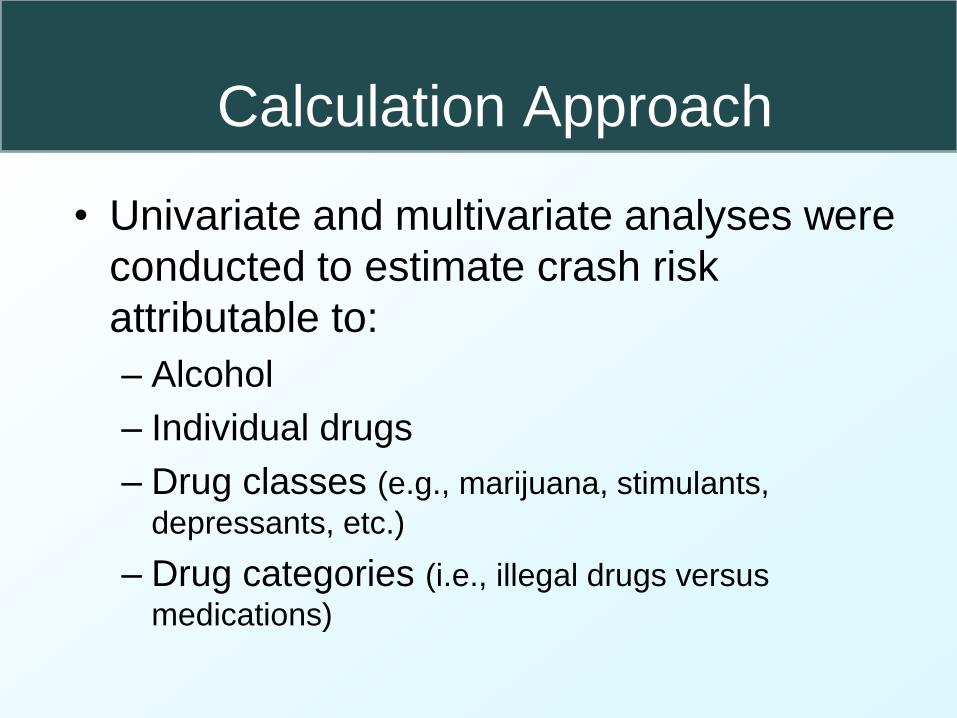
Calculation Approach
• Univariate and multivariate analyses were
conducted to estimate crash risk
attributable to:
– Alcohol
– Individual drugs
– Drug classes (e.g., marijuana, stimulants,
depressants, etc.)
– Drug categories (i.e., illegal drugs versus
medications)
Preliminary Results
Alcohol Crash Risk Results

0
5
10
15
20
25
30
35
40
Re
lative
Ris
k (
Rela
tive to B
AC
= 0
.00)
BAC
All Driver Breath Samples Drug Negative Drivers Blomberg et al
BAC Relative Risk (Adjusted for Age and Gender)

Relationship of Driver BAC to Illegal Drug
Use
BAC
Any Illegal
Drug
OR %
=>.12 4.05 33.3
=>.08<.01
2
3.29 27.4
=>.05<.08 3.27 28.1
>.00<.05 2.96 25.8
=00 ref. 10.5
Voas , R.B., Lacey, J.H., Scherer, M., Jones, K., & Compton, R. (2012, available
online). Drinking drivers and drug use on weekend nights in the United States. Drug
and Alcohol Dependence. doi:http://dx.doi.org/10.1016/j.drugalcdep.2012.11.007

Preliminary Drug Results
• Raw Summary drug prevalence estimates
for cases and controls
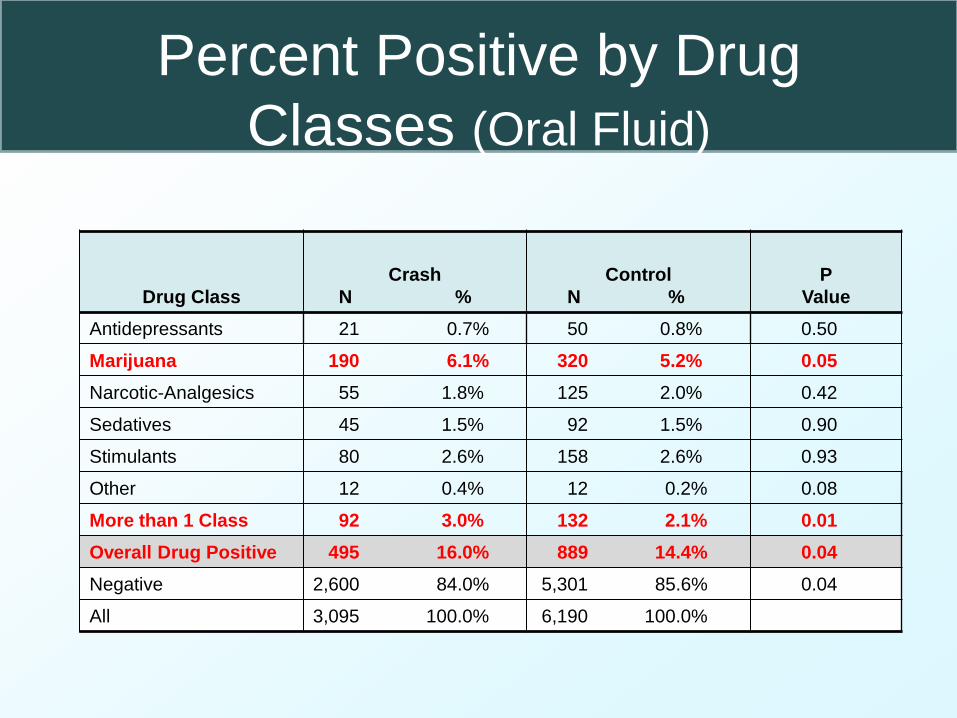
Percent Positive by Drug
Classes (Oral Fluid)
Drug Class
Crash
N %
Control
N %
P
Value
Antidepressants 21 0.7% 50 0.8% 0.50
Marijuana 190 6.1% 320 5.2% 0.05
Narcotic-Analgesics 55 1.8% 125 2.0% 0.42
Sedatives 45 1.5% 92 1.5% 0.90
Stimulants 80 2.6% 158 2.6% 0.93
Other 12 0.4% 12 0.2% 0.08
More than 1 Class 92 3.0% 132 2.1% 0.01
Overall Drug Positive 495 16.0% 889 14.4% 0.04
Negative 2,600 84.0% 5,301 85.6% 0.04
All 3,095 100.0% 6,190 100.0%

Preliminary Results
Oral Fluid and Blood Samples: Drug Type
Distribution
Oral Fluid Blood
Crashes Controls Crashes Controls
N % N % p-value N % N % p-value
Illegal 322 10.4 546 8.8 0.01 59 10.0 109 9.3 0.61
Other 173 5.6 343 5.5 0.92 51 8.7 81 6.9 0.18
Neg. 2,600 84.0 5,301 85.6 0.04 478 81.3 986 83.8 0.18
All 3,095 100 6,190 100 588 100 1,176 100

Contact Information
John H. Lacey Pacific Institute for Research & Evaluation (PIRE)
11720 Beltsville Dr., Ste. 900
Calverton, MD 20705
Ph: 301-755-2779
Fax: 301-755-2808
Email: [email protected]
Website: www.pire.org