URUGUAY: Poverty Research 2003 - UNSD —...
12
URUGUAY: Poverty Research 2003 by Ing. Mónica Beltrami, M. S. Statistician; Technical Consultant to Uruguayan National Institute of Statistics Prepared for presentation at: Workshop on Poverty Statistics in Latin America and the Caribbean Rio de Janeiro, Brazil, May 10–13, 2004
Transcript of URUGUAY: Poverty Research 2003 - UNSD —...

URUGUAY: Poverty Research 2003
by
Ing. Mónica Beltrami, M. S.
Statistician; Technical Consultant to Uruguayan
National Institute of Statistics
Prepared for presentation at:
Workshop on Poverty Statistics in Latin America and the Caribbean
Rio de Janeiro, Brazil, May 10–13, 2004
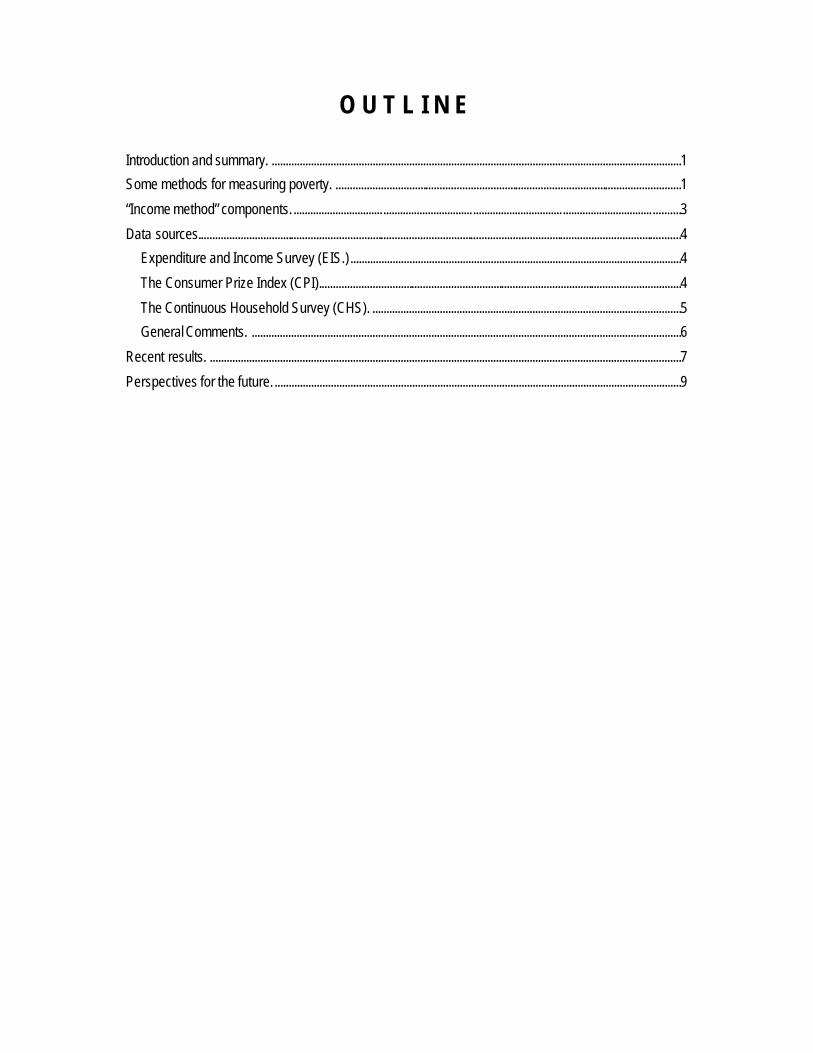
O U T L I N E
Introduction and summary. ..................................................................................................................................................1
Some methods for measuring poverty. ...........................................................................................................................1
“Income method” components...........................................................................................................................................3
Data sources............................................................................................................................................................................4
Expenditure and Income Survey (EIS.)......................................................................................................................4
The Consumer Prize Index (CPI).................................................................................................................................4
The Continuous Household Survey (CHS). ..............................................................................................................5
General Comments. .........................................................................................................................................................6
Recent results. ........................................................................................................................................................................7
Perspectives for the future..................................................................................................................................................9

1
Introduction and summary. This repor t deals with the methods applied at present in Uruguay to provide estimates on poverty.
First of all I describe some of the principal methods used in determining poverty thresholds , including the procedure currently employed by the Uruguayan National Insti tute of Statistics. For more than two years I have been the principal statistician working on this problem.
In the pages which follow I comment on some of the weaknesses involved in poverty line estimations in Uruguay and in general.
Also, I indicate the main problems brought by the method applied and the alternatives at hand to improve the estimation of the poverty phenomenon.
On the basis of data from a household survey of expenditures and income, an option for the content of a basic food basket for Monte video and other areas of Uruguay was developed, along with a procedure for calculating poverty lines.
The basic food baskets are made up of articles which are most frequent or of greater incidence in expenditures of households in reference strata that are defined as being those which cover with the acquired foods the energy necessities per capita, and do not show deprivation in other expense categories (clothing, shoes, housing, education, health, etc.). The value of these food baskets for Montevideo and for other areas of Uruguay are the indigence lines – that is, indigent households are those which do not meet these minimum criteria.
Poverty lines are calculated by expanding the basic price of the food basket by coefficients (Orshansky) depending on the number of members and the presence of children. Households whose per capita incomes do not cover these expanded costs are classified as in poverty.
Methods are presented for updating the prices of the “baskets” and for the application of indigence and poverty thresholds in order to classify households as indigent, poor, and not poor.
Finally, I show the data on indigence and poverty for the last five years of the Uruguayan Household Survey, along with a brief socioeconomic description of the poor and indigent households. Account is also taken of the sampling error of estimates and their effect on statistical disaggregation.
Some methods for measuring poverty. Univariate.
Poverty is defined as an “insufficient command over resources for a person to be able to survive (absolute poverty) or to live according to the standard of living reached in the process of growth and development of a country (relative poverty) or something in between”1.
Absolute approach.
This is a bivalent concept: T he population is divided into poor and non-poor groups with nothing in between.
“Income method” (Income/ cost of basic food and other needs). T his is the one applied to produce the Annual Report on Poverty in Uruguay. Poverty Line(s) (PL) are set (see below), and a comparison with the per capita income of the households is made. If a household has an
1 Dagum, C. Analysis and Measurement of Poverty and Social Exclusion using Fuzzy Set Theory. Application and Policy Implications . Invited Conference at the “Jornadas Interamericanas de Enseñanza de Estadística” and the “V Congreso Latinoamericano de Sociedades de Estadística”. October 2002, Buenos Aires, Argentina.
2
amount of per capita income less than the respective PL it is “marked” as poor. If it makes at least that PL amount, it is not.
US$ 1 PPP (Purchase Power Parity) per capita per day; US$ 2 PPP per capita per day. The first is considered the Indigence Line (IL), and the second one the PL. It is applied by such international institutions as WB or the IMF with inter -country comparison purposes.
“Unsatisfied Basic Needs” (UBN). This is a set of basic characteristics of the dwelling and the household in such form that a household is considered as “deprived” if it lacks at least one of those basic needs.
Expenditure per capita.
Relative approach.
This is also a bivalent concept, but it is related to the general level of income of households .
Households under the 20th percentile of per capita income.
Households under half the median of per capita income.
Bivariate
These methods deal with a “fourfold logic” by applying either two of the absolute approaches, as for example UBN&PL. These methods are a step towards describing poverty as the population’s lack of capacity for social integration. They give a wider view of the different “stages” of poverty.
Multivariate
These consider poverty as a multiple deprivation, and allow analysis of either the dimensions of poverty or o f socioeconomic policies’ impact on the alleviation of poverty (both proportion and intensity).
The most important multivariate approaches to analyze poverty include:
Social exclusion approach. This is a socially oriented method that identifies a long list of economic and social items, such as: unemployment, underemployment, poverty by either of the univariate methods, school dropouts, child labor, child abuse, minorities, recipients of social assistance and those who need social assistance but are not eligible, etc.
Functioning, capability and entitlement approach. This is related to the previous one but has less socially oriented concepts. It considers a person’s endowment of commodities and the customs of the society to which she or he belongs. It also considers the possible actions spectra of the person (functioning) and the ability of th e person to optimize the use/ consumption of the commodity endowment (capability).
The fuzzy set t heory approach. These are complex models that take into account both social exclusion and capability approaches. The objective is to calculate a poverty index as a function of all the items or attributes listed by those approaches. The principal advantages of the fuzzy set theory application are:
Ø Measurement of each household’s relative level of poverty,
Ø Estimation of the average poverty index of the whole household population, and
Ø Measurement of the relative deprivation/ poverty for each item in the composite model.
Furthermore, this last advantage identifies the attributes which should be targets of a structural socioeconomic policy to reduce structural poverty.

3
The UNDP Human Poverty Index (HPI) presented in the Human Development Report. This index shows two versions, one for industrialized countries and another for developing countries. The variables used for construction of the HPI in developing countries are the same to measure the relative levels of development among countries, but they measure deprivation instead of mean levels: per capita income (in PPP), life expectancy at birth, primary, secondary and tertiary enrolment ratios, and adult literacy ratio. It also considers deprivation for a lack of social inclusion.2
“Income method” components. A Basic Food Basket (BFB). In Uruguay this was built up as a “compromise” between a basic but adequate nutrition food set for an average person, and the alimentary habits of a reference household group. This group was defined as being the one for which the energy standard needs per capita were reached, and did not show deprivation in selecting other goods. These conditions were covered by the 20 th to 29th percentiles of per capita income.
Some characteristics are observed in different countries and in different expenditure surveys of the same country:
Use of the “Equivalent Adult” as the object person.
Minimum –cost food baskets.
Normative food baskets, regardless of cost.
A Total Basic Basket represented by the BFB expanded by one or more factors (inverse of Engel’s Coefficient = Orshansky’s Coefficient)3. The expansion factor takes account of the additional value of non -food goods and services that constitute the set of expenditures of the reference households.
Usually, a basket of non-foods, similar to the food basket is not constructed , because its content is not as “standard” as food needs. Also, whereas the food basket is “consumed” by individuals, the non-food components may be consumed either by individuals (medicines, some clothes, shoes, tooth brushes…) or shared by the household members (house, furniture, books, cleaning items, etc.) Moreover, the greater the household size, the less expenditure per capita tend to be (scale’s economy).
In the case of Uruguay, this Total Basic Basket was estimated with a set of expanding coefficients giving some account of the scale’s economies and the different strategies applied by the households to survive, without fixing a set of non-foods. The estimates were developed through linear models where the dependent variable was the non-food proportion of expenditures relative to the total amount of expenditures in each household of the reference group, and the independent variables were selected from a set of variables highly correlated with expenditures but not with each other . The set was reduced to: main area (Montevideo and the rest of urban areas in the reference population), household size measured in number of members, and the presence of minors (people under 18 years).
2 Some fuss has been made by some countries (not always the same, nor for the same reasons) each time the Human Development Report is published. The countries’ political/ economical/ social body complaint with the “lack of accuracy” of the statistics, or the supposed “bias” that they imply because data sources are not the same, nor their coverage, or the methodologies applied… which in the end lead to meetings like this.
3 The Engel Coefficient and the Orshansky modification have to do with the percentage of total income which a family needs to spend on food products.

4
A suitable index to update the food basket value. For Uruguay this is the Consumer Price Index (CPI) in food and beverages (CPIF).
A sample survey on households big enough to allow an accurate estimation of the head count or ratios represented by the poor.
The survey for which that sample is the data source must investigate either income or expenditures of the households and their members. In the case of Uruguay the Continuous Household Survey investigates income as well as other variables on labor force, education, health, etc. It is the selected “instrument” to measure household and population poverty.
Data sources. To set a suitable line to classify households either as poor or non -poor, and then to have accurate estimates, it is necessary to have data collected with probability samples. Also, it is necessary to have parallel surveys that have similar coverage, and standard definitions for the same variables. Such surveys could be utilized and crossed -referenced when time periods coincide.
Expenditure and Income Survey (EIS.)
Dates of the last survey in Uru guay: June 1994 to May 1995.
Coverage: Montevideo (capital of the country) and a sample of five other cities representing those of 10,000 or more inhabitants.
Final sample size: 3,749 households, 51% of which were taken in Montevideo.
Applications:
Mean basket of goods and services for calculation of the CPI;
Basic Food Basket (BFB) to set the Indigence Line(s);
Consumers’ habits in the reference households group for the setting of the Poverty Line(s).
The BFB was made considering the nutrition needs of an “average” person and setting those needs in a set of foods and beverages that totalled almost 2,000 calories per day, with some differences in kind between the two main urban areas (Montevideo and others) covered by the EIS. Its contents were set by nutrition experts and covered 17% bread products, 9% meat and fish, 24% dairy products, 29% fruits and vegetables, 9% other foods, and 12% (non-alcoholic) beverages.
COMMENTS:
Difficulties in avoiding every inaccuracy coming from informant declarations about their acquisitions and payments because of the remembrance methods used to get the data.
The short life span of the components in the baskets (in kind as well as in amount) due to changes in habits or disposability of goods, or by the external influence of ec onomy and market fluctuations.
Different BFB construction criteria.
BUT SOMETHING IS BETTER THAN NOTHING… sometimes.
The Consumer Prize Index (CPI).
Last change of base: March 1997.
Coverage: Only Montevideo.

5
Contents: 310 articles (or goods and services) , 41% of which are food and beverages.
Sample size of commerce or service points of sale: 2,500.
CPI is applied all over the country to update debts or payments, to adjust some professional fees, and to set the Indexed Unit (since June 2002) that is a “real” peso: no changes of acquisition value over time.
The monthly variation of the CPI part due to food and beverages (CPIF) is used to update the BFB value, or Indigence Line (IL).
COMMENTS:
In spite of its wide and agreed use over the country, the CPI only shows the price levels and variations of goods and services for Montevideo customers’ habits in Montevideo commerce and service points of sale. This has a few shortcomings:
It has been demonstrated that prices paid for food are different depending on the city and its main industries (tourism, cattle or farm production, textiles, etc.).
Some commodity prices , like electricity or telephone services are common all over the country, but
other commodities are either inexistent in some areas (e.g., non-bottled gas), or have different price levels (water, garbage collection, street cleaning).
The Continuous Household Survey (CHS).
Data history: Since 1968, with several changes along the period up to the present (coverage, sample size, questionnaires, definitions).
Last sample design: 1998.
Last change of questionnaire: 2001.
Sample frame: Dwelling and household listing from the General Housing, Household and Population Census held on May 22, 1996.
Coverage: Urban areas (cities and towns) with more than 5,000 inhabitants. This includes Montevideo (population about 1.4 million).4
Sample size: More than 18,000 households (about 60,000 persons) per year .
Main survey topics: Labor force, income, education, health, some household characteristics.
The CHS produces monthly estimates of labor force data, including employment/unemployment and income le vels. This is by means of three-month moving averages. The large number of cases for a year as a whole permits major statistical breakdowns and the estimation of poverty indicators.
COMMENTS:
The CHS represents only urban areas (see above), so the poverty indicators have a built-in bias with respect to the whole country.
The sample size, although big enough to allow the three-month moving averages to estimate unemployment, is not large enough to permit the estimation of poverty indicators down to the level
4 Rural areas and smaller towns were studied in a 4-month household survey in 1999-2000 by the Agriculture Ministry, with the technical assistance of the National Institute of Statistics. The survey report included household expenditure data.

6
of departments (Uruguayan provinces): it was not designed for that. So, the estimates produced can only be br oken down for the big urban areas: Montevideo, and “the urban interior.”
General Comments.
ABOUT SAMPLE FRAME.
The last Census (1996) is now outdated, because:
It is presumed that the recent economic recession has promoted emigration waves –
Internal migration has been observed (farms to towns; towns to cities; other cities to Montevideo) , and so on.
“M arginal” neighborhoods have been growing (and new ones have appeared) that are not totally represented in the listings.
There is no automatic updating of the main sample frame: Neither are new buildings listed, nor disappeared ones erased, except when the CHS “stumbles” on them . T his affects the type of estimators that should be applied to the variables, for these changes to be taken into account (ratio estimates, for example).
All these problems affect first of all the non -contact rate (emigrated people left empty houses), complicating the calculation of estimates, and secondly could produce a bias on them because the reference population could differ from the sampled population.5
ABOUT THE EIS:
The baskets of goods are outdated too. This is because of the time passed since the gathering of the data and the effect of the recent economic recession suffered by the country. So, the population’s expenditure structure has changed , not only in kind, but in quantity (disposability of goods, changes in their specifications, origin, price, “state of the art,” “booming” demands, “shrinking” demands, substitution rates, etc.)
The problem of recording the expenditures of the households, remembering those made one, two, six or even twelve months ago has to be resolved, or at least improved, to minimize the sub-declaration and to allow a better construction of the basic or mean baskets’ sets of goods. The same goes for avoiding the sub -declaration of income sources and amounts.
ABOUT REFERENCE POPULATION COVERED BY THE SURVEYS:
The EIS represented cities and towns with more than 10,000 inhabitants.
The CHS represents cities and towns with more than 5,000 inhabitants.
It is not demonstrated that consumer expenditures are the same in the bigger cities than in the middle sized ones. It is a fact that those expenditures are not the same in the smallest towns and rural area, than in the bigger cities, but the differences are small (so the assumption was that the expenditures’ structure in the middle si zed cities was about the same at the time when EIS run).
Efforts must be made to get a reasonable coincidence of coverage and, hopefully, a budget large enough to include the whole country.
5 The next Population Census is under planning, and the Phase I is in course: Maps and frame lists updating dwellings, households, commercial or industrial places, and people.
7
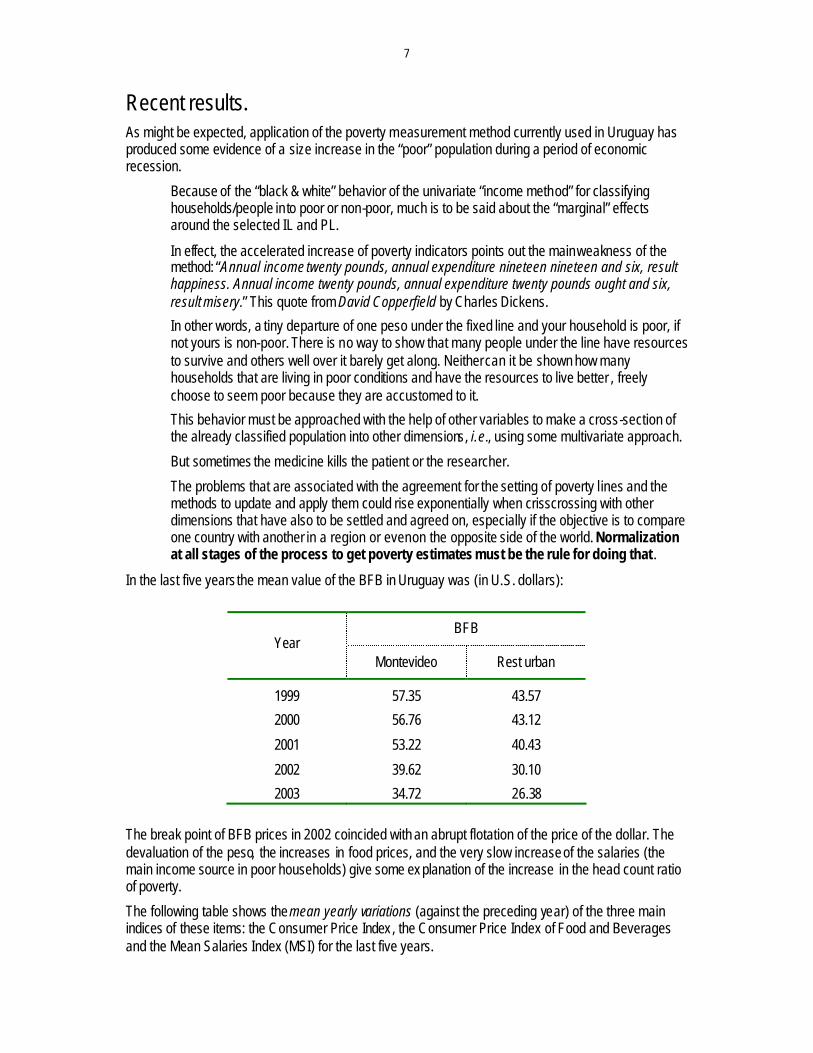
Recent results. As might be expected, application of the poverty measurement method currently used in Uruguay has produced some evidence of a size increase in the “poor” population during a period of economic recession.
Because of the “black & white” behavior of the univariate “income method” for classifying households/people into poor or non-poor, much is to be said about the “marginal” effects around the selected IL and PL.
In effect, the accelerated increase of poverty indicators points out the main weakness of the method: “Annual income twenty pounds, annual expenditure nineteen nineteen and six, result happiness. Annual income twenty pounds, annual expenditure twenty pounds ought and six, result misery.” This quote from David Copperfield by Charles Dickens.
In other words, a tiny departure of one peso under the fixed line and your household is poor, if not yours is non-poor. There is no way to show that many people under the line have resources to survive and others well over it barely get along. Neither can it be shown how many households that are living in poor conditions and have the resources to live better , freely choose to seem poor because they are accustomed to it.
This behavior must be approached with the help of other variables to make a cross-section of the already classified population into other dimensions, i.e., using some multivariate approach.
But sometimes the medicine kills the patient or the researcher.
The problems that are associated with the agreement for the setting of poverty lines and the methods to update and apply them could rise exponentially when crisscrossing with other dimensions that have also to be settled and agreed on, especially if the objective is to compare one country with another in a region or even on the opposite side of the world. Normalization at all stages of the process to get poverty estimates must be the rule for doing that .
In the last five years the mean value of the BFB in Uruguay was (in U.S. dollars):
BFB Year
Montevideo Rest urban
1999 57.35 43.57
2000 56.76 43.12
2001 53.22 40.43
2002 39.62 30.10
2003 34.72 26.38
The break point of BFB prices in 2002 coincided with an abrupt flotation of the price of the dollar. The devaluation of the peso, the increases in food prices, and the very slow increase of the salaries (the main income source in poor households) give some ex planation of the increase in the head count ratio of poverty.
The following table shows the mean yearly variations (against the preceding year) of the three main indices of these items: the Consumer Price Index , the Consumer Price Index of Food and Beverages and the Mean Salaries Index (MSI) for the last five years.

8
VARIATIONS (in %) YEAR
CPI CPIF M SI
1999 5.7 3.7 7.3
2000 4.8 5.6 3.4
2001 4.4 3.1 4.1
2002 13.6 13.2 1.0
2003 19.8 22.1 5.2
The poverty ratio of households and of people (and also the extreme poverty ratio, of those that do not even have enough income to have access to the BFB) are shown below. (Sampling error at 95% level is indicated.)
REFERENCE UNIT AND YEAR
% POVERTY (including Indigence)
% EXTREME POVERTY (Indigence)
Households
1999 9.6 ± 0.5 0.6 ± 0.1
2000 11.0 ± 0.5 0.7 ± 0.1
2001 11.7 ± 0.5 0.7 ± 0.1
2002 15.3 ± 0.6 1.0 ± 0.2
2003
Persons
1999 15.3 ± 0.8 1.2 ± 0.3
2000 17.8 ± 1.9 1.5 ± 0.3
2001 18.8 ± 1.9 1.3 ± 0.3
2002 23.6 ± 1.0 1.9 ± 0.3
2003
(Sorry. The 2003 estimates had not been published at the time of sending this paper, but they probably will be when the Workshop takes place. Thus you may be able to insert a new page for this one!)
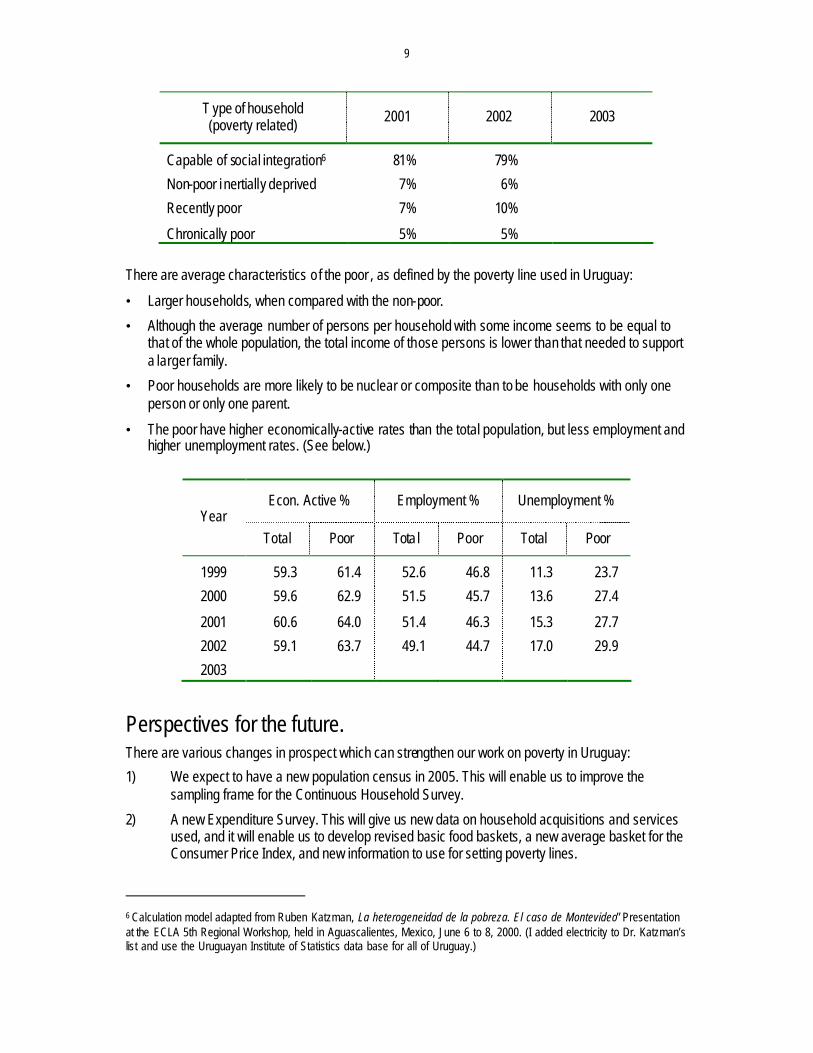
The next table shows poverty data as per capita income and PL and the dimension due to UBN (unsatisfied basic needs). You can see (a) the effect of “recent poverty” (those without enough per capita income but with their basic – structural – needs satisfied ); and (b) “inertial deprivation” (the small proportion who have enough per capita income but do not live with their basic needs covered in housing, water supply, sanitary conditions, etc.) This table shows household percentages.
9
T ype of household (poverty related) 2001 2002 2003
Capable of social integration6 81% 79%
Non-poor i nertially deprived 7% 6%
Recently poor 7% 10%
Chronically poor 5% 5%
There are average characteristics o f the poor , as defined by the poverty line used in Uruguay:
• Larger households, when compared with the non-poor.
• Although the average number of persons per household with some income seems to be equal to that of the whole population, the total income of those persons is lower than that needed to support a larger family.
• Poor households are more likely to be nuclear or composite than to be households with only one person or only one parent.
• The poor have higher economically-active rates than the total population, but less employment and higher unemployment rates. (See below.)
Econ. Active % Employment % Unemployment % Year
Total Poor Tota l Poor Total Poor
1999 59.3 61.4 52.6 46.8 11.3 23.7
2000 59.6 62.9 51.5 45.7 13.6 27.4
2001 60.6 64.0 51.4 46.3 15.3 27.7
2002 59.1 63.7 49.1 44.7 17.0 29.9
2003
Perspectives for the future. There are various changes in prospect which can strengthen our work on poverty in Uruguay:
1) We expect to have a new population census in 2005. This will enable us to improve the sampling frame for the Continuous Household Survey.
2) A new Expenditure Survey. This will give us new data on household acquisitions and services used, and it will enable us to develop revised basic food baskets, a new average basket for the Consumer Price Index, and new information to use for setting poverty lines.
6 Calculation model adapted from Ruben Katzman, La heterogeneidad de la pobreza. El caso de Montevideo” Presentation at the ECLA 5th Regional Workshop, held in Aguascalientes, Mexico, June 6 to 8, 2000. (I added electricity to Dr. Katzman’s list and use the Uruguayan Institute of Statistics data base for all of Uruguay.)
10
3) Possible expansion of the geographic coverage of the Household Survey.
4) Consideration of the possibility of obtaining food price data from areas outside of Montevideo.
5) Further study and/or utilization of multivariate models described in this report.
Thank you for your interest and patience.