Urban Water System Planning in Coastal Areas of the ...PRIVATE DEBATE 2.2 PUBLIC, PRIVATE AND MIXED...
74
VOLUME II Tools and Instruments Integrated Coastal Urban Water System Planning in Coastal Areas of the Mediterranean
Transcript of Urban Water System Planning in Coastal Areas of the ...PRIVATE DEBATE 2.2 PUBLIC, PRIVATE AND MIXED...

VOLUME IITools and Instruments
Integrated Coastal Urban Water System Planning in Coastal Areas of the Mediterranean
VOLUME IITools and Instruments
Integrated Coastal Urban Water System Planning in Coastal Areas of the Mediterranean
Background Information
The preparation of these Guidelines was commissioned by PAP/RAC from Dr. Giorgos Kallis, as Report Coordinator and Author and Research Associate at the Environment and Spatial Planning Laboratory of the University of Thessaly.
Ms Madeleine Theochari, Research Associate at the Environment and Spatial Planning Laboratory of the University of Thessaly, assisted with the research and editing.
Various organisations and individuals also contributed to these Guidelines. The author is particularly grateful to Prof. Jure Margeta (Faculty of Civil Engineering and Architecture, University of Split), Mr Ivica Trumbic (PAP/RAC), Mr Hachmi Kennou (Mediterranean Institute for Water) and Prof. Harry Coccossis (University of Thessaly) for their assistance and support
These Guidelines have benefited from the participation of the principal author of three EU water research projects:• METRON (Metropolitan Areas and Sustainable
Use of Water), Environment and Climate Programme, ENV4-CT97-0565.
• ADVISOR (Integrated Evaluation for Sustainable River Basin Governance), Energy and Sustainable Development Programme, EVK1-CT-2000-00074.
• PRINWASS (Barriers to and Conditions for the involvement of Private Capital and enterprise on water supply and sanitation in Latin America and Africa), International Cooperation - Developing Countries (INCO-DC) Programme, EVK1-CT-2000-00074.
This report has drawn upon an earlier draft report prepared by Professor Jure Margeta, Study Coordinator and co-author, Professor Ernest Azzopardi, Mr. Iacovos Iacovides and Mr. Michael Sevener.

i
TABLE OF CONTENTS
List of FiguresList of TablesList of BoxesList of Acronyms (Volumes I and II)PrefaceReaders’ GuideGlossary
1. INTRODUCTION 1.1 WHY INTEGRATED URBAN WATER SYSTEM MANAGEMENT IN MEDITERRANEAN
COASTAL AREAS? 1.2 THE URBAN WATER SYSTEM IN COASTAL AREAS 1.3 INTEGRATED URBAN WATER SYSTEM MANAGEMENT IN COASTAL AREAS (IUWSMCA) 1.4 PLANNING FOR INTEGRATED URBAN WATER SYSTEM MANAGEMENT IN COASTAL AREAS
2. URBAN WATER UTILITIES: PUBLIC AND PRIVATE MODELS 2.1 THE PUBLIC VS. PRIVATE DEBATE 2.2 PUBLIC, PRIVATE AND MIXED MODELS 2.3 AN APPRAISAL OF DIFFERENT MODELS 2.3.1 Competition 2.3.2 Economic efficiency 2.3.3 Funding 2.3.4 Social and environmental services 2.3.5 Transparency and democratic control 2.3.6 Regulation 2.3.7 Integration 2.3.8 An overall comparison 2.4 DISAGGREGATED VS. AGGREGATED ORGANISATIONAL STRUCTURES 2.5 DEVELOPING EFFECTIVE ORGANISATIONAL SCHEMES
3. LEGAL FRAMEWORK 3.1 THE ROLE OF LEGISLATION 3.2 THE REGULATION OF UTILITIES 3.2.1 Customer and service standards 3.2.2 Monitoring and reporting 3.2.3 Exemptions 3.2.4 Planning and participation 3.3 ECONOMIC REGULATION 3.4 PUBLIC HEALTH REGULATION 3.5 POLLUTION CONTROL REGULATION 3.5.1 Urban wastewater 3.5.2 Stormwater control 3.6 ENVIRONMENTAL REGULATION 3.7 THE REGULATION OF WATER RESOURCES 3.8 URBAN DEVELOPMENT AND LAND-USE REGULATION 3.9 DESIGN STANDARDS 3.10 A COMPREHENSIVE LEGAL FRAMEWORK FOR COASTAL URBAN WATER SYSTEMS
4. DECISION SUPPORT TOOLS AND TECHNIQUES 4.1 INFORMATION MANAGEMENT 4.1.1 Data acquisition, management and utilisation 4.1.2 Decision-support systems 4.2 ASSESSMENT TOOLS 4.2.1 Impact assessment 4.2.2 Cost-benefit analysis 4.2.3 Multi-criteria decision aid 4.2.4 Scenario analysis
ivv
viviiixxi
xv
1
1247
99
111314151516181820202022
2323232324242424252727272828292930
333333343636373940

ii iii
4.3 PERFORMANCE ASSESSMENT AND REPORTING 4.3.1 Life Cycle Assessment (LCA) 4.3.2 Indicators and sustainability reporting 4.3.3 Benchmarking
5. URBAN WATER DEMAND MANAGEMENT 5.1 WHAT IS URBAN WATER DEMAND MANAGEMENT? 5.2 ENHANCED SUPPLY MANAGEMENT 5.3 CONTROL OF DISTRIBUTION LOSSES 5.3.1 Water accounting and metering 5.3.2 Control of losses 5.3.3 Pressure management 5.4 END-USE WATER SAVING 5.5 INFORMATION, EDUCATION AND SOCIAL PARTICIPATION 5.6 REGULATION 5.7 PRICING 5.8 URBAN PLANNING 5.9 A WATER DEMAND MANAGEMENT PLAN 5.10 DATA AND EVALUATION REQUIREMENTS
6. URBAN WATER CYCLE TECHNOLOGIES 6.1 WHAT ARE URBAN WATER CYCLE TECHNOLOGIES? 6.2 CENTRALISED WASTEWATER RECYCLING 6.3 NATURAL WASTEWATER TREATMENT 6.4 LOCALISED WASTEWATER TREATMENT 6.5 SOURCE CONTROL AND MULTIPLE SEWAGE SYSTEMS 6.6 HOUSEHOLD RAINWATER HARVESTING 6.7 STORMWATER COLLECTION, INFILTRATION AND DETENTION SYSTEMS 6.8 AQUIFER RECHARGE 6.9 DUAL SUPPLIES 6.10 DESALINATION 6.11 SUPPORTING POLICIES
7. PRICING URBAN WATER SERVICES 7.1 PRICING AND TRADE-OFF GOALS 7.1.1 Economic efficiency 7.1.2 Equity 7.1.3 Environmental protection 7.1.4 Financial sustainability 7.2 PRICING SYSTEMS 7.2.1 Flat vs. volumetric tariffs 7.2.2 Uniform vs. increasing block rate tariffs 7.2.3 Differentiated tariffs 7.2.4 Instruments addressing affordability 7.2.5 Wastewater and stormwater pricing 7.2.6 Abstraction charging 7.2.7 The Tariff-setting Process 7.3 GUIDANCE ON THE APPROPRIATE PRICING OF URBAN WATER SERVICES
8. PUBLIC PARTICIPATION 8.1 THE JUSTIFICATION FOR PUBLIC PARTICIPATION 8.2 DEGREES OF PARTICIPATION 8.3 WHERE AND WHEN: PUBLIC PARTICIPATION AND PLANNING FOR IWSMCA 8.4 ORGANISING A PARTICIPATORY PROCESS 8.5 TECHNIQUES 8.5.1 Information and consultation 8.5.2 Platforms for participatory processes 8.5.3 Deliberative Inclusion Processes (DIPs) 8.5.4 Polling 8.6 ISSUES IN PUBLIC PARTICIPATION 8.7 Guiding Principles for Participatory Processes
9. RISK MANAGEMENT 9.1 THE PRINCIPLES OF RISK MANAGEMENT 9.2 RISK FACTORS AND IMPACTS IN COASTAL URBAN WATER SYSTEMS 127 9.2.1 Hazards 9.2.2 Risks to urban water infrastructure 9.2.3 Impacts 9.2.4 Developing a Risk Management Plan for Coastal Urban Water Systems
10. BIBLIOGRAPHY (Volumes I and II)
41414242
4747484949505051545556575760
616161616565676973737575
797979808182828384868788898991
9393939496999999
100102103105
107107109109110111111
112

iv v
List of Figures Figure 1.1 Driving forces, pressures, state and impacts on urban water resources and the need
for an integrated approachFigure 1.2 The urban water systemFigure 1.3 A schematic of the urban water cycleFigure 1.4 The interfaces between the urban water system, the river basin, the city and the coastFigure 1.5 Conventional coastal urban water system boundaries and direction of extensionFigure 1.6 Progressive tiers of integrationFigure 1.7 Stages of a Coastal Urban Water System Master Planning ProcessFigure 2.1 The cycle of change between private and public controlFigure 2.2 Core and non-core operations in urban water systemsFigure 2.3 Typology of private involvement in urban water servicesFigure 2.4 A taxonomy of public-private organisational modelsFigure 2.5 Funding channelsFigure 4.1 Basic components of a decision support systemFigure 5.1 Savings in the water supply chainFigure 5.2 Water accounting systemFigure 5.3 Information flow for a demand forecastFigure 6.1 A schematic depiction of a constructed wetlandFigure 6.2 A simple system for rainwater harvestingFigure 6.3 Schematic of filter strips and swalesFigure 6.4 Schematic of an infiltration basinFigure 6.5 Schematic of permeable surfacesFigure 6.6 Schematic of soakwaysFigure 6.7 Schematic of a pondFigure 6.8 Methods for aquifer rechargeFigure 7.1 The full cost of waterFigure 8.1 Levels of participationFigure 8.2 Timing for public participation in the decision cycleFigure 9.1 The components of risk managementFigure 9.2 The five tasks of a risk management processFigure 9.3 The risk planning process and stakeholder involvement
List of Tables
Table 1.1 IUWSMCA toolsTable 2.1 The sources of water service fundingTable 2.2 Comparison of the basic public and private organisational modelsTable 3.1 The legal instruments for urban water system managementTable 5.1 Some water saving technologiesTable 5.2 Potential water savingsTable 5.3 Water demand management measuresTable 6.1 Loads in samples of household wastewaterTable 6.2 Major characteristics of aquifer recharge techniquesTable 7.1 A comparison of different tariff designsTable 8.1 An assessment of participation techniques
2345567
1011121216344849576267686970717274809495
107108113
8162131525259667486
103
vi vii
List Of Acronyms (Volumes I and II)
BOD Biological Oxygen Demand BOO Build, operate and ownBOT Build – Operate – TransferCAS Chemically Assisted Sedimentation CBA Cost Benefit AnalysisCEA Cost Effectiveness AnalysisCEC Council of the European CommunitiesCIRIA Construction Industry Research and
Information AssociationCOD Chemical Oxygen Demand COMEC Commission of the European
CommunitiesCOSLA Convention of Scottish Local
AuthoritiesDBMS Database Management System DIPs Deliberative Inclusion Processes DMAE Departamento Municipal do Agua e
Esgoto, Porto Alegre, BrazilDSS Decision-Support SystemsDWP Department of Water and Power, Los
AngelesEEA European Environmental AgencyEIA Environmental Impact AssessmentEMAS Eco-Management and Auditing
SchemeEMASESA Municipal Water Company of the city
of Seville EPA Environmental Protection Agency,
USAEU European Union EU WFD EU Water Framework DirectiveFAO Food Agriculture OrganisationGIS Geographic Information Systems GWP Global Water Partnership IA Integrated Assessment IAURIF Institute for Urban Planning and
Development of the Paris Ile-de-France region
ICZM Integrated Coastal Zone Management IEMA Institute of Environmental
Management and AssessmentILI Infrastructure Leakage Index IPPR Institute for Public Policy ResearchIRP Integrated Resource PlanningIRR Internal Rate of ReturnISD Indicators for Sustainable
Development ISO International Organisation for
Standardisation IUWSMCA Integrated Urban Water System
Management in Coastal Areas IWA International Water AssociationLCA Life Cycle AssessmentMAP Mediterranean Action Plan MCDA Multi-criteria Decision Aid MCSD Mediterranean Commission on
Sustainable Development MED Multi-Effect Distillation MSF Multi-Stage Flash
NPC Net Present CostNPV Net Present ValueOECD Organisation for Economic
Cooperation and DevelopmentOFWAT Office for Water Services, England
and Wales PAHO/WHO Pan American Health Organisation,
Regional Office of WHOPAP/RAC Priority Actions Programme Regional
Activity Centre PCE Parliamentary Commissioner for the
Environment (New Zealand)PLCs Public Limited Companies PPPs Public Private Partnerships PSR Pressure-State-ResponsesRO Reverse Osmosis ROCE Return on Capital Employed SWOT Strengths-Weaknesses-Opportunities-
Threats (analysis) SDR Sustainable Development RecordsSEA Strategic Environmental AssessmentSETAC Society of Environmental Toxicology
and ChemistrySIA Social Impact Assessment STOA Scientific and Technological Options
Assessment, EUTHM’s TrihalomethanesTOC Total Organic Carbon TSS Total Suspended SolidsTVM Time Value of Money UNECE United Nations Economic
Commission for EuropeUNEP United Nations Environmental
ProgrammeUNEP/GPA Global Programme of Action UNEP-IETC. UNEP International Environmental
Technology CentreUNESCO United Nations US CMSER US Commission on Marine Science,
Engineering and ResourcesUWDM Urban Water Demand Management VC Vapour Compression VEWIN The Netherlands Waterworks
Association, Vereniging van Waterbedrijven in The Netherlands
WB World Bank WDCC The Western Drought Coordination
CouncilWHO World Health Organisation WRI World Resources InstituteWSUD Water Sensitive Urban Design WTA Willingness to AcceptWTP Willingness to Pay
List of Boxes
Box 1.1 Elements of the coastal urban water systemBox 2.1 Reasons for public utility failureBox 2.2 Reasons for private sector failureBox 2.3 Public and private organisational modelsBox 2.4 Porto Alegre, Brazil: A best case example of public participation in an urban water utilityBox 2.5 SantaCruz, Bolivia: A best case example of a water cooperativeBox 3.1 International standards for wastewater reuseBox 4.1 Basic steps of an Environmental Impact AssessmentBox 4.2 Basic steps of a Cost Benefit AnalysisBox 4.3 Basic economic valuation techniques for assessing costs and benefitsBox 4.4 A platform for participatory MCDA: the NAIADE software modelBox 4.5 Summary of indicators for sustainable development covering the technical and
environmental aspects of an urban water systemBox 4.6 UK water industry environmental sustainability indicatorsBox 4.7 Benchmarking indicators in the Dutch drinking water industryBox 5.1 The costs and benefits of water demand managementBox 5.2 A best case example of enhanced source use: A decision-support system for water
management in the city of Athens, GreeceBox 5.3 An example of a calculation using the Infrastructure Leakage IndexBox 5.4 Los Angeles: A best case example of a community UWDM programmeBox 5.5 Elements of an end-use water saving programmeBox 5.6 Factors affecting social participation in UWDMBox 5.7 Contents of a Comprehensive Water Demand Management PlanBox 6.1 New technologies for conventional wastewater treatmentBox 6.2 Operations and processes used in wastewater reclamationBox 6.3 Categories of wastewater reuse and potential constraintsBox 7.1 Trade-offs in water pricingBox 7.2 The components of a tariffBox 7.3 Rate setting by the Blue Ribbon Committee of Los AngelesBox 8.1 Some reasons for the growing interest in participatory processesBox 8.2 The organisation of a participatory processBox 8.3 Participant selection procedures for a deliberative decision processBox 8.4 Typology of possible stakeholders involved in water managementBox 8.5 Questions for evaluating the performance of participatory processesBox 8.6 Visioning workshop for sustainable water management on the Greek island of NaxosBox 9.1 Hazards and their impacts on coastal urban water systemsBox 9.2 Potential drought impactsBox 9.3 A best case example of drought contingency planning: Seville, Spain
39
101319192636373840
43444547
4851535455586263648383909396979798
102109112115
viii ix
The Priority Actions Programme Regional Activity Centre (PAP/RAC) of the Mediterranean Action Plan (MAP) has been implementing a number of activities in the field of coastal water resources management as a priority issue.
PAP has been concentrating its efforts on the provision of assistance to Mediterranean States in implementing the objectives set out in Chapter 18 of “Agenda 21”, a policy document on water resource issues adopted by a significant number of governments. The recommendations of the United Nations Conference on Environment and Development (Rio, 1992) formed the basis of the Mediterranean Water Charter (Rome, 1992), and were fully endorsed by the Tunis Conference (Tunis, 1994) in the Agenda “MED 21”.
As one of the activities comprising the priority action on coastal water resource management, MAP/PAP prepared the “Guidelines for an Integrated Approach to the Development, Management and Use of Coastal Water Resources”.
In line with the priority issues and the general principles of “Agenda 21” and Agenda “MED 21”, as well as the Barcelona 1995 Euro-Mediterranean Conference, and in tandem with the activities of the Mediterranean Commission on Sustainable Development (MCSD), one of the activities of MAP/PAP was the preparation of PAP’s “Guidelines for Integrated Coastal Urban Water System Planning in Coastal Areas of the Mediterranean”.
PREFACE
xi
What are these Guidelines about?
Water management is a key factor for sustainable urban development in coastal areas. Equally, sustainable urban development along the coast is necessary for the sustainable management of the scarce Mediterranean water resources.
Coastal cities in the Mediterranean face significant problems with the management of their water. Pollution, scarcity, droughts and floods are all becoming more frequent and are leading to tensions and conflicts, both within cities and between cities and rural areas. Existing infrastructure is ageing and replacement is costly. Continuous urbanisation, especially in peri-urban areas, is making expensive demands for new infrastructure.
Urbanisation pressures are particularly intense along the coast. Numerous activities and competing uses are concentrated in a narrow zone (settlements, infrastructure, various economic activities, ecosystems, etc.). Coastal water resources have particular characteristics that merit a special approach due to the complex interaction between surface waters, groundwater and sea water.
Volume I of these Guidelines provided a conceptual framework for the integrated management and planning of the coastal urban water system. The aim of this second volume of the Guidelines is to:• Explain, describe and provide guidance on
selected implementation tasks• Expose trade-offs and possible barriers to
implementation, suggesting ways of making sound choices
In this document you will find:• A presentation of the different models of
private and public organisation of urban water utilities and an appraisal of their advantages and disadvantages (Chapter 2)
• A presentation of a comprehensive legal framework for the coastal urban water system (Chapter 3)
• An identification of information requirements and decision support tools for integrated urban water system management (Chapter 4)
• Guidance on how to develop a water demand management programme (Chapter 5).
• A presentation and appraisal of new multifunctional, technological options for water supply, wastewater and stormwater management (Chapter 6)
• An assessment of the characteristics, advantages and disadvantages of different water tariff options (Chapter 7)
• Guidance on how to develop an effective public participation programme (Chapter 8)
• Guidance on how to prepare a risk management plan (Chapter 9)
These Guidelines should be seen as a general reference tool. Detailed information on the application of each instrument should be sought in available specialised scientific literature. Appropriate references are provided in the text.
Who are these Guidelines for?The Guidelines are intended for practising engineers, urban planners, natural and social scientists and urban water managers. In particular, these Guidelines will be of use to:• policy makers at a national and urban level,
active in the field of water management, coastal management or urban planning
• public or private water utilities responsible for urban water and sewage services in coastal Mediterranean urban areas
• practitioners, academics and students in the field of urban water management
• other individuals or organisations active in urban water policy and management
Accompanying Volume I, where basic guidance is offered in an accessible and clear style, Volume II examines the related issues in greater detail. As such, it requires from the reader more commitment, and a willingness and ability to comprehend complex scientific issues. The reader who is only interested in the most important policy lessons of Volume II (and not the analysis that supports them), should refer to Chapters 4 and 5 of Volume I.
READERS’ GUIDE
xii xiii
Parts of these guidelines may be of interest to more specialised audiences:• Chapter 2 will be of interest to national
policy makers in ministries of finance, & the environment, etc. in Mediterranean countries who are evaluating the advantages and disadvantages of the privatisation of urban water services.
• Chapter 3 will be of interest to national policy makers, legislators and regulators responsible for urban water services.
• Chapters 4, 5, 6 and 9 will be of interest to specialised personnel within urban water utilities involved in water management tasks. Chapter 5 will also be of interest to national policy makers who want to develop a water demand management strategy.
• Chapter 7 relates to staff in urban water utilities or municipal / national administrations responsible for tariff setting.
• Chapter 8 will be pertinent to those in national and local administrations responsible for promoting public participation processes and will also be a useful tool for civil society organisations wishing to promote participatory processes.
Key messages
1. Public vs. private. The question of public vs. private is misleading. There are several different options with differing arrangements relating to public and private sector participation. Different models will work better or worse depending on the quality of implementation, and the features of the local context. Models from abroad should not be “imported” into Mediterranean coastal cities; local context-sensitive models should be sought instead. Privatisation is no substitute for sound regulatory pricing and funding policies. Public utilities under-perform where the public sector is weak; privatisation regulated by a weak public sector however, is no better alternative. A certain degree of autonomy of urban water utilities from the state is necessary, whether public or private.
2. Legislation. A Water Services Law and a Water Resources Law should provide the backbones of a comprehensive legal framework applicable to all utilities, public or private and if necessary, complemented by specific licenses / contracts between the state and utilities. The costs of regulation might impede implementation especially in smaller and poorer urban Mediterranean settlements with weak administrations. Over-legislation may lead to non-implementation. The Subsidiarity Principle dictates that freedom to implement should be left to the local level (handled by the
lowest competent authority, and that decisions are taken as closely as possible to the citizen), as well differentiated standards in accordance with the type of urban water system. A delicate balance must be struck to avoid weak implementation. Enforcement problems are exacerbated by the nature of water resources and infrastructure that make surveillance difficult and expensive. A key issue is the ability of public agencies to fulfil an ever-demanding regulatory role in the face of public budget and personnel policy restrictions.
3. Decision support. Urban water system planning and management should be based on a sound use of information and, whenever possible, on the utilisation of modern, advanced decision support systems befitting this purpose. Decisions should utilise an integrated toolkit of assessment instruments: economic (CBA, CEA), environmental (EIA, SEA, LCA) and multi-dimensional (MCDA, scenario analysis).
4. Demand management. Utilities should shift emphasis and efforts from supply-side to demand-side water management. There are several options for reducing water use, from better source management and improved delivery efficiency to targeted end-user programmes (retrofits, rebates, etc.). Public education and awareness and the training of users on water saving are prerequisites. A demand management plan and programme should be formulated by every utility to streamline and formalise efforts. The state has an important role to play in promoting demand management through incentive-based pricing, water-use regulations and promotion of water-sensitive urban design and sound growth policies. The exchange of information and the establishment of a demand management evaluation database at a Mediterranean level are necessary; UNEP/MAP has an important role to play in this function.
5. New technologies. There are several modern wastewater and stormwater management technologies that can benefit from natural processes or contribute to multiple functions (including water supply, pollution control and urban landscaping). These are small-scale, decentralised technologies and can be implemented in small-to-medium Mediterranean settlements, growing peri-urban areas or even in selected urban projects or facilities in bigger cities (e.g. parks, hotels, public buildings). Most technologies are commercially available and economically feasible, except where land values are very high. Application of the technologies should be embedded in urban land-use planning (water-
sensitive urban design). The regulation of standards of application and public information is necessary as some technologies involve public health risks if applied inappropriately. Economic incentives should be provided by the state to promote their adoption.
6. Water pricing. Advanced tariff systems should be designed to optimally balance efficiency, affordability, conservation and revenue goals. The design of tariffs should be based on a thorough scientific analysis of water use characteristics. Prices should be determined on the basis of forward-looking (long-term), incremental costs. Costs external to the utility should be reflected in the prices (especially those related to environmental damage). Urban water utilities should themselves be subject to a river basin charging system, preferably based on actual use. General subsidies of new infrastructure or of the price of water should be banned. Targeted subsidies of specific functions or uses can be implemented where deemed necessary on social or environmental grounds, after an explicit and transparent justification. Revenue should be tracked and unjustifiable surpluses from price increases should be controlled. Reasonable administrative costs related to more advanced price systems may need to be taken up and recovered by prices. There should be explicit measures and mechanisms to ensure affordability of water charges for low-income groups. Differentiated tariffs for different types of users, different seasons or different types of supplies should be used where relevant. The setting of tariffs should respect a process explicitly described in legislation. This process should be transparent, open to interested parties and based on participatory decision-making. Water charges and bills should be clear and understandable. Price reforms should be communicated to the public in a timely fashion. Impacts should be monitored and the transition period managed with care.
7. Public participation. Public participation should be embedded in all key decisions and stages of urban water system planning. Public participation includes but is not constrained to: access to information, public information and consultation. It extends to more direct forms of stakeholder/public engagement and input in actual decision-making through deliberation. Deliberative Inclusion Processes (DIPs) are formal decision techniques that contribute to social learning and informed agreement between participants. Public authorities and urban water utilities should experiment with the use of DIPs in real decision-making. There are several contentious issues in public
participation that will have to be appropriately settled at the local implementation level, including the selection of participants, power asymmetries between participants, participation costs and the use of scientific information.
8. Risk management. Mediterranean coastal urban water systems are facing a range of hazards such as droughts, floods and other extreme events (earthquakes, etc.). Climate change is increasing the likelihood of these hazards, while urbanisation, especially in peri-urban areas, makes populations and infrastructure more vulnerable. Risk management should be an essential component of integrated urban water systems management. Risk management includes analysis (hazards, likelihood and vulnerability), the implementation of mitigation and preparation measures and the establishment of standardised responses in the case of contingencies. Risk management requires the cooperation of the various stakeholders involved and input from the public in decisions about the acceptable levels of risk.

xv
Aquifer A subsurface layer or layers of rock or other geological strata of sufficient porosity and permeability to allow either a significant flow of groundwater or the abstraction of significant quantities of groundwater.
Coastal zone The part of the land affected by its proximity to the sea, and that part of the sea affected by its proximity to the land as the extent to which man’s land-based activities have a measurable influence on water chemistry and marine ecology.
Coastal water The surface water on the landward side of a line, every point of which is at a distance of one nautical mile on the seaward side from the nearest point of the baseline from which the breadth of terrestrial waters is measured, extending, where appropriate, up to an outer limit of transitional waters.
Combined sewer A sewer system that carries both sewage and stormwater.
Conservation (water) A socially beneficial reduction in water use or loss.
Decision support system A coordinated pool of people harnessing devices or other resources that analyses data and presents it so that users can make decisions more easily.
Ecosystem services Functions performed by ecosystems ensuring that natural cycles, processes and energy flows continue to provide an environment that supports life, including human life.
Ecosystem A biological system comprising a community of living organisms and its associated non-living environment.
Effluent Liquid discharges from sewage treatment or industrial plants.
Externality Profit or cost which is not included in the price of goods and services exchanged on the market.
Full cost of water The sum of capital, operational and external costs of water services.
Groundwater Water within geologic formations below the surface of the ground in the saturation zone and in direct contact with the ground or subsoil that can emerge at the surface through wells and springs.
Hazard A potentially damaging physical event, phenomenon and/or human activity, which may cause the loss of life or injury, property damage, social and economic disruption or environmental degradation.
Land-use plan A plan that allocates social and economic activities in the urban space.
Marginal cost The incremental cost of producing an additional unit of a good or service.
Master Plan A long-range (10-20 years) planning document with strategic and action elements.
Potable (water) Water safe or suitable for drinking.
Privatisation The permanent or temporary sale of parts of urban water systems to private entities.
Risk The probability of harmful consequences, or expected losses resulting from interactions between natural or human induced hazards and vulnerable conditions.
River basin The area of land from which all surface run-off flows through a sequence of streams, rivers and
GLOSSARY
xvi 1
1.1 WHY INTEGRATED URBAN WATER SYSTEM MANAGEMENT IN MEDITERRANEAN COASTAL AREAS?
In the coastal regions of Mediterranean countries, 61% of the population lives in urban areas (Blue Plan, 2001). This population is likely to grow considerably in the future. Water is a vital element for city life. Its supply is crucial for the health and wellbeing of the people, for the urban landscape and for the environment. Water also constitutes an essential input to economic production and development.
Water management in most urban areas is governed by an outdated engineering paradigm developed in the early 20th Century. In this linear model, water is drawn from other areas, with distance being no object, treated, distributed and then disposed of together with stormwater, quickly and far away from the city. This model has assumed abundant water resources, ever-rising demand and the ability to collect, treat and dispose of any amount of storm or polluted waters. It has relied on large infrastructures such as reservoirs, distribution and drainage pipes, expanded, when necessary, to accommodate growth in the urban area.
These centralised water supply and wastewater disposal processes saved many lives by improving drinking water and sanitation services. Conditions have changed, however, and the limits of this linear model have been reached in many Mediterranean urban areas due to:• An increasing frequency of extreme climatic
irregularities and events such as droughts and floods, with negative impacts
• The growing demand for water, which in many cities reaches the limits of developed sources
• The rising, often prohibitive, cost for new water supply works such as dams or transfer systems
• Intensifying reaction against the environmental impacts of large hydraulic infrastructures and a growing interest in the maintenance of “environmental flows”
• The significant percentage of water lost in storage and transport coupled with the high and rising cost of replacing and renewing aged infrastructure
• The pollution of drinking water sources by industry, agriculture and domestic sewage causing some notable failures of urban mains supplies and public health epidemic.
• The deteriorating aquatic environments resulting from water supply works, drainage interventions or wastewater discharges coupled with an increasing international and local social interest in the ecological, recreational and aesthetic values of water.
• The rising cost of extending infrastructure systems to expanding outer suburbs.
Coastal cities in particular face special problems. Intensifying urbanisation, urban sprawl in peri-urban areas and the growth of tourism further stress the limited coastal water resources. The over-abstraction of groundwater causes seawater intrusion, land subsidence and damage to terrestrial and aquatic coastal ecosystems. Having to transport their water from afar, coastal cities are often responsible for impacts on distant hinterland users and environments. Located at the downstream end of river basins, they suffer the impacts of upstream pollution, abstractions or storm overflows. Coastal cities are often close to important ecological sites (delta estuaries, wetlands, etc.) and wastewater effluent discharges from cities contribute to the deterioration of these sensitive coastal environments etc.
Urbanisation and economic development bring pressure to bear on water resources and the aquatic environment. In turn, the impacts from these pressures are threatening the long-term sustainability of urban development (Figure 1.1). Responses to problems fail because they focus on remedial action at the impact side. An integrated approach is needed in order to jointly address both the roots and the impacts of problems encountered (Figure 1.1).
A short-sighted focus on operational aspects of the infrastructure inhibits the implementation of such an integrated, multifaceted response. In urban water management as currently practiced, there is scant concern for the broader interdependencies between water resources, land, ecosystems and society. New technologies with multiple environmental, economic and social advantages are now available. Their adoption, however, is inhibited by sectoral
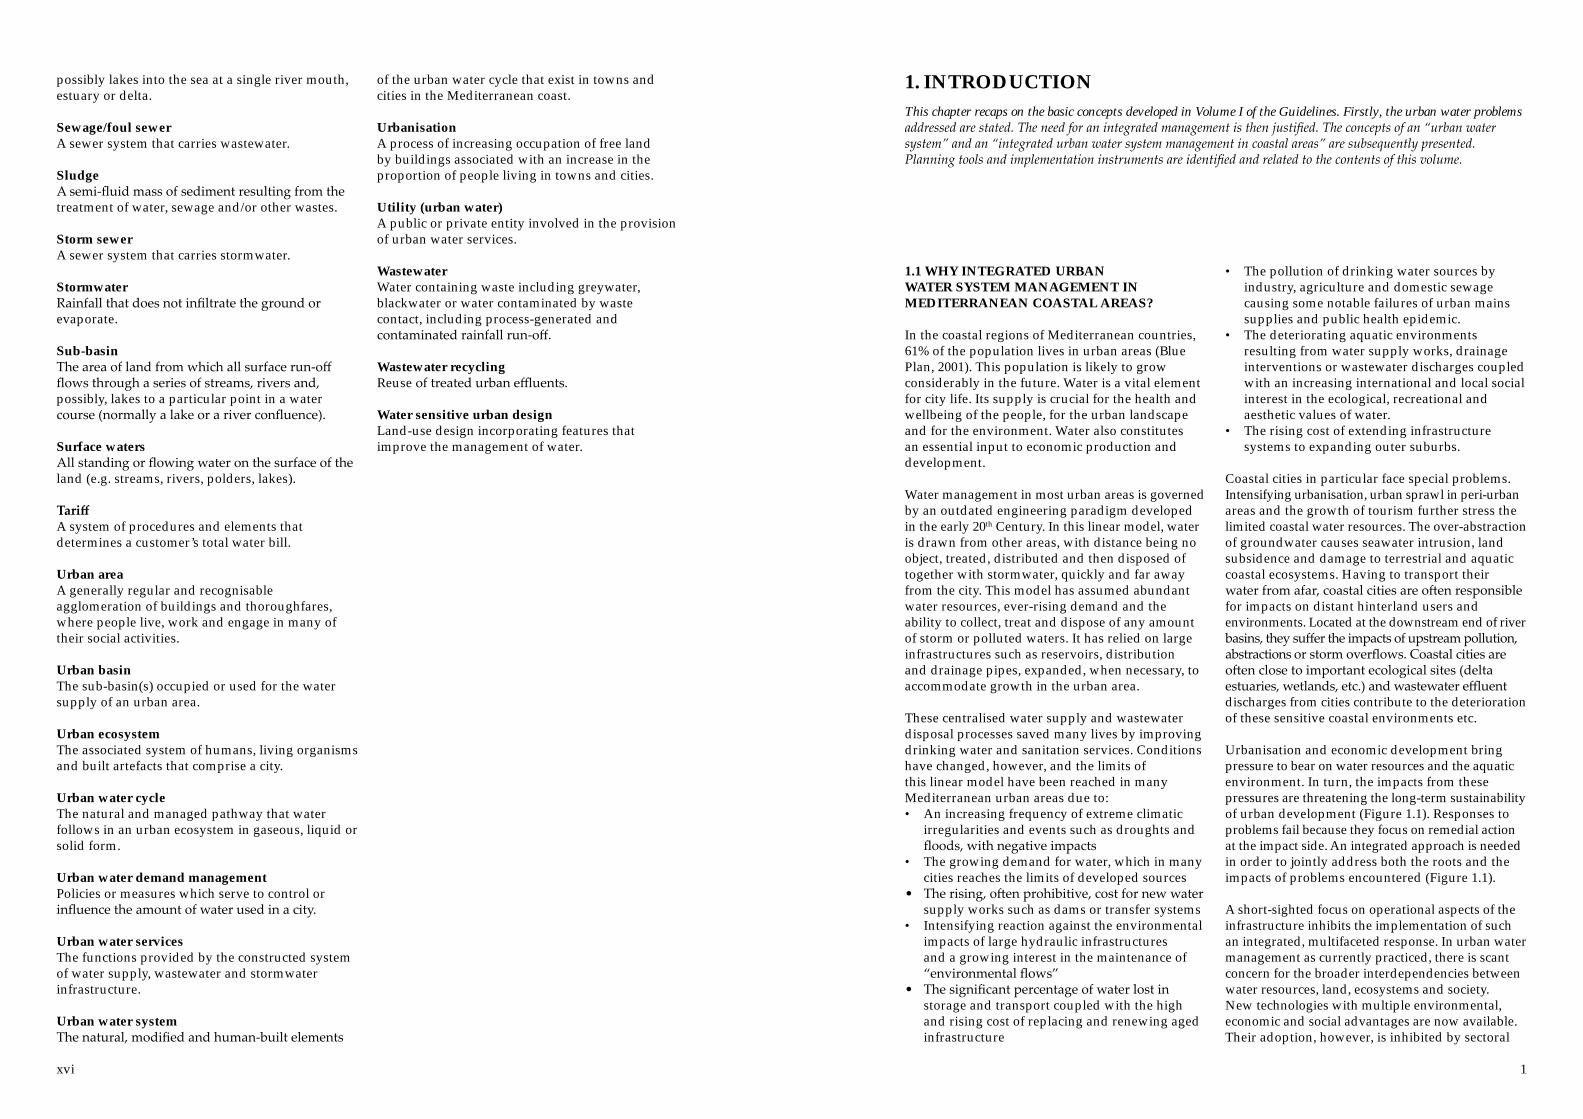
possibly lakes into the sea at a single river mouth, estuary or delta.
Sewage/foul sewer A sewer system that carries wastewater.
Sludge A semi-fluid mass of sediment resulting from the treatment of water, sewage and/or other wastes.
Storm sewer A sewer system that carries stormwater.
Stormwater Rainfall that does not infiltrate the ground or evaporate.
Sub-basin The area of land from which all surface run-off flows through a series of streams, rivers and, possibly, lakes to a particular point in a water course (normally a lake or a river confluence).
Surface waters All standing or flowing water on the surface of the land (e.g. streams, rivers, polders, lakes).
Tariff A system of procedures and elements that determines a customer’s total water bill.
Urban area A generally regular and recognisable agglomeration of buildings and thoroughfares, where people live, work and engage in many of their social activities.
Urban basin The sub-basin(s) occupied or used for the water supply of an urban area.
Urban ecosystem The associated system of humans, living organisms and built artefacts that comprise a city.
Urban water cycle The natural and managed pathway that water follows in an urban ecosystem in gaseous, liquid or solid form.
Urban water demand management Policies or measures which serve to control or influence the amount of water used in a city.
Urban water services The functions provided by the constructed system of water supply, wastewater and stormwater infrastructure.
Urban water system The natural, modified and human-built elements
of the urban water cycle that exist in towns and cities in the Mediterranean coast.
Urbanisation A process of increasing occupation of free land by buildings associated with an increase in the proportion of people living in towns and cities.
Utility (urban water) A public or private entity involved in the provision of urban water services.
Wastewater Water containing waste including greywater, blackwater or water contaminated by waste contact, including process-generated and contaminated rainfall run-off.
Wastewater recycling Reuse of treated urban effluents.
Water sensitive urban design Land-use design incorporating features that improve the management of water.
1. INTRODUCTIONThis chapter recaps on the basic concepts developed in Volume I of the Guidelines. Firstly, the urban water problems addressed are stated. The need for an integrated management is then justified. The concepts of an “urban water system” and an “integrated urban water system management in coastal areas” are subsequently presented. Planning tools and implementation instruments are identified and related to the contents of this volume.

2 3
and fragmented responsibilities. The inability to address problems is due to the limited domain of the agencies responsible for urban water services and the presence of several fragmented and conflicting competencies dealing with the various aspects of the urban water system.
In order to combat urban water problems, the existing linear, reactive and fragmented management model is no longer sufficient. The need exists to develop new approaches, structures, processes and instruments that can take into account the intimate functional links between the various parts of the urban water cycle and between the urban water cycle and the interdependant development and environmental processes in urban areas, the river basin and the coast.
1.2 THE URBAN WATER SYSTEM IN COASTAL AREAS
Integration requires that the coastal urban water system be managed as a whole.
Urban water systems are the natural, modified and human-built elements of the urban water cycle that exist in towns and cities on the Mediterranean coast (Figure 1.2).
The natural system includes the network of streams, rivers, groundwater, seawater, wetlands, estuaries, coastal and marine areas. The built system includes the network of water supply reservoirs, treatment plants, pipes, concrete channels, drains and outfalls (PCE, 2000) (Box 1.1). This built system is part of the broader urban infrastructure. Water services are the functions provided by the built system of water supply, wastewater and stormwater infrastructure.
The urban water cycle includes the natural hydrological cycle, but is not confined to it. It also includes urban water flows from the provision of freshwater and the collection and treatment of wastewater and stormwater through the modified and artificial systems (Figure 1.3). The cycle begins with precipitation falling on the basin of the urban area and its water sources. Water is extracted from natural streams, aquifers or other sources, usually stored in reservoirs, and then processed to potable quality before delivery through an extensive pipe system to residential, commercial (including tourism-related) and industrial developments. Used water serves to transport wastes through a network of sewers to treatment plants which process water and discharge cleaner effluent into receiving waters. Rainfall contributes to the urban basin’s stormwater that is collected by an extensive
drainage system for disposal (treated or untreated) into receiving waters (Coombes and Kuczera, 2002).
Water is not the only element circulated through the urban water system. Other nutrients (in particular carbon, nitrogen, phosphorous and potassium) enter it, basically as digested food, and are transferred via the wastewater treatment plant or directly by surface run-off to the receiving water body (Butler and Maksimovic, 2001).
The urban water system interacts with its surrounding natural and social environment. In coastal areas, this includes: 1. the river basin 2. the coastal zone 3. the broader urban area
The river basin (also referred to in literature as “catchment” or “watershed”) is ‘the area of land from which all surface run-off flows through a sequence of streams, rivers and, possibly, lakes into the sea at a single river mouth, estuary or delta’. This includes “coastal waters”, i.e. surface brackish or sea water at a distance of one nautical mile from the sea front (CEC, 2000).
The coastal zone is the “part of the land affected by its proximity to the sea, and that part of the sea affected by its proximity to the land, as the extent to which man’s land-based activities have a measurable influence on water chemistry and marine ecology” (US CMSER, 1969).
An urban area refers to a concentration of people in a comparatively small area, characterised by a great diversity of related activities with a high frequency of interaction and by a physical form showing a concentration of a variety of built-up and un-built spaces (Hengeveld and de Vocht, 1982).
Figure 1.4 graphically illustrates the interrelation between the four systems.
The urban basin (elsewhere referred to as “urban catchment”) is the hydrological basin of the urban area, including its coastal waters. It provides a functional unit through which to address integrated urban water management in coastal areas.
Furthermore, the urban area and its water system, the river basin and the coast are all subsets and interact with larger regional, national and global social and natural systems. For example, global climatic changes affect the local availability of water. Conversely, energy consumption for the urban water supply contributes to global climate change.
Figure 1.2The urban water system
Figure 1.1 Driving forces, pressures, state and impacts on urban water resources and the need for an integrated approach
BOX 1.1ELEMENTS OF THE COASTAL URBAN WATER SYSTEM
• Drinking water sources • Drinking water production infrastructure • Distribution and storage infrastructure • Urban water uses • Stormwater drainage infrastructure • Stormwater overflow, disposal and treatment infrastructure • Sewage system • Wastewater treatment units and outfalls • Reuse infrastructure• Receiving waters and coastal sea • Urban surface and groundwaters • Channels, weir, intake and/or pumping stations, etc. • Estuaries, deltas, wetlands and coastal marine resources, etc.

4 5
1.3 INTEGRATED URBAN WATER SYSTEM MANAGEMENT IN COASTAL AREAS (IUWSMCA)
Integrated Urban Water System Management in a Coastal Area (IWSMCA) is a process which promotes the coordinated planning, development and management of water, land and related physical and human resources in coastal urban areas in order to maximize the resultant social and economic welfare in a fair manner and without compromising the sustainability of vital ecosystems (after GWP, 2000).
Conventional urban water management is only concerned with the built system and the provision of water services. This is typically the responsibility of one or more public or private water utilities. Each part of the infrastructure and its related service (drinking water supply, sewage collection/treatment/disposal and drainage) is separately managed. Different functional units of one utility or different utilities may operate each service or part of it.
Integration demands a progressive expansion of the “boundaries” of the managed system to
include the entire coastal urban water system. Figure 1.5 schematically depicts the desired extension of the boundaries of the urban water system beyond its conventional domain to encompass issues such as the sharing of resources with other users in the basin, land-use management in the river basin and the urban area, sea water quality and the protection of marine and coastal ecological resources, etc.
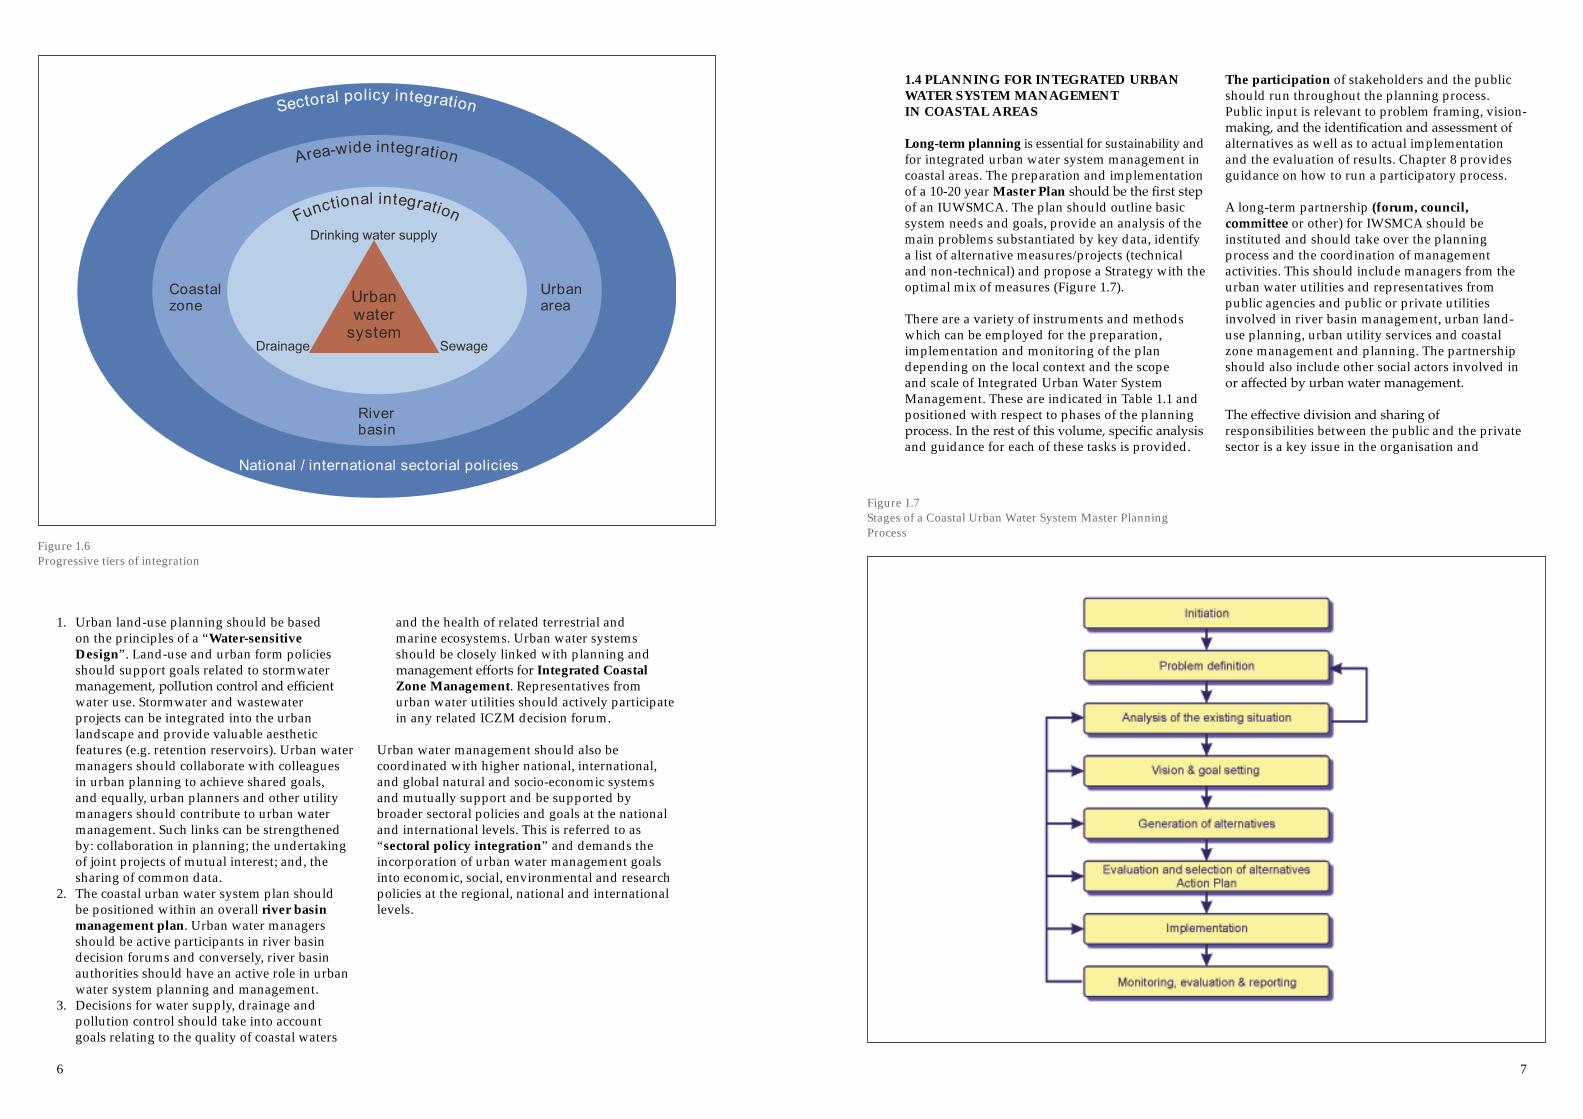
Extending the management boundaries entails three progressive tiers of integration (Figure 1.6).
The core, first tier of integration concerns the “functional integration” of the management of the different water infrastructures and services (water supply, wastewater and drainage). Options for the merging of utilities responsible for water supply, wastewater and drainage should be considered where economically and managerially feasible and beneficial.
IUWSMCA, however, goes further than functional (infrastructural and service) integration. It demands an extension of the conventional domain of the responsibilities of utilities to include factors previously considered as “external”. Such
factors include the wellbeing of the environment and other communities in the source areas, the contribution to alternative, environmentally-resourceful and sustainable urban development patterns, the protection of sea waters, marine resources and recreational activities and even regional economic development. This is referred to
as an “area-wide” integration and demands links with planning and management processes in the three interacting systems of Figure 1.3, i.e. urban land-use planning and development management, river basin planning and management and coastal zone planning management. More specifically, area-wide integration requires that:
Figure 1.3 A schematic of the urban water cycle (modified after PCE, 2000)
Figure 1.4 The interfaces between the urban water system, the river basin, the city and the coast
Figure 1.5 Conventional coastal urban water system boundaries and direction of extension (in arrows)
6 7
1.4 PLANNING FOR INTEGRATED URBAN WATER SYSTEM MANAGEMENT IN COASTAL AREAS
Long-term planning is essential for sustainability and for integrated urban water system management in coastal areas. The preparation and implementation of a 10-20 year Master Plan should be the first step of an IUWSMCA. The plan should outline basic system needs and goals, provide an analysis of the main problems substantiated by key data, identify a list of alternative measures/projects (technical and non-technical) and propose a Strategy with the optimal mix of measures (Figure 1.7).
There are a variety of instruments and methods which can be employed for the preparation, implementation and monitoring of the plan depending on the local context and the scope and scale of Integrated Urban Water System Management. These are indicated in Table 1.1 and positioned with respect to phases of the planning process. In the rest of this volume, specific analysis and guidance for each of these tasks is provided.
The participation of stakeholders and the public should run throughout the planning process. Public input is relevant to problem framing, vision-making, and the identification and assessment of alternatives as well as to actual implementation and the evaluation of results. Chapter 8 provides guidance on how to run a participatory process.
A long-term partnership (forum, council, committee or other) for IWSMCA should be instituted and should take over the planning process and the coordination of management activities. This should include managers from the urban water utilities and representatives from public agencies and public or private utilities involved in river basin management, urban land-use planning, urban utility services and coastal zone management and planning. The partnership should also include other social actors involved in or affected by urban water management.
The effective division and sharing of responsibilities between the public and the private sector is a key issue in the organisation and
1. Urban land-use planning should be based on the principles of a “Water-sensitive Design”. Land-use and urban form policies should support goals related to stormwater management, pollution control and efficient water use. Stormwater and wastewater projects can be integrated into the urban landscape and provide valuable aesthetic features (e.g. retention reservoirs). Urban water managers should collaborate with colleagues in urban planning to achieve shared goals, and equally, urban planners and other utility managers should contribute to urban water management. Such links can be strengthened by: collaboration in planning; the undertaking of joint projects of mutual interest; and, the sharing of common data.
2. The coastal urban water system plan should be positioned within an overall river basin management plan. Urban water managers should be active participants in river basin decision forums and conversely, river basin authorities should have an active role in urban water system planning and management.
3. Decisions for water supply, drainage and pollution control should take into account goals relating to the quality of coastal waters
and the health of related terrestrial and marine ecosystems. Urban water systems should be closely linked with planning and management efforts for Integrated Coastal Zone Management. Representatives from urban water utilities should actively participate in any related ICZM decision forum.
Urban water management should also be coordinated with higher national, international, and global natural and socio-economic systems and mutually support and be supported by broader sectoral policies and goals at the national and international levels. This is referred to as “sectoral policy integration” and demands the incorporation of urban water management goals into economic, social, environmental and research policies at the regional, national and international levels.
Figure 1.6 Progressive tiers of integration
Figure 1.7 Stages of a Coastal Urban Water System Master Planning Process

8 9
management of coastal urban water services. The issue of privatisation is often central to debates on the reform of urban water services. Chapter 2 aims to clarify some of the underlying issues and trade-offs in the privatisation debate and carves out some directions for effective reforms applicable to the reorganization of urban water utilities and services in the Mediterranean region.
IWSMCA requires a comprehensive legal framework. Regulation is also a prerequisite for the effective operation of a utility, whether private or public. Chapter 3 describes the main features of such a legal framework and the basic areas that should be regulated.
2.1 THE PUBLIC VS. PRIVATE DEBATE
The majority of urban water utilities in Mediterranean coastal areas are publicly owned and managed (state or municipal). Since the 1980s, the trend is towards a greater involvement of the private sector. Public utilities are criticised as inefficient and overmanned, lacking in innovation and unable to finance the rising investments needed for water and sewage services. Three interrelated explanations have been given for this “failure” of the public sector in the provision of utilities (Box 2.1).
Proponents of private involvement emphasise efficiency benefits, reduction of service costs and lower-cost access to capital following privatisation.
However, the undertaking of urban water services by governments in the late 19th and early 20th Centuries was a response to what was perceived as the failure of early private urban water companies (Box 2.2). It was mainly through public management that full service standards in most cities of the developed world have been achieved.
A historical trend, experienced to a lesser or greater extent in individual countries, is a cyclical change between public and private forms of utility ownership and management (Figure 2.1) with an overemphasis on one form or another. In the first half of the 20th Century,
most governments in the Western World took over the responsibility for water services from private service providers. The goal was to protect citizens from the failures of the private sector, i.e. high prices and monopoly abuses, and to provide universal access to all.
Since the 1980s, the declining efficiency of the public sector (real or perceived), has kick-started trends showing a return to the private sector and an increase in private involvement worldwide.
A more critical stance towards privatisation, however, has been manifested in recent years, as compared to the ‘80s and early ‘90s. Monopoly abuses and under-investment in public functions (real or perceived) have triggered a public outcry against privatisation in some cities (Hall, 2001). Tougher government regulation and declining profit opportunities have caused private companies to withdraw interest from some cities whereas citizen opposition or political changes have halted the privatisation process in others (including cities in the Mediterranean region). As a result, the growth of private involvement in the water industry worldwide has slowed down (Hall, 2003).
2. URBAN WATER UTILITIES: PUBLIC AND PRIVATE MODELSThis chapter presents the alternative public-private management options for coastal urban water utilities. Firstly, the generic advantages and disadvantages of public and private organisation are discussed. Alternative models, public, private or mixed are then presented, appraised and compared against different criteria. This is followed by a discussion of the advantages and disadvantages of aggregate vs. disaggregated water industry structures. The chapter concludes with an identification of some basic principles for an effective organisational model.
Initi
atio
n
Ana
lysi
s
Prob
lem
id
entifi
catio
n
Goa
ls
Ass
essm
ent/
Act
ion
Plan
Impl
emen
tatio
n
Mon
itori
ng &
Ev
alua
tion
Cha
pter
in
Volu
me
II
InformationData management + + O + 4Database + + “Decision Support Systems + + O + + “Simulations + O O + + “Scenario Analysis + + + “Forecasts + + O “AssessmentEnvironmental Impact Assessment + + + 4Strategic Environmental Assessment + + + “Cost-Benefit Analysis + + + + “Scenario Analysis + + + O “Risk analysis O + + + 9Conflict resolution + O + + + O 8Life Cycle Assessment + O + “Assessment and ReportingSustainability Indicators O O + 4Benchmarking O O + 4ImplementationTechnologies (water demand) + 5Technologies (water cycle) + 6Standards + + O 3Zoning / Protected Areas + + O 3Economic Instruments + + O 7Awareness O + + O 8Participation O + + + + O 8
Table 1.1 IUWSMCA tools
+ most useful O useful
BOX 2.1REASONS FOR PUBLIC UTILITY FAILURE (Rees, 1998)
1. Public utilities are insulated from the competitive incentives found within free labour, capital or product markets; hence the lack of innovation and efficiency.
2. Public utilities are subject to the demands of special interest groups and to short-term political interventions.
3. Public utility managers can pursue their own interests rather than the public interest because the ultimate owners – the taxpayers – have few effective mechanisms to control them and to signal their requirements or their dissatisfaction with management.

10 11
2.1 PUBLIC, PRIVATE AND MIXED MODELS
The arguments of both the proponents and opponents of privatisation revolve around the generic factors presented in and Box 2.2. Analysis can advance by refining the epic vocabulary of “private” vs. “public”, recognising that there are different models with varying mixes of public and private elements. There are several operations in an urban water system (Figure 2.2) and even in public utilities, many of the non-core operations are typically provided by private entities.
“Privatisation” generally refers to the transfer of responsibilities in the management of urban water services from public to private entities. Figure 2.3 identifies four models of private involvement on the basis of three criteria: service responsibility, operational responsibility and legal status of operator). “Corporitisation” does not involve the private sector but resembles it (see text on “corporatised utilities” below).
Figure 2.4 provides an alternative classification of organisational models on the basis of two criteria:
ownership and management of assets. Six main classes emerge, from the more public (bottom left) to the more private (top right) (Box 2.3).
Several combinations of the above generic models can be found. For example, a PLC or a corporatised utility may operate under a concession or management contract with the government. Functional and spatial disaggregation may lead to several possible combinations whereby one part of the infrastructure is government-owned (e.g. reservoirs or drainage pipes) and another (e.g. the distribution network) is owned or delegated to a private company or a PLC. The term “Public-Public Partnership” (Hall, 2003) has been used for such schemes where autonomous public utilities are delegated services under contracts, the government retaining ownership or responsibility for the financial investment in the maintenance of assets.
Figure 2.2 Core and non-core operations in urban water systems (Kraemer 1998, as modified by Hukka and Katko, 2004)
Figure 2.1 The cycle of change between private and public control (Kraemer, 1998)
BOX 2.2REASONS FOR PRIVATE SECTOR FAILURE (Rees, 1998)
1. Most water services (with the exception of non-core activities such as construction, plumbing, etc.) are not naturally competitive. They are local network monopolies. For example, it is cost prohibitive to provide a competitive distribution or sewage network. Private monopolies are not more efficient or responsive to customer demands than public ones. Water is a basic service with a low responsiveness of consumer demand to price (especially for basic consumption); unless regulated, the private profit motive may lead to monopoly abuse.
2. Water and sanitation services involve the provision of public goods (goods that provide benefits to communities in general rather than individual consumers; e.g. sewage collection and treatment) and merit goods (goods that a particular society considers should be provided
irrespective of whether individuals are willing to pay for them; e.g. water for hygiene purposes) (Rees, 1998). Public interest may also require the provision of some water infrastructure for development purposes independently of whether they are profitable in the short-term. Private companies are not social services and they will not spontaneously undertake to finance socially beneficial investments.
3. The water industry is capital intensive with high risks. The margin for private profits is low, especially in smaller utilities or in low-income areas, making them unattractive to private investors. Reducing exposure to risk and increasing the profitability of the private companies may entail trade-offs with government regulation against monopoly.

12 13
2.3 AN APPRAISAL OF DIFFERENT MODELS
Rather than comparing the models generically, it is better to compare them in terms of how their characteristics fit in with specific water management goals. These include:
• efficiency (competition and pricing)• funding• social and environmental protection• transparency and democratic control• contribution to integration
A further factor to consider is the regulatory demands (and costs) of each model.
Figure 2.3 Typology of private involvement in urban water services (Kraemer, 1998)
Figure 2.4 A taxonomy of public-private organisational models (modified from Blockland et al, 1999)
BOX 2.3PUBLIC AND PRIVATE ORGANISATIONAL MODELS
Fully public utilities include the archetypal types of: • government water service departments • “regies” (internal municipal government entities
but with a defined and separate set of accounts) • more independent publicly owned, public
law utilities (typically municipal and rarely provincial or state-based)
Corporatised utilities refer to public law companies that resemble private companies in terms of managerial independence and flexibility. These models are typically prevalent in the Mediterranean and are likely to remain so, especially in smaller urban settlements.
At the other extreme are the private limited companies. In England and Wales, water services are provided by fully privatised water utilities with ownership of infrastructure assets and with full responsibility for all operations, maintenance, fundraising and investment. This is the only instance in the world (except for one utility in Thailand) of a “financial privatisation” through full divestiture (Figure 2.3); hence often referred to as the “U.K. model”. Small private water undertakings for water supply operate in many developing countries (often at the neighbourhood level), but are rare in Mediterranean cities.
Public Private Partnerships (PPPs) are organisation models where ownership of the system (or part of it) remains in public hands and its operation (or part of it) is delegated to private entities. In a concession, the government grants a long-term contract, usually of over 25 years, to a private company, which is responsible for capital investment, operations and maintenance. The longer the contract, the more the concession approximates a divestiture.
A lease is a long-term contract (usually lasting 10-20 years, but it can be longer) according to which the private sector is responsible for operations and maintenance and sometimes for asset renewals. Assets remain in public sector control and major capital investment is a public responsibly.
BOT (build – operate – transfer) and BOO (build, operate and own) contracts are issued for the construction of specific items of infrastructure, such as bulk supply reservoirs or treatment plants. The private sector is responsible for all capital investment and owns the assets until they are transferred to the public sector. In BOO schemes, private ownership is retained.
Management contracts are short-term (typically of five years’ duration) under the terms of which private firms are only responsible for operations and maintenance.
Service contracts are single function contracts to perform a specific non-core service for a fee, e.g. install meters (Rees, 1998). Municipal concessions, leases and management contracts to private companies have a long history in France and are often referred to as the “French” model.
Public limited companies (PLCs – state or municipal) are another form of partnership between public and private models. PLCs have a corporate structure with a managing director and a board of directors. Unlike the corporatised utilities, they are commercial business operating under private (company) law. Unlike a private company however, their shares are owned by government (local, provincial or national). Minority private shareholding is possible. The most well known variants of this model are found in the Netherlands and Scandinavia (Hukka and Katko, 2004).
A model that has received less attention is this of cooperatives. These are enterprises owned and controlled by the users of the goods and services provided. Users can be consumers, employees (e.g. trade unions) or producers of products and services. In most cooperatives, users are actively involved in aspects of management and decision-making. In OECD countries, this model is most widely used in rural areas (e.g. in Denmark and Finland). In developing countries, the model is widespread, particularly where communities organise their water supply themselves.

14 15
The comparison below shows that there are no “fixed” public or private models. Changes can be introduced to improve the performance of an organisational model with respect to the above goals. Nevertheless, some trade-offs may have to be made between different goals.
2.3.1 Competition
Economic efficiency depends on competition. Core water services are natural monopolies and direct competition is limited. There are two basic ways to induce competition:• Contract competition: whereby private
operators compete to win (or maintain) a contract (concession, lease, management contract, etc.).
• Surrogate competition: whereby the efficiency (or broader performance) of utilities is statistically compared with respect to specific targets (“yardstick” competition) or one against the other (“benchmarking”). Performance is then linked to certain rewards (e.g. prices and profit allowance).
In theory, organisational models based on contracts (PPPs) should increase efficiency since companies will bid against each other to win a contract. In reality, however, this is not always the case because:1. The global water industry market is restricted by
the dominance of a small group of multinational players who often form risk-reducing consortia. For some concessions, only one bid may be available (Rees, 1998). In order to attract investors, especially in the case of smaller systems, governments may have to dilute regulatory requirements. This involves trade-offs with efficiency (anti-monopoly) incentives.
2. Once a private company wins a concession, it gains internal knowledge of the system and has more power and information over competitors to regain the contract once it expires. Additionally, the government forfeits the ability (staff, expertise) to claim back the system.
3. Contract performance targets may not suffice to control monopoly abuse. Conditions change and targets may have to be renegotiated within the period of the contract, without the benefit of competition.
Shorter-term (leases, management) contracts are more flexible and allow increased (and more frequent) competition than longer-term concessions. Local private companies have more opportunities to compete. However, because of the higher risk of shorter-term contracts, guarantees have to be given to contractors; these may trade-off with regulatory goals.
Divested, fully private utilities face some capital competition (i.e. a potential takeover by competitors). This, however, only provides incentives for profitability and is not enough to control monopoly abuses. Surrogate competition can link rewards and profits to a broader assessment of efficiency in the achievement of regulated performance standards.
There is no reason, however, why surrogate competition should be applicable only to private utilities and not to public utilities. For example, PLCs in Netherlands, Germany and Austria are subject to volunteer benchmarking systems based on standard accounting systems and service indicators (Kraemer, 1998, Blockland et al, 1999). A main benefit to public utilities of good performance is prestige. In addition, if the assessment process is credible, good ratings can influence the cost of capital (i.e. secure increasing credibility with respect to bank loans). Potentially, performance can be linked to special government benefits (e.g. tax exemptions) and the determination of prices.
Even if subject to surrogate competitive incentives, majority-public utilities may be disadvantaged over private counterparts in achieving efficiency, because:1. The prestige incentive is weaker than the profit
incentive. Even if prestige is connected to revenue, in public utilities such incentives may not reach managers and personnel. Personnel policies in the public sector are more rigid and salaries are not linked to performance.
2. Private companies are free from efficiency-distorting government intervention and are subject to pressure to improve from shareholders and takeover competitors.
3. Private companies, especially if part of multinationals, have access to world-class technical expertise (e.g. bringing in best practice or experienced managers from other countries) and to economies of scale (e.g. by sharing tasks such as planning, accounting, PR, research and data analysis with ventures around the world).
Nonetheless, public models also have certain advantages:1. Personnel policies need not be rigid in the public
sector, especially in corporitised utilities or PLCs. 2. The degree of independence of public
or corporatised utilities depends on the willingness of governments. Clearly defined and legally enforceable utility charters, contracts, rate setting processes, separate accounting systems, independent personnel selection procedures, etc. can act to reduce direct government interference. In PLCs, minority private shareholding can guarantee external control and some efficiency “pressure”.
3. Local public companies tend to have a more extensive, accumulated knowledge of the system. Mixed PLCs can also benefit from the technical expertise of minority private shareholders.
2.3.2 Economic efficiency
The overall economic efficiency of water management relates to the degree of subsidies vs. cost recovered from charges (see also Chapter 7). The question of cost recovery and rate-setting is a matter of government policy and does not relate to the structure of the utility as such. In practice, however, there has been a causal link between privatisation (divestitures or concession/lease contracts) and shifts from subsidised to cost-recovering prices. The reason is that cost recovery is desirable in privatisation; it limits dependence on the state and reduces revenue risk to private investors. On the other hand, guarantees for full cost recovery reduce the pressure on private companies to provide services at least cost, and thus act against efficiency (Rees, 1998).
Subsidisation is common in public utilities. There is nothing that prohibits régies, corporatised utilities, cooperatives or PLCs from recovering costs, however. For example, the public cooperative of the city of Santa Cruz in Bolivia and the public utility of the city of Porto Alegre in Brazil (see below), are financially independent and recover all costs from water users. Régies, and PLCs in the Netherlands also operate on a full-cost recovery basis (Blockland et al, 1999).
Privatisation does not necessarily put an end to subsidies. In many cases, the private sector has enjoyed significant financial support from public authorities, including debt write-off prior to privatisation, cash contributions during the construction period and subsidies during the operating period in the form of non-refundable grants or favourable tax regimes (Hall, 2001). Additionally, governments and municipalities usually expect privatisations to boost their funds, by using the proceeds of a sale to reduce debts or deficits. This may clash, however, with the financial needs of the water service itself. The price that a company is willing to pay to obtain a contract will depend on the expected profit stream, which in turn will be affected by the price it charges users, and how generous conditions, such as regulation, end up being. Thus water users may indirectly cross-subsidise government finances and debt reduction (Hall, 2001).
Among public utilities, cross-subsidisation is common (e.g. water revenues are commonly used to support municipal finances). In public utilities as government departments with joined accounting systems, this is unavoidable.
The separation of accounting systems (régies, corporatised utilities) or the formation of a PLC is a way of halting, or at least of tracking, such cross-transfers. Internal cross-subsidisation between operations is also possible in private multi-utilities or multinationals (i.e. water charges raised to pay for losses in other activities). Transparent and monitored accounting systems can reduce this, but some indirect forms of cross-subsidisation (e.g. time spent by top management in other operations) remain difficult to control.
2.3.3 Funding
Funding from the private sector is sought to relieve the public budget from increasing water infrastructure investment needs. The private sector, however, does not itself pay for the investments. Nor do “governments” pay the cost when they subsidise water services. Ultimately, it is always citizens that end up paying the cost through charges or taxes (Figure 2.5). The issue concerns (Hall, 2001): • when (now or the future) • how (user charges or taxes)• who pays (the extent of cross subsidisation,
within the city, and between urban and other citizens)
Table 2.1 shows a simple categorisation of potential sources of funding. In principle, public sector water undertakings can raise funds to finance investment from the same range of sources as private companies. The one form of funding not available to public sector undertakings is equity finance from private shareholders. In some cases this might be an attractive option; in others, it might be more expensive than debt borrowing (Hall, 2001).
Although some early calls in favour of water privatisation referred to the ability of the private sector “to finance the substantial investments needed”, what the private sector now claims is that it can only offer access to more sources of funding and access to “money at a lower cost”. The cost of external funding resources will depend on performance standing and the credibility of the utility. Generally, private undertakings are more credible within financial markets and it is easier to secure loans from banks. Effective public undertakings however, such as the PLCs in the Netherlands, can also have a strong enough performance record to enable them to secure commercial bank loans (Blockland et al, 1999). The restructuring of a fully private regional utility in Wales in 2001 into a not-for-profit corporation owned by its members, and prohibited in its articles of incorporation from diversifying, reduced the company’s risk rating and improved its credit rating resulting in a lower cost of

16 17
capital. The credibility of public undertakings can increase through clear accounting systems and the establishment of an investment (financial, assets) plan (Chapter 4, Volume I).
Nonetheless, in practice, some banks may be more reluctant to finance a reformed public utility before strong evidence of improvement and autonomy is available. Gaining credibility however, may be a long process, while investment needs may be immediate. By comparison, a privatised utility (especially if owned or managed by a credible multinational) can enjoy more direct access to loans and international funds.
Internal sources of finance (i.e. revenue from service charges) can also be an important source of funding. Pricing policies do not in principle depend on whether the operator is public or private (see discussion about cost recovery above). State-controlled utilities may be more reluctant to increase water prices to avoid “political cost”. On the other hand, rising prices may be also
very difficult for private utilities to implement, especially if increases affect the access of the poor to water and are perceived as monopoly abuse. Public protests have inhibited price increases in some parts of the developing world (Hall, 2003).
2.3.4 Social and environmental services
These include water use efficiency, environmental protection, and the provision of services to the poor and relate to the provision of public and merit goods (see Box 2.2). Overall management performance and financing will also affect the delivery of social or environmental services. For example building a new a new urban wastewater treatment plant that will reduce pollution or extending the sewage network to the poorer neighbourhoods of the city will need substantial investment and will depend on the technological/administrative capacity and operation of the water utilities.
Better operations and more funds, however, do not necessarily lead to better provision of environmental and social services. Regulatory changes following a change in ownership or management may act counterproductively against investment in the provision of social/environmental services.
An illustrative example is provided by the following: the partial privatisation of the water utility serving the city of Athens was accompanied by a State commitment to undertake any future exceptional costs relating to droughts or source expansion (such as building a new reservoir). This clause was introduced to improve the financial indicators of the private water utility and to make it attractive to private investors. By doing so however, the utility has a limited incentive to invest in water efficiency. Water efficiency programmes will increase its operational costs (e.g. leakage reduction or demand management programme operational expenditures) and/or reduce its revenue (decreased sales from demand management), while in any case, it will not itself bear the burden of the future costs of escalating water use (e.g. the costs of capital investment in expanding infrastructure or additional drought costs) (Kallis and Coccossis, 2003).
In public utilities, the direct involvement of the government in theory ensures the protection and provision of social/environmental services. On the other hand, this proximity of regulator and regulated has the drawback that standards may be more easily breached. The assumption that the government will always act to provide public/merit goods neglects the fact that in many cases, the government itself is captive to vested interests or has counteracting objectives (e.g. the reduction of public expenditure).
In private models, there is a greater distance between regulator and regulated, and in theory, more freedom for governments to demand tougher standards. However, there is a trade-off between the costs regulation imposes on private utilities and the attractiveness of the investment. Governments wishing to attract private investors may have to water down the regulation of social/environmental services.
A crucial question is who pays for the provision of these services. Private utilities will not invest in unprofitable activities (such as extending the network to low income users or protecting resource ecosystems) unless guaranteed either the recovery of costs by the users or public funding (plus some reward for their involvement). Although in theory responsibilities should be clarified in regulation and contracts, there will always be tension between water prices, the
regulation/provision of social/environmental services and revenue/private profits, especially as conditions change (new needs arise, costs may prove more than initially thought etc.).
PPPs have been praised as a good middle ground option, since governments retain the ownership of resources and assets and the responsibility for funding public/merit goods, and the private sector focuses on what it knows best, i.e. management and operation. A concern however is that operational management may “externalise” costs to assets, thus leading to an indirect cross-subsidy of private profits by public finances. For example, underinvestment in distribution network maintenance can increase replacement costs Underinvestment in demand management increases long-term capital costs for new resource, plant and network capacity. PPPs have also been criticised in that the state subsidises the difficult and expensive part (often the one for which private investment and efficiency are sought), whereas the private sector focuses on profitable areas.
An appraisal of the level of provision of social/environmental services is not always easy. For example, “Voluntary reductions” in water consumption by the poor, in an effort to save money due to higher water prices and with a corresponding lowering of hygiene standards, are difficult to measure. The condition of the network and underground water losses are difficult to quantify objectively. Monitoring in order to track such problems is costly. Related to this are the conflicts and counter-accusations between governments and private utilities, when failures are observed.
A critique of privatisation is that in practice it has lead to price increases instead of efficiency-related reductions and that rising costs make water unaffordable to the poor (Hall, 2001). In practice, however, it is very difficult to disentangle the contribution of different factors in price increases. To decide whether unjustified private profit-seeking takes place after privatisation, one needs to isolate it from possible increases in investment requirements, rising production costs or changes in the degree of cost recovery.
Equity and affordability partially depend on the level of total costs and partially on their allocation through the costing and pricing systems. The design of the pricing system is independent of utility ownership or management. Chapter 7 presents some principles for proper pricing, efficiency, equity and affordability. These principles are valid for public and private utilities alike.
A disadvantage of private options is that governments, having relieved themselves of the responsibility for public goods, and with the
Figure 2.5 Funding channels (Lee et al, 2001)
Source of funds Domestic (inside country) InternationalInternal resources Surplus of undertaking -State Government, national funds Aid agencies
(for developing countries)Bank loans Domestic banks International banksBonds Domestic bonds International bondsIntermediate funds Municipal development funds -International finance institutions - Development banks (e.g. World Bank)
Table 2.1 The sources of water service funding (Hall, 2001)

18 19
prospect of their costs in sharper relief, may be less willing to undertake them. In public systems, moreover, governments can directly subsidise (explicitly or not) the provision of such public goods. The reverse argument however might also be true, i.e. that in public systems where public goods are not clearly defined, the government may under-invest in them. Privatisation and cost recovery only make these costs more visible.
Privatisation may undermine water use efficiency as the profit motive provides a structural disincentive to the water utility against controlling water demand. This need not be so, however. Proper regulatory and costing systems can force private utilities to face the cost of growing water use or to decouple profits from water sales. Furthermore, revenue growth is a strong incentive in public utilities too. Costing and pricing for water conservation are discussed in Chapter 7; the general principles apply to both private and public utilities.
An argument in favour of public utilities is that citizens may be more receptive to calls to reduce water use when they have a sense of ownership of the system and the sharing of a problem (e.g. a drought), than when they are alienated “customers” (Hall, 2001). On the other hand, one might argue that constrained by electoral politics, public utilities may be less willing to ask sacrifices from water users.
2.3.5 Transparency and democratic control
For political reasons, public authorities are often secretive. A robust way of increasing transparency is to legally provide for the right of public access to all documents produced. All information about the finances of and charges for water should be as transparent as possible.
The legal duties of private law companies (including PLCs) to shareholders safeguard the transparency of their accounts. Regulatory requirements can ensure the provision of additional information in non-economic dimensions (e.g. water use efficiency). Unlike the public sector, full public access to all documents is not possible in private utilities since commercial/competitive interests demand secrecy. In liberalised water service markets, commercial secrecy will pose constraints on the degree of openness possible in public utilities too (as it can make them more vulnerable to takeovers by private competitors).
Private utilities represent the interests of their shareholders. Generally, commercial confidentiality precludes direct public involvement in decision-making within utilities, (though the
possibility exists for consultative procedures in specific decisions). Public control of private utilities takes place through regulation and there is scope for public participation in regulatory activities. In England and Wales, for example, a customer committee (“Water Voice”) acts as a statutory consultant to the regulator in the monitoring of private utility performance, periodic price reviews, etc. Such committees could also be established in Mediterranean countries and cities. Another option for increasing social control and involvement in private utilities is to give shares to users, local communities or employees (i.e. a way of moving closer towards “cooperative” or PLC forms of ownership).
In public/corporatised utilities and PLCs, democratic control is secured through the public ownership of the system. Drawbacks include the indirect and non-frequent control of the electoral system on water management and the potential capture of public decisions by vested interests. Links with society are more direct in municipally-owned utilities in comparison to more distant, state-owned ones. More direct public involvement can be achieved by integrating participatory mechanisms (Chapter 8) into the management of the utility (Box 2.4). Participation processes could be introduced into the management of urban water utilities in Mediterranean coastal cities too, though much will depend on the local political context. Where authoritarian or centralised governance is the norm, there will be less room for the implementation of such models.
2.3.6 Regulation
Divestiture and private limited companies necessitate complex regulatory arrangements for surrogate competition, monopoly control and protection of public/merit goods. PPPs are more flexible. Nevertheless, monitoring and ensuring compliance with contract terms can also be very demanding. Especially in longer-term concessions, relying solely on contract terms might not be adequate (Rees, 1998).
A key issue is that the greatest need for improved water services often exists in those countries with the weakest public sectors; yet the greatest risks of failed privatisations also exist where governments are weak (Gleick et al, 2002). Public utilities fail where the public administration is poor; however, privatisation with poor regulation is no better alternative.
Regulatory costs should be built into the balance of the costs and benefits of privatisation. The more private the system is, the higher the regulatory costs. The direct involvement of the government in public utilities reduces regulatory requirements
BOX 2.4PORTO ALEGRE, BRAZIL: A BEST CASE EXAMPLE OF PUBLIC PARTICIPATION IN AN URBAN WATER UTILITY (Hall et al, 2002)
The Departamento Municipal do Agua e Esgoto (DMAE) is the water utility of Porto Alegre, the capital of the Rio Grande do Sul province in Southern Brazil. DMAE is owned by the municipality, but financially independent from the State and fully self-financed through the water bills paid by its 1.4 million inhabitants (“corporatised utility”). It is a not-for-profit company that reinvests surpluses into improving the water supply.
DMAE allows a far-reaching level of public participation and democratic control over its operations and investments. A “Deliberative Council”, analogous to a Board of Directors and made up of civil society representatives reflecting different political views and interests, has the power of approval on all major decisions (plans, projects, prices, etc.) and can advise on secondary matters. DMAE’s operations and investment decisions are subject to a participatory budget process which is voluntary and universal. Citizens of the 16 neighbourhoods into which the city is divided meet to vote (in three rounds of approximately 51 meetings altogether) on the priorities for the investment of available resources. Each of the short-listed priorities evaluated on a cost-benefit basis.
Some 99.5% of the residents of Porto Alegre have access to clean water, a far higher proportion than anywhere else in Brazil. DMAE’s water price is one of the lowest in Brazil, but at the same time environmental information campaigns and the progressive price structure has made overall consumption go down.
Cooperatives allow more direct control by users and local communities (Box 2.5). Cooperative forms of urban water management are especially relevant to small and less-developed urban communities such as those in the Southern Mediterranean.
Cooperative options, however, do not escape some of the general criticisms of direct and participatory democracy (see Chapter 8). For example, voter turnout in the 1998 elections of Santa Cruz’s water cooperative was only 2.5%. It is questionable whether such a cooperative can be deemed “representative” and not governed by the specific interest groups that make the effort – or have the resources and knowledge – to turn out in the elections.
BOX 2.5SANTACRUZ, BOLIVIA: A BEST CASE EXAMPLE OF A WATER COOPERATIVE (Gleick et al, 2002)
The public water cooperative in the city of Santa Cruz (Cooperativa de Servicios Publicos Santa Cruz Ltda, SAGUAPAC) has served nearly one hundred thousand customers since 1978. All customers are members of the cooperative and have the right to vote in the cooperative’s General Delegate Assembly. The assembly elects part of the utility’s administrative board and the supervisory board. Customers are split into water districts, each approximately covering ten thousand people. All customers have decision-making powers through elections for different water authorities. Elections to six-year terms are staggered, and different authorities are designed to supervise each other. The system is also externally audited each year.
Santa Cruz’s cooperative has been praised by the World Bank as an efficient and transparent administration. It performs better than utilities in other major Bolivian cities and achieved an increase in household connections from 70 to 94% between 1988 and 1999. The utility is financially independent and ensures full-cost recovery from water charges. A social tariff is charged cross-subsidising low users.

20 21
On the other hand, aggregated organisational forms also possess some important advantages:1. Economies of scale: unit costs of provision fall
as more customers are served. 2. Economies of scope: reducing costs by
producing services together (sharing common tasks) instead of providing each separately. Common tasks (e.g. data collection, analysis, billing, customer services) are shared, and their costs per unit of product reduced.
3. Disincentive to externalise costs from one activity to another. An aggregated utility cannot ignore connections between different systems. For example, a utility responsible for both water supply and wastewater functions will have to consider the impacts of water supply management options on wastewater management costs. By contrast, if the two utilities were separate, the water supply utility could opt to reduce its own costs, increasing costs for the wastewater utility.
4. The reduction of unconstructive friction between multiple agencies and the increase of opportunities for joint management. There are more opportunities for cooperation, exchange of information and coordination of management decisions between different departments within one utility than there are between different utilities.
5. Attraction to the private sector / more investments due to size. The private sector (including donors, banks) will be more interested in investing in large capital projects (e.g. a regional waterworks) than in several smaller ones (e.g. a small municipal waterworks).
Economies of scale are an important issue. Aggregation beyond certain limits, however, may lead to diseconomies of scale. The optimal operating scale will be highly locally-specific varying in accordance with population density, infrastructure characteristics and condition, etc. (Rees, 1998).
The relative pros and cons of administrative unification vs. “checked and balanced” disaggregation cannot be stated a priori. In principle, a single agency/utility will facilitate internal cooperation between previously separate competencies and will facilitate the sharing of common tasks. Internal friction however is not rare. Simply joining two distinct utilities under one formal structure is not a guarantee of operational integration. Bureaucracy may increase. Old separating mentalities may persist; especially if the utilities continue to be “physically separated” (e.g. water supply and wastewater departments of a utility located in different buildings).
and costs. On the other hand, there is a trade-off between the degrees of government interference vs. autonomy of the utility vis-a-vis efficiency.
2.3.7 Integration
Integrated Urban Water System Management in Coastal Areas (IUWSMCA) requires that different utilities, public or private, and agencies cooperate, coordinate management activities and exchange information. Integration may be affected by the division of responsibilities between the private and the public sector. Private utilities will be more reluctant to participate in an integrating process unless they can profit from it. Benefits from integration, however, typically benefit the public (or the “system”) at large and not necessarily the specific part of the system that the private utility owns or operates.
The normal mode of interaction between public sector and private utilities is through regulation; this may not be suitable or flexible enough to permit the building of cooperation and partnerships. Commercial confidentiality also limits the amount of information that private utilities are ready to share with public counterparts in a partnership. Public utilities, facing possible competition or pressure for potential takeovers from the private sector, may also be reluctant to cooperate or share information with private counterparts in their area, hence limiting the prospects for integration.
On the other hand, it is well documented that cooperation between public utilities and agencies can also be difficult due to bureaucratic/departmental antagonisms, political rivalries (e.g. between central government and local authorities), etc. In such contexts privatisation with an effective regulatory framework can secure the required distance between state and utility (regulatory and regulated) and allow an easier enforcement and implementation of integration-related goals. For example, planning or participation in a partnership for IUWSMCA can be instituted formally as a duty of the private utility (e.g. by a reference in the contract, a law, etc.).
2.3.9 An overall comparison
There is no single best model. Table 2.2 attempts to reflect on the main advantages and disadvantages of the key options. These are provisional, since regulatory or organisational modifications can address the deficiencies of each model. The local context and the type of implementation can vary significantly and will be decisive for the actual realisation or not of theoretical advantages.
2.4 DISAGGREGATED VS. AGGREGATED ORGANISATIONAL STRUCTURES
A horizontally disaggregated organisational structure is one in which there are several utilities, each serving a relatively small spatial area (e.g. one utility per urban municipality).
A vertically disaggregated organisational structure is one in which there are separate utilities for different service functions (e.g. storage, bulk water supply, distribution, network, sewage collection and treatment) (Rees, 1998). An example of a horizontally and vertically aggregated organisation is a single utility for water supply, wastewater and stormwater services for a whole river basin (e.g. the private water companies in England and Wales). Vertical aggregation may extend to other urban services (multi-utilities).
Integration requires that the coastal urban water system is managed as a whole (Volume I). However, a single, aggregated agency/utility responsible for the whole system is not necessarily the best option. The Advantages of disaggregated over aggregated organisational forms include:1. Transparency. There is more disaggregated
(per service and per utility) information on costs, performance, etc. In aggregated forms (e.g. one large utility) information about the different parts of the system may be more easily disclosed.
2. Limitations on opportunities to cross-subsidise operations across internal activities.
3. More opportunities for benchmark comparison and surrogate competition between similar utilities. For example, if there are several water supply utilities in a region (or a country) it is possible to introduce a system that will compare their performance. This is not possible if there are only one (or a few) larger utilities.
4. The facilitation of “entry” competition and of some competition for peripheral customers. Thus, if there are several utilities, there are more opportunities for competition, and for competition to supply larger customers located on the fringes of an area but still within the remit of utilities (e.g. industries), than if there are only a few larger utilities controlling the market.
5. Creative “friction” (checks and balances, controls) between the various utilities (e.g. bulk water suppliers and service utilities).
6. Avoidance of aggregation of monopoly position and related monopoly abuse. One large utility yields much more power than several smaller ones.
7. Maintenance of local community focus and control. Compare for example a scenario of several local utilities in a region vs. one huge regional water utility.
Model Advantages Disadvantages Opportunities ThreatsFully Public Public guarantee of
provision of public/merit goods
Lack of incentives - potentially subject to vested interests
Effective public sector Public budget cuts
Corporatised Higher degree of autonomy - private firm organisation
Little autonomy National tradition of well-run public enterprises
Interventionist - client-based government stylePublic PLC Combination of public
responsibility with private incentives
Government power can be exploited to produce profits
Modernising public sectorLocal expertise
Cooperatives Direct democratic control - more accountable
Captive to/motivated by powerful stakeholder groups
Participatory democracy
Public apathy towards community affairs
Lease Brings in technological know-how
Short-termist; can lead to underinvestment
Strong local authorities - devolved government
Corruption in contract assignment
Concession Efficiency incentivesPrivate know-how; Public ownership maintained
Capturing of the market: lack of competition in next contractHidden underinvestment in public/merit goods
Strong public sector, able to manage and monitor concessions
Weakened public sector, watered down contracts chosen in order to attract investmentsCapturing of the world market by a few multinationals
Private LTD -Divestiture
Efficiency incentivesPrivate know-howAccess to capital market
Potential monopoly abuse - displacement of costsHigh regulatory costs
Effective public sector, with good regulatory capacities
Public budget cuts – weakening of regulatory mechanisms
Table 2.2 Comparison of the basic public and private organisational models

22 23
The alternative is to seek integration through permanent or ad hoc cooperative mechanisms such as joint committees and task forces, inter-utility agencies, etc. River basin structures (planning processes and committees, councils, etc.) provide a potential platform for the area-wide integration of disaggregated competencies without the need for formal aggregation. River basin councils, programmes of action or plans provide opportunities for the various utilities as well as for other water users to form partnerships and cooperate. Such partnerships, however, may be too loose and turn out to be ineffective. Separation can generate conflict and antagonism and disaggregation can deteriorate into fragmentation.
A final issue to consider is that of the costs of change. A more or less aggregated scheme or partnership may be theoretically desirable. In practice, however, moving from more to less aggregated schemes and vice versa, entails expenditures. These can be physical (e.g. realigning pipes and connecting networks, joining or separating office facilities, etc.) or administrative (making information and accounting systems compatible, overcoming opposition from managers and employees, etc.). Such costs should be justifiable in terms of benefits obtained.
2.5 DEVELOPING EFFECTIVE ORGANISATIONAL SCHEMES
Integrated Urban Water System Management in Coastal Areas requires an effective organisational scheme. Most existing schemes are fragmented. This acts against integration and often against the goals of service quality, economic efficiency, social equity and environmental protection. Reform is necessary.
The question of public vs. private is misleading. The division of public and private responsibilities and the choice between lesser or greater aggregate forms of organisation are arbitrary. Different possible combinations and arrangements are possible. The criterion of choice is their performance in terms of criteria such as integration, effectiveness in achieving goals, financial viability and democratic accountability. The local context is decisive and should be taken into account, especially in Mediterranean coastal cities which have several distinguishing features. Models should not be “imported” from abroad without careful consideration of the local context and needs.
Choice should be informed. Public discussion on reorganisation and privatisation is mainly based on intuition and prejudice; scientific reasoning has been scarce (Seppala et al, 2001). The various
features of a proposed organisation change should be carefully studied before a decision is taken. Learning from experience in other parts of the world is important, but not sufficient. Differences in context limit comparisons, especially between utilities in different settings. Scientific assessment (prospective or retrospective), albeit necessary, of the results of organisational change is extremely difficult. Baseline external conditions (regulatory standards, investment needs, and environmental conditions) do change and they are difficult to isolate from internal changes in the performance of system (Kallis and Coccossis, 2004). A lot of data is needed; some is missing while some is not directly quantifiable. Information comes with a price tag.
A degree of intuition, belief and bias is unavoidable in any discussion for or against an organisational change. The challenge is how to best manage the political debate in a democratic and scientifically informed way. The process is as important as its result. That is, quality in the management of the process of reform is as important as reform itself. Negotiations about change should be open, transparent and include all affected stakeholders (Gleick et al, 2002).
Furthermore, different models, for better or for worse, fit existing political and social conditions. The costs of social reaction should be taken into account when deciding on organisational change. The monitoring of impacts and the flexibility to adapt are also important.
Reform of an organisational framework is no substitute for deciding on:• the regulation (legislation) of the urban water
system (see next chapter)• the establishment of proper financing, costing
and pricing systems (Chapter 7)• rules for transparency and public access to
decisions (Chapter 8)
3.1 THE ROLE OF LEGISLATION
A comprehensive legal framework is necessary in order to achieve the goals of IUWSMCA. Regulation is also a prerequisite for the effective operation of a utility, private or public.
Legislation is often solely thought of as a series of commands issued by governments to control behaviour (e.g. standards, prohibitions), with accompanying enforcement capacities and penalties for failure to comply. Legislation does much more than this, however. Legal rules can be designed to provide incentives (including financial ones) to encourage desirable behaviour. Standards also can have a positive – and not only prohibitive – role, promoting best practice and technological innovation. Furthermore, in addition to standards, there are legal rules concerning the regulation of processes. Planning, participation, price determination, etc. cannot operate in a vacuum. They have to conform to standardised procedural rules.
Regulatory change should be pursued only to the extent that its benefits (in the widest sense) surpass costs and that the reallocation of costs and benefits is socially desirable.
Guidance on the topics and issues that should be covered by a comprehensive legal framework for a coastal urban water system is presented below. Specific standards are not given, as these will need to be tailored to the specific local circumstances of any given Mediterranean country. Existing WHO, EU, or national standards provide useful reference frameworks in this respect.
3.2 THE REGULATION OF UTILITIES
This governs the rights and duties of the urban water utility/utilities to customers and to the state.
3.2.1 Customer and service standards
Standards of customer service extend to customer-related issues including:• Standards of service to the newly connected
(e.g. maximum time of connection after
application, infrastructure provided according to type of user)
• Standards of services to existing customers (e.g. time taken to respond to billing or supply complaints)
• Goals can also be expressed in terms of indicators/desirable values. The obligations of the utility to customers (including service standards) can be formalised in a legally binding customer charter. Separate standardised contracts are struck between utilities and customers upon connection to services. Contract terms define the respective duties of utility and customer
The regulation of standards for the condition of assets (especially plants and networks) serves to avoid underinvestment in maintenance and renewal. The objective appraisal of the condition of some assets (e.g. underground networks) is often difficult. Standards may be set with respect to effort rather than state of the assets (e.g. standards set for annual renewal or replacement rate of pipes). Leakage is a very important issue; utilities can be legally bound to achieve specific leakage reduction targets (see Chapter 5).
The regulation of public/merit goods may include “safety net” standards for the maintenance of minimum hygiene and public health conditions. Examples are moratoria on disconnections for certain vulnerable groups or special social tariffs (Chapter 7). Other options are a clear definition of a right of access to water for all or a guarantee of a minimum quantity of water.
Water use efficiency standards can be set to promote water saving goals (Chapter 5). Utilities may be mandated by the state/regulator to achieve specific conservation-related management tasks or goals. These may include leakage reduction targets or the implementation of specific water conservation programmes (e.g. metering installation, retrofit and rebate programmes, etc.).
In turn, water efficiency standards may be imposed by the state or the utility on individual customers. Such controls may include bans on specific activities (e.g. car washing or swimming pools). These can be applied to specific areas/users and for
3. LEGAL FRAMEWORK This chapter presents a comprehensive legal framework for urban water system management. Firstly, the importance of the legal framework is reinstated. Guidelines are then provided for legal rules in: service provision; economic regulation; water quality protection; pollution control; environmental protection; resource rights and management; physical planning and equipment and the design of appliances. The chapter concludes with a brief discussion of key implementation issues.

24 25
specific periods of time (e.g. during droughts). Water efficiency standards may also include requirements for specific installations as a prerequisite for supply (e.g. certain efficient water devices).
Controls for water efficiency may be difficult to implement and may not be easily accepted by utilities or users. A more effective strategy is to link them to incentives or permits/economic regulation. For example, utilities may be required to demonstrate that new water supply projects are less expensive than projects that improve water use efficiency, before they are permitted to invest and raise water rates to repay the investment (Gleick et al, 2002). In the U.S., the funding of municipal water utilities is bound to the implementation of a standardised water conservation plan. In England and Wales, the comparative water efficiency performance of the companies is taken into account in the periodic review of water prices.
3.2.2 Monitoring and reporting
Monitoring and reporting are necessary for the assessment of a utility’s performance and the control of compliance with standards. Legislation should define:• acceptable procedures for monitoring and data
analyses (in relation to the measurement of performance in the regulated standards)
• reporting requirements• independent auditing procedures and
inspection rights
The detailed definition of monitoring and reporting rules in a legal text may be too rigid an approach. Alternatively, the legal text may define the general principles and refer their specification to delegated authorities (e.g. regulators or inspectorates).
Reporting alone is not adequate to secure public access to information. In principle, all utility documents and data should be accessible to the public. In practice, governmental or commercial confidentiality will pose restrictions. The law should be explicit and define:• data that the utility is duty-bound to provide to
the public (typically, that which is included in reports)
• data to which the public can have access after certain formal procedures have been completed
• data to which access may be limited (with clear justification as to why this is so)
3.2.3 Exemptions
A proper legal framework should account for exceptional circumstances (Chapter 9), during which derogations from legal obligations are allowed. An extreme weather event or an earthquake may lead to a breach of standards. In
an intense drought, interruptions to supply may have to be applied, water of lower quality utilised, or bans on certain uses imposed. The law should specify the conditions that define an exceptional circumstance (or the delegated authorities and procedures that do so) and the derogations that apply under such situations. In many countries, there are legally defined procedures for the issue of drought orders by public authorities.
3.2.4 Planning and participation
A requirement for certain type of plans (e.g. a 5-year Master Plan based upon the specifications of Chapter 5 Volume I or any other important plan such as an Integrated Resource Plan, a Risk Management Plan or an Investment Plan) may be imposed on the urban water utility. Whether a legal provision will be necessary, depends on the style of national public administration. The law may define the procedural rules for the preparation of the plan (e.g. administrative structure, consultation and participation, etc.) and the basic reporting, monitoring and reviewing requirements. The law may also specify the mode of integration with other decision-making and planning structures (e.g. commitment to explicitly synchronise goals with those of physical plans; the statutory role in the process foreseen for urban planning authorities). An option is to link the mandate for the preparation and implementation of the plan(s) to financial incentives or other authorisation instruments (e.g. the link between conservation planning and state funding in the U.S.).
Rules for the participation of the public in decisions and monitoring (Chapter 8) should also be clearly defined. These should include:• The identification of the decisions where public
participation processes are obligatory (e.g. the preparation and authorisation of plans, price reforms, budgeting, etc.)
• The definition of the degree of public involvement foreseen per decision (e.g. information, consultation, delegation of decision, see Chapter 8)
• The procedural rules, the selection of participants and their rights and duties
3.3 ECONOMIC REGULATION
This is an important element of utility/service regulation. Two principles should be respected (Gleick et al, 2002):1. “Water and water services should be provided
at fair and reasonable rates”2. “Rate increases should be linked with agreed-
upon improvements in services”
Price control is an essential function of the water services’ legal framework. Rules for the determination of prices will vary depending on the characteristics of the system, and especially the degree and type of private involvement. Chapter 7 discusses key issues for the setting of water prices. The legal framework should explicitly define the basis (and goals) upon which prices should be determined. Price determination may be linked to service performance standards, investment responsibilities, etc. Profit rights and limitations (profit caps) and investment responsibilities should be specified.
Legislation should also clearly define the rules of the rate-setting process, i.e. who decides on prices, and how and when. This process includes:• The definition of the roles and responsibilities
of ministries, regulators, utilities and citizens’ advisory groups;
• Rules for reaching decisions and setting prices • The definition of a regular periodic review
(e.g. annual or every five years with automatic annual adjustment to account for inflation, etc.).
Regulating the investment responsibilities of utilities serves to avoid situations where assets are left to deteriorate or capital investments on important public functions are neglected. The formal regulation of financial commitments may not be suitable as it reduces the flexibility to adapt to changing conditions and needs. Regulation, however, can define the processes and rules through which investment responsibilities will be defined (e.g. the preparation and agreement on an investment plan) and adjusted in the light of new evidence (e.g. the periodic revision of a plan under certain procedural rules and substantive criteria). The aim is to strike a delicate balance between the protection of the public interest and the protection of the utilities from unjustifiable demands for additional expenditure (Rees, 1998).
A more general framework is necessary to define the rules of ownership and/or competition in urban water services. This might be part of competition law. Private involvement may be allowed in certain parts of the service but forbidden in others. In the case of public or corporatised utilities, utility structure and rule of operation (e.g. constitution of board, appointment of president, etc.) have to be defined. This might be covered by public administration or company law. Where private involvement is allowed, clear rules of competition must be set and controls defined over unfair trading practices (Rees, 1998). The law might define agencies or processes to judge on competition issues (e.g. a mergers or an anti-monopoly commission).
3.4 PUBLIC HEALTH REGULATION
Drinking water standards are vital for the protection of public health. Such standards are already established at a national level in most countries. The World Health Organisation’s reference standards (www.who.int/water_sanitation_health/dwq/en/) are generally applicable, though designed with the needs of less advanced water systems in mind. For more advanced systems, the European Union standards (applying to its member countries; CEC, 1998) and the United States Environmental Protection Agency guidelines (www.epa.gov/safewater/mcl.html) are useful.
Quality parameters regulated include physical characteristics, inorganic constituents, organic compounds, microbiological characteristics and radiological content. Physical parameters include pH, turbidity, temperature, colour, smell and taste. These relate more to customer satisfaction than public health protection. Some also serve, however, as indicators of potential microbial contamination.
Important inorganic constituents include nitrates, sulphates, halogens (chlorides, bromides and fluorides) and cyanides, and many metals used in industrial processes such as chromium, zinc, copper, lead, and silver or which are naturally occurring such as calcium, magnesium, arsenic and selenium.
Organic compounds are measured in terms of Biological Oxygen Demand (BOD), Chemical Oxygen Demand (COD), and Total Organic Carbon (TOC), parameters that give a general indication of organic pollution and the potability of water. Specific limits may also be placed on certain organic chemicals depending on their use or release in the sources’ basin. For water abstracted from agricultural areas, chemicals such as atrazine, alochlor or other pesticides may have to be regulated. If drinking sources are in industrial or urbanised basins, phenols, chlorinated organics, synthetic detergents and petroleum products should be regulated and monitored.
Disinfection reduces microbiological pollution but does not “sterilise” drinking water. A certain level of microbiological activity is inevitable; water systems contain several kilometres of buried underground pipes and large storage tanks. It is difficult and expensive to test all waters for all potentially pathogenic organisms. Standards for microbiological safety frequently use an indicator organism (most often faecal coliforms) as a water safety gauge. A positive indication for faecal coliform calls for a more detailed examination to specify and locate microbiological pollutants.
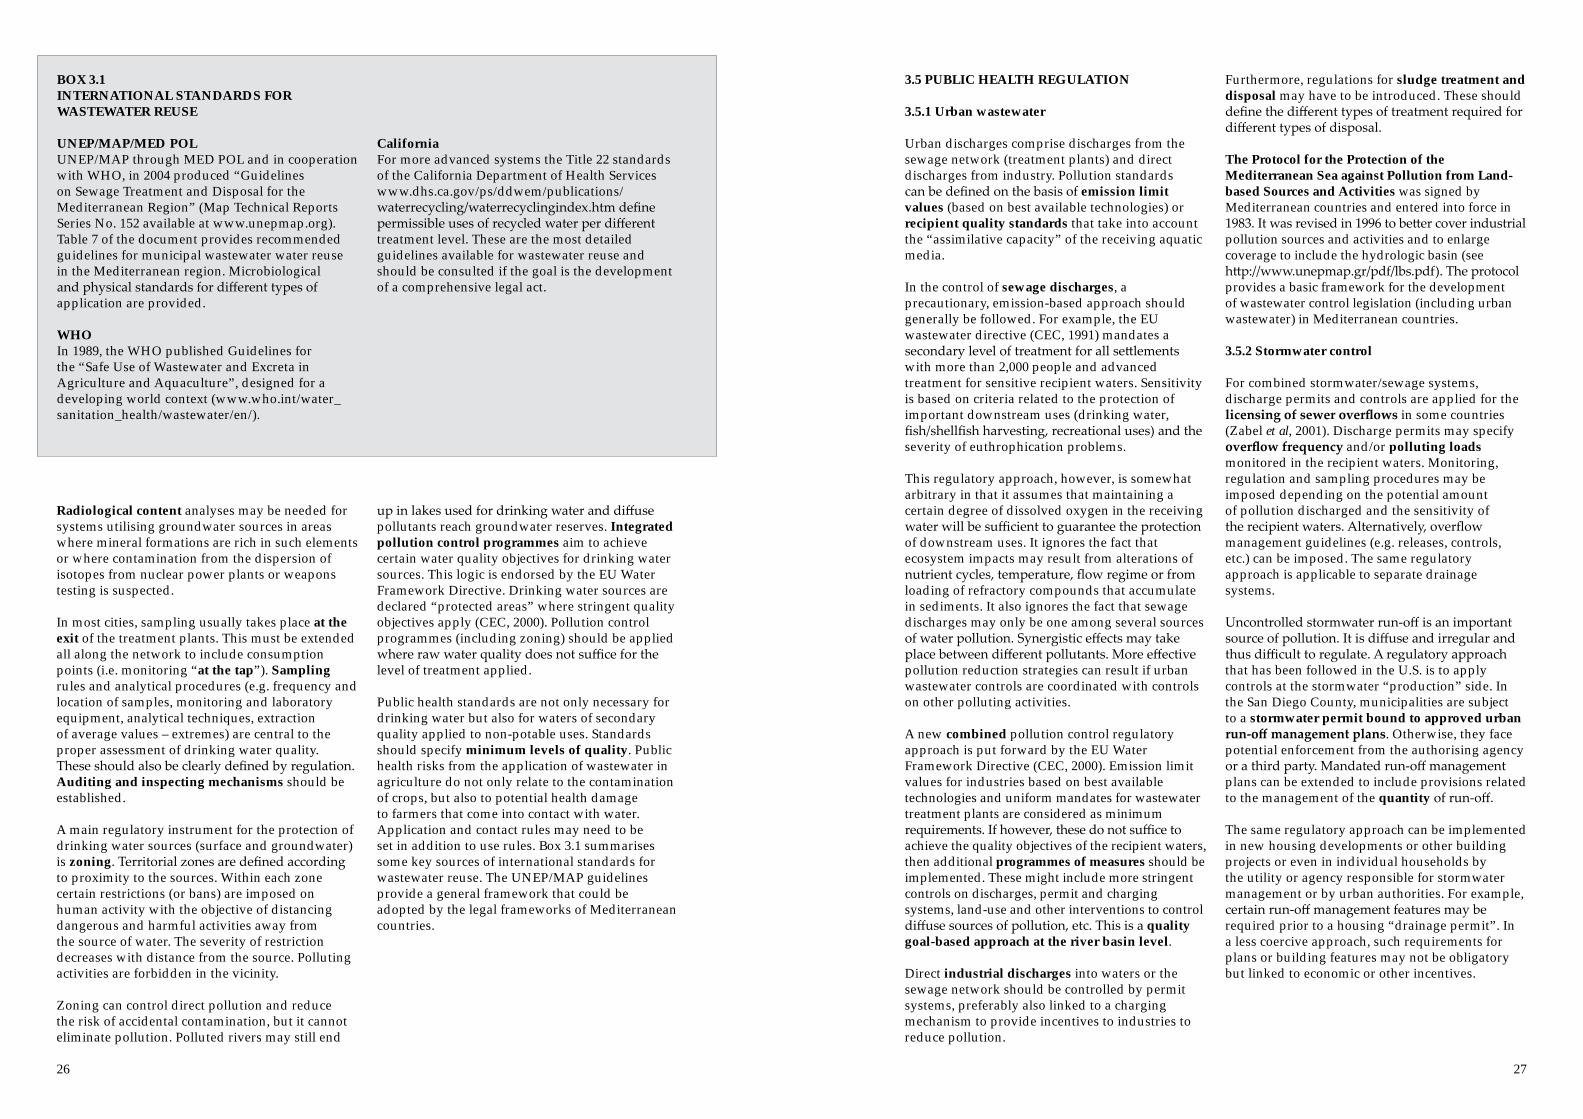
26 27
Radiological content analyses may be needed for systems utilising groundwater sources in areas where mineral formations are rich in such elements or where contamination from the dispersion of isotopes from nuclear power plants or weapons testing is suspected.
In most cities, sampling usually takes place at the exit of the treatment plants. This must be extended all along the network to include consumption points (i.e. monitoring “at the tap”). Sampling rules and analytical procedures (e.g. frequency and location of samples, monitoring and laboratory equipment, analytical techniques, extraction of average values – extremes) are central to the proper assessment of drinking water quality. These should also be clearly defined by regulation. Auditing and inspecting mechanisms should be established.
A main regulatory instrument for the protection of drinking water sources (surface and groundwater) is zoning. Territorial zones are defined according to proximity to the sources. Within each zone certain restrictions (or bans) are imposed on human activity with the objective of distancing dangerous and harmful activities away from the source of water. The severity of restriction decreases with distance from the source. Polluting activities are forbidden in the vicinity.
Zoning can control direct pollution and reduce the risk of accidental contamination, but it cannot eliminate pollution. Polluted rivers may still end
up in lakes used for drinking water and diffuse pollutants reach groundwater reserves. Integrated pollution control programmes aim to achieve certain water quality objectives for drinking water sources. This logic is endorsed by the EU Water Framework Directive. Drinking water sources are declared “protected areas” where stringent quality objectives apply (CEC, 2000). Pollution control programmes (including zoning) should be applied where raw water quality does not suffice for the level of treatment applied.
Public health standards are not only necessary for drinking water but also for waters of secondary quality applied to non-potable uses. Standards should specify minimum levels of quality. Public health risks from the application of wastewater in agriculture do not only relate to the contamination of crops, but also to potential health damage to farmers that come into contact with water. Application and contact rules may need to be set in addition to use rules. Box 3.1 summarises some key sources of international standards for wastewater reuse. The UNEP/MAP guidelines provide a general framework that could be adopted by the legal frameworks of Mediterranean countries.
3.5 PUBLIC HEALTH REGULATION
3.5.1 Urban wastewater
Urban discharges comprise discharges from the sewage network (treatment plants) and direct discharges from industry. Pollution standards can be defined on the basis of emission limit values (based on best available technologies) or recipient quality standards that take into account the “assimilative capacity” of the receiving aquatic media.
In the control of sewage discharges, a precautionary, emission-based approach should generally be followed. For example, the EU wastewater directive (CEC, 1991) mandates a secondary level of treatment for all settlements with more than 2,000 people and advanced treatment for sensitive recipient waters. Sensitivity is based on criteria related to the protection of important downstream uses (drinking water, fish/shellfish harvesting, recreational uses) and the severity of euthrophication problems.
This regulatory approach, however, is somewhat arbitrary in that it assumes that maintaining a certain degree of dissolved oxygen in the receiving water will be sufficient to guarantee the protection of downstream uses. It ignores the fact that ecosystem impacts may result from alterations of nutrient cycles, temperature, flow regime or from loading of refractory compounds that accumulate in sediments. It also ignores the fact that sewage discharges may only be one among several sources of water pollution. Synergistic effects may take place between different pollutants. More effective pollution reduction strategies can result if urban wastewater controls are coordinated with controls on other polluting activities.
A new combined pollution control regulatory approach is put forward by the EU Water Framework Directive (CEC, 2000). Emission limit values for industries based on best available technologies and uniform mandates for wastewater treatment plants are considered as minimum requirements. If however, these do not suffice to achieve the quality objectives of the recipient waters, then additional programmes of measures should be implemented. These might include more stringent controls on discharges, permit and charging systems, land-use and other interventions to control diffuse sources of pollution, etc. This is a quality goal-based approach at the river basin level.
Direct industrial discharges into waters or the sewage network should be controlled by permit systems, preferably also linked to a charging mechanism to provide incentives to industries to reduce pollution.
Furthermore, regulations for sludge treatment and disposal may have to be introduced. These should define the different types of treatment required for different types of disposal.
The Protocol for the Protection of the Mediterranean Sea against Pollution from Land-based Sources and Activities was signed by Mediterranean countries and entered into force in 1983. It was revised in 1996 to better cover industrial pollution sources and activities and to enlarge coverage to include the hydrologic basin (see http://www.unepmap.gr/pdf/lbs.pdf). The protocol provides a basic framework for the development of wastewater control legislation (including urban wastewater) in Mediterranean countries.
3.5.2 Stormwater control
For combined stormwater/sewage systems, discharge permits and controls are applied for the licensing of sewer overflows in some countries (Zabel et al, 2001). Discharge permits may specify overflow frequency and/or polluting loads monitored in the recipient waters. Monitoring, regulation and sampling procedures may be imposed depending on the potential amount of pollution discharged and the sensitivity of the recipient waters. Alternatively, overflow management guidelines (e.g. releases, controls, etc.) can be imposed. The same regulatory approach is applicable to separate drainage systems.
Uncontrolled stormwater run-off is an important source of pollution. It is diffuse and irregular and thus difficult to regulate. A regulatory approach that has been followed in the U.S. is to apply controls at the stormwater “production” side. In the San Diego County, municipalities are subject to a stormwater permit bound to approved urban run-off management plans. Otherwise, they face potential enforcement from the authorising agency or a third party. Mandated run-off management plans can be extended to include provisions related to the management of the quantity of run-off.
The same regulatory approach can be implemented in new housing developments or other building projects or even in individual households by the utility or agency responsible for stormwater management or by urban authorities. For example, certain run-off management features may be required prior to a housing “drainage permit”. In a less coercive approach, such requirements for plans or building features may not be obligatory but linked to economic or other incentives.
BOX 3.1INTERNATIONAL STANDARDS FOR WASTEWATER REUSE
UNEP/MAP/MED POLUNEP/MAP through MED POL and in cooperation with WHO, in 2004 produced “Guidelines on Sewage Treatment and Disposal for the Mediterranean Region” (Map Technical Reports Series No. 152 available at www.unepmap.org). Table 7 of the document provides recommended guidelines for municipal wastewater water reuse in the Mediterranean region. Microbiological and physical standards for different types of application are provided.
WHOIn 1989, the WHO published Guidelines for the “Safe Use of Wastewater and Excreta in Agriculture and Aquaculture”, designed for a developing world context (www.who.int/water_sanitation_health/wastewater/en/).
CaliforniaFor more advanced systems the Title 22 standards of the California Department of Health Services www.dhs.ca.gov/ps/ddwem/publications/waterrecycling/waterrecyclingindex.htm define permissible uses of recycled water per different treatment level. These are the most detailed guidelines available for wastewater reuse and should be consulted if the goal is the development of a comprehensive legal act.

28 29
3.6 ENVIRONMENTAL REGULATION
Pollution control and water conservation are two main ways of minimising the negative environmental impacts from water services. Utilities, however, also consume other resources and energy and produce a variety of wastes. Environmental legislation for energy, solid waste, etc. generally accounts for the control of such impacts.
Environmental Impact Assessment should be a legal responsibility for all sizeable water service-related works (transfers, dams, new plants) and already is in most countries. An important legal innovation is to ask for a Strategic Environmental Assessment to be applied to the Master and water resource plans of urban water utilities (Chapter 5, Volume I). If this is linked to the authorisation or funding of new projects, SEA can act as an indirect impetus to the development of a Master Planning process where it does not exist.
Environment-related obligations may be introduced as statutory responsibilities in the law/contract governing an urban water utility (“service regulation”). These might include financial commitments for environmental management programmes or requirements for environmental plans (potentially bound to permit or public funding systems). An environmental auditing scheme (such as an ISO or EMAS credential; Chapter 4, Volume I) may also be legally requested by urban water utilities or linked to authorisation/funding schemes.
A novel idea, only applicable in some cases, would be to render utilities legally responsible for the conservation of their production (or “discharge”) areas. In the Netherlands, where many utilities use coastal dunes for groundwater or for the natural treatment of polluted surface water, their legal statutes define dune conservation as one of their responsibilities.
The production of freshwater and wastewater discharges in many Mediterranean cities affects important natural areas containing endangered species of flora and fauna that are protected by legislation. Protected areas are typically regulated by environmental legislation through a zoning approach (i.e. prohibiting or constraining activities within certain territorial boundaries). More stringent regulatory standards on urban water services, pollution control or resource management may apply in such cases. For example, urban waterworks or discharges within the boundaries of protected natural areas may be prohibited unless proven to be absolutely necessary (i.e. when all other options are cost-prohibitive). The EU Water Framework Directive applies such a provision,
whereby important natural areas protected by other Community or national legislation, are to be treated as “protected areas” in which more stringent quality objectives and restrictions and control on abstractions and discharges apply (CEC, 2000).
3.7 THE REGULATION OF WATER RESOURCES
In many Mediterranean countries, the ownership regime of water resources is unclear and regulated through several decrees. Water rights are linked to land property rights. Utilities “owning” a reservoir enjoy unlimited rights over its supply. Such situations provide disincentives to water conservation and generate conflicts between competitive uses of shared (or connected) resources.
The water resources legal framework should include a water rights system that recognises the hydrologic realities of surface water, groundwater and return flow linkages, and the tendency for precipitation and streamflows. The system should clearly define ownership of surface and groundwaters. Freshwater resources should not be allowed to be appropriated by private entities; state control is necessary (UNEP/MAP/PAP, 1997). All new rights over water resources should be based on usership and not ownership titles. Titles should be designed to be consistent with the availability of water resources, economic and social considerations and the priority of users, and should not allow a perpetual and open-ended use of resources. Existing unlimited ownership titles should be gradually transformed into time-bound user titles.
Time-bound abstraction permits are the best way to manage user titles. Abstraction permits can be used to: • control developments in water stress areas• impose certain management goals on the user
(e.g. by linking consent to the prior existence of a water conservation plan or certain exhibited management practices)
This means that new urban water supply works should be subject to control both in terms of environmental impacts (by environmental regulation) and in terms of availability/efficiency considerations (by resource regulation).
Permission for new abstractions or supply projects (such as dams or large-scale transfers) may be bound to criteria such as stipulations that:• no better (economically, socially and
environmentally) alternatives exist• evidence is needed of the prior establishment
and approval through consultation processes of a Master Plan (or an Integrated Resource Plan or a Water Conservation Plan)
Abstraction permits also provide a platform for environmental taxation (by charging abstraction permits) or even (though more difficult) incentive pricing, by linking charges to actual use (Chapter 7).
A comprehensive system of water rights should also cater to the water needs of ecosystems. In all cases, natural ecosystems should be legally guaranteed a basic water requirement. Environmental flows should be taken into account as a limiting factor when issuing abstraction permits. More ambitiously, permanent “environmental use rights” could be established.
The prioritisation of uses and users should be flexible. Well-regulated markets may be set up. These can range from the time-bound trade of water between users during drought periods, to more the more permanent exchange through trade of user titles. They can facilitate the allocation of water for more productive uses. They should be carefully managed, however, to avoid monopolistic situations. The prior establishment of minimum flows and environmental rights is also necessary to avoid the overexploitation of sources.
A comprehensive water resources legal framework should also define the overall planning and decision-making process for the allocation of water resources. This will include the establishment and definition of the competent authorities and their powers and specification of the planning process and participation rights of various parties and the public. Competencies and planning processes should preferably be organised at the river basin level. Effective participation demands the establishment of representative councils (river basin “parliaments”) with power in the planning process as well as in broader consultation procedures. Ideally, the legal framework should define the direction and intent for integration between river basin plans and lower-level plans, such as urban water basin plans (or the Master Plans prepared by the urban water utility).
3.8 URBAN DEVELOPMENT AND LAND-USE REGULATION
Physical planning instruments can contribute to better urban water system management. This can be promoted through urban planning and decisions giving the green light to development that endorses the principles of water-sensitive urban design (Chapter 4, Volume I). The main instrument in land-use regulation is the issuing of permits. The rules for granting permits should be typically expressed in a land-use plan and/or a building code.
An obvious legal provision, practised (but often violated) in many Mediterranean counties, is a ban on or control over the granting of housing permits in flood-prone areas.
Similar controls may be imposed on developments in water-stressed areas. For example, a new residential development or hotel in a water-stressed coastal area may be required to have obtained an abstraction permit (or similar evidence of consent for connection to the central network by the water utility) prior to the granting of the building permit by the urban authority. This inverses the sequence of the permission process, making water a limiting factor in urban development.
More ambitiously, permits may be linked to specific “water-sensitive” features of the new house or development, such as:• water-efficient fixtures (e.g. efficient devices,
rainwater collection cisterns, in-house recycling schemes)
• measures to control erosion at construction sites • the installation of post-construction pollution-
control devices to reduce urban run-off pollution
Such provisions would be particularly suitable for hotels and tourism facilities in Mediterranean coastal urban areas.
Building codes which define the required features for new developments can incorporate some essential water-sensitive features (such as rainwater collection cisterns in smaller coastal/island settlements).
Land-use planning legislation should define the direction and intent of integration with water management goals. A clear statement will help (e.g. to consider water availability and run-off as limiting factors in physical plans and permit decisions). The role of water actors (utilities, public agencies, etc.) in the urban planning process should also be specified.
3.9 DESIGN STANDARDS
Some minimum, design standards are necessary to guarantee the quality of the “machinery” and artefacts used in urban water systems Elements such as pipes, storage tanks, meters, etc. Design guidelines are also important to the design of drainage pipes and systems (e.g. minimum acceptable “flood risk”). EU norms or ISO standards for equipment or for specific waterworks (e.g. wastewater treatment plants, etc.) should be used for this purpose.

30 31
Water efficiency standards for marketed domestic appliances can greatly aid water conservation (Chapter 5). The imposition of universal standards, however, may be a violation of free competition rules. Alternative approaches leaving the choice open to consumers, include regulation for the environmental labelling of appliances (such as the “ecolabelling” scheme in the EU).
3.10 A COMPREHENSIVE LEGAL FRAMEWORK FOR COASTAL URBAN WATER SYSTEMS
Table 3.1 summarises the main legal instruments referred to in this chapter. A comprehensive legal framework conducive to integrated urban water system management in coastal areas should address all themes. The list of instruments and combinations provided is by no means exhaustive. Specific legal provisions should be adjusted to fit the local socio-economic, environmental and judicial context.
Legislation governing urban water systems is typically fragmented; numerous laws cover the various urban water cycle aspects. Relevant provisions may extend to several laws and administrative competencies. The concentration of fragmented legal provisions into a few key legal acts is recommended. A Water Services Law and a Water Resources Law should provide the backbones of a comprehensive framework. These should provide a consistent regulatory framework, applicable to all utilities, public or private. This may be complemented by specific licences/contracts between the state and utilities.
There might still, however, be reasons to maintain certain provisions in other acts or administrative competencies. Water pollution control, for example, may be regulated by an integrated pollution control act (covering all industrial emissions) and administered by a pollution inspectorate. Similarly, public health and safety agencies may be better positioned to monitor and enforce drinking water standards. Certain provisions (e.g. competition, taxation, etc.) may be regulated by more general administrative and economic laws. Table 3.1 indicates the basic laws into which the various provisions can fit.
Mediterranean countries have different legal systems and traditions. Some systems may be more legislation-based, others more administration (policy or planning)-based. Laws provide more of a framework in some countries (leaving freedom of implementation to the local level) and a more direct, decree-type of control in others. Guidance provided in this chapter should be adapted accordingly.
The costs of regulation might impede proper implementation, especially in smaller and poorer urban settlements with weak administrations. Over-legislation may lead to non-implementation. The subsidiarity principle calls for a differentiation of standards according to the type of urban water system. Freedom of implementation should be left at the local level. On the other hand, a delicate balance must be struck to avoid weak implementation.
Legislation has to be monitored and enforced to be effective. The common experience of Mediterranean countries is that enforcement capabilities are weak. Compliance provisions, penalties and fines, court procedures etc. are very important. They depend, however, on the national judicial system and are beyond the scope of these guidelines.
Enforcement problems are exacerbated by the nature of water resources and infrastructure that make surveillance difficult and expensive. A key issue is the ability of public agencies to fulfil an ever-demanding regulatory role in the face of public budget and personnel policy restrictions. Economic instruments are often proposed as a cost-effective alternative to regulatory instruments. Their application in the urban water sector, however, is not spontaneous; a prerequisite is the establishment of administrative and regulatory structures (e.g. to establish water rights and oversee markets, to regulate private utilities or to license abstractions in order to price them). These entail significant cost.
LAW WATER SERVICES
WATER RESOURCES
ENVIRONMENTAL PUBLIC HEALTH
OTHER
Rules / standardsLevel of service / customer services
+ +
Assets serviceability +Price/Profit control +Utility ownership / structure
+ Public administrationCompany law
Competition/trading + CompetitionInvestment commitments +“Safety net” / Public goods + Social policyWater use efficiency /Leakage reduction
+ +
Urban water planning + +Monitoring and reporting + + + +Access to urban water information
+ + + +
Consultation/participation + + + +Exceptional circumstances + +Drinking quality + +Sampling/analysis + +Source protection Zoning + + +Secondary water quality + + +Emission limit values / Treatment requirements
+ +
Pollution permits + +Integrated pollution control programmes
+ +
Combined sewer overflow controls/permits
+ +
Sludge disposal + +Stormwater permits + +Environmental Impact Assessment
+
Strategic Environmental Assessment
+
Environmental auditing + +Protected natural areas + + +Ecological water standards + +Minimum environmental water quantity
+ + +
Water rights system +Abstraction permits +Water exchanges – markets +River basin planning – councils
+
Water-sensitive building codes/permits
Physical planning
Equipment design standards
+ Engineering
Appliance design standards
+ Product
Appliance labelling schemes
+ Product
Table 3.1 The legal instruments for urban water system management
33
4.1 INFORMATION MANAGEMENT
4.1.1 Decision-support systems
Data is an essential ingredient of an information system. Types of data relevant to urban water systems include:• hydrologic variables • infrastructure system characteristics and
condition (reservoirs, networks, plants)• water quantity and quality (source, urban
waters, recipient waters) • climate and environmental information
(source-dependant ecosystems, recipient water ecosystems, etc.)
Data use is essential in many functions of the planning process such as assessing current conditions, pressures and problems, assessing the needs of different users, identifying priorities and comparing and selecting from available alternatives.
Relevant data should be compiled in a collective database. Data can be expressed and used from its “raw” forms to the more processed forms. A general ladder of information ranges from primary data to analysed data to indicators to indices (WRI, 1997). It is the responsibility of the database user to identify both the data input required and the way in which it can be used to achieve the application required. The collecting process requires the listing of sources of data, an exploration of these resources, the making of inquiries about other possible data sources, the evaluation of data quality, and the tabulation of data for its final processing. This process should involve many experts, since the data collected must be purpose-oriented. Questions concern the type, accuracy, and time-frame of the data.
Databases relevant to water management include (Grigg, 1996): • a geographic-based system inventory database • a database for location and inventorying the
components of the urban water systems• a condition index database • a system water balance database • a database for real-time system studies and
management
• a data management system for the operation of treatment plants and the generation of environmental information
• assorted analysis and design databases • a financial database
A database management system (DBMS) is a software programme designed to supplement the standard operating system by allowing for greater data integration, complex file structure, rapid retrieval and changes, and better data security. A wide choice of commercial database packages is available. Specialists should be consulted when planning, implementing and organising the database. Procedures and routines need to be established for the control of incoming data (in terms of type, volume and accuracy), for the updating of data and for establishing the type of data and the time-frames over which these are to be reviewed and updated.
In an integrated planning model, the development of an adequate database framework is a fundamental first step. A high level of data credibility must be built into the system. Adequate “metadata” must be provided. This includes descriptions of sampling protocols, analytical methods, internal quality assurance and quality control, documentation of the original intent of the data collection effort and the modifications made as the programme evolved. Quality Control and Quality Assurance programmes should be a part of any data management programme. In modelling, a statistical level of confidence can be established for the calibration of the model, and model audits should be performed to validate mathematical representations of processes. Quality assurance should be extended beyond the remit of experts to include the broader public and stakeholders through a participatory process (Funtwowisz and Ravetz, 1991).
The development of a shared database framework requires a high level of cooperation among agencies. Utilities, urban, river basin and coastal agencies should cooperate and to the extent that it is possible, share information resources and database know-how. Cooperation results in the more efficient collection and use of data.
4. DECISION SUPPORT TOOLS AND TECHNIQUESThis chapter presents tools for the management of information integrated urban water system planning and management. Firstly, some general issues of information management are described. A brief presentation of decision-support systems follows. Assessment techniques that facilitate the comparison of alternatives are then discussed. The chapter concludes with a presentation of methods for the overall performance appraisal of the coastal urban water system.
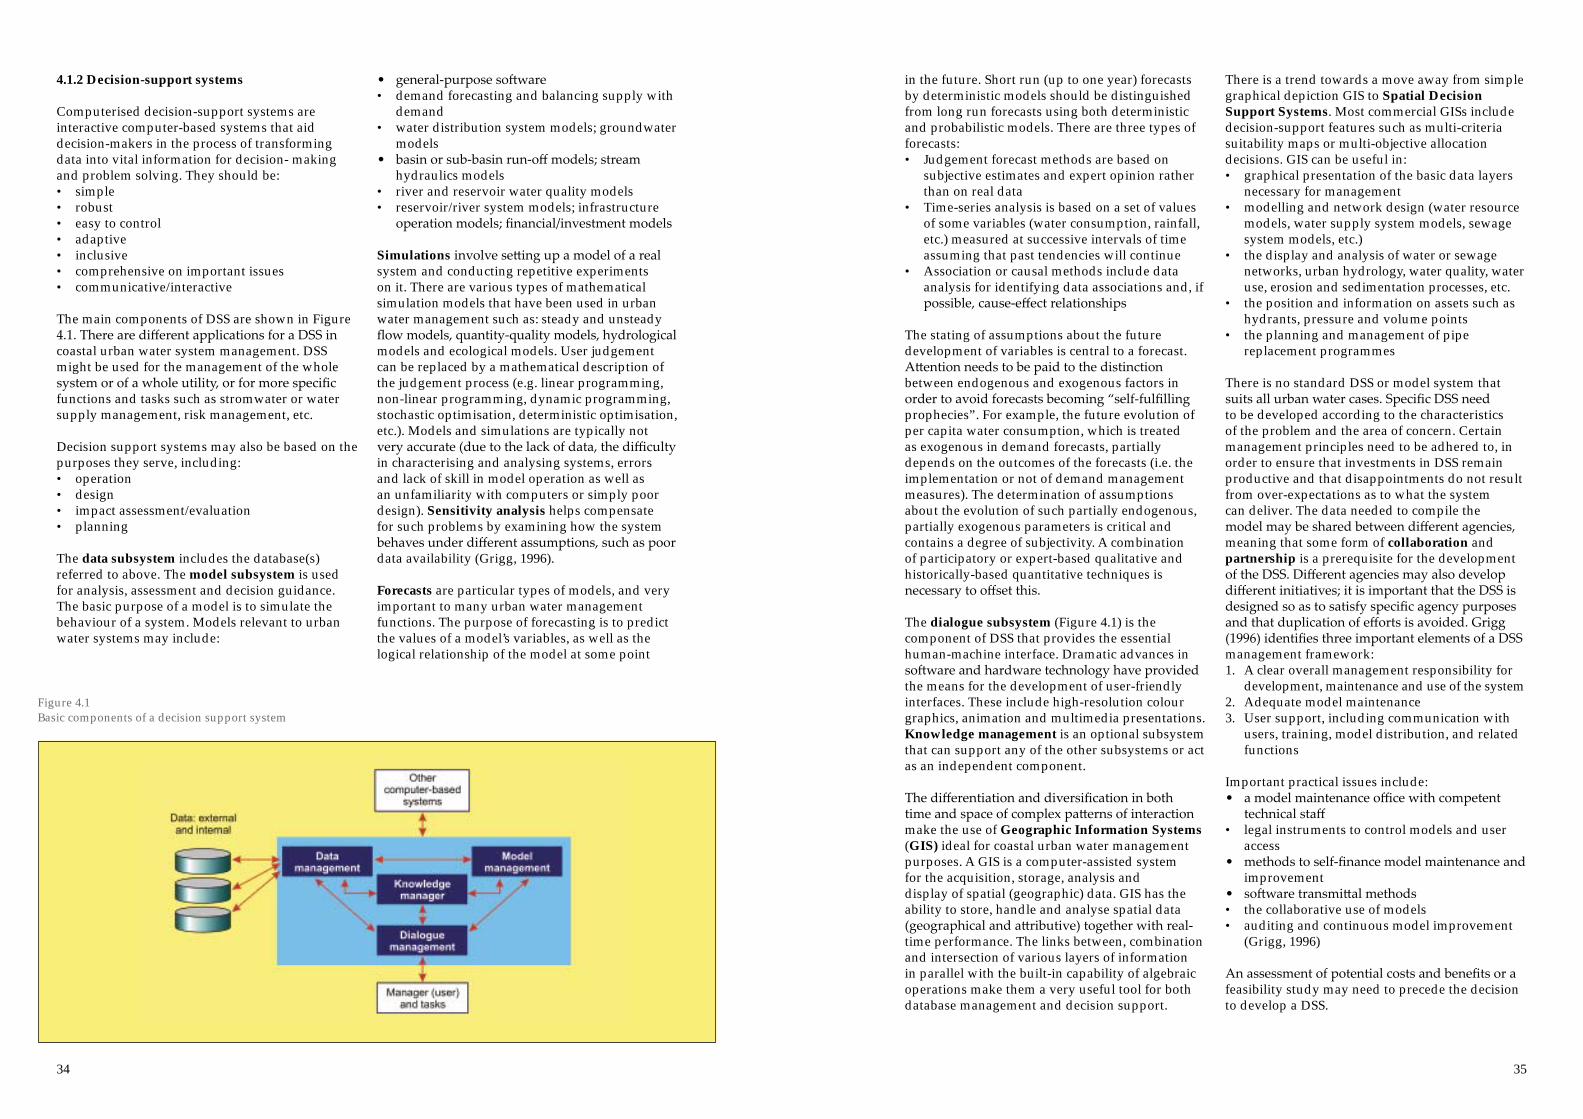
34 35
4.1.2 Decision-support systems
Computerised decision-support systems are interactive computer-based systems that aid decision-makers in the process of transforming data into vital information for decision- making and problem solving. They should be:• simple • robust • easy to control • adaptive • inclusive • comprehensive on important issues• communicative/interactive
The main components of DSS are shown in Figure 4.1. There are different applications for a DSS in coastal urban water system management. DSS might be used for the management of the whole system or of a whole utility, or for more specific functions and tasks such as stromwater or water supply management, risk management, etc.
Decision support systems may also be based on the purposes they serve, including:• operation• design• impact assessment/evaluation• planning
The data subsystem includes the database(s) referred to above. The model subsystem is used for analysis, assessment and decision guidance. The basic purpose of a model is to simulate the behaviour of a system. Models relevant to urban water systems may include:
• general-purpose software • demand forecasting and balancing supply with
demand • water distribution system models; groundwater
models • basin or sub-basin run-off models; stream
hydraulics models • river and reservoir water quality models• reservoir/river system models; infrastructure
operation models; financial/investment models
Simulations involve setting up a model of a real system and conducting repetitive experiments on it. There are various types of mathematical simulation models that have been used in urban water management such as: steady and unsteady flow models, quantity-quality models, hydrological models and ecological models. User judgement can be replaced by a mathematical description of the judgement process (e.g. linear programming, non-linear programming, dynamic programming, stochastic optimisation, deterministic optimisation, etc.). Models and simulations are typically not very accurate (due to the lack of data, the difficulty in characterising and analysing systems, errors and lack of skill in model operation as well as an unfamiliarity with computers or simply poor design). Sensitivity analysis helps compensate for such problems by examining how the system behaves under different assumptions, such as poor data availability (Grigg, 1996).
Forecasts are particular types of models, and very important to many urban water management functions. The purpose of forecasting is to predict the values of a model’s variables, as well as the logical relationship of the model at some point
in the future. Short run (up to one year) forecasts by deterministic models should be distinguished from long run forecasts using both deterministic and probabilistic models. There are three types of forecasts:• Judgement forecast methods are based on
subjective estimates and expert opinion rather than on real data
• Time-series analysis is based on a set of values of some variables (water consumption, rainfall, etc.) measured at successive intervals of time assuming that past tendencies will continue
• Association or causal methods include data analysis for identifying data associations and, if possible, cause-effect relationships
The stating of assumptions about the future development of variables is central to a forecast. Attention needs to be paid to the distinction between endogenous and exogenous factors in order to avoid forecasts becoming “self-fulfilling prophecies”. For example, the future evolution of per capita water consumption, which is treated as exogenous in demand forecasts, partially depends on the outcomes of the forecasts (i.e. the implementation or not of demand management measures). The determination of assumptions about the evolution of such partially endogenous, partially exogenous parameters is critical and contains a degree of subjectivity. A combination of participatory or expert-based qualitative and historically-based quantitative techniques is necessary to offset this.
The dialogue subsystem (Figure 4.1) is the component of DSS that provides the essential human-machine interface. Dramatic advances in software and hardware technology have provided the means for the development of user-friendly interfaces. These include high-resolution colour graphics, animation and multimedia presentations. Knowledge management is an optional subsystem that can support any of the other subsystems or act as an independent component.
The differentiation and diversification in both time and space of complex patterns of interaction make the use of Geographic Information Systems (GIS) ideal for coastal urban water management purposes. A GIS is a computer-assisted system for the acquisition, storage, analysis and display of spatial (geographic) data. GIS has the ability to store, handle and analyse spatial data (geographical and attributive) together with real-time performance. The links between, combination and intersection of various layers of information in parallel with the built-in capability of algebraic operations make them a very useful tool for both database management and decision support.
There is a trend towards a move away from simple graphical depiction GIS to Spatial Decision Support Systems. Most commercial GISs include decision-support features such as multi-criteria suitability maps or multi-objective allocation decisions. GIS can be useful in: • graphical presentation of the basic data layers
necessary for management• modelling and network design (water resource
models, water supply system models, sewage system models, etc.)
• the display and analysis of water or sewage networks, urban hydrology, water quality, water use, erosion and sedimentation processes, etc.
• the position and information on assets such as hydrants, pressure and volume points
• the planning and management of pipe replacement programmes
There is no standard DSS or model system that suits all urban water cases. Specific DSS need to be developed according to the characteristics of the problem and the area of concern. Certain management principles need to be adhered to, in order to ensure that investments in DSS remain productive and that disappointments do not result from over-expectations as to what the system can deliver. The data needed to compile the model may be shared between different agencies, meaning that some form of collaboration and partnership is a prerequisite for the development of the DSS. Different agencies may also develop different initiatives; it is important that the DSS is designed so as to satisfy specific agency purposes and that duplication of efforts is avoided. Grigg (1996) identifies three important elements of a DSS management framework: 1. A clear overall management responsibility for
development, maintenance and use of the system2. Adequate model maintenance 3. User support, including communication with
users, training, model distribution, and related functions
Important practical issues include: • a model maintenance office with competent
technical staff • legal instruments to control models and user
access • methods to self-finance model maintenance and
improvement • software transmittal methods • the collaborative use of models • auditing and continuous model improvement
(Grigg, 1996)
An assessment of potential costs and benefits or a feasibility study may need to precede the decision to develop a DSS.
Figure 4.1 Basic components of a decision support system
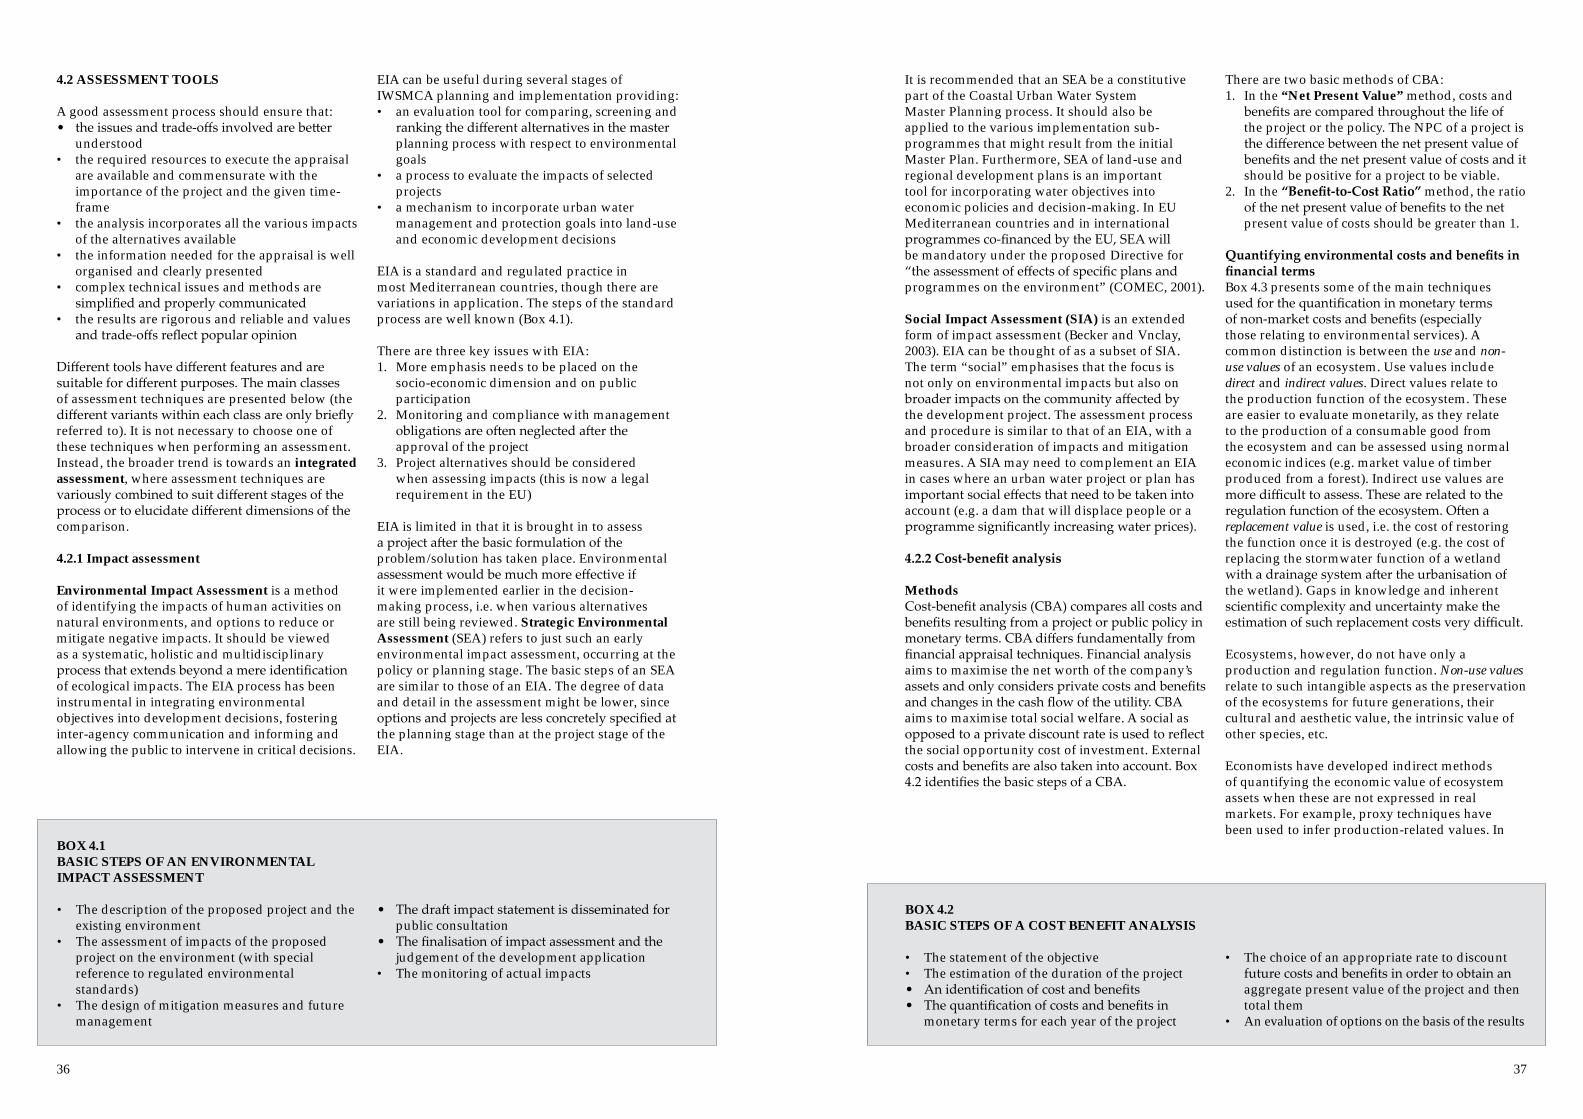
36 37
4.2 ASSESSMENT TOOLS
A good assessment process should ensure that:• the issues and trade-offs involved are better
understood • the required resources to execute the appraisal
are available and commensurate with the importance of the project and the given time-frame
• the analysis incorporates all the various impacts of the alternatives available
• the information needed for the appraisal is well organised and clearly presented
• complex technical issues and methods are simplified and properly communicated
• the results are rigorous and reliable and values and trade-offs reflect popular opinion
Different tools have different features and are suitable for different purposes. The main classes of assessment techniques are presented below (the different variants within each class are only briefly referred to). It is not necessary to choose one of these techniques when performing an assessment. Instead, the broader trend is towards an integrated assessment, where assessment techniques are variously combined to suit different stages of the process or to elucidate different dimensions of the comparison.
4.2.1 Impact assessment
Environmental Impact Assessment is a method of identifying the impacts of human activities on natural environments, and options to reduce or mitigate negative impacts. It should be viewed as a systematic, holistic and multidisciplinary process that extends beyond a mere identification of ecological impacts. The EIA process has been instrumental in integrating environmental objectives into development decisions, fostering inter-agency communication and informing and allowing the public to intervene in critical decisions.
EIA can be useful during several stages of IWSMCA planning and implementation providing: • an evaluation tool for comparing, screening and
ranking the different alternatives in the master planning process with respect to environmental goals
• a process to evaluate the impacts of selected projects
• a mechanism to incorporate urban water management and protection goals into land-use and economic development decisions
EIA is a standard and regulated practice in most Mediterranean countries, though there are variations in application. The steps of the standard process are well known (Box 4.1).
There are three key issues with EIA:1. More emphasis needs to be placed on the
socio-economic dimension and on public participation
2. Monitoring and compliance with management obligations are often neglected after the approval of the project
3. Project alternatives should be considered when assessing impacts (this is now a legal requirement in the EU)
EIA is limited in that it is brought in to assess a project after the basic formulation of the problem/solution has taken place. Environmental assessment would be much more effective if it were implemented earlier in the decision-making process, i.e. when various alternatives are still being reviewed. Strategic Environmental Assessment (SEA) refers to just such an early environmental impact assessment, occurring at the policy or planning stage. The basic steps of an SEA are similar to those of an EIA. The degree of data and detail in the assessment might be lower, since options and projects are less concretely specified at the planning stage than at the project stage of the EIA.
It is recommended that an SEA be a constitutive part of the Coastal Urban Water System Master Planning process. It should also be applied to the various implementation sub-programmes that might result from the initial Master Plan. Furthermore, SEA of land-use and regional development plans is an important tool for incorporating water objectives into economic policies and decision-making. In EU Mediterranean countries and in international programmes co-financed by the EU, SEA will be mandatory under the proposed Directive for “the assessment of effects of specific plans and programmes on the environment” (COMEC, 2001).
Social Impact Assessment (SIA) is an extended form of impact assessment (Becker and Vnclay, 2003). EIA can be thought of as a subset of SIA. The term “social” emphasises that the focus is not only on environmental impacts but also on broader impacts on the community affected by the development project. The assessment process and procedure is similar to that of an EIA, with a broader consideration of impacts and mitigation measures. A SIA may need to complement an EIA in cases where an urban water project or plan has important social effects that need to be taken into account (e.g. a dam that will displace people or a programme significantly increasing water prices).
4.2.2 Cost-benefit analysis
MethodsCost-benefit analysis (CBA) compares all costs and benefits resulting from a project or public policy in monetary terms. CBA differs fundamentally from financial appraisal techniques. Financial analysis aims to maximise the net worth of the company’s assets and only considers private costs and benefits and changes in the cash flow of the utility. CBA aims to maximise total social welfare. A social as opposed to a private discount rate is used to reflect the social opportunity cost of investment. External costs and benefits are also taken into account. Box 4.2 identifies the basic steps of a CBA.
There are two basic methods of CBA:1. In the “Net Present Value” method, costs and
benefits are compared throughout the life of the project or the policy. The NPC of a project is the difference between the net present value of benefits and the net present value of costs and it should be positive for a project to be viable.
2. In the “Benefit-to-Cost Ratio” method, the ratio of the net present value of benefits to the net present value of costs should be greater than 1.
Quantifying environmental costs and benefits in financial termsBox 4.3 presents some of the main techniques used for the quantification in monetary terms of non-market costs and benefits (especially those relating to environmental services). A common distinction is between the use and non-use values of an ecosystem. Use values include direct and indirect values. Direct values relate to the production function of the ecosystem. These are easier to evaluate monetarily, as they relate to the production of a consumable good from the ecosystem and can be assessed using normal economic indices (e.g. market value of timber produced from a forest). Indirect use values are more difficult to assess. These are related to the regulation function of the ecosystem. Often a replacement value is used, i.e. the cost of restoring the function once it is destroyed (e.g. the cost of replacing the stormwater function of a wetland with a drainage system after the urbanisation of the wetland). Gaps in knowledge and inherent scientific complexity and uncertainty make the estimation of such replacement costs very difficult.
Ecosystems, however, do not have only a production and regulation function. Non-use values relate to such intangible aspects as the preservation of the ecosystems for future generations, their cultural and aesthetic value, the intrinsic value of other species, etc.
Economists have developed indirect methods of quantifying the economic value of ecosystem assets when these are not expressed in real markets. For example, proxy techniques have been used to infer production-related values. In
BOX 4.1BASIC STEPS OF AN ENVIRONMENTAL IMPACT ASSESSMENT
• The description of the proposed project and the existing environment
• The assessment of impacts of the proposed project on the environment (with special reference to regulated environmental standards)
• The design of mitigation measures and future management
• The draft impact statement is disseminated for public consultation
• The finalisation of impact assessment and the judgement of the development application
• The monitoring of actual impacts
BOX 4.2BASIC STEPS OF A COST BENEFIT ANALYSIS
• The statement of the objective • The estimation of the duration of the project • An identification of cost and benefits • The quantification of costs and benefits in
monetary terms for each year of the project
• The choice of an appropriate rate to discount future costs and benefits in order to obtain an aggregate present value of the project and then total them
• An evaluation of options on the basis of the results

38 39
the Hedonic Price Approach differences in market values of specific goods or services are linked to differences in environmental attributes. The value of a river, for example, can be inferred by a comparison of the values of properties on and at a distance from the river (allowing for other possible factors impacting on differentiation). The Travel Cost Method estimates the surplus of consumers for recreation sites, by using travel costs as proxy for price, and then deriving the relationship between visiting rates and the cost of visiting. Contingent valuations aim to calculate ecosystem value as if markets for their services and goods existed. They use interviews and questionnaires to elicit the valuations (“bids”) of respondents in hypothetical situations. There are two basic approaches. In the Willingness To Pay (WTP) approach, people are asked how much they would pay for these goods had the hypothetical, artificial markets existed. In the Willingness To Accept (WTA) compensation technique, respondents are asked to express how much they should be paid in order to allow a certain loss in the ecosystem.
CriticismStrong criticism has been levelled against both the methodological and the philosophical/ethical foundations of economic valuation techniques (Martinez-Allier et al, 1998, Vatn and Bromley, 1994):1. Willingness to pay depends upon the ability
to pay. Contingent valuations may lead to inequitable outcomes benefiting higher income groups.
2. Economic valuation techniques assign supremacy to the short-term preferences of individuals. However, these are measured on a basis of imperfect information, especially regarding future outcomes. Had the long-term impacts of decisions been known (e.g. impacts from climate change or exhaustion of groundwater reserves), then the responses (“bids”) of individuals could have been very different.
3. “Rational” individual preferences may result in long-term catastrophic social outcomes (e.g. the destruction of life-support ecosystems). Thus ecosystem services may have a much higher value than that assigned to them by individuals.
4. Economic valuation assumes an infinite potential substitution of ecosystem losses through monetary payments. Certain ecological changes, however, may be irreversible. It is hence risky to assume that critical life-support systems (such as the global climate system) will be substituted by capital or technology when needed.
5. Some critiques argue against the valuation of non-use values in monetary terms. The big differences between WTA and WTP valuations and the unwillingness of many respondents to state minimum compensation sums is read as evidence that some people do not believe in the very idea of monetary compensation for some ecosystem losses.
Discourse-based, Deliberative Inclusion Processes have been proposed as a complement or substitute to monetary valuation (Wilson and Howarth, 2002, Martinez-Allier et al, 1998; see Chapter 8).
The gross valuation of costs and benefits may conceal important distributional differences. For example, all benefits from a new water reservoir may accrue to the city, whereas costs fall upon the shoulders of the local population by the water source. CBA for each of the different population segments or geographical areas affected by a plan/project is necessary to inform more equitable decision-making.
DiscountingCosts and benefits are computed in real values (constant instead of current prices). Discounting is not only an outcome of inflation. It relates to the changing value of money over time (i.e. people prefer having 100 Euros today, than 100 Euros after 20 years). The choice of discount rate is one of the most disputed subjects of economics. There are two main approaches. 1. In the “Social Time Preference Rate” approach,
the discount rate is assumed mainly as a political parameter to be decided on the basis of a per capita income growth perspective and an assumption of pure rate of time preference among consumers.
2. In the “Social Opportunity Cost of Capital” approach, the rate is determined on the basis of evidence of profits from alternative investment opportunities (Munda, 1995).
The concept of discounting has been criticised as inappropriate (or immoral) because it is inconsistent with the ideas of conservation and sustainability. The higher the discount rate, the faster the resources are likely to be depleted, thus discounting contains an inbuilt bias against future generations. On the other hand, a low discount rate causes more projects to produce a positive net value and may cause an increase in investment activity also leading to an increased degradation of resources (Munda, 1995). A CBA based on net present values may be inappropriate when assessing the allocation of critical resources (e.g. groundwater reserves or certain freshwater aquatic ecosystems) that should be transferred to future generations. “Social bequests” (political decisions for “transfers” or “set asides”, such as definition of minimum standards or protected areas) are seen as more appropriate in such instances (Norgaard, 1992, Bromley, 1998).
Cost-effectiveness analysisCost-Effectiveness Analysis (CEA) can take into account social or environmental finer points. Instead of comparing gross costs and benefits, it aims to find the least cost alternative of achieving
specified objectives. Cost-Effectiveness Analysis may be preferable to CBA in urban water decisions where critical resources or services are at stake.
4.2.3 Multi-criteria decision aid
CBA is based on the comparison of alternatives against one dimension: economic value. It is now increasingly understood that social welfare is a multidimensional variable which includes, inter alia, income, growth, environmental quality, distribution equity, the supply of public facilities, accessibility, etc. (Munda, 1995). Water resource projects and management actions in particular involve multiple purposes, multiple means and multiple constituencies (Grigg, 1996). Economic cost is not the only goal in urban water system planning. Several other goals pertaining to specific resource, ecological, service or social conditions are also important. The comparison of alternatives and the selection of a best strategy is thus a typical multi-criteria problem, with several alternatives based upon various dimensions (criteria, goals, and objectives).
Multi-Criteria Decision Aid (MCDA) aims to gauge various alternatives using a number of criteria (economic, social and environmental) and to take into account the multiple stakeholders involved. Since one alternative may be better than another in one criterion and worse according to another, in a multi-criteria problem there is no single solution optimising all criteria simultaneously. Compromise solutions have to be found. There are various techniques (also available as software) which, based on different restrictive hypotheses, build an aggregation procedure to formally rank alternatives (multi-attribute utility models, analytical hierarchy process, outranking methods, ideal point approaches and aspiration level models). The interested reader should refer to Janssen, 1992 or Munda, 1995 for review and technical details of different MCDA methods and models.
Modern multi-criteria decision support models allow decision-makers to interact with the assessment and express their preference (e.g. by ranking the different criteria or by deciding on the correlation between values expressed in different units). Qualitative expert judgements are also possible for the assessment of criteria in cases of a lack of or of unreliable quantitative information; there are several techniques (also available as software) which can transform qualitative information into quantitative data.
Some practitioners reject the notion of “algorithmic solutions” to multi-criteria problems (Martinez-Alier et al, 1998). Different criteria and values are seen as “incommensurable” and only “weakly comparable”. There is no universal, objective
BOX 4.3BASIC ECONOMIC VALUATION TECHNIQUES FOR ASSESSING COSTS AND BENEFITS
Technique ApplicationShadow Price The opportunity cost of having one more or one less of a goodTravel Cost The value that consumers place on non-marketed goods through their travel
patterns and behaviour as reflected in their willingness to sustain travel costs and inconvenience in order to access particular facilities. This yields best results when applied to well-defined recreational sites.
Hedonic Price Uses differences between markets to quantify environmental quality. Housing and labour market information could serve, for example, to gauge several environmental factors such as air pollution, scenic values and occupational risks.
Contingency Valuation
Uses survey techniques to gauge people’s willingness to pay to receive benefits or to avoid a loss
Existence Values The willingness of non-users to pay for the existence of environmental amenitiesBequest Value People’s willingness to pay now to ensure that certain values are maintained and are
available for future generationsOption Value The price people are willing to pay to keep open future options, such as access to a
natural habitat that faces closure even if they do not currently make use of it Least Cost Alternative
The cost of providing the same good by other means
Case Specific approaches
Used to set lower or upper limits on the value of goods (environmentally-sensitive-area charges)

40 41
way to aggregate the scores, or rank the different alternatives. From this perspective, MCDA is seen as an aid to the decision-making process and the debate between stakeholders rather than a decision tool that can point to the “best” solution (or rank solutions for that purpose). In its simplest form, such aid can be provided by a multi-criteria impact matrix where a qualitative and/or quantitative impact assessment is provided for each alternative/criterion. Decision-makers and the public can then debate the advantages and disadvantages of alternative strategies. More advanced platforms of MCDA that facilitate debate and participation are also available (Box 4.4).
4.2.4 Scenario analysis
Prospective studies offer authorities, planners and managers the opportunity of setting development strategies within a broader context that takes into account uncertainty about changes in internal and external conditions. A scenario is usually long-term (time horizon up to 30 years) and could be regarded as a link between the present and the future through a pathway built in stages of 5-10 year periods. A simplified picture of the phases of a scenario preparation list follows:
• the identification of critical factors influencing development opportunities
• the setting up of hypotheses about changes in critical factors
• the development of coherent sets of hypotheses on the evolution of changes as alternative pathways
• the analysis of impacts and cross impacts on environmental factors and condition with consideration for feedback effects on development opportunities
Scenarios can be used in planning:• in problem formulation, as a tool for envisaging
alternative futures and thus for identifying gaps and problems
• in the vision-making and goal-setting stage, providing a discussion platform for stakeholder and inter-agency exchange of ideas about the future state of the system, identifying desired evolutions and long-term goals,
• as a tool to structure forecasts (e.g. water demand forecasts upon four different urban development scenarios)
• as a means to formulate and express alternative strategies based on mixed options. An MCDA might then be applied to compare alternative scenarios rather than alternative options alone
4.3 PERFORMANCE ASSESSMENT AND REPORTING
An appraisal of the performance of an urban water system is a crucial part of the planning process. The techniques presented below can be used to assess and report on overall urban water system or utility performance. Most of these techniques can also be used in the problem scoping phase (i.e. “scanning” the system to identify main deficiencies). Some are also applicable in the comparison of alternatives.
4.3.1 Life Cycle Assessment (LCA)
The LCA method, created by SETAC (the Society of Environmental Toxicology and Chemistry) was designed as a tool for the evaluation of the impacts of the production, use and disposal of a product. It is a “cradle to grave” approach that provides an overall view of the complex interactions between different phases in the life of a product, production process or activity. LCA can be extended from the assessment of “products” to the assessment of whole systems, such as the coastal urban water system.
Various software tools have been developed to calculate the impacts of processes and products. The basic steps of an LCA include: • The definition of system boundaries, both
temporal and spatial (e.g. for urban water systems these start from the withdrawal of raw water to the discharge of the treated effluents and sludge, Lundin, 1999)
• The compilation of an inventory of material and energy streams crossing the system’s boundaries, either as inputs or outputs, and linking it with processes
• An impact assessment of the mass and energy streams of the previous phase, including:
• the classification of impacts. SETAC specifies the following impact categories: resource depletion, greenhouse effect (direct and indirect), ozone layer depletion, acidification, eutrophication, photochemical oxidant, formation, human toxicity, aquatic toxicity and landfill volume. Impacts can be classified on the basis of the geographical scale of their influence from global (climate change) to local (noise, occupational health).
• specification and quantification of impacts, where possible
• equivalency of the different impacts (using established normalisation factors such as those available from SETAC). The results can also be normalised and expressed as fractions of the total anthropogenic contribution to the various impact categories in a given year in a given area
In urban water management, LCA can contribute to the:• Evaluation of the overall life-cycle
environmental performance of a coastal urban water system, an urban water utility, a specific service or a specific component of the system (e.g. distribution pipes), taking into account all environmental impacts (energy consumption, solid waste generation, land occupied, etc. – see for example, Lundin, 1999). Progress in the management of the systems can be appraised by performing LCAs at different points in time.
• Comparison of the environmental performance of several utilities (“benchmarking”). The Dutch Water Industry Association, for example, uses an LCA-based indicator to compare the environmental performance of the country’s drinking water utilities (see Box 4.5).
• Evaluation of alternative policy and project options at the planning stage, by comparing their environmental advantages and disadvantages in a holistic manner. For example, van Tilburg (1997) compared single and double domestic water supply showing that the environmental impact of water supply systems is dependant on the purification layout and the piping material. Tillman et al (1998) compared a conventional wastewater system, to a localised sand filter-based treatment system and to a urine separation system in Sweden.
Central to LCA is the ‘spatial and process boundaries’ concept. Assessment is performed in consecutive cycles of extended boundaries. First, the inputs, outputs and impacts of the main process are examined (e.g. urban water supply and sewage management). These boundaries are then extended to include a broader zone of influence for the process (e.g. the coastal zone, the river basin and other water users, etc.). This zone could, in theory, even be extended to take into account the impacts of secondary processes (e.g. impacts from the production of materials that are used in the system, e.g. pipes for the distribution network).
LCA can be used as a management tool. In an integrated LCA process, auditing and impact assessment are accompanied by a third stage of proposing modifications to the processes (e.g. in the design or distribution of the product; in the management of the system. etc.) to improve performance. Improvements are first envisaged in an ideal situation where the best possible practices and solutions can be applied and then adapted to politico-socio-economic constraints. Different constraints apply to different spatial and process boundaries. Repetitive cycles of boundary extensions and improvement proposals can be performed.
BOX 4.4A PLATFORM FOR PARTICIPATORY MCDA: THE NAIADE SOFTWARE MODEL (Munda, 1995, de Marchi et al, 2002)
The goal of NAIADE (Novel Approach to Imprecise Assessment and Decision Environments) is to improve communication among the social actors involved and to aid conflict resolution. Participation is incorporated into various stages of the evaluation through interviews, written questionnaires and focus group meetings. Stakeholders structure the problem and select the alternatives and the criteria for the assessment.
The model conducts two types of evaluation. The “impact matrix” is constructed with value scores for each of the alternatives/criteria. This matrix is based on data from specialised literature and technical reports, including quantitative, qualitative, crisp and fuzzy values. The various types of uncertainty (i.e. inaccuracy, unreliability, incompleteness and equivocation) are also taken into account. The results of the impact matrix allow a comparison of the alternatives and generate an initial ranking. An “equity matrix” is then constructed using the value judgements made by the participating stakeholders in their written questionnaires and interviews. The equity analysis
allows a ranking of the alternatives according to the impacts of the actors or their preferences. It provides information about the position of each of the stakeholders on each of the alternatives. Possible formations of coalitions among stakeholders on certain alternatives or possible “veto situations” are identified. This allows an insight into which alternatives are more likely to be accepted. Highest-ranking alternatives may prove least feasible as determined by the power of each stakeholder or coalition of stakeholders. Conflict analysis procedures can be integrated with the MCDA, asking that decision-makers take “defensible” or “maintainable” decisions that reduce the degree of discrepancy and promote compromise solutions (Corral Quintana, 2000). Consecutive runs of focus group meetings with stakeholders can lead to a convergence of stances and a resolution of conflict.
NAIADE has been applied in the evaluation of water management options for the city of Troina in Sicily (de Marchi et al, 2000) and for the evaluation of urban water demand and quality needs.
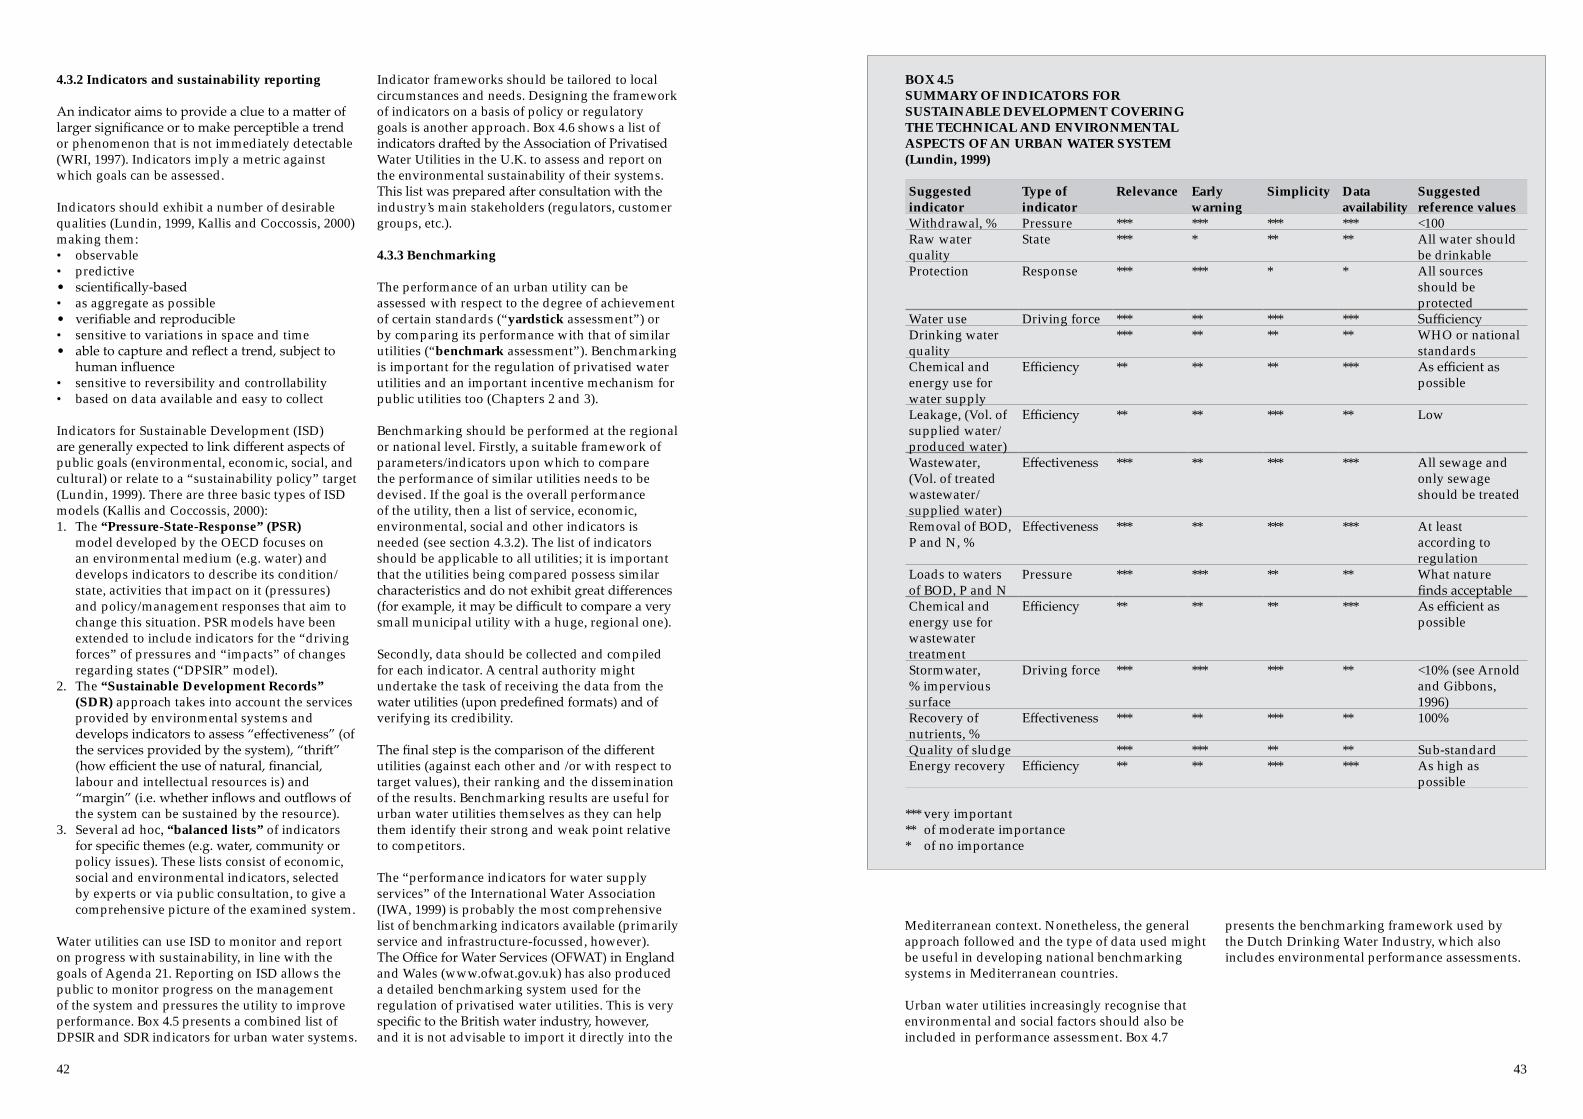
42 43
4.3.2 Indicators and sustainability reporting
An indicator aims to provide a clue to a matter of larger significance or to make perceptible a trend or phenomenon that is not immediately detectable (WRI, 1997). Indicators imply a metric against which goals can be assessed.
Indicators should exhibit a number of desirable qualities (Lundin, 1999, Kallis and Coccossis, 2000) making them:• observable • predictive • scientifically-based • as aggregate as possible • verifiable and reproducible • sensitive to variations in space and time • able to capture and reflect a trend, subject to
human influence • sensitive to reversibility and controllability • based on data available and easy to collect
Indicators for Sustainable Development (ISD) are generally expected to link different aspects of public goals (environmental, economic, social, and cultural) or relate to a “sustainability policy” target (Lundin, 1999). There are three basic types of ISD models (Kallis and Coccossis, 2000):1. The “Pressure-State-Response” (PSR)
model developed by the OECD focuses on an environmental medium (e.g. water) and develops indicators to describe its condition/state, activities that impact on it (pressures) and policy/management responses that aim to change this situation. PSR models have been extended to include indicators for the “driving forces” of pressures and “impacts” of changes regarding states (“DPSIR” model).
2. The “Sustainable Development Records” (SDR) approach takes into account the services provided by environmental systems and develops indicators to assess “effectiveness” (of the services provided by the system), “thrift” (how efficient the use of natural, financial, labour and intellectual resources is) and “margin” (i.e. whether inflows and outflows of the system can be sustained by the resource).
3. Several ad hoc, “balanced lists” of indicators for specific themes (e.g. water, community or policy issues). These lists consist of economic, social and environmental indicators, selected by experts or via public consultation, to give a comprehensive picture of the examined system.
Water utilities can use ISD to monitor and report on progress with sustainability, in line with the goals of Agenda 21. Reporting on ISD allows the public to monitor progress on the management of the system and pressures the utility to improve performance. Box 4.5 presents a combined list of DPSIR and SDR indicators for urban water systems.
Indicator frameworks should be tailored to local circumstances and needs. Designing the framework of indicators on a basis of policy or regulatory goals is another approach. Box 4.6 shows a list of indicators drafted by the Association of Privatised Water Utilities in the U.K. to assess and report on the environmental sustainability of their systems. This list was prepared after consultation with the industry’s main stakeholders (regulators, customer groups, etc.).
4.3.3 Benchmarking
The performance of an urban utility can be assessed with respect to the degree of achievement of certain standards (“yardstick assessment”) or by comparing its performance with that of similar utilities (“benchmark assessment”). Benchmarking is important for the regulation of privatised water utilities and an important incentive mechanism for public utilities too (Chapters 2 and 3).
Benchmarking should be performed at the regional or national level. Firstly, a suitable framework of parameters/indicators upon which to compare the performance of similar utilities needs to be devised. If the goal is the overall performance of the utility, then a list of service, economic, environmental, social and other indicators is needed (see section 4.3.2). The list of indicators should be applicable to all utilities; it is important that the utilities being compared possess similar characteristics and do not exhibit great differences (for example, it may be difficult to compare a very small municipal utility with a huge, regional one).
Secondly, data should be collected and compiled for each indicator. A central authority might undertake the task of receiving the data from the water utilities (upon predefined formats) and of verifying its credibility.
The final step is the comparison of the different utilities (against each other and /or with respect to target values), their ranking and the dissemination of the results. Benchmarking results are useful for urban water utilities themselves as they can help them identify their strong and weak point relative to competitors.
The “performance indicators for water supply services” of the International Water Association (IWA, 1999) is probably the most comprehensive list of benchmarking indicators available (primarily service and infrastructure-focussed, however). The Office for Water Services (OFWAT) in England and Wales (www.ofwat.gov.uk) has also produced a detailed benchmarking system used for the regulation of privatised water utilities. This is very specific to the British water industry, however, and it is not advisable to import it directly into the
Mediterranean context. Nonetheless, the general approach followed and the type of data used might be useful in developing national benchmarking systems in Mediterranean countries.
Urban water utilities increasingly recognise that environmental and social factors should also be included in performance assessment. Box 4.7
presents the benchmarking framework used by the Dutch Drinking Water Industry, which also includes environmental performance assessments.
BOX 4.5SUMMARY OF INDICATORS FOR SUSTAINABLE DEVELOPMENT COVERING THE TECHNICAL AND ENVIRONMENTAL ASPECTS OF AN URBAN WATER SYSTEM (Lundin, 1999)
Suggested indicator
Type of indicator
Relevance Early warning
Simplicity Data availability
Suggested reference values
Withdrawal, % Pressure *** *** *** *** <100Raw water quality
State *** * ** ** All water should be drinkable
Protection Response *** *** * * All sources should be protected
Water use Driving force *** ** *** *** SufficiencyDrinking water quality
*** ** ** ** WHO or national standards
Chemical and energy use for water supply
Efficiency ** ** ** *** As efficient as possible
Leakage, (Vol. of supplied water/produced water)
Efficiency ** ** *** ** Low
Wastewater, (Vol. of treated wastewater/ supplied water)
Effectiveness *** ** *** *** All sewage and only sewage should be treated
Removal of BOD, P and N, %
Effectiveness *** ** *** *** At least according to regulation
Loads to waters of BOD, P and N
Pressure *** *** ** ** What nature finds acceptable
Chemical and energy use for wastewater treatment
Efficiency ** ** ** *** As efficient as possible
Stormwater, % impervious surface
Driving force *** *** *** ** <10% (see Arnold and Gibbons, 1996)
Recovery of nutrients, %
Effectiveness *** ** *** ** 100%
Quality of sludge *** *** ** ** Sub-standardEnergy recovery Efficiency ** ** *** *** As high as
possible
*** very important** of moderate importance* of no importance

44 45
BOX 4.6UK WATER INDUSTRY ENVIRONMENTAL SUSTAINABILITY INDICATORS (Water U.K., 1999)
Categories IndicatorsWater servicesWater demand and availability Population with sufficient water (%)
UK – Population growth possible with current resources (%)Household water demand Per capita water consumption (Lt/capita/day)Non-household water use Water efficiency (Lt/£ GDP)Leakage Total leakage from the network (Ml/day)Drinking water quality Tests complying with standards (%)Foul flooding Properties flooded (%)Combined sewer overflows Overflows in satisfactory condition (%)Wastewater treatment works Population served by works meeting numerical standards (%)Good environmental managementEnvironmental engagement Sectoral ranking in the Business in the Environment national
survey (%)Convictions for public health and environmental offences
Number of category 1 convictions
Biodiversity and the environmentSpecies Priority species with action plans (%)Habitats Priority habitats with action plans (%) River water quality Rivers in classes A-D (%)Bathing water quality Designated waters achieving mandatory standards (%) and
guideline value (%) as advocated in the EC Bathing Water Directive
Energy and materialsEnergy used at fixed sites Energy used per Ml water supplied (kWh)
Energy used per Ml wastewater treated (kWh)Renewable energy at fixed sites Renewable energy as a percentage of total energy usedCO2 emissions at fixed sites Emissions per head population (tonnes/year)CO2 emissions from road transport Emissions per head population (tonnes/year)Sludge management Sludge recycled/reused (%)
BOX 4.7BENCHMARKING INDICATORS IN THE DUTCH DRINKING WATER INDUSTRY (VEWIN, 2000)
Water qualityThe quality of drinking water is expressed in an index derived by taking the base of 100 points for perfect quality and deducting points for the various parameters that fall short of the given standard required by the Water Act or the recommendations of the National Water Industry Association. The closer the average measured value lies to the standard, the less the deduction.Incidental under-achieving values also lead to deductions, by which the average duration, impact and average surplus value are decisive.
ServiceThe quality of service is defined as the level by which the expectations of the customer have been satisfied expressed as a reported figure that indicates the level of service. For this, the interests of the customer on the various dimensions of service together with performance as experienced by the customer are studied. The quality of service is determined using a telephone inquiry session involving almost 6,000 small users who had recent contact with their water company. In addition to the request for a ranking for the overall level of service, a number of detailed questions are asked concerning various aspects of service.
EnvironmentThe environmental impact caused by water companies during the production and distribution of drinking water is studied using environmentally oriented life-cycle analysis (m-LCA) according to the Eco-indicator method as specified for the water industry. Factors taken into account in compiling the final index include energy use, dehydrated natural area with the area of influence of an extraction site, consumption and use of auxiliary substances, chemicals and filter materials, the production of useful waste materials, residues and emissions, impacts due to central softening and contribution to global environmental effects (greenhouse effect and acidification).
Finance and efficiency The total cost per connection is the main indicator. For cost comparisons, the subject matter is divided into four cost categories: taxes, costs of capital, depreciation and operational costs. Tariffs are also compared in five standard user situations.

47
5.1 WHAT IS URBAN WATER DEMAND MANAGEMENT?
Urban water demand management (UWDM) generally refers to the implementation of policies or measures that serve to control or influence the amount of water used in the urban system (EEA, 2000). An UWDM approach is one that has the objective of satisfying existing needs for water with a smaller amount of available freshwater resources. “Demand management” as used here should not be confused with the strict economic meaning of the term nor limited to the reduction of end water consumption. It refers to any reduction of use of fresh (or “scheme”) water, i.e. water from conventional sources such as rivers and lakes, reservoirs, wells and groundwater boreholes.
UWDM is contrasted to conventional supply-side management, which is based on the increase of water abstraction or the augmentation of existing water sources via the construction of new water works.
Elsewhere (especially in the U.S.), the term water conservation is similarly used. Water conservation is defined as “any beneficial reduction in water losses, waste or use” (Baumann and Bolland, 1998). “Conservation” emphasises that water saved is available (“conserved”) for other or future uses, including in the aquatic environment. The term “beneficial” is a reminder that UWDM may entail costs in addition to its acknowledged benefits; economic and environmental (Box 5.1). Benefits, in the widest sense, should surpass costs for an
5. URBAN WATER DEMAND MANAGEMENT This chapter presents technologies and approaches that aim to reduce the quantity of freshwater used to satisfy urban needs. Firstly, the concept of water demand management is explained. This is followed by a presentation of various demand management tools, from source to end use together with supporting educative, economic, regulatory and policy instruments. The basic contents of a demand management plan are then reviewed and data needs identified.
BOX 5.1THE COSTS AND BENEFITS OF WATER DEMAND MANAGEMENT (Dziegelewski et al, 1995)
Benefits ExamplesReduced short run incremental costs Lower costs of chemicals, energy, labour and materialsReduced long run incremental costs Lower costs of capital facilities for water supply, wastewater
disposal facilitiesEnergy savings Reduction in the use of heated waterOther economic benefits /effects Reduced costs of lawn maintenance (fuel, labour) in efficient
irrigation Environmental quality Reduced damage to natural water sourcesExternal costs Reduced pumping costs to farmers due to reduced drawdown of
groundwaterCosts ExamplesUtility programme costs Labour, materials, economic incentives, related to implementing
the conservation programmeCustomer programme costs Materials, installation, operations and maintenance costs, related
to implementing conservation programmeOther economic costs Increased energy costs for air conditioning due to reduced
shading from trees (i.e. after converting from shade trees to xeriscape landscaping)
Reduced aesthetic value Decreased customer satisfaction due to the replacement of lush green lawns with xeriscaping
Reduced revenues Without rate adjustments, reduced water use leads to reduced revenues

48 49
UWDM to be adopted. IRP is the process through which the costs and benefits of alternative supply and demand options can be compared (Chapter 5).
Figure 5.1 shows the different sectors of urban water supply, delivery and use in which water savings can be achieved.
5.2 ENHANCED SUPPLY MANAGEMENT
Optimising the use of existing water sources might be an important alternative to the development of new ones. In some cities, the uncoordinated management of the various sources and systems supplying the city, leads to water wastage. Models and decision-support systems are particularly useful in such situations, where multiple sources are utilised, especially if groundwater is involved since improved aquifer modelling can facilitate better planning during the period of abstractions (Box 5.2).
A considerable proportion of water (in some cases over 10% of total water used) may be lost in supply reservoirs, conveyance aqueducts and treatment plants. Evaporation losses in storage and transportation are a significant loss factor. Interventions to reduce such losses may include:
• lining of the reservoirs • using coatings and covers for storage reservoirs
or constructing compartmentalised reservoirs • using aquifers as storage reservoirs (aquifer
recharge) • covering, repairing or replacing conveyance
channels • changing the treatment processes • recycling treatment process water
A better and more coordinated management of supply (sources, aqueducts and treatment) can also help to reduce evaporation or other losses (e.g. by ensuring that water flow does not surpass capacity
of open channels, so that overflows and losses are avoided). The use of secondary or decentralised (local) sources of water for different needs can also reduce the use of water from the main sources (see next chapter).
5.3 CONTROL OF DISTRIBUTION LOSSES
5.3.1 Water accounting and metering
An accurate water accounting system is necessary in order to identify large volumes of water losses and leaks (Figure 5.1). Water losses are often reported as water lost from treatment plant to meters. These figures are misleading since they include both “real losses” (i.e. unaccounted for water in losses and leaks; Figure 5.2) and “apparent losses” (e.g. meter under-recordings,
thefts, etc.). A sound losses control strategy needs first and foremost, an accurate assessment and to locate real losses.
For an accounting system, meters recording water flows are needed in all major nodes of the system. These include the source intake, before and after the treatment plant (entrance to the network) and at the point of final use. Water lost in conveyance, treatment and distribution can then be identified. This should be combined with good precipitation data and hydrological models to identify how much water naturally enters the system and hence also specify evaporation or seepage losses from the reservoirs.
In many Mediterranean cities, water abstractions are not metered, or even if they are, data is of low reliability (due to inaccurate meters) or irregularly collected. Meters should be installed and properly
Figure 5.1 Savings in the water supply chain
BOX 5.2A BEST CASE EXAMPLE OF ENHANCED SOURCE USE: A DECISION-SUPPORT SYSTEM FOR WATER MANAGEMENT IN THE CITY OF ATHENS, GREECE (Kallis and Coccossis, 2003)
The city of Athens is served by two principal reservoirs (a natural and an artificial lake). Supply from the natural lake is much more expensive due to energy consumption. Water has to be elevated by pumps (vs. gravity-fed from the reservoir). On the other hand, the lake looses a significant portion (about 50%) of reserves via bottom sinkholes, seepage increasing the fuller the lake gets. In the period 1980-1989 and in order to economise on energy costs, the utility predominantly abstracted water from the artificial reservoir. Almost 800 million m3 of water was lost from the lake in this way. Without these losses the intense droughts of 1990 and 1992 could have been avoided.
The Athens urban water utility decided to improve the management of its sources in order to improve supply yield and reduce future drought risks. The main trade-off to be secured is between energy costs vs. water losses from the system (and therefore security of supply). The National Technical University prepared a simulation model based on a historical hydrological data of flows. Fed by real-time data on reservoir levels, the model allows the utility to decide how to appropriately allocate abstractions from the two reservoirs and optimally balance losses, security of demand satisfaction and cost.
Figure 5.2 Water accounting system (EPA, 1998)

50 51
maintained at all source intakes (source-water metering). In most Mediterranean cities, universal service connection metering is the norm. Still, in many cities, some public uses are provided free of charge, often un-metered (schools, religious institutions, sports centres, public buildings, parks). Even if not billed, it is important to meter this water for accounting purposes (public-use water metering).
Fixed-interval meter reading between source or network meters and service connection at periodic intervals can facilitate accurate comparisons and analysis (EPA, 1998). Automated sensors and telemetric systems can provide ongoing monitoring and an analysis of infrastructure. Remote sensors and monitoring software can alert utilities to leaks or other operational problems (EPA, 1998).
Meter under-registration is an important source of apparent losses and loss of revenue for the urban water utility. Water meters deteriorate with age and can be damaged. Meters which are oversized in comparison to the water consumed also tend to under-register. Regular programmes for meter accuracy analysis and for replacing faulty or oversized meters should be implemented (EPA, 1998).
5.3.2 Control of losses
Leaks and losses in the distribution network may be due to:• bursts (which are easier to locate as water
typically surfaces) • leakage because pipes are not properly sealed
or because their condition has deteriorated, usually occurring at the pipe joints (especially in old and extended networks)
• losses during user installations before or after the water is metered
Estimating the real level of leakage is the first step in a strategy to combat it. The oft-reported percentages are not suitable for assessing the real efficiency of operation of a distribution system. Percentages are influenced by differences and changes in consumption. A better indicator for real losses is litres/service connection/day. This doesn’t accommodate influences from the density of service connections (per km mains), location of customer meter on service connection (relative to street/property boundary) and average operating pressure, however. All these factors considerably influence leakage. The Infrastructure Leakage Index (ILI) developed by the International Water Association’s Task Force on Unaccounted-for Water is a pragmatic network performance indicator, which distinguishes leakage due to poor management from systemic (“unavoidable”) leakage (WHO, 2001, Box 5.3). An ILI value of around 4 should be considered as satisfactory,
lower values denoting good performance and higher values, poor performance.
Although in theory leakage can be reduced to the absolute minimum (i.e. unavoidable real losses, ILI=1), in most cases this is not economically feasible. Tracing and repairing leakage can be very expensive. In many cases, it might be more expensive for the utility to reduce leakage than to increase water production. The economic level of leakage is the leakage at which the marginal cost of saving one additional lt of water by improving the distribution network is equal to the marginal cost of producing an additional lt of water from the source. The economic level of leakage can be used by water utilities to set leakage reduction goals. Costs however should be sufficiently long-term and also include external social costs and not only private costs for the utility.
A leakage control strategy includes the following steps:1. An operational policy of fast response to locate
and repair bursts. 2. A programme to detect and repair known
leaks, to achieve an economic level of leakage. 3. Leakage detection and repair. Accurate
accounting (including telemetric processes) is necessary for leakage detection. Other detection techniques include:
• regular on-site testing using computer assisted leak detection equipment
• a sonic leak-detection survey • or any other acceptable method for detection
along mains, valves, services and meters (EPA, 1998)
4. A proactive programme to prevent losses including pipe replacement or cleaning, lining and other maintenance or rehabilitation activities. Joint works with other urban utilities that have underground infrastructure can reduce costs and inconvenience to the public.
Leakage detection and repair programmes might be more difficult to implement in smaller urban utilities. They are expensive and require advanced technical expertise. Smaller coastal settlements living off tourism may face extra problems. The excess summer demand vs. the low winter flows alter pressure and increase the frequency of bursts. In some cities, and depending on the local geology, distribution losses may be an important source of renewal of the local aquifer. Reducing losses may entail impacts on groundwater-dependant aquatic (eco)systems.
5.3.3 Pressure management
Pressure management in the distribution network can decrease leakage, reduce stress and bursts in networks and flow rates from taps. Reducing pressure may also diminish the requirement
for pipe repair and replacement and fixture retrofitting. System-wide pressure reduction is one option. A more aggressive approach includes the purchase and installation of pressure-reducing valves in street mains and individual buildings or flow restrictors on meters (EPA, 1998). Broader changes to the capacity or the layout of the network (e.g. new mains, network “rings”) can lead to a more even distribution of pressure and reduce stress in existing pipes. Such changes may also decrease the need for pumping in the network and hence reduce energy consumption.
5.4 END-USE WATER SAVING
There are several technologies and techniques available on the market that can help reduce water use in the home, the garden and in public landscaping (Table 5.1). The potential of water saving from new appliances or from modifications to existing ones will vary according to the city, the type of water users and water use, and the nature of the replacement programme. Table 5.2 compares conventional domestic appliances with water-efficient ones. In Mediterranean Europe there is a gradual move toward second tier appliances/fixtures, but there are concerns about the introduction of power showers (using over 20 litres per minute) and other “luxurious” appliances, particularly in suburban and tourist areas.
There are several options available to urban water utilities to promote the uptake of efficient water devices. Plumping retrofitting programmes have been extensively implemented in the U.S. and Western Europe. They have seen fewer committed applications in the Mediterranean. Retrofitting refers to an improvement to an existing fixture or appliance; it is different to replacement. A typical retrofit kit includes low-flow tap aerators, low-flow showerheads, leak detection tablets and replacement flapper valves. A water utility can make the retrofit kit available to customers at a cost or free of charge (EPA, 1998). Kits can be distributed by various methods including:• community organisations or schools • by post • depot/booths in various locations • door-to-door delivery• direct installation by trained installers – another
option (Dziegelewski et al, 1995)
More advanced retrofit programmes may target:• other appliances such as domestic fixtures or
gardening equipment • selected user groups (residential, commercial,
industrial, public buildings, etc.)
Older and low-income houses have a higher potential for water saving. Appliances there are typically outdated and faulty. Low-income housing retrofit programmes could be more effective if
BOX 5.3AN EXAMPLE OF A CALCULATION USING THE INFRASTRUCTURE LEAKAGE INDEX (Lambert et al, 2000)
A distribution system has 1,500 km mains and 60,000 service connections with customer meters located 6 metres from the edge of the street, on average. The system is pressurised for 90% of the time, and the average pressure (when pressurised) is 30 metres. The current Annual Real Losses in the above system, calculated from Annual Water Balance, are 4,000 · 103 m3/yr.
Technical Indicator for Real Losses (TIRL):
= 4,000·103·103 / (60,000·0.9·365) = 202 litres/service connection/day w.s.p
Unavoidable Annual Real Losses (UARL) Components:
103 m3/yr
Mains: = 18 l/km/d/m·1500 km·(0.9·365) days·30 m/106= 266 Connections to edge of street: = 0.8 l/conn/d/m·60,000·(0.9·365) days·30 m/106 = 473Edge of street to customer meter: = 25 l/km/d/m·(60,000·6/1000)·(0.9·365) days·30 m/106 = 87 Total Unavoidable Annual Real Losses (UARL):
= 826·103·103 / (60,000·0.9·365) = 42 litres/service connection /day w.s.p
Infrastructure Leakage Index (ILI) = TIRL / UARL = 202/42 = 4.8

52 53
designed and implemented with local authorities or community organisations.
Replacement and rebate programmes, whereby utilities install water-efficient fixtures for users, are a more demanding option than retrofitting programmes. There are three basic programme options: • providing them at no cost • offering rebates for consumer-purchased
fixtures • arranging for suppliers to provide fixtures at a
reduced price
Utilities can also design incentive rebate programmes that are targeted to the non-residential and residential sectors or to indoor or outdoor uses (EPA, 1998). The replacement of old toilets with ultra-low flush ones is a particular target. Community programmes run in the U.S. are a good example that can be applied in the Mediterranean, especially in deprived neighbourhoods in southern Mediterranean cities (Box 5.4). In some Mediterranean cities however, such initiatives may be limited by the lack of a strong civil society or of experienced organisations able to carry out such programmes; capacity-building might be necessary first.
Consumers are also free to choose any of the efficient appliances on their own for their new homes or for replacing existing devices. Promotion programmes run by water utilities or state
agencies can diffuse awareness on the efficient appliances and their performance, cost savings and environmental benefits. Basic options include: • promotional leaflets with lists of manufacturers
and appliance distributors (potentially inserted in bills)
• demonstration or pilot programmes attracting media attention
Ecological labelling schemes (e.g. the “eco-labelling” scheme in the EU) are essential for the promotion of water-efficient fixtures. In some countries, regulations setting certain water efficiency standards for new appliances may be enforced, though this may be difficult under free trade rules.Outdoor water use accounts for a significant portion of water use, especially in tourist destinations and over the summer months. In Table 5.1 several options for increasing landscape efficiency were provided through better landscape planning or improved irrigation management. Xeriscaping is an approach that combines soil improvement and selecting/maintaining the appropriate mix of plants/turf grasses, carrying out efficient irrigation and proper maintenance. Xeriscape systems can reduce outdoor water demand by as much as 50%. Promotional programmes (information, advertisements, education) can also be used to make users aware of opportunities to save water in outdoor use.
Water utilities can be more actively involved in the promotion of such practices in households and in new public projects such as parks, building and sports grounds, etc. Utilities can also work with public authorities and/or commercial, industrial or other large-use customers to redesign existing landscapes to reduce water needs. Irrigation management systems (metering, timing, and weather/water-sensing devices) can also be
promoted to households and smaller users. Greywater recycling and reuse, rain harvesting and use of stormwater for landscaping purposes are also important options that reduce freshwater use (see next chapter).
Commerce and institutions (hospitals, hotels, office buildings, schools, and restaurants) are important water users. In coastal urban Mediterranean summer resorts, the tourism industry accounts for a large portion of water use. Programmes for such users should be tailored to the characteristics of their use. They should include a combination of retrofitting and rebate programmes, information and education activities and incentive mechanisms. Decentralised systems of greywater use or rainwater retention are easier to implement among such medium-to-large water users, which have more outdoor space.
There is also potential for water saving in industrial applications. Some of the basic options include process modification to reduce water use, multiple uses of water and the internal reuse of effluents (especially when used for cooling purposes – also see Table 5.1). The amount of water saved depends on the industrial sector. A study carried out by the Institute of Energy for the industrial sector in Catalonia, Spain showed that potential savings range from 25% to more than 50% (EEA, 2000). Water utilities can take an active stance and: • advise their industrial customers on potential
water savings • carry out onsite inspections and identify saving
opportunities • inform and train the industry’s personnel
department • provide specific incentive programmes (e.g.
awards and publicity for water-efficient industries, favourable pricing)
GeneralPublic information, metering, pricing policies, via school education, pressure reduction, leak detection and repair, system rehabilitationInterior domestic useToilets/Urinals: early closure flapper valve, toilet leak detection and repair, ultra-low-flush toilets/ urinals, toilet displacement bags, dual flush devices, fill-cycle regulator, composting toilets, waterless urinals, automatic activation, valve retrofitShowers: low-flow showerheads, shower-flow restrictors, shut-off valves, shower aeratorsBathroom and kitchen taps: low-flow taps, tap aerators, tap washer, automatic activationDishwashers/Washing machines: water-efficient appliances, water-efficient horizontal/ vertical axisAir conditioning: air-cooled systems, water-efficient evaporative coolersWater treatment devices: water-efficient reverse osmosis filters, water-efficient water softenersLandscape irrigation managementEfficient landscape design, water-efficient plant material, reduction or limitation of high water use plant materials, soil/plant modification, turf reduction/replacement, turf watering literature, efficient irrigation systems, efficient sprinklers, drip irrigator, scheduled irrigation, peak management scheduling, rain/soil moisture sensors, garden hose timer, bubbler/soaker irrigator, greywater systems, xeriscape incentives, tensiometers, cisterns Other outdoor useHose control nozzles, water recycling/recirculating systems, swimming pool/spa covers, water-efficient management systemsCommercial/industrial useRecirculation of cooling water, reuse of treated wastewater, reduce “blowdown” on evaporative coolers, boilers, cooling towers, reuse of cooling and process water, process modification, equipment metering for leak detection
Table 5.1 Some water saving technologies (Opitz and Dziegelewski, 1998, IPTS, 1999)
Fixture Water Use % Reduction Conventional
Toilets Litres/Use1. Conventional 92. Low Flow 6 33%3. Washdown 4 56%4. Air Assisted 2 78%Showerheads Litres/min1. Conventional 142. Low Flow 10 29%3. Flow Limiting 7 50%4. Air Assisted 2 86%Taps Litres/min1. Conventional 122. Low Flow 10 17%3. Flow Limiting 4 67%Washing machines Litres/use1. Conventional 802. Efficient 60 25%3. Economy 40 50%
Table 5.2 Potential water savings (data for Europe, IPTS, 1999)
BOX 5.4LOS ANGELES: A BEST CASE EXAMPLE OF A COMMUNITY UWDM PROGRAMME (IPTS, 1999)
The Los Angeles Department of Water and Power instigated a major toilet replacement programme in the early 1990s. Ultra Low Flush toilets were made available free of charge. City officials also judged that the management of the toilet replacement programme was a function best carried out by grass roots community groups and offered a bounty of $25 for every old toilet replaced. In one of the poorest parts of East Los Angeles (Boyle Heights), a Community action group – the Mothers of East Los Angeles Water
Conservation Programme – was established to run the programme in the area. Since 1992, some 50,000 Ultra Low Flush toilets have been installed and the old ones recovered, and then recycled as underlay for the streets of Los Angeles. The monies received pay for 25 full-time and three part-time staff – with the remaining cash being used to fund a variety of community programmes. Indeed, the programme has been such a success that the group has expanded its operations into neighbouring regions.

54 55
Urban water utilities can run water-use audits among large-scale commercial and industrial users or large landscaping grounds (private or public). Having identified and accounted for the different applications of water in these uses, practical ways can be suggested to reduce use. Audits can also be performed in selected households. A household audit programme should classify households on the basis of customer type and use/appliance characteristics. The heaviest consuming households and the ones with the greatest potential for saving (e.g. old inner city houses) should be targeted first (EPA, 1998). Licensed plumbers can be subcontracted by the utilities for these residential inspections or for the identification of leaks. Residential water audits can be run jointly with the environmental efficiency audit programmes of other utilities (e.g. electricity bodies).
Box 5.5 shows the general elements of an end-use water saving programme that can include one or more of the aforementioned tools.
5.5 INFORMATION, EDUCATION AND SOCIAL PARTICIPATION
An understandable and informative water bill can raise awareness on water cost, price changes and opportunities to reduce water use. A water bill should go beyond providing minimally required information (volume of use, rates and charges) to include information that can help consumers make informed choices such as (EPA, 1998): • a comparison with previous bills • observations on water use patterns • tips on water saving
Additional information, advice notes and reminders can be provided by water bill inserts (including information about the manufacturers and distributors mentioned above).
Outreach methods for information and public education programmes may include:• information centres • manned kiosks at public events (festivals) or in
city centre pedestrian areas • printed and video material • collaboration with environmental and
community organisations
The water utility should also be ready to supply relevant information to interested customers (e.g. about repairing in-house leaks, or to retailers of water saving appliances) at all times. A dedicated service or telephone number could boost this endeavour.
School programmes acquaint young people with the value of water. They also provide outreach to their parents. School programmes are more successful if they extend beyond one-shot, presentation events into longer-term demonstration projects of water conservation in the school.
Specialised training programmes for professional bodies can also contribute to UWDM efforts. Relevant professions include, among others:• workers and engineers in specific industries• plumbers • plumbing fixture suppliers and retailers • builders and managers in the construction
industry • public servants responsible for parks, open
spaces and urban landscaping • landscape and irrigation service providers
Information provided should be tailored to the specificities and ways of thinking of the profession. Training events should provide a platform for further cooperation between the utility and the participants.
Social participation in water conservation efforts is essential if a programme is to succeed. Behavioural changes may require more extensive changes to lifestyles not easily accepted and implemented in Mediterranean cities, given the prevailing socio-cultural context. Several factors determine the willingness of users to reduce water use and to contribute to a UWDM programme (Box 5.6).
Public education and information programmes can contribute to the above. An issue, however, is the extent to which UWDM messages should be linked to drought and shortage prospects. This gives the public the impression that UWDM is an emergency response and that it will end once a drought is over. Indeed, many utilities tend to focus awareness efforts for the duration of the short crisis periods when droughts threaten reserves, abandoning their investment in education once the critical period is over. A persistent message emphasising the environmental (alongside other) benefits of water conservation is needed, if deep-rooted public perceptions are to change in the long-term. Resource-depleting lifestyle aspirations should be addressed (e.g. ideals of water-intensive suburban housing) as part of broader environment and sustainable consumption education programmes.
Social participation can be strengthened by involving the community in the design and implementation of a UWDM programme. Public/stakeholder workshops, stakeholder advisory committees (see also Chapter 8 for other participatory forums) can help in creating a sense of “community ownership” and shared responsibility for UWDM.
5.6 REGULATION
Water-use regulation can be used to promote UWDM goals. This includes (EPA, 1998; see also Chapter 3):• restrictions on commercial car washes,
nurseries, hotels and restaurants• bans (or restrictions) on non-essential uses such
as lawn watering, car washing, street cleaning or golf course irrigation, once-trough cooling in industrial applications, non-circulating swimming pools, laundries and decorative fountains
• standards for water-consuming fixtures and appliances
• requirements for new urban developments with regard to landscaping, drainage, irrigation or plumbing practices
An economic regulatory framework for urban water services (Chapter 3) is important for creating the proper incentive structure to the urban water utility to undertake UWDM programmes. UWDM entails increased expenditures (investment in losses control, end-use water saving programmes, etc.) and reduced revenue (due to reduced water consumption) for the utility. Unless counterbalanced by increased water prices, UWDM may generate revenue losses for the utility, at least in the short-term. Price increases to compensate for losses from reduced water consumption, however, are politically awkward. In most cities, UWDM is not a very convincing reason to obtain approval for increased rates. Even if approvals were given, penalising customers with higher prices for their water conservation efforts could trigger negative reactions.
A properly designed UWDM programme should in the long run have more benefits than costs. Reduced operational costs and deferred capital expenditures should overcome reductions in revenue. In practice, however, many utilities don’t
BOX 5.5ELEMENTS OF AN END-USE WATER SAVING PROGRAMME (Dziegelewski et al, 1995)
1. Programme contents Measures and types of activities that will be
implemented.2. Definition of the target population and
programme participants Sector, type of water user, or number of urban
population / customers targeted.3. Programme incentives Rebates, tax credits, subsidies.
4. Contact modes Telephone solicitation and scheduling, call-in
requests and scheduling, sign-up booths in squares, shopping centres or public events, direct written contact, mass media contacts.
5. Programme scheduling and implementation Start date, duration and phase scheduling.
Alternatively, expected implementation rate (e.g. 2,000 single-family homes retrofitted within the next 5 years).
BOX 5.6FACTORS AFFECTING SOCIAL PARTICIPATION IN UWDM (Dziegelewski et al, 1995)
1. The perceived need for water conservation and the concern for potential impacts on the community (typically related to droughts and shortage prospects).
2. The credibility of the information source. 3. Knowledge among users on how much water
they could save by taking certain actions and about the importance of their personal efforts in lessening the problem.
4. A perception of the measures as equitable (i.e. all members of the community are required to make genuine efforts).
5. Strengthening of group identity and information on the undesirable social effects of personally irresponsible behaviour.
6. Limited inconvenience and minimum personal cost.

56 57
often face the full operational and capital costs of increasing water demand. The state subsidises large hydraulic works (e.g. dams and river transfers) in many Mediterranean countries. Water abstraction charges are rare. Urban water supply receives absolute priority over all other water uses. Given the political clout of public waterworks for urban centres, cities tend to get the water they need when they need it. Hydraulic works secure supply and allow water utilities to expand their customer base (e.g. by extending networks to new suburban areas or to “satellite” cities). Environmental benefits (and deferred impacts), on the other hand, an important benefit of UWDM measures, do not accrue to the utility.
State intervention and regulation are necessary to ensure that water utilities face the real costs and benefits of their actions. Some possible measures include (see also Chapter 3):• a ban on subsidies for new hydraulic works and
for network expansion • water use licences with maximum quotas and
incremental/volumetric charges for abstractions (including recovery of environmental costs)
• regulatory mandates for specific water efficiency targets (e.g. achieving an economic degree of leakage)
• linking the authorisation for new supply augmentation works with a proven implementation of comprehensive UWDM programmes1
• regulatory mandate to develop and report on UWDM plans
Financial incentives are also important. Most utilities cannot borrow money to support UWDM programmes and they use current revenues or available surpluses or profits (in private utilities) (Dziegelewski et al, 1995). For supply works on the other hand, there are many funding options, both private and public. Opportunities must be created for all water utilities to borrow funds and capitalise their UWDM programmes or to develop up-front impact fees. In California, for example, a joint powers authority was created to sell revenue bonds on behalf of its member agencies for energy and water demand management programmes (Dzieglewski et al, 1995). In the Mediterranean, a shift of regional development funding away from large hydraulic works and towards the financing of UWDM programmes is necessary. The standardisation of the components of a comprehensive UWDM programme by an international agency (e.g. UNEP-MAP) can
1 The EPA guidelines that have been used as a reference in this chapter are provided to water utilities in the U.S. in order to help them set up their Water Conservation Plans. An active Water Conservation Plan is a prerequisite for water utilities that apply for federal financial support.
provide a blueprint for funding applications. This might also involve concerted action with active regional donors, such as the European Investment Bank and the World Bank.
5.7 PRICING
Economic incentives are essential if users are to reduce their water use. The theory and design of water prices are examined in Chapter 7. Only some basic options for UWDM are presented here.
In some cities, water users may not be metered and charged flat rates. This is generally a very rare occurrence in the Mediterranean (although it might still be the case in some small urban settlements). In some cities, moreover, one may find buildings with one common meter rather than individual apartment meters. The Metering of water use per customer is a prerequisite for the use of pricing instruments to control water use.
Fines can be an important deterrent against wastage or excessive water use, especially during critical periods (droughts). Fines can be imposed on water uses that surpass certain maximums (depending on class of use) or for uses that significantly surpass the consumption levels of previous years. Possible changes in customer characteristics (e.g. an increase in the number of dwellers) need to be taken into account.
General price increases do not suffice for UWDM. Tariffs have to be carefully designed so as to provide incentives to users to conserve water (incentive-based tariffs). Different users exhibit different patterns of water use. The design of the rate structure (usage blocks and break points, fixed and variable charges; minimum bills) should be preceded by a detailed study of water use patterns (and elasticity factors) for different classes of water users.
Advanced and differentiated pricing methods are necessary. Advanced methods differentiate water charges by type of use and user (e.g. indoor vs. outdoor; special tariffs for households with luxury appliances such as swimming pools; low-income vs. high-income users; tourists vs. locals, hotels vs. households) and by season (e.g. different tariffs for the summer season, dry years, etc.).
“Smart” metering technologies (IT, communication based systems with enhanced functionalities) can in future enable utilities to collect detailed water use profiles, develop tailored tariff packages, and send individual (conservation) messages to customers. Interaction may also be facilitated, customers controlling their water use accordingly, and conveying messages back to the utility in real time.
5.8 URBAN PLANNING
Urban forms and demographic and economic development are major determinants of water demand. Population growth and economic and land-use policies should be in tune with the goal of controlling water demand. In particular, policies for urban sprawl (suburbanisation) will be needed in areas facing water scarcity. Volume I introduced the concept of Water-sensitive Urban Design and provided some relevant guidance for the integration of land-use with urban water system planning and management.
5.9 A WATER DEMAND MANAGEMENT PLAN
Implementation of each of the aforementioned measures alone will only have a limited impact. It is advisable to combine a mixture of the various technologies with information and awareness campaigns and regulatory and economic incentives in a comprehensive UWDM Plan (Box 5.7). A UWDM programme can stand alone or be part of a broader Integrated Resource Plan or a Master Plan for the coastal urban water system (Chapter 5, Volume I).
Water demand analysis and forecasting should build on sound data and information on past water use (Figure 5.3).
There are various approaches in demand forecasting (Bolland, 1998): • a simple extrapolation of trends • a timed series of extrapolations • bivariate models (population and per capita
consumption typically being the two main variables)
• multivariate models (with several variables that affect water use)
• econometric demand models (models correlating water use with variables relating to price and income)
State-of-the-art techniques in demand forecasting should be utilised. Simple extrapolations or bivariate models, used in the past by utilities, no longer suffice. The IWR-MAIN System is an advanced computer software programme for demand forecasting and UWDM planning (Opitz et al, 1998). Several determinants of water demand are taken into account including household income, household size, housing density, weather conditions, and the price of water services (for the residential sector) and employment by industry type, labour productivity, weather and water price (for the commercial sector). The software then estimates the savings from alternative UWDM options and incorporates them into the forecasts. A CBA can also be conducted for these alternatives. Alternative scenarios on the evolution of variables are produced to test the sensitivity of forecasts to different assumptions. Forecasts can also be
Figure 5.3 Information flow for a demand forecast

58 59
prepared for different seasons or for different sectors.
The Plan should conclude with the proposal of a list of measures to implement the UWDM programme. Table 5.3 summarises the available options as presented in this chapter (after the guidelines of the U.S. EPA, 1998). Basic measures are simple and can be taken up as a minimum by all utilities in the Mediterranean, including small settlements and water utilities with a limited financial and human capacity in the Southern Basin. Intermediate measures should be considered by medium-sized cities (with a population of circa 10,000-100,000), depending on their administrative and technological capacities. Advanced measures should be considered and implemented in large cities (with populations exceeding 100,000) with very strong technological
capacities; as such, they primarily concern cities in the EU-Med. Other large coastal settlements served by utilities with good administrative and technical capacities in the Eastern and Southern Basins should also consider (at least some) of the options.
Water utilities themselves are in many cases the greater obstacle to the implementation of UWDM plans and measures. Key reasons for this are the deep-rooted perceptions and professional bias of their staff. Water engineers have been accustomed to working with water supply management. They feel less comfortable with “softer” UWDM measures. They are also not accustomed to querying public demand, tending to take it as a given. A UWDM programme requires a shift, not only of practice but also of mentality and a desire to move and work beyond traditional disciplinary boundaries. Training and
BOX 5.7CONTENTS OF A COMPREHENSIVE WATER DEMAND MANAGEMENT PLAN (EPA, 1998)
1. Specify water saving planning goals • List of water saving planning goals and their
relationship to supply-side planning • Description of community involvement in
the goals-development process2. Develop a water system profile • Inventory of existing facilities, production
characteristics and water use • Overview of conditions that might affect
the water system and demand management planning
3. Prepare a demand forecast • Forecast of anticipated water demand for
future time periods • Adjustments to demand based on known
and measurable factors • Discussion of uncertainties and “what if”
(sensitivity) analysis4. Identify water demand management measures • Review of water demand management
measures that have been implemented or that are planned for implementation
• Discussion of legal or other barriers to implementing recommended measures
• Identification of measures for further analysis5. Analyze benefits and costs • Estimate of total implementation costs and
anticipated water savings • Cost effectiveness assessment for
recommended water demand management measures
• Comparison of implementation costs to avoided supply-side costs
6. Select measures • Selection criteria for choosing water demand
management measures • Identification of selected measures • Explanation of why recommended measures
will not be implemented • Strategy and timetable for implementing
water demand management measures7. Integrate resources and modify forecasts • Modification of water demand and supply
capacity forecasts to reflect anticipated effects of water saving
• Discussion of the effects of saving on planned water purchases, improvement and additions
• Discussion of the effects of planned water demand management measures on water utility revenues
8. Present implementation and evaluation strategy • Approaches for implementing and evaluating
the water demand management plan • Certification of the water demand
management plan by the system’s governing body
MEASURES‹ ADVANCED MEASURES‹ INTERMEDIATE MEASURES ‹ BASIC MEASURES
Universal metering
• Source–water metering• Service-connection
metering and reading • Meter public water use
• Fixed-interval meter reading
• Meter-accuracy analysis
• Test, calibrate, repair and replace meters
Water accounting and loss control
• Account for lost water • Repair known leaks
• Analyse unaccounted for water
• Water system audit • Leak detection and repair
strategy • Automated sensors/
telemetry
• Loss–prevention and proactive rehabilitation/ replacement programme
Costing and Pricing
• Cost-of-service accounting• User charges• Metered rates
• Cost analysis • Incentive based tariffs
• Advanced pricing methods• ‘Smart’ meters
Information and education
• Comprehensible water bill • Information made
available to customers about water saving
• Informative water bill • Water bill inserts • School programme • Public-education
programme
• Public/stakeholder Workshops on water saving
• Advisory committee on water saving
Water-use audits • Audits of large-volume users
• Large-landscape audits
• Selective end-use audits
Retrofits • Retrofit kits available to users
• Distribution of retrofit kits • Targeted programmes to
selected user groups Pressure management
• System-wide pressure management
• Selective use of pressure-reducing valves
Landscape efficiency
• Promotion of landscape efficiency
• Selective irrigation sub-metering
• Landscape planning and renovation
• Irrigation management
Replacements and promotions
• Rebates and incentives (non-residential businesses)
• Rebates and incentives (residential)
• Promotion of new technologies
Reuse and recycling
• Industrial applications• Large-volume irrigation
applications• Selective residential
applications Water- use regulation
• Water-use standards and regulations
• Requirements for new developments
Enhanced supply management
• Modelling – better timing/allocation of abstractions
• Reduction of losses in reservoirs, aqueducts, etc.
Table 5.3 Water Demand Management Measures (adapted from EPA, 1998)

60 61
the capacity development of existing personnel is important. Furthermore, the composition of new personnel should be more inter-disciplinary. The establishment of a UWDM unit or task force within the utility can be beneficial.
5.10 DATA AND EVALUATION REQUIREMENTS
Utilities need to compare the costs and benefits of a UWDM programme with alternative water supply measures. Reliable estimates of UWDM savings are needed for this. The a-priori engineering estimates of water saving technologies such as those provided in Table 5.2 are not reliable. Specific use patterns might influence effectiveness (e.g. double and triple flushing may cancel savings from low flush toilets, Baumann and Bolland, 1998). Estimates based on casual empirical observations often disregard other important variables that may have also affected demand. Water savings estimates stated in terms of percentage changes in aggregate water neglect the fact that the conservation measure cannot be expected to apply with equal effectiveness to all classes of water users (Baumann and Bolland, 1998).
Uncertainty can be reduced by building a sufficient information base and evaluating the results of previous UWDM programmes. Accurate evaluation requires that the impacts of the UWDM measures are distinguished from other demand-influencing variables (weather, level of water use activities, price, income, housing mix and so on). The reader should refer to Opitz and Dziegelewski (1998) for several relevant evaluation methodologies and for ways of improving the reliability of estimates. This is an ongoing effort and the support of relevant research and the development of methods are needed. The latter should be tailored to context and user needs. Most available evaluations, for example, come from the U.S., where water use patterns (and water saving potential) are very different from Mediterranean urban coastal areas, for example.
A Water Use Monitoring Programme is necessary for the design of UWDM measures and as a baseline for the ex-post evaluation of UWDM programmes. The monthly water use of different user groups should be tracked and the major factors affecting water use patterns continuously assessed.
The monitoring programme facilitates the development of tailored UWDM programme for specific uses. Special studies and periodic surveys evaluating specific groups/programmes can complement a broader monitoring programme.
The results of evaluations and monitoring programmes must be available in shared
databases, to offer access to the necessary information for those who want to implement a new UWDM programme. In England and Wales, for example, a National Water Demand Management Centre has been established as an information clearing house. In the Mediterranean, the Blue Plan could undertake such a role. This is crucial as most of the available information on UWDM comes from very different contexts (e.g. U.S., U.K.) to those of Mediterranean cities.
6.1 WHAT ARE URBAN WATER CYCLE TECHNOLOGIES?
Urban water cycle technologies:• “close loops” in the urban water cycle, and/or• benefit from natural water cycle processes and
ecosystem services and/or• contribute to multiple functions of the water
systems (water supply, wastewater treatment and stormwater management / flood protection) and the urban ecosystem (landscaping, environmental and ecosystem protection, etc.)
Innovations in conventional technologies (e.g. improvements in treatment and monitoring techniques) are important, but are not examined in detail in this chapter (see the brief summary in Box 6.1). The emphasis of these guidelines is on new, integrated and multifunctional approaches. Several types of innovative technologies are presented below. The classification is partially ad hoc. Some technologies may belong to more than one category since multi-functionality is a key feature of the technologies examined.
An integrated urban water cycle approach requires the combined implementation of several of the technologies together with planning, regulatory and economic supports. The utilisation of water cycle technologies should be an integral consideration of the master urban water system planning process (Chapter 5, Volume I) and integrated with physical planning through water-sensitive urban design.
6.2 CENTRALISED WASTEWATER RECYCLING
Centralised wastewater treatment can now benefit from several technological innovations (Box 6.1). Advanced wastewater treatment consists of a combination of physical, chemical and biological processes and operations to remove suspended and dissolved solids, organic matter, metals, nutrients and pathogens (Box 6.2). At present, reclaimed wastewater is primarily used in the irrigation of agricultural lands, parks and golf courses (Box 6.3). There are a growing number of applications, however, in toilet flushing, cooling, fire-fighting and stream flow augmentation. Improvements in the
level and safety of treatment can in future enable the blending of reclaimed water with primary sources or distribution through separate network systems (Asano, 1999). Reclaimed wastewater can also be used to recharge the groundwater aquifer.
6.3 NATURAL WASTEWATER TREATMENT
Natural or artificial ecosystems can be used for the advanced treatment of wastewater, its safe discharge or even its reclamation. Wetlands in particular (a feature of some Mediterranean coastal areas) can be utilised or artificially constructed to provide wastewater treatment services. Other benefits from such techniques include contribution to landscaping and aesthetic pleasure and environmental conservation / the provision of habitats for species (including for commercial operations such as fisheries).
A constructed wetland consists of a pool lined with waterproof material, filled with a medium and planted with aquatic plants to resemble a natural wetland (Figure 6.1). Plants used include vegetation such as reeds and cattail or duckweed in warmer areas. Native plants that are resistant to the local climatic conditions should be used (Burkhard et al, 2000). Free water surface wetlands have water surfaces which are in contact with the atmosphere. In subsurface flow wetlands, the surface of the water is beneath the top layer of gravel of the constructed pool. Both types are highly efficient in terms of COD, BOD5 and total suspended solids removal, as well as at the removal of metals and persistent organic polluters. Longer detention times increase nitrogen and phosphorus removal rates. Subsurface flow wetlands are better suited to applications in urban areas as they are smaller in size, physical contact is inhibited and mosquito and insect problems avoided.
A typical constructed wetland can treat up to about 300,000 litres/day. They provide advanced treatment and treated effluents can be conveyed onwards to natural wetlands and ecosystems, discharged safely to the sea or reused. It requires larger land areas than a conventional wastewater
6. URBAN WATER CYCLE TECHNOLOGIESThis chapter presents some state-of-the-art, multifunctional technologies for water supply, wastewater and stormwater management. Firstly, urban water cycle technologies are defined and distinguished from conventional urban water technologies. Different types of technologies are then presented and their advantages, disadvantages and applicability discussed. The chapter concludes with a presentation of policies necessary to support the adoption of such innovative technologies.

62 63
plant, however, limiting its application to high-density urban areas or high value coastal areas. The technology is more suited to new coastal urban developments. Operational and other capital costs, however, are much smaller than those for conventional treatment (about 1/4 per unit volume treated) (EPA, 2000). An added advantage is that the wetlands can serve as habitats and provide landscaping and aesthetic pleasure.
“Living machines” mimic the processes that occur in natural ecosystems in a controlled way through a series of large tanks, to produce effluent equivalent to that of tertiary treatment. Preliminary treatment in a septic tank is followed by aerobic treatment in closed and then open reactors where macrophytes grow into the wastewater and together with other micro organisms, reduce pollutant load. Water then enters the clarifying
BOX 6.1NEW TECHNOLOGIES FOR CONVENTIONAL WASTEWATER TREATMENT (STOA, 2000)
Preliminary treatment • Hydrodynamic separators – remove up to
95% of grit
Primary treatment • Lamella separators – to encourage
settlement and downward movement of the deposited sludge
• Chemically-Assisted Sedimentation (CAS) – the use of coagulants and flocculants to aid the sedimentation process
Secondary treatment • Activated Sludge • Hybrid Aeration systems – combine
fine-bubble diffused air and mechanical surface aeration systems to optimise aeration efficiency
• The addition of Pure Oxygen – introduced into the mixed liquor, potentially increasing the oxygen levels in the mixed liquor by a factor of 5
• Deep Shaft – a 50m + deep well divided to allow the mixed liquor to be circulated
• Membrane bioreactors – modified, activated sludge system with physical separation processes instead of sedimentation
• Biological Filtration – using micro organisms to biochemically oxidise the impurities present in settled wastewater
• Submerged Biological Aerated Filters – hybrid activated sludge/biological filter process utilising sand media to produce fully treated, high quality effluents
Tertiary treatment • Reedbed Systems – wetlands constructed
for the tertiary treatment of effluent • Disinfection • Ultraviolet Irradiation – utilises the
bactericidal effect of UV light for the effective disinfection of secondary effluents
• Chemically-Assisted Sedimentation (CAS) – apart from sedimentation, if applied in tertiary treatment, significantly improves the removal of micro organisms and up to 99% of indigenous viruses
• Microfiltration – using membranes with pore sizes of approximately 0.2 µm, impressively removes indicator bacteria, salmonella, staphylococcus aureus and pseudomonas aeriginosa
Advanced treatment • Nitrogen removal • Activated Sludge – Denitrification
(anoxic) zone for the reduction of 50% in the total N
• Deep bed filters – denitrification carried out using fixed-film techniques
• Phosphorus removal • Activated Sludge – aerobic, anoxic
and anaerobic zones or reactors where phosphorus is removed by the luxury uptake of polyP bacteria in aerobic conditions and again released under anaerobic conditions
• Chemical addition – nutrient removal via the addition of chemical precipitants such as iron salts
BOX 6.2OPERATIONS AND PROCESSES USED IN WASTEWATER RECLAMATION (Asano, 1999)
Process Description ApplicationSolid/liquid separationCoagulation Addition of chemicals to destabilize
colloids and suspended matterPromote particle destabilisation to improve flocculation and solids removal
Flocculation Particle aggregation Particle agglomeration upstream of liquid/solid separation operations
Filtration Particle removal by granular medium The removal of particles larger than about 3 µm
Sedimentation Gravity settling of particulate matter, chemical floc, and precipitates
The separation of liquids/solids
Biological treatmentAerobic biological treatment
The biological metabolism of wastewater and solids by micro organisms in an aeration basin
The incorporation and removal of organic matter from wastewater by synthesis into microbial cells and CO2 and H2O
Oxidation pond Ponds with 2 to 3 feet of water depth for mixing and sunlight penetration and oxidation and synthesis by algae
The reduction of suspended solids, BOD, faecal bacteria and ammonia
Disinfection The inactivation or removal of pathogenic organisms using oxidising chemicals, ultraviolet light, caustic chemicals, heat, or physical separation processes
The protection of public health
Advanced treatmentActivated carbon Process by which contaminants are
physically adsorbed onto the carbon surface
The removal of hydrophobic organic compounds
Air stripping Wastewater is distributed over a packing through which forced air is drawn to extract ammonia and volatile organics from the water droplets
The removal of ammonia nitrogen and some volatile organics
Ion exchange The exchange of ions between an exchange resin and water using a flow through reactor
The softening and removal of selected ionic contaminants; Effective for the removal of cations such as calcium, magnesium, iron and anions such as nitrate
Lime treatment The use of lime to precipitate in various high pH cations and metals from water and wastewater
Used to stabilise lime-treated water; to reduce its scale-forming potential
Membrane processes and reverse osmosis
Pressure-driven membrane processes to separate impurities, colloids, ions from water, based on size exclusion or molecular diffusion
The removal of impurities, bacteria and viruses and dissolved salts from water and wastewater
Figure 6.1 A schematic depiction of a constructed wetland (UNEP-IETC, 2002)
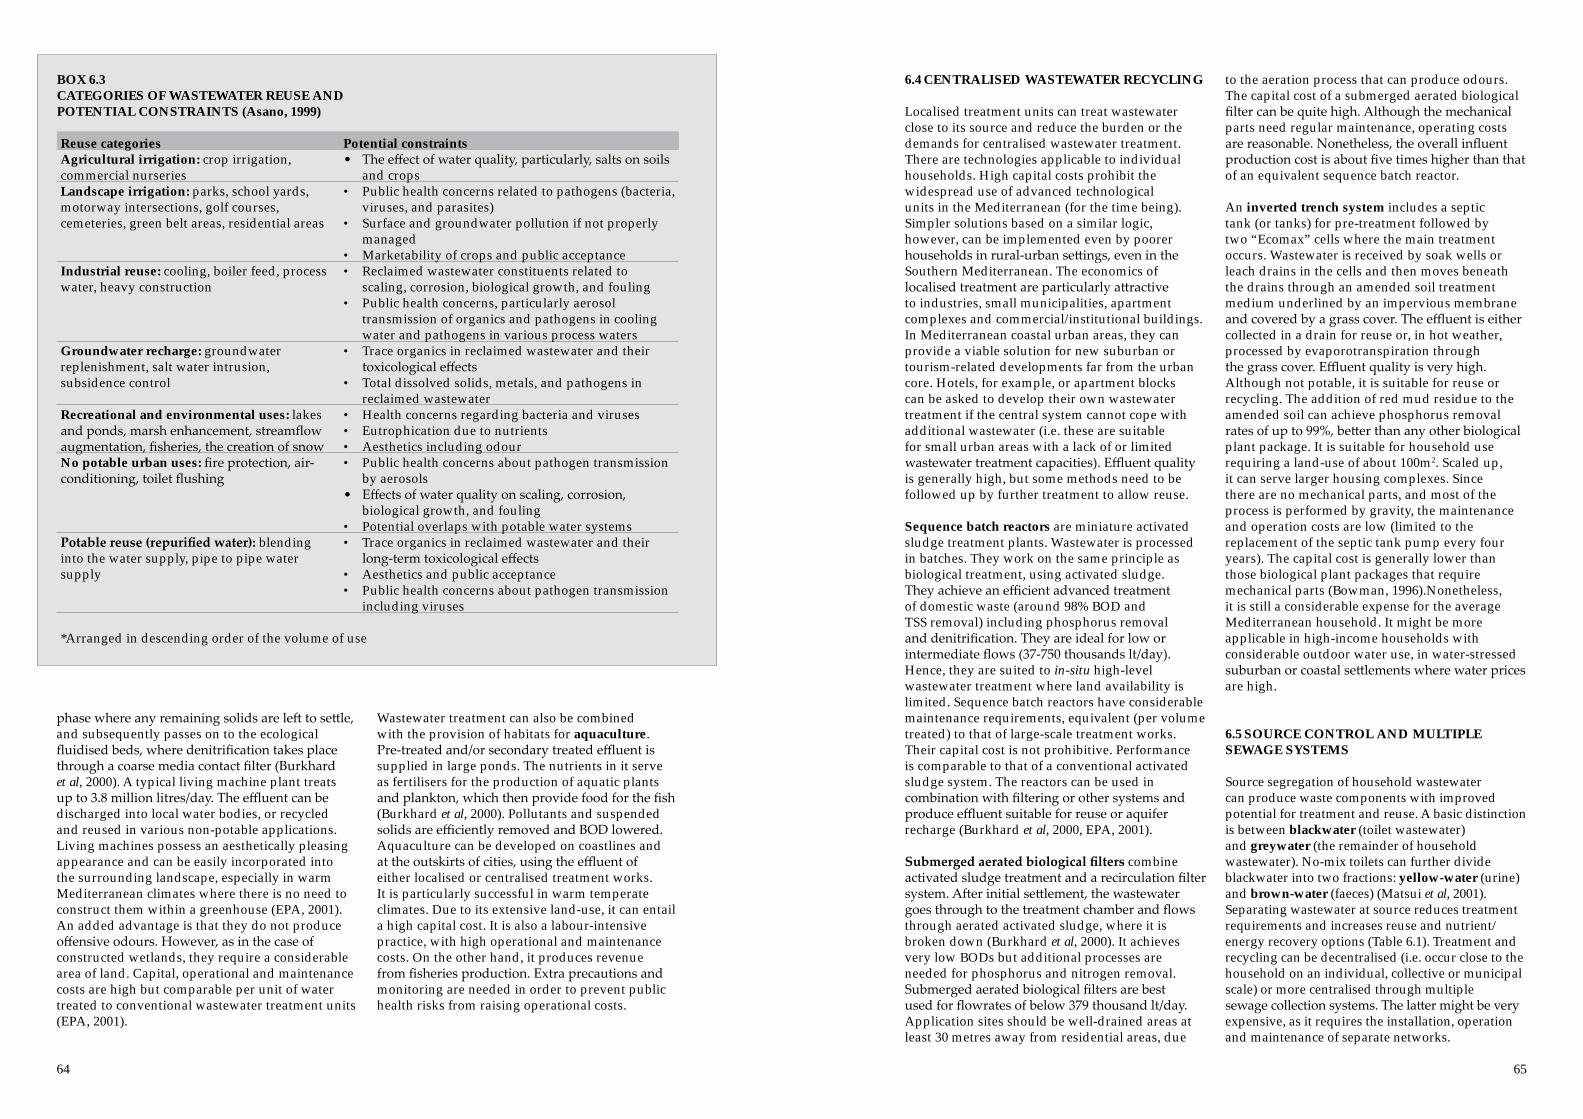
64 65
phase where any remaining solids are left to settle, and subsequently passes on to the ecological fluidised beds, where denitrification takes place through a coarse media contact filter (Burkhard et al, 2000). A typical living machine plant treats up to 3.8 million litres/day. The effluent can be discharged into local water bodies, or recycled and reused in various non-potable applications. Living machines possess an aesthetically pleasing appearance and can be easily incorporated into the surrounding landscape, especially in warm Mediterranean climates where there is no need to construct them within a greenhouse (EPA, 2001). An added advantage is that they do not produce offensive odours. However, as in the case of constructed wetlands, they require a considerable area of land. Capital, operational and maintenance costs are high but comparable per unit of water treated to conventional wastewater treatment units (EPA, 2001).
Wastewater treatment can also be combined with the provision of habitats for aquaculture. Pre-treated and/or secondary treated effluent is supplied in large ponds. The nutrients in it serve as fertilisers for the production of aquatic plants and plankton, which then provide food for the fish (Burkhard et al, 2000). Pollutants and suspended solids are efficiently removed and BOD lowered. Aquaculture can be developed on coastlines and at the outskirts of cities, using the effluent of either localised or centralised treatment works. It is particularly successful in warm temperate climates. Due to its extensive land-use, it can entail a high capital cost. It is also a labour-intensive practice, with high operational and maintenance costs. On the other hand, it produces revenue from fisheries production. Extra precautions and monitoring are needed in order to prevent public health risks from raising operational costs.
6.4 CENTRALISED WASTEWATER RECYCLING
Localised treatment units can treat wastewater close to its source and reduce the burden or the demands for centralised wastewater treatment. There are technologies applicable to individual households. High capital costs prohibit the widespread use of advanced technological units in the Mediterranean (for the time being). Simpler solutions based on a similar logic, however, can be implemented even by poorer households in rural-urban settings, even in the Southern Mediterranean. The economics of localised treatment are particularly attractive to industries, small municipalities, apartment complexes and commercial/institutional buildings. In Mediterranean coastal urban areas, they can provide a viable solution for new suburban or tourism-related developments far from the urban core. Hotels, for example, or apartment blocks can be asked to develop their own wastewater treatment if the central system cannot cope with additional wastewater (i.e. these are suitable for small urban areas with a lack of or limited wastewater treatment capacities). Effluent quality is generally high, but some methods need to be followed up by further treatment to allow reuse.
Sequence batch reactors are miniature activated sludge treatment plants. Wastewater is processed in batches. They work on the same principle as biological treatment, using activated sludge. They achieve an efficient advanced treatment of domestic waste (around 98% BOD and TSS removal) including phosphorus removal and denitrification. They are ideal for low or intermediate flows (37-750 thousands lt/day). Hence, they are suited to in-situ high-level wastewater treatment where land availability is limited. Sequence batch reactors have considerable maintenance requirements, equivalent (per volume treated) to that of large-scale treatment works. Their capital cost is not prohibitive. Performance is comparable to that of a conventional activated sludge system. The reactors can be used in combination with filtering or other systems and produce effluent suitable for reuse or aquifer recharge (Burkhard et al, 2000, EPA, 2001).
Submerged aerated biological filters combine activated sludge treatment and a recirculation filter system. After initial settlement, the wastewater goes through to the treatment chamber and flows through aerated activated sludge, where it is broken down (Burkhard et al, 2000). It achieves very low BODs but additional processes are needed for phosphorus and nitrogen removal. Submerged aerated biological filters are best used for flowrates of below 379 thousand lt/day. Application sites should be well-drained areas at least 30 metres away from residential areas, due
to the aeration process that can produce odours. The capital cost of a submerged aerated biological filter can be quite high. Although the mechanical parts need regular maintenance, operating costs are reasonable. Nonetheless, the overall influent production cost is about five times higher than that of an equivalent sequence batch reactor.
An inverted trench system includes a septic tank (or tanks) for pre-treatment followed by two “Ecomax” cells where the main treatment occurs. Wastewater is received by soak wells or leach drains in the cells and then moves beneath the drains through an amended soil treatment medium underlined by an impervious membrane and covered by a grass cover. The effluent is either collected in a drain for reuse or, in hot weather, processed by evaporotranspiration through the grass cover. Effluent quality is very high. Although not potable, it is suitable for reuse or recycling. The addition of red mud residue to the amended soil can achieve phosphorus removal rates of up to 99%, better than any other biological plant package. It is suitable for household use requiring a land-use of about 100m2. Scaled up, it can serve larger housing complexes. Since there are no mechanical parts, and most of the process is performed by gravity, the maintenance and operation costs are low (limited to the replacement of the septic tank pump every four years). The capital cost is generally lower than those biological plant packages that require mechanical parts (Bowman, 1996).Nonetheless, it is still a considerable expense for the average Mediterranean household. It might be more applicable in high-income households with considerable outdoor water use, in water-stressed suburban or coastal settlements where water prices are high.
6.5 SOURCE CONTROL AND MULTIPLE SEWAGE SYSTEMS
Source segregation of household wastewater can produce waste components with improved potential for treatment and reuse. A basic distinction is between blackwater (toilet wastewater) and greywater (the remainder of household wastewater). No-mix toilets can further divide blackwater into two fractions: yellow-water (urine) and brown-water (faeces) (Matsui et al, 2001). Separating wastewater at source reduces treatment requirements and increases reuse and nutrient/energy recovery options (Table 6.1). Treatment and recycling can be decentralised (i.e. occur close to the household on an individual, collective or municipal scale) or more centralised through multiple sewage collection systems. The latter might be very expensive, as it requires the installation, operation and maintenance of separate networks.
BOX 6.3CATEGORIES OF WASTEWATER REUSE AND POTENTIAL CONSTRAINTS (Asano, 1999)
Reuse categories Potential constraintsAgricultural irrigation: crop irrigation, commercial nurseries
• The effect of water quality, particularly, salts on soils and crops
Landscape irrigation: parks, school yards, motorway intersections, golf courses, cemeteries, green belt areas, residential areas
• Public health concerns related to pathogens (bacteria, viruses, and parasites)
• Surface and groundwater pollution if not properly managed
• Marketability of crops and public acceptanceIndustrial reuse: cooling, boiler feed, process water, heavy construction
• Reclaimed wastewater constituents related to scaling, corrosion, biological growth, and fouling
• Public health concerns, particularly aerosol transmission of organics and pathogens in cooling water and pathogens in various process waters
Groundwater recharge: groundwater replenishment, salt water intrusion, subsidence control
• Trace organics in reclaimed wastewater and their toxicological effects
• Total dissolved solids, metals, and pathogens in reclaimed wastewater
Recreational and environmental uses: lakes and ponds, marsh enhancement, streamflow augmentation, fisheries, the creation of snow
• Health concerns regarding bacteria and viruses • Eutrophication due to nutrients• Aesthetics including odour
No potable urban uses: fire protection, air-conditioning, toilet flushing
• Public health concerns about pathogen transmission by aerosols
• Effects of water quality on scaling, corrosion, biological growth, and fouling
• Potential overlaps with potable water systemsPotable reuse (repurified water): blending into the water supply, pipe to pipe water supply
• Trace organics in reclaimed wastewater and their long-term toxicological effects
• Aesthetics and public acceptance• Public health concerns about pathogen transmission
including viruses
*Arranged in descending order of the volume of use

66 67
The separation of greywater from blackwater requires separated plumping systems in the household. The separation of yellow from brown water can be done with urine-diverting toilets. A further division of the sewage system is also needed (Vinnerås and Jönsson, 2002). Urine-diverting toilets have an additional small bowl in the main toilet bowl that collects the urine. Diverted urine is collected and stored in plastic tanks before being transferred to a nutrient processing plant for nutrient recovery (Matsui et al, 2001). The system is applicable in new building developments but also as a retrofit in older complexes.
Separated greywater does not have excess nutrients. It can be directed to centralised treatment by a greywater sewage network. A simple biological treatment will then suffice. Alternatively, greywater can be treated and reused in-situ. Treated greywater can be used in irrigation or for toilet flushing, even with minimal treatment. Onsite treatment can be combined with the watering of plants in the garden. Greywater reuse becomes more cost effective when applied to larger housing estates than single households. A problem with greywater is that if stored for use, bacterial growth may be promoted. Greywater might also contain faecal pathogens from showers and washing machines, necessitating biological treatment for more advanced uses. It might also contain a high amount of household chemicals reducing its applicability; broader policies to control the household use of chemicals can extend greywater utilisation opportunities.
There are many technologies for greywater recycling, from very simple systems for one household to advanced treatment units for large-scale use. The most basic system involves coarse filtration and disinfection using chlorine or bromine. Disinfection will be inadequate though if greywater is more polluted (Jefferson et al, 1999). More advanced options are physical and physicochemical systems which use depth filtration, sand and/or membranes, coagulation and advanced oxidation. The effluent has a
substantially reduced organic pollutant load and low turbidity. Quality problems will arise, however, if membranes are not frequently cleaned. Biofilm methods can provide more advanced treatment and better quality effluent (reduced BOD and COD and non-detectable pathogens). Their performance is reliable and more consistent than the physical membranes, but they cost more. The anaerobic digestion of blackwater with energy recovery in a small biogas plant can be a good choice in hot climates such as those of the Mediterranean, especially if an amalgamation with kitchen waste is feasible. This can produce compost suitable for gardening and agricultural applications. The proper start up and operation of a biogas plant is essential. Physical (membranes) or chemical treatment are unfeasible as drying is far too energy consuming and membranes would be hard to operate with faeces (Matsui et al, 2001). Blackwater should have little water in its content. Separating, non-mix toilets or high tech sanitation vacuum-toilets with vacuum backwater transport can be used (Matsui et al, 2001).
The treatment of brownwater (low-diluted faeces without urine) is more straightforward. The main options include anaerobic digestion and composting. In warm Mediterranean climates with year-round sunshine, desiccation is also possible. In situ household treatment can be served by simple free fall to a composter or a desiccation toilet. In centralised systems, water collected from non-mix or separating toilets is transported in separated pipes and treated in a combined, two-chamber dewatering and composting unit. A compact system for very densely populated areas could be based on separating vacuum toilets or other toilets with very little water consumption (Matsui et al, 2001).
Urine has a high percentage of Nitrate and Phosphate (1.5-2 kg and 0.15-0.2 kg respectively), making it a good substitute to the traditionally energy-intensive produced (nitrate) and mined (phosphate) fertilisers in gardening and agriculture applications. Removing it from wastewater reduces
the risk of eutrophication in the effluent-receiving waters (Sonesson et al, 2000). Simple storage for six months provides enough time for pathogens to be diminished and for the degradation of medical residues. Application to brown land and mixing into topsoil is the most advantageous way to minimise nitrogen losses. Dilution is necessary prior to applications in plants to avoid damage (Matsui et al, 2001). Further concentration for an easier storage, transport and use is possible by using porous walls and crystallise salts on the surface. Urine-separation technology is new and the cost is rather elevated; it includes costs for construction of a dual sewage system and transportation costs.
6.6 HOUSEHOLD RAINWATER HARVESTING
Rainwater harvesting for direct use in drinking and other domestic purposes is a technique with a tradition spanning thousands of years in many parts of the Mediterranean. Today it is again seen as a significant opportunity for decentralised, community-based water management to combat
water shortages (Butler and Maksimović, 2000). Harvesting might be done at the building level or at the neighbourhood, municipal or urban levels (the latter is examined below under stormwater management techniques). Potential savings of potable water through the use of rainwater can reach 50% of household consumption (estimates for Germany, Konig, 1999).
In the simplest building system, water is collected from the roof and transferred by gravity through a small pipe to a surface or basement container tank (Figure 6.2). To avoid debris and other pollutants being washed off from the roof, “first flush” devices can be used, which divert the initial amount of run-off to wastewater. Before storage, rainwater has to be filtered, and for this purpose good, low-maintenance filters are recommended (Konig, 1999). After filtering, the collected water can be either stored for use in suitable, usually underground, containers, or supplied to a soakwell or other infiltration device for groundwater recharge. Such a system can be planned for new developments, individual houses or blocks of flats, but can also be retrofitted into existing buildings or building
Yearly loads Kg/(P*year)
Volume L/(P*year)
Greywater 25.000-100.000
Urine ~500 Faeces~50 (option: add biowaste)
N ~4-5 ~3% ~87% ~10%P ~0,75 ~10% ~50% ~40%K ~1,8 ~34% ~54% ~12%COD ~30 ~41% ~12% ~47%
Treatment ↓ Reuse/Water Cycle
Treatment ↓ Fertiliser
Biogas-Plant Composting ↓ Soil-Conditioner
Table 6.1 Loads in samples of household wastewater (Matsui et al, 2001)
Figure 6.2 A simple system for rainwater harvesting (picture taken from Butler and Maksimovic, 2003)
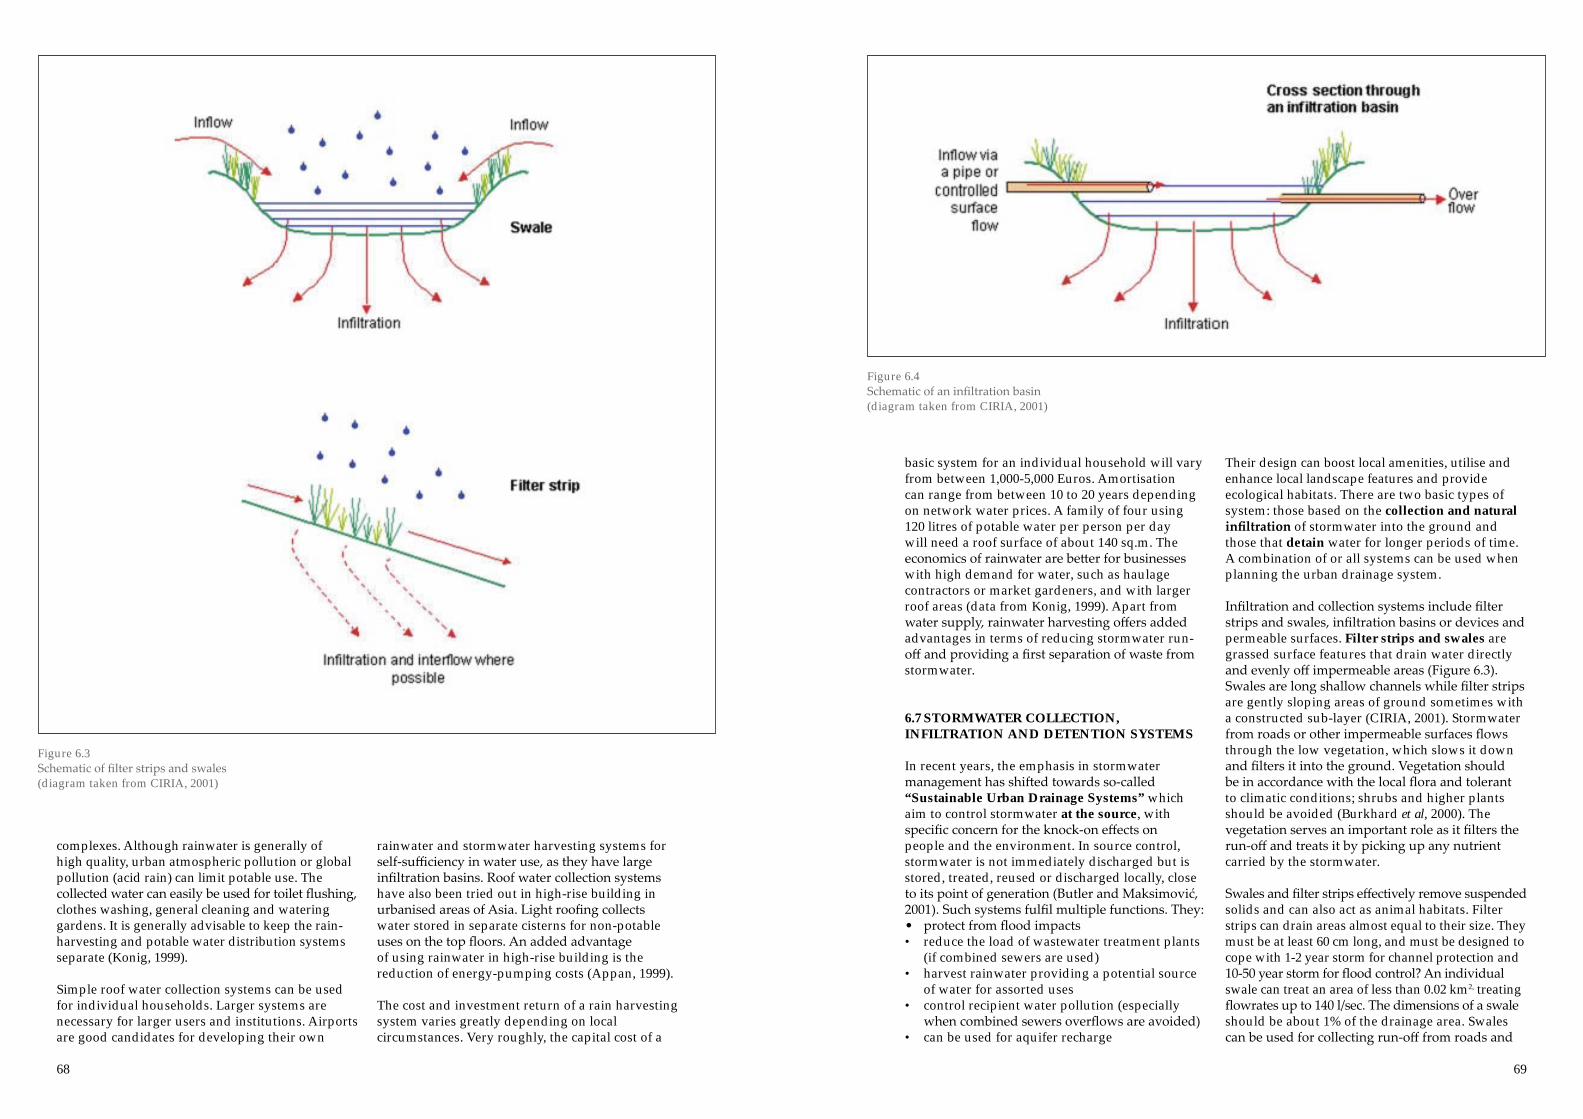
68 69
complexes. Although rainwater is generally of high quality, urban atmospheric pollution or global pollution (acid rain) can limit potable use. The collected water can easily be used for toilet flushing, clothes washing, general cleaning and watering gardens. It is generally advisable to keep the rain-harvesting and potable water distribution systems separate (Konig, 1999).
Simple roof water collection systems can be used for individual households. Larger systems are necessary for larger users and institutions. Airports are good candidates for developing their own
rainwater and stormwater harvesting systems for self-sufficiency in water use, as they have large infiltration basins. Roof water collection systems have also been tried out in high-rise building in urbanised areas of Asia. Light roofing collects water stored in separate cisterns for non-potable uses on the top floors. An added advantage of using rainwater in high-rise building is the reduction of energy-pumping costs (Appan, 1999).
The cost and investment return of a rain harvesting system varies greatly depending on local circumstances. Very roughly, the capital cost of a
basic system for an individual household will vary from between 1,000-5,000 Euros. Amortisation can range from between 10 to 20 years depending on network water prices. A family of four using 120 litres of potable water per person per day will need a roof surface of about 140 sq.m. The economics of rainwater are better for businesses with high demand for water, such as haulage contractors or market gardeners, and with larger roof areas (data from Konig, 1999). Apart from water supply, rainwater harvesting offers added advantages in terms of reducing stormwater run-off and providing a first separation of waste from stormwater.
6.7 STORMWATER COLLECTION, INFILTRATION AND DETENTION SYSTEMS
In recent years, the emphasis in stormwater management has shifted towards so-called “Sustainable Urban Drainage Systems” which aim to control stormwater at the source, with specific concern for the knock-on effects on people and the environment. In source control, stormwater is not immediately discharged but is stored, treated, reused or discharged locally, close to its point of generation (Butler and Maksimović, 2001). Such systems fulfil multiple functions. They:• protect from flood impacts • reduce the load of wastewater treatment plants
(if combined sewers are used)• harvest rainwater providing a potential source
of water for assorted uses• control recipient water pollution (especially
when combined sewers overflows are avoided) • can be used for aquifer recharge
Their design can boost local amenities, utilise and enhance local landscape features and provide ecological habitats. There are two basic types of system: those based on the collection and natural infiltration of stormwater into the ground and those that detain water for longer periods of time. A combination of or all systems can be used when planning the urban drainage system. Infiltration and collection systems include filter strips and swales, infiltration basins or devices and permeable surfaces. Filter strips and swales are grassed surface features that drain water directly and evenly off impermeable areas (Figure 6.3). Swales are long shallow channels while filter strips are gently sloping areas of ground sometimes with a constructed sub-layer (CIRIA, 2001). Stormwater from roads or other impermeable surfaces flows through the low vegetation, which slows it down and filters it into the ground. Vegetation should be in accordance with the local flora and tolerant to climatic conditions; shrubs and higher plants should be avoided (Burkhard et al, 2000). The vegetation serves an important role as it filters the run-off and treats it by picking up any nutrient carried by the stormwater.
Swales and filter strips effectively remove suspended solids and can also act as animal habitats. Filter strips can drain areas almost equal to their size. They must be at least 60 cm long, and must be designed to cope with 1-2 year storm for channel protection and 10-50 year storm for flood control? An individual swale can treat an area of less than 0.02 km2, treating flowrates up to 140 l/sec. The dimensions of a swale should be about 1% of the drainage area. Swales can be used for collecting run-off from roads and
Figure 6.3 Schematic of filter strips and swales (diagram taken from CIRIA, 2001)
Figure 6.4 Schematic of an infiltration basin (diagram taken from CIRIA, 2001)

70 71
parking lots and can also act as temporary storage of run-off, for a maximum time period of 48 hours (wet swales). They are not particularly applicable in residential or highly urbanised areas where land prices are high (CWP, 2000). Apart from land, other capital costs are quite low. Operation and management costs are moderate; the main requirement is periodic refurbishment.
Infiltration basins operate in much the same way as swales (Figure 6.4). They are allocated grassed areas that are flooded after rainfall. The conveyed run-off or the sheet-flow of water from adjacent impermeable surfaces is allowed to infiltrate into the ground. During dry weather, the basins remain dry. It is recommended that several small basins
are used rather than one large one. The distance from the water table should exceed 1.2 metres to avoid possible contamination from polluted stormwater. If the quality of the run-off is good, however, they can be used for groundwater recharge. The efficiency of removal of suspended solids is very high (it can reach 100%). Basins usually occupy 2%-3% of the drainage area. They should be located in areas where the soil has a high absorption rate, so that the water can be absorbed within a short period of time. They are suitable for use in arid or semi-arid areas. Their cost depends on land and they will be more applicable in low-cost peripheral areas. The operation and maintenance cost are not high (about 5%-10% of construction costs).
Permeable surfaces can be of the form of grassed or gravelled areas, of permeable pavements or paving blocs with vertical holes or voids in between them (Figure 6.5). Beneath the surface material there is a permeable sub-base. This permits the storage, treatment, transport and infiltration of water (CIRIA, 2001). The efficiency of suspended solids removal reaches almost 100% (Burkhard et al, 2000). Some studies suggest that they also provide treatment for other pollutants, such as oil. Permeable surfaces are often used for parking lots and road verges. Since they can be applied in small spaces, they are a good option for highly urbanised areas, either in new developments or during refurbishment (e.g. of existing parking spaces). Given the high rates of pollutant removal, they need a distance of just 0.9 m from the water table (Burkhard et al, 2000). They are therefore appropriate for low-lying coastal areas. They have a rather high capital cost and need maintenance, mainly sweeping. They require a slight use of land, however.
Soakaways and infiltration trenches are underground structures that drain the water directly into the ground. These are circular shafts or trenches, made of pre-cast concrete manhole elements and filled with gravel (Figure 6.6). Run-off is directed and stored in the soakaway and allowed to infiltrate into the ground. The removal of suspended solids can be very high
(up to 100%). Soakaways are easily integrated into the surrounding environment. They have similar applicability (recharge in arid and semi-arid areas) and requirements (distance from water table, pre-treatment if run-off is polluted) to other infiltration techniques. When constructing a soakaway or infiltration trench, precautions and special consideration should be given to the soil permeability that can restrict the infiltration capacity of the soakaway. Soakways are suitable for urbanised areas since they occupy little space, and for low relief coastal areas since they require minimal head. They require considerable maintenance and frequent periodic refurbishment (Burkhard et al, 2000).
Detention systems include ponds, bioretention areas and constructed wetlands such as those already described as part of the ecological treatment techniques. Ponds are similar to infiltration basins, but they contain water at all times (Figure 6.7). Stormwater run-off flows directly into the pond where it settles and is left to infiltrate into the ground. Ponds function as retention, detention and settlement structures. The vegetation takes up nutrients and bacterial action treats the stormwater. Vegetation also allows for calm conditions and promotes settlement. The inlet and outlet of the pond should be carefully designed (Burkhard et al, 2000). The pond should have a volume capacity sufficient to control 2
Figure 6.5 Schematic of permeable surfaces (diagram taken from CIRIA, 2001)
Figure 6.6 Schematic of soakways (diagram taken from CIRIA, 2001)
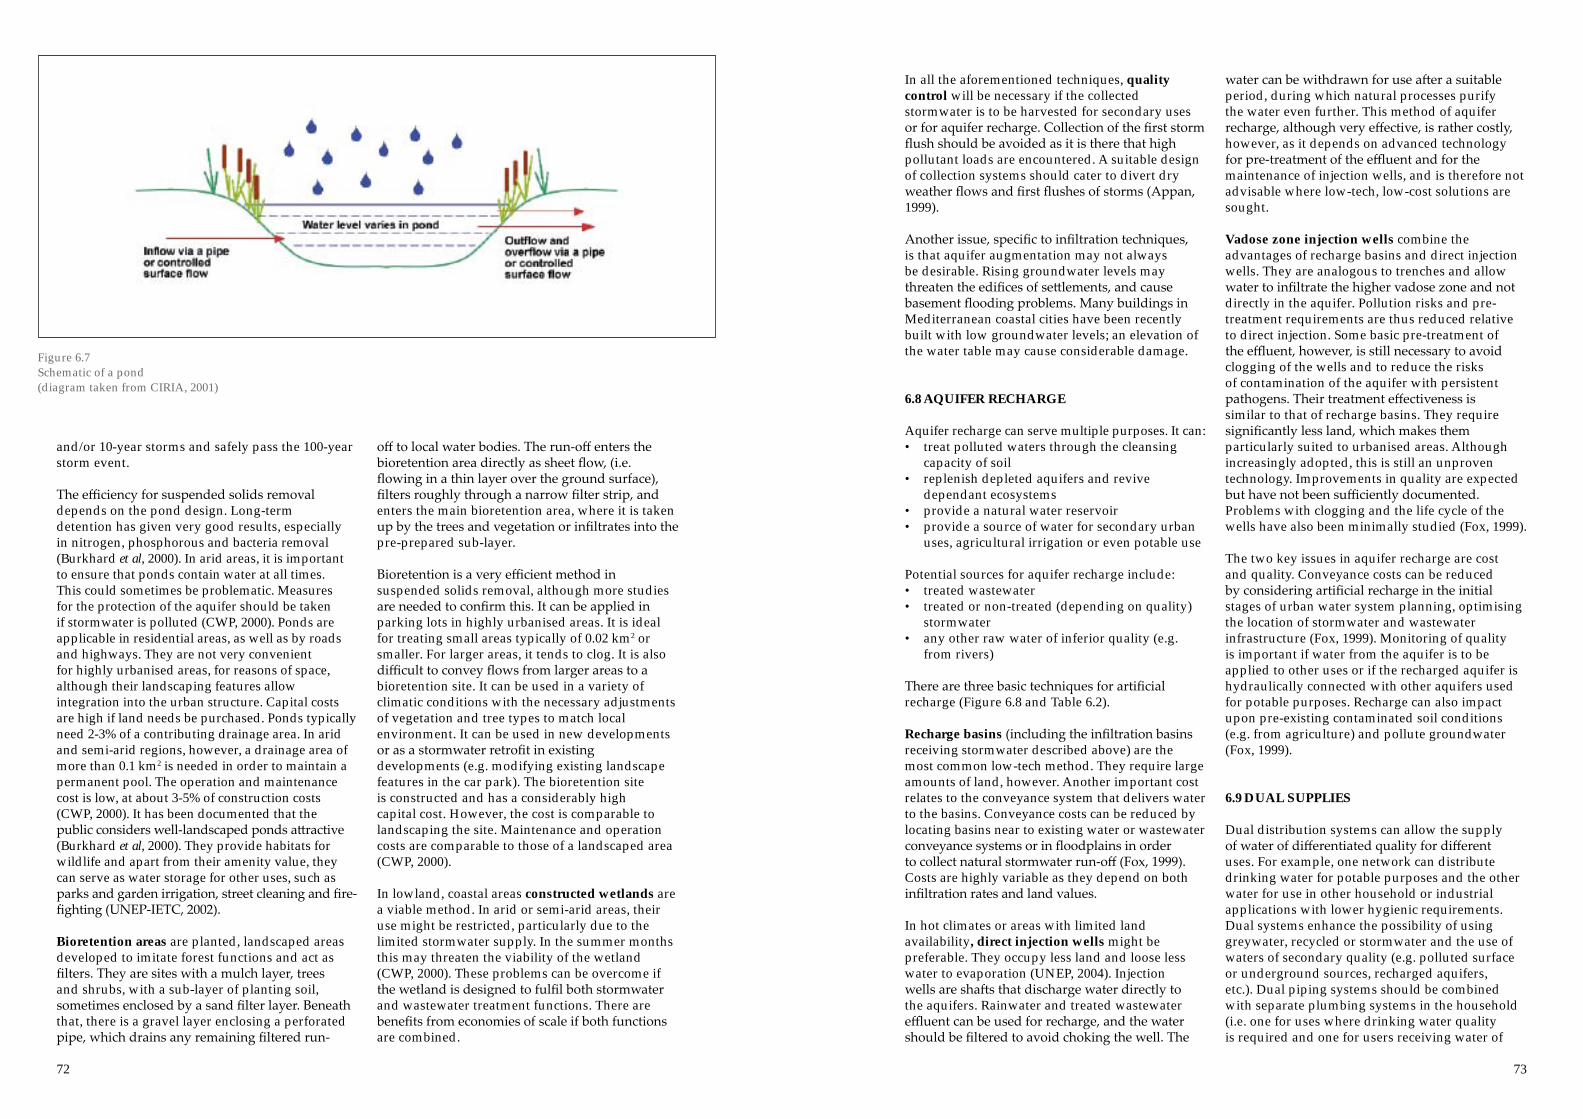
72 73
and/or 10-year storms and safely pass the 100-year storm event.
The efficiency for suspended solids removal depends on the pond design. Long-term detention has given very good results, especially in nitrogen, phosphorous and bacteria removal (Burkhard et al, 2000). In arid areas, it is important to ensure that ponds contain water at all times. This could sometimes be problematic. Measures for the protection of the aquifer should be taken if stormwater is polluted (CWP, 2000). Ponds are applicable in residential areas, as well as by roads and highways. They are not very convenient for highly urbanised areas, for reasons of space, although their landscaping features allow integration into the urban structure. Capital costs are high if land needs be purchased. Ponds typically need 2-3% of a contributing drainage area. In arid and semi-arid regions, however, a drainage area of more than 0.1 km2 is needed in order to maintain a permanent pool. The operation and maintenance cost is low, at about 3-5% of construction costs (CWP, 2000). It has been documented that the public considers well-landscaped ponds attractive (Burkhard et al, 2000). They provide habitats for wildlife and apart from their amenity value, they can serve as water storage for other uses, such as parks and garden irrigation, street cleaning and fire-fighting (UNEP-IETC, 2002).
Bioretention areas are planted, landscaped areas developed to imitate forest functions and act as filters. They are sites with a mulch layer, trees and shrubs, with a sub-layer of planting soil, sometimes enclosed by a sand filter layer. Beneath that, there is a gravel layer enclosing a perforated pipe, which drains any remaining filtered run-
off to local water bodies. The run-off enters the bioretention area directly as sheet flow, (i.e. flowing in a thin layer over the ground surface), filters roughly through a narrow filter strip, and enters the main bioretention area, where it is taken up by the trees and vegetation or infiltrates into the pre-prepared sub-layer.
Bioretention is a very efficient method in suspended solids removal, although more studies are needed to confirm this. It can be applied in parking lots in highly urbanised areas. It is ideal for treating small areas typically of 0.02 km2 or smaller. For larger areas, it tends to clog. It is also difficult to convey flows from larger areas to a bioretention site. It can be used in a variety of climatic conditions with the necessary adjustments of vegetation and tree types to match local environment. It can be used in new developments or as a stormwater retrofit in existing developments (e.g. modifying existing landscape features in the car park). The bioretention site is constructed and has a considerably high capital cost. However, the cost is comparable to landscaping the site. Maintenance and operation costs are comparable to those of a landscaped area (CWP, 2000).
In lowland, coastal areas constructed wetlands are a viable method. In arid or semi-arid areas, their use might be restricted, particularly due to the limited stormwater supply. In the summer months this may threaten the viability of the wetland (CWP, 2000). These problems can be overcome if the wetland is designed to fulfil both stormwater and wastewater treatment functions. There are benefits from economies of scale if both functions are combined.
In all the aforementioned techniques, quality control will be necessary if the collected stormwater is to be harvested for secondary uses or for aquifer recharge. Collection of the first storm flush should be avoided as it is there that high pollutant loads are encountered. A suitable design of collection systems should cater to divert dry weather flows and first flushes of storms (Appan, 1999).
Another issue, specific to infiltration techniques, is that aquifer augmentation may not always be desirable. Rising groundwater levels may threaten the edifices of settlements, and cause basement flooding problems. Many buildings in Mediterranean coastal cities have been recently built with low groundwater levels; an elevation of the water table may cause considerable damage.
6.8 AQUIFER RECHARGE
Aquifer recharge can serve multiple purposes. It can:• treat polluted waters through the cleansing
capacity of soil • replenish depleted aquifers and revive
dependant ecosystems • provide a natural water reservoir • provide a source of water for secondary urban
uses, agricultural irrigation or even potable use
Potential sources for aquifer recharge include:• treated wastewater • treated or non-treated (depending on quality)
stormwater • any other raw water of inferior quality (e.g.
from rivers)
There are three basic techniques for artificial recharge (Figure 6.8 and Table 6.2).
Recharge basins (including the infiltration basins receiving stormwater described above) are the most common low-tech method. They require large amounts of land, however. Another important cost relates to the conveyance system that delivers water to the basins. Conveyance costs can be reduced by locating basins near to existing water or wastewater conveyance systems or in floodplains in order to collect natural stormwater run-off (Fox, 1999). Costs are highly variable as they depend on both infiltration rates and land values.
In hot climates or areas with limited land availability, direct injection wells might be preferable. They occupy less land and loose less water to evaporation (UNEP, 2004). Injection wells are shafts that discharge water directly to the aquifers. Rainwater and treated wastewater effluent can be used for recharge, and the water should be filtered to avoid choking the well. The
water can be withdrawn for use after a suitable period, during which natural processes purify the water even further. This method of aquifer recharge, although very effective, is rather costly, however, as it depends on advanced technology for pre-treatment of the effluent and for the maintenance of injection wells, and is therefore not advisable where low-tech, low-cost solutions are sought.
Vadose zone injection wells combine the advantages of recharge basins and direct injection wells. They are analogous to trenches and allow water to infiltrate the higher vadose zone and not directly in the aquifer. Pollution risks and pre-treatment requirements are thus reduced relative to direct injection. Some basic pre-treatment of the effluent, however, is still necessary to avoid clogging of the wells and to reduce the risks of contamination of the aquifer with persistent pathogens. Their treatment effectiveness is similar to that of recharge basins. They require significantly less land, which makes them particularly suited to urbanised areas. Although increasingly adopted, this is still an unproven technology. Improvements in quality are expected but have not been sufficiently documented. Problems with clogging and the life cycle of the wells have also been minimally studied (Fox, 1999).
The two key issues in aquifer recharge are cost and quality. Conveyance costs can be reduced by considering artificial recharge in the initial stages of urban water system planning, optimising the location of stormwater and wastewater infrastructure (Fox, 1999). Monitoring of quality is important if water from the aquifer is to be applied to other uses or if the recharged aquifer is hydraulically connected with other aquifers used for potable purposes. Recharge can also impact upon pre-existing contaminated soil conditions (e.g. from agriculture) and pollute groundwater (Fox, 1999).
6.9 DUAL SUPPLIES
Dual distribution systems can allow the supply of water of differentiated quality for different uses. For example, one network can distribute drinking water for potable purposes and the other water for use in other household or industrial applications with lower hygienic requirements. Dual systems enhance the possibility of using greywater, recycled or stormwater and the use of waters of secondary quality (e.g. polluted surface or underground sources, recharged aquifers, etc.). Dual piping systems should be combined with separate plumbing systems in the household (i.e. one for uses where drinking water quality is required and one for users receiving water of
Figure 6.7 Schematic of a pond (diagram taken from CIRIA, 2001)

74 75
inferior quality). The costs of installing a secondary distribution network within existing urbanised areas are prohibitive. It can only be attractive in some rare cases where new water sources may be very scarce and expensive.
The inconvenience caused by the excavation and plumbing works for the installation of a second network is another major problem. This could be reduced if it is timed to coincide with any other major utility network installation (e.g. the provision of a natural gas network). Dual piping however, can be a favourable option for new urban developments and residential areas where the distribution network has not yet been laid down.
The Cross-connection of networks or misuse (e.g. confusing secondary water with potable water) is a major risk in and obstacle to the adoption of dual supply systems. Clear marking (usually colour coding) and the separation of pipes and taps is necessary. The provision of adequate user information is essential. In new buildings, it is important to avoid delays in the operation of the secondary system. Such delays often occur, as it takes time to complete the secondary conveyance system. Connections in the new buildings may then be made without taking into account the presence of secondary water. Users in the new buildings are also accustomed to receiving drinking water from all taps. These might be difficult to change later on, increasing the risk of contamination.
6.10 DESALINATION
Desalination is an option increasingly considered in coastal Mediterranean settlements. It can be applied both in the desalination of sea water as well as in the treatment of salinised groundwater. Systems range from the more centralised, serving an entire city, to the more decentralised which can serve a small industry or hotel.
There are two basic technologies: membrane filtration and thermal (distillation) processes. Reverse osmosis (RO), a membrane technique, is the commonest. It currently accounts for 22% of the largest desalination plants worldwide (Semiat, 2000). At high temperatures, high salinity and pollution levels, RO becomes uneconomical due to the need for complex pre-treatment to ensure good condition and function of the membranes (Bidra and Abosh, 2000). The quality of the produced water is fair (100-600 ppm total dissolved solids).
Thermal desalination processes, on the other hand, produce water with 10-50ppm of total dissolved solids (Semiat, 2000). Multi-Stage Flash (MSF) involves the production of condensate from
pressurised seawater. Multi-Effect Distillation (MED) is based on multistage evaporation, and has a higher production efficiency than the MSF technique. It faces problems with operation and maintenance, however, due to scaling and fouling especially in higher temperatures (Bidra and Abosh, 2000). Vapour Compression (VC) is based on the mechanical or thermal compression of vapour, and is a method more suited to smaller scale operations.
Desalination techniques involve intense energy use, typically supplied by fossil fuels. The widespread application of desalination may thus contribute to the exhaustion of non-renewable energy sources and greenhouse gas emissions as well as climate change. By-products of the process are corrosive and contain harmful chemicals. The disposal of brine into the nearby sea may be problematic in Mediterranean coastal areas since the aesthetic value of the sea and nearby recreational or tourism activities may be compromised. The desalination of brackish groundwater may also permit the continuous overdraft of aquifers increasing salt intrusion and irreversible effects.
Rapid technical advances, however, increasingly make desalination a more viable option for some Mediterranean settlements and even for decentralised use (by industries, hotels, large houses, etc.). Efficiency improvements have reduced costs and energy consumption. Research is also focussed on the coupling of desalination plants with renewable energy sources (via the use of solar radiation). Desalination may be an economically favourable option where water resources are scarce and the cost of new water resource works high. Even in terms of energy consumption, desalination might be a more competitive option, than for instance, the transfer of water from a distant source.
6.11 SUPPORTING POLICIES
The implementation and effectiveness of water cycle technologies will vary considerably depending on the local environmental and socio-economic context. Like UWDM, the evaluation of existing applications, the sharing of experience and an adaptation to the Mediterranean context is necessary. Research, networking of experts and the sharing of best practice and data at the Mediterranean level should be a policy priority. Capacity development and training of the technical personnel working for water utilities and urban authorities in water cycle technologies is important.
Figure 6.8 Methods for aquifer recharge (Fox, 1999)
Recharge basins Vadose zone injection wells
Direct injection wells
Aquifer type Unconfined Unconfined Unconfined or confinedPre-treatment requirements
Low technology Removal of solids High technology
Estimated major capital costs US$
Land and distribution system
$25,000-75,000 per well $500,000-1,500,000 per well
Capacity 1,000-20,000 m3/ha-d 1,000-3,000 m3/well-d 2,000-6,000 m3/well-dMaintenance requirements
Drying and scraping Drying and disinfection Disinfection and flow reversal
Estimated life cycle >100 years 5-20 years 25-50 yearsSoil aquifer treatment Vadose zone and saturated
zoneVadose zone and saturated zone
Saturated zone
Table 6.2 Major characteristics of aquifer recharge techniques (Fox, 1999)

76 77
Proper economic incentives are needed if the technologies are to have a chance of adoption. The economic feasibility of the technologies for the consumers depends on the relative cost of water from the network. Economic feasibility for the utilities depends on the cost of raw water and future source expansion costs. At the customer level, the provision of economic support programmes by the utilities facilitating the adoption of new household technologies is relevant (subsidies, favourable loans, price discounts). At the utility level, the same proposals as for UWDM hold. In particular, there is a need for subsidies or public funding programmes for the implementation of the new technologies and the development of funding mechanisms.
The authorisation process for the development of new sources or the construction of new infrastructure could be linked with evidence of committed effort in the application of the related water cycle technologies. For example: the licence of an urban water utility for groundwater abstractions (or an application for a new one), would not be granted, until there is a programme in place for the recharge of the aquifer with an equivalent amount of secondary water.
Regulatory supports or controls to users are another important instrument. New buildings and constructions could be demanded by law to exhibit some minimum specifications relating to the use of water. Rainwater harvesting could be made mandatory in new self-catering complexes or hotels in Mediterranean urban tourist areas. Greywater reuse or dual pipe systems could be made mandatory for new apartment complexes in suburban developments.
Water-sensitive Urban Design (Chapter 4, Volume I) is a key tool for the integration of innovative water technologies in the process of urban development. The spontaneous and uncontrolled growth of many coastal settlements, however, may hinder the adoption of water cycle technologies. The construction industry is a key economic sector in many Mediterranean countries; policies that increase building costs for the sake of water efficiency (e.g. requirements for new buildings) may face obstacles.
An issue pertaining to the adoption of water cycle technologies (especially those that include the reuse of water) is public health and safety. In comparison to UWDM, it is not sufficient to raise public awareness on the importance of conserving freshwater. Educating and informing the public on the use (and dangers vis-a-vis precautions) of the new technologies is essential. Public mistrust can be a serious barrier to water recycling. Public ignorance can lead to health hazards. Continuous
information programmes are necessary to minimise such risks.
Clear and enforceable regulations governing the standards of the new technologies and their use are necessary to minimise public health risks and to increase public confidence and trust. In California, for example, where wastewater reuse is widely practised, the State’s Department of Health and Safety issues detailed rules regarding the type of wastewater (according to level of treatment) permitted to be applied to each specific use. Uses are described at a very specific rather than generic level: e.g. motorway landscaping, decorative fountains, flushing sanitary sewers, etc. Detailed regulatory rules for the utilisation of different types of secondary water in assorted uses should be in place in all Mediterranean countries before the adoption of the new technologies is promoted (Chapter 3).
Responsible management and the continuous monitoring of applications (e.g. of the qualitative characteristics of recharged aquifers) is also necessary. The lack of enforcement and monitoring of environmental and public health regulations in some Mediterranean countries (especially those with fewer resources to devote to such tasks) is a seriously limiting factor.
Another significant constraining factor is the high requirements for land of many of the aforementioned techniques. Mediterranean coastal urban areas are characterised by spatial congestion due to the high building density, a narrow coastal zone (mountains are typically close to the coast), the premium value of coastal land, and competition between tourism facilities, urbanisation and agricultural production. In such a context, the capital cost of methods such as artificial recharge, stormwater collection, detention and infiltration or constructed wetlands, increases substantially. The promotion of these techniques needs to build on the added advantage of their landscape features and their contribution to aesthetic pleasure, which can benefit the tourism industry and urban life. As such, they should be a central feature of integrated coastal zone management and planning, which caters explicitly for the allocation of competing land-uses and activities in the coastal area (chapters 4 and 5, Volume I).
A key issue is also that the technologies mentioned in this chapter serve multiple functions. Often, however, these functions are dispersed among different authorities. Seen from the limited perspective of only one function/authority, technologies such as stormwater detention or rainwater harvesting may not be cost competitive. In order to realise the mutual benefits, it is
necessary to build cooperative organisational partnerships to share costs, works and benefits between the various authorities involved. Such partnerships can be built around specific projects (e.g. a park also serving as a storm detention pond and biodetention area) or programmes (e.g. the promotion of rainwater harvesting by big buildings and institutions). The institutionalisation of a permanent partnership in the form of a Forum with overall responsibility for the planning and management of the coastal urban water system (see Chapter 4, Volume I) should facilitate the adoption of multi-functional technologies.

79
7.1 PRICING AND TRADE-OFF GOALS
Water tariffs secure revenue for the funding of the urban water system, allocate costs and provide incentives to different uses and users. A proper pricing system should be effective in achieving society’s goals. These goals include economic efficiency, equity and environmental protection. In addition, the pricing system should cover the funding of the operations and the system’s investments (financial sustainability).
Satisfying all objectives is not an easy task. There are certain trade-offs to be made. Different tariff systems settle them in different ways. Conflicts around the settling of these trade-offs make price-setting a contentious process. A better understanding of objectives and trade-offs is necessary in order to make a conscious choice between different tariff options.
7.1.1 Economic efficiency
Full costThere are competing demands for water and for urban water services, both in space and in time. According to the criterion of economic efficiency, finite resources (water or services) should be allocated to maximise economic advantage, i.e. to those activities or users with the highest use values. Economic theory suggests that an efficient allocation will occur if users pay the full cost of the services they receive (Figure 7.1). This includes all operating and capital costs associated with the system and the “external” costs due to resource depletion or pollution (OECD, 1999).
Average and marginal cost pricingThe apparently simple question: “how much does it cost to supply me with the water that serves my needs?” i.e. “what is the full cost”, however, is extremely complex (Hanemann, 1998).
Firstly, average and marginal costs differ considerably. The marginal cost of a product (or a service) is the cost of producing an additional unit of it. Average costs on the other hand reflect the unit cost of producing all units (i.e. the sum of historical, different costs into a single average).
Depending on whether average or marginal costs are used, very different “full costs” will result.
Economic theory suggests using marginal costs. If the price of a service equals the full marginal cost of its provision, then an efficient pattern of water use and system development over time (“dynamic efficiency”) will result when the marginal rate reflects the long run marginal cost of the service (Dziegelewski et al, 1995). However:1. Marginal costs depend on the time horizon
examined. Urban water systems are highly capital intensive and most of their costs are capital costs which are fixed in the short-term, but variable in the long-term (as infrastructure needs to be replaced or expanded). Short run and long run marginal cost differences may be huge.
2. Computing marginal costs may require an enormous amount of data and scientific and engineering analysis:
Capital is long-lived and includes different types of assets, acquired at different times and involving different costs. It is not easy to precisely determine when new assets will be needed in the long-term (or existing ones will be replaced) and at what cost.
Some costs vary with the number of customers, others with the quantity of water delivered, etc.
Some assets serve several different functions and there is a problem of allocating costs among separate beneficiaries (Hanemann, 1998).
In comparison to average cost pricing, which demands only an estimation of total costs and production, marginal cost pricing demands detailed information of costs for a variety of assets (plant, equipment, underground networks), and of both existing and potential future investments (Dziegelewski et al, 1995).
Acquiring the necessary information to compute marginal costs has its own cost. Moving to more efficient costing and pricing systems entails certain trade-offs with administrative and operational expenditures.
7. PRICING URBAN WATER SERVICES This chapter provides insights into how to design water service tariffs that achieve economic, social and environmental goals. Firstly, a general discussion of the different objectives served by water pricing is offered, revealing the complexity of their realisation and the trade-offs involved. Different tariffs are then presented and their advantages and disadvantages assessed. Following this, the main elements of an institutionalised and inclusive rate-setting process are outlined. The chapter concludes with a set of guiding principles for proper urban water pricing.

80 81
A more practical problem is that marginal cost pricing can result in the over-collection of revenue. Marginal costs exceed average costs in capital-intensive industries such as water utilities. Utilities may be rewarded with profits that they do not reserve and water users may subsidise tax payers or shareholders. This raises questions regarding equity.
Environmental externalitiesEven if capital and operational costs could be computed, however, reliable and broadly-accepted monetary estimates of environmental damages from pollution, depletion, new works or production processes do not exist (OECD, 1999; see also section 4.2.2).
A pragmatic approach to economic efficiencyWhereas marginal cost pricing provides a theoretical ideal for economic efficiency, it might be impossible to implement it fully. “Second best” efficient solutions need to be found. A practical benchmark for efficient pricing is to compute average long run incremental costs for a large, expected incremental block of sales, such as for a future reservoir or treatment plant (Hanemann, 1998).
7.1.2 Equity
Water services are essential for the sustenance of humans and for the economic development of a city. Pricing allocates costs. Water prices have important distributive consequences; they determine the incidence of costs and benefits between different individuals, groups or sectors. Equity questions concern this incidence of “who pays for what”. There are two important equity questions: firstly, the distribution of cost between users and secondly, the justification of the revenue collected by the utility.
Economic vs. social equityThe meaning of social “equity” is often taken as given despite there being different and partially irreconcilable notions of equity. An oversimplified distinction is between “economic” and “social” equity (Bakker, 2001).
Economic equity reflects a liberal perspective and is close to the concept of economic efficiency. It rests on the “benefit principle”. An equitable allocation is one in which individuals pay costs relative to their utilisation of the system.
Social equity reflects a more traditionally socialist perspective. It is based on an “ability to pay” principle. Instead of maximum economic benefit, it stresses social solidarity and redistribution towards “equalisation”.
Equity and subsidiesThe two perspectives lead to different prescriptions for water pricing. From an economic equity perspective, subsidies should be removed and users should pay the full cost of the service they receive. From a social equity perspective, removing subsidies is inequitable if it leads to a deterioration of the relative living standards of the poor. A pricing policy whereby rich users cross-subsidise poor ones is welcomed from a social equity perspective, but refuted from an economic equity perspective. Likewise, UWDM policies that may, in setting water prices, discriminate between users (e.g. charging higher tariffs to large estates or industries) are unacceptable from an economic equity stance.
Despite this contrast, there is also some potential common ground:
1. Some inefficiency and loss in economic equity can be tolerated for the provision of public and merit goods. A lack of access of some people to drinking water or sanitation services can cause epidemics that impact on the community as a whole. These are “externalities” not captured by the market. Public health concerns suggest that the whole population benefits from safe and reliable access to an agreed minimum level and standard of water services (OECD, 1999).
2. General subsidisation may be not only economically, but also socially inequitable. Water use may serve both basic needs and luxury purposes. General subsidisation will reduce the cost of both. It can also foster environmentally irresponsible behaviour. This in turn, may impact disproportionately upon weaker social groups or regions.
Those who support general subsidisation from a social equity perspective implicitly assume that the decisions of the state represent the choice of its constituents. In reality, governments may be captive to vested interests (e.g. the construction industry) or to the interests of specific regions (for example big cities over rural areas). General subsidisation may thus lead both to the waste of natural and financial resources and to socially inequitable outcomes in that powerful groups or regions are favoured, displacing costs to weaker ones.
On the other hand, a purely economic efficiency/equity perspective, which argues for the total removal of subsidies, is no more appropriate. “It is naive to pretend, as some do, that the social security and tax system can be left to deal with any consequent undesirable redistribution of income” (Herrington, 1997).
The cost of water, even when subsidised, is always recovered; not from charges but from taxes. The question concerns the shift in the incidence of costs and benefits in moving from tax to price recovery. This means that with proper design, there is no reason why tariffs cannot express the same social equity principles as, for instance, the tax system.
Some middle ground solutions contributing to greater economic efficiency/equity and addressing affordability can be envisaged. These might include efficiency-oriented pricing with some form of cross-subsidisation, or selected subsidies and support measures for those who have justifiable needs.
Even if subsidies are maintained, economic analyses of the costs that different users impose upon the system are necessary. This allows for the making of more rational, transparent and democratically accountable decisions as to which users are subsidised and the reasons for this.
7.1.3 Environmental protection
Economic efficiency and water conservationEconomic theory suggests that if abstraction and pollution costs were internalised in water prices, then efficient pricing would lead to an efficient (economically optimal) level of use and protection of the environment. However: 1. There may always be a degree of
underestimation of the true value of the environment due to the limitations of economic valuation (section 4.2.2). Hence the real costs of abstraction or pollution and the benefits of conservation and pollution control may be underestimated. Prices will then be set at a lower rate than necessary.
2. “Optimal” resource use or pollution may still damage environments beyond what prudence, precaution or social criteria would suggest. Uncertainties about environmental effects and particularly about “irreversibility” suggest that higher prices, legal standards or direct controls may be desirable in some cases, exceeding what efficiency suggests.
Prices and water conservationCommon wisdom has it that linking price to use (i.e. metering) and increasing prices will reduce water consumption and hence contribute to environmental protection. There are different opinions, however, as to the extent of this influence. A comparative meta-analysis of 268 cases of reported price elasticity of urban water use (largely from the U.S. and Europe) has documented a wide variation from positive to negative values. An average of -0.43 (i.e. a 10% increase of the price of water, reducing water use by 4.3%) was documented (Dalhuisen et al, 2002).
A counterargument, however, is that in such studies it is difficult to isolate the effect of pricing on water demand from the influence of other variables (e.g. weather, habits, incomes, existing appliances, indoor vs. outdoor water uses, basic vs. luxurious uses) or the conditions accompanying the price change (e.g. a drought with a strong message to consumers to reduce water use). Although very high prices will certainly affect water use, water prices are generally affordable for the average household and price changes within reasonable ranges can only have a limited impact.
“How prices are used matters every bit as much as whether they are used” (Hanemann, 1998). Simply increasing prices may not achieve water savings and may have negative distributive consequences. The designing and targeting of tariffs based upon a detailed analysis of water demand and social characteristics is essential (incentive-based tariffs).
Figure 7.1 The full cost of water (Rogers et al, 2002)

82 83
Subsidies and environmental protectionA potential trade-off between efficiency and conservation objectives concerns the use of subsidies and market supports. Economic efficiency rejects subsidies and government interference in the market. A ban of subsidies for new waterworks may benefit conservation. On the other hand, the diffusion of new UWDM or water cycle technologies may require financial support and subsidisation (for research, development and implementation) and the provision of information to users (e.g. the labelling of efficient appliances). Environmental protection and equityExcess revenue may be generated by charging users the cost of environmental externalities that the utility itself is not paying for. A similar concern is that a utility may use conservation as a pretext (real or not) for increasing prices and hence revenues and profits. The regulatory system should ensure that rate increases are justifiable in terms of conservation objectives or agreed-upon improvements in service. Excess revenues could be directed to environmental conservation activities. An “abstraction charge” provides a tool whereby it is possible to recover the environmental cost from water charges without generating excess revenue for the utility.
Critical perspectivesThere are also some opposing views to the commonplace perception that metering and increased prices are good for the environment and conservation. According to these, the “commodification” of water acts against conservation objectives in the longer-term (Bakker, 2001). Linking utility revenue and profits to water consumption provides a systematic incentive against water conservation. Furthermore, the transformation of water users “from citizens to customers” reduces the sense of “common ownership” of a problem. In many cases of drought, citizens have been cooperative over and above strict economic sanctions, and have responded to calls to save water for the common good. As “customers”, they are expecting to get the service for which they pay and they might be much less willing to accept temporary emergency measures (such as rotating cuts, bans on particular uses, etc.). This critical perspective shifts the emphasis from pricing to more “communitarian” (educative, cooperative and persuasive) models for demand management.
7.1.4 Financial sustainability
Revenues from water charges are a main source of funding for the operations and investments of a water utility. Other sources include state subsidies (taxes), loans from banks or private investments. Revenue should in principle be sufficient to cover operational and capital expenditure. Loans and
private funds are to be repaid by revenues. The ability to borrow and the cost of capital also depend on stability and revenue prospects.
Trade-offs between the raising of revenue and other pricing objectivesThree potential trade-offs and conflicts with efficient or conservation-oriented pricing become apparent:1. Utilities would normally view price structures
that discourage water use with concern, as these weaken revenue prospects.
2. Tariffs that link revenue with water consumption (i.e. metered, volumetric tariffs) make revenue yields more uncertain and negatively influence the credit ratings of utilities. The largest segment of a water utility’s costs is fixed in the short-term and the safest way to ensure revenue stability is to solely raise revenues through a fixed charge (Dziegelewski et al, 1995). This was the rationale underpinning the non-metered, fixed water charges based on the recovery of accrued costs, prevalent in the past.
3. More complicated, differentiated and advanced price systems also entail a higher administrative cost, increasing operational costs for the utility.
Responses to trade-offsThere are some ways to circumvent these trade-offs. Properly designed pricing systems can offset revenue losses or increased administrative costs with cost savings in operations and deferred capital expenditures as an outcome of reduced water demand. This, however, requires a proper costing system that takes into account externalities and long-term costs. Utilities can also develop coping mechanisms, such as contingency funds, revenue tracking accounts, or rate adjustment mechanisms, that can reduce risk and increase flexibility in the management of a variable stream of revenues (Dziegelewski et al, 1995).
7.2 PRICING SYSTEMS
Box 7.1 summarises the key trade-offs that have to be addressed by any pricing system. Some trade-offs and conflicts may be difficult to overcome as they relate to different perspectives and “world views” (such as those of economic vs. social equity). Such differences too should be subject to reasonable analysis and a politicised debate of their advantages and disadvantages in relation to specific policy questions. Other differences may to a lesser or greater extent be reconcilable, via the careful design of the pricing system.
The term “system” is used deliberately to denote that pricing is not confined to the tariff and the rate
structure alone. Supporting schemes and broader policies can complement charges to boost the goals of efficiency, equity, conservation and revenue sufficiency.
A tariff is the system of procedures and elements that determines a customer’s total water bill. The parts of the bill measured in money or money/time units are called charges. Those measured in money/volume units are called rates (OECD, 1999). Box 7.2 presents the main components of a tariff.
7.2.1 Flat vs. volumetric tariffs
The introduction of meters and volumetric tariffs in cities, parts of cities or to specific users previously un-metered and charged on a flat basis, is a much-contested issue. In Mediterranean cities, un-metered supplies are rare. Nonetheless, such situations may arise in some urbanising settlements where supplies were not previously metered.
Advantages of volumetric tariffsVolumetric tariffs are a prerequisite for economic efficiency as only in this way can users face the incremental (marginal) cost of their demand.
BOX 7.1TRADE-OFFS IN WATER PRICING
Efficiency/conservation vs. financeEconomic efficiency and water saving require volumetric-based pricing. Linking revenue to consumption, however, increases the financial uncertainty of the utility and impacts negatively on its credit rating.
Efficiency vs. equityLong-term, incremental (marginal) cost pricing improves efficiency but may create unjustifiable revenue surpluses.
Efficiency/conservation/equity vs. administrative costsThe more complex the price system, the higher the administrative cost.
Efficiency/conservation vs. social equityRecovering a higher proportion of water costs through charges improves efficiency and provides stronger incentives to save water. Unless mitigated however, the cost of water for the poor may increase and water use may become unaffordable.
BOX 7.2THE COMPONENTS OF A TARIFF (OECD, 1999)
Flat tariffs, in place in cities where water use is not metered, basically consist of a connection fee and a fixed charge. Volumetric tariffs additionally include a volumetric rate.
The Connection charge is a “one-off” and normally “up-front” charge made for connecting a customer to the public urban water system.
A Fixed charge is a standard charge typically either equalised for each customer (e.g. within a given customer class or at a particular geographical location), or linked to another customer characteristic (e.g. the size of supply pipe or meter flow capacity, property value, the sum of water-using appliances, lot size, etc.). In flat tariffs it accounts for the whole cost. In volumetric tariffs it accounts merely for those “ongoing” customer costs that are not directly linked to the volumes of water used (such as meter maintenance and reading, billing, and collection costs).
Volumetric rate is a rate which multiplied by the volume of water consumed in a charging period, gives the volumetric charge for that period. Volumetric tariffs can be distinguished in uniform-rate versus block-rate tariffs, which include a block charge. Volumetric tariffs typically also include a minimum charge, usually imposed to protect the utility’s finances, which specifies that a certain minimum volume of the service will be paid for in each period whether or not that amount is consumed.
A block charge is defined by lower and upper volumes of consumption per charging level (with the exception of the highest block). Different volumetric rates are frequently attached to different blocks. If rates rise or fall consistently as more water is consumed, the schedules are referred to as increasing- or decreasing-block tariffs, respectively.

84 85
Linking consumption with charges is also necessary if price incentives are to be used to support water conservation.
Barriers to shifting from un-metered to metered suppliesInstalling meters where they didn’t previously exist carries a significant capital and operational (administrative) cost. Utilities may be unwilling to undertake such an investment. Funding schemes where the cost for metering installation is paid directly by the consumer via the water bill, are possible, but there might be public reaction against these extra charges if the need for metering is not widely shared by the community. Utilities with flat tariffs enjoy more stable revenues and may be reluctant to risk revenues and credit rating by shifting to volumetric charges.
The drawbacks of volumetric tariffsEven if volumetric tariffs have been designed to recover marginal costs, in practice, users will seldom face the actual marginal cost of their use because the number of individuals per meter varies. Each individual that is, may face less or more of the actual marginal cost s/he imposes on the system.
Social equity and affordability considerationsA shift from flat to volumetric tariffs has important redistributive consequences. Their incidence, however, cannot be universally stated. It depends on the allocative features of the previous (flat) and the new (volumetric) tariff. Fixed charges in flat tariffs are normally universal (the same for all users in the same class) or differentiated on the basis of proxy criteria for the level of consumption of the customer (e.g. type of house and number of appliances). In some cases, this differentiation may, deliberately or not, reflect income differences. This is the case if the flat charge is linked to proxy factors such as property value, tax category or family size criteria.
Shifting to volumetric tariffs need not lead to a universal increase in charges, unless costing has been changed too (e.g. recovering, through prices, a greater part of the cost of water). In the case of some costs, volumetric tariffs may increase the costs to some customers and decrease them for others. Volumetric tariffs do not, by definition, impact upon the poor, although in practice they often do. The incidence of costs depends on the consumption patterns of the users (before and after the introduction of the new tariffs) and the structure of the volumetric tariff.
A particular concern however, is that by linking consumption with price, poorer users may opt to reduce consumption, thus putting their health at risk. This is not possible with flat tariffs. With
proper design of the volumetric tariff and/or support for vulnerable groups, such impacts may be avoided and social differentiation taken into account.
In cases where the decision has been taken to move from flat, un-metered tariffs to volumetric ones, managing change may be even more important than the change itself. Not all outcomes and impacts can be studied and predicted beforehand. It is very important to carefully monitor impacts on specific social groups and to adapt to problems by modifying the price system (e.g. introducing disconnection moratoria; freezing bill increases for vulnerable groups). Users should also be adequately informed, with due notice, about the change, its implications, the required behavioural changes (i.e. using water more carefully) and the options available (e.g. retrofitting).
The implications for water conservationProponents of volumetric tariffs point to the advantages of economic incentives for wise water use. The proponents of flat tariffs question the real long-term impact of prices, emphasising the negative repercussions of the commodification of water and arguing for alternative approaches to demand management.
7.2.2 Uniform vs. increasing block rate tariffs
The advantages of increasing block rate tariffsThe process of increasing block rate tariffs can be designed so as to satisfy some important objectives (Hanemann, 1998):• The uppermost block of consumption can be
set to equal the marginal cost of water and give efficiency signals to consumers
• Water demand in the higher blocks is expected to be more malleable as it corresponds to non-essential uses. Charging higher users more highly will contribute to conservation
• A fixed charge and a minimum charge can reduce revenue risk to the utility
• Setting lower blocks below the marginal price neutralises possible unjustifiable revenue excess for the utility
• The establishment of a first, free or low-priced block for consumption corresponding to the meeting of basic needs (known also as a lifeline allowance) addresses affordability concerns (Herrington, 1997)
The limitations and drawbacks of increasing block rate tariffs1. A “customer” (household) might include more
than one individual. Depending on household size, each individual may face paying for more or less than the corresponding cost of his/her use. Incentives will be distorted as the consumption of larger households will tend
to be priced according to upper block rates, whereas smaller households (a growing trend in European Mediterranean cities; Chapter 2, Volume I) will be charged at lower block rates. Ideally, the allowance and the blocks should be geared to the number of people in each household but whether such an arrangement is feasible at a justifiable administrative cost remains questionable.
2. With a block tariff, the incentive to conserve declines the more people conserve.
3. Consumers may also deduce that by increasing consumption, they can extend the fixed charge and reduce the overall unit cost (Hanemann, 1998). Increasing block tariffs are complex and users often fail to understand them. These problems can be partially tackled, but not necessarily overcome via more informative water bills (with an added administrative cost for the utility).
4. The design of the blocks (“switch points” and price differentials) is crucial for conservation. Different water demand and climatic characteristics merit different designs. The necessary information (“demand analysis”), however, comes with a high administrative cost. Many utilities opt for a simpler approach in volumetric design where different blocks are determined on the basis of the distribution of (number of) bills vs. consumption. The uppermost block, for example, corresponds to the consumption of the top 5% of bills. Such blocks, however, might be ineffective in providing strong incentives to users.
5. If the range of distribution of consumption is too “narrow” (e.g. in a city for example, where the majority of the population have similar incomes and similar consumption patterns) there is less potential for differentiating between blocks so as to influence demand.
6. In a city where the majority of the population is poor, there will be limits to the cross-subsidisation of the lifeline allowance from the upper tiers. Put simply, the fewer the “rich”, the more each one of them will have to pay to subsidise the poor. Prices above certain levels may be unacceptable to the “rich”, who typically also have more political power and can influence political decisions. Furthermore, heavy use customers (e.g. industries, estate households, etc.) may be able to shift to the use of their own resources (groundwater, desalination) (Lee et al, 2001).
7. Lifeline allowances may secure a cheap minimum quantity of water for poor, small households (e.g. lone dwellers or pensioner couples) but will not benefit large households with many dependants (a characteristic of poorer families in Eastern and Southern Mediterranean cities). The higher volumetric charge for excess use will probably make
their relative position worse. A second-best alternative is to base the low-price allowance on the assumption of one adult plus number of children (or in addition, pensioners), the number of which can be verified by child (and pension) benefit entitlements (Herrington, 1997).
8. Users who are better-off will also benefit from a lifeline allowance. Nonetheless, this (small) loss in equity can be tolerated, as affordability and public health security are more important. There are also various criteria and schemes that can be applied (at an administrative cost) to identify users who can qualify for a lifeline allowance (see also below).
Lifeline allowances and cross-subsidies from richer, higher users to poorer users can also be challenged from an economic equity perspective. In some countries, the legal frameworks of competition may limit price discrimination above certain levels. Heavy users (e.g. industries) may also challenge legally unwarranted price differences for their tariffs or for the higher block categories.
The advantages of uniform volumetric rate tariffsAn alternative to an increasing block rate is a uniform volumetric rate approximating the marginal cost of new supply2. This has certain advantages over block tariffs:1. It is more easily grasped by the consumers and
entails lower administrative costs for the utility2. Conservation incentives do not differ for
small and multi-member households. The conservation incentive is crystal clear: the more one uses, the more proportionately one pays
The drawbacks of uniform volumetric rate tariffsSome potentially negative consequences need to be addressed, however:1. Excess revenue may be generated. If such
revenue can be accurately and objectively tracked and determined, its use could be limited to special funds (e.g. a conservation fund, a social fund to support poorer users or an environmental protection/restoration fund). This is often difficult, however. A solution through the tariff system is to lower the fixed charge to below the level required to recover fixed costs. This does not distort user decisions and allows the utility to balance cost with revenue. Reducing fixed charges however, increases revenue uncertainty and risk.
2. A uniform rate may create hardships for lower income groups among fixed income customers.
2 The information for uniform volumetric pricing and some of the criticism on increasing block rates draws from the personal communication of the author with Dr Gary Wolff, Principal Economist and Engineer, The Pacific Institute, Oakland, California.

86 87
Assuming that a system can be implemented to sufficiently identify users in need and can implement a separate tariff for them, this problem can be addressed by lowering the fixed portion of the bill so that the total bill is affordable. If necessary, the fixed portion of the bill can even be set to ‘go into the red’, i.e. a fixed credit is offered to offset volumetric charges.
Table 7.1 compares the three tariff options described above in relation to the four key goals of water pricing plus their administrative feasibility/cost.
7.2.3 Differentiated tariffs
In most cities, different tariffs are already in place for different types of users (domestic, commercial, industrial, public). These are based on a qualifying scheme, typically the size of the connection (meter).
In the same way, different tariffs can also be designed according to specific user characteristics (e.g. property value, family size, social benefits, etc.). Users in need may be identified by an accreditation scheme and charged accordingly. In Luxembourg, different volumetric rates apply, depending on the number of children in the household (OECD, 1999).
A main constraint for such schemes is administrative cost. This relates to the identification and verification of the users that qualify for each tariff.
Seasonal tariffsThere might also be scope for differentiating rates according to season (seasonal tariffs). Water use in Mediterranean urban coastal areas exhibits high seasonality due to climate and tourism. Pre-defined dry year tariffs may be automatically implemented in years of drought (as defined by
an objective scheme). Summer tariffs may be a very useful tool. These can range from simple arrangements, such as a premium fixed charge added to summertime bills, to the more advanced, e.g. a completely different tariff design for the summer months accounting for the different marginal costs of summer use or for different conservation objectives. Administrative costs are a factor to take into account in the above as two accounting and billing systems will be required.
Seasonal tariffs make sense in terms of efficiency and economic equity. Costs may be higher in some periods and lower in others. Peak summer demand requires costly infrastructure that is left unused during the rest of the year. Summer tariffs can make users face the marginal cost of their seasonal demand and will allocate extra costs to those responsible for them. This is economically more equitable than spreading them to all users all year round.
Seasonal tariffs can also contribute to conservation. Demand patterns and characteristics differ according to season (e.g. increased outdoor use in the summer). Special summer tariffs may be designed with the specificities of summer water use in mind.
Priority pricingThere have also been proposals for priority pricing in urban water services whereby customers are offered a choice of tariff depending on the reliability of the service (e.g. customers paying lower rates could face cuts in drought periods). This would, however, require clear mechanisms for defining levels of reliability and deciding when special conditions apply (Dziegelewski et al, 1995).
Different pricing systems can also be envisaged for supplies of differing quality (e.g. drinking water vs. recycled water). Such tariffs are necessary in order to promote the development of secondary supplies (Chapter 6).
7.2.4 Instruments addressing affordability3
There are two basic ways to address issues of water price affordability: income support measures and tariff-based measures (OECD, 2002).
Support measuresIncome support measures include:• welfare assistance and housing-related
allowances covering water charges and costs • other municipal “hardship funds” • water service vouchers and concession cards for
vulnerable groups
3 All information in this section is drawn from the OECD’s (2002) report “Social issues in the provision and pricing of water services”.
• tariff rebates and discounts for bills of predetermined amounts or for specific groups
• payment assistance in the form of easier payment plans, special loans and the cancellation of arrears
In assistance programmes, it is important to link the level of water-related assistance to changes in water charges as such changes are generally higher than inflation due to the recent trend for price reforms.
Legally banning disconnection can reduce the risk of public health impacts on poorer households. On the other hand, financially secure customers may also benefit and refrain from (or delay) paying. Unless coverage of the cost is guaranteed by the state, there is also a rising revenue risk for utilities. A reliable scheme is needed to identify those in true hardship and therefore genuinely unable to pay the bill.
There are also options other than universal disconnection moratoria, such as providing indebted customers with a period of grace (usually a few months) before proceeding with disconnection. Special repayment plans can be discussed and agreed during this period, and the real inability of the user to pay can be better appraised by the utility. Different disconnection arrangements with low-income users may also be defined in initial service contracts.
Social tariffsTariff-based measures basically consist of increasing block tariffs with a social or “lifeline” block and differentiated tariffs for special social groups (tariff choice or restricted tariffs). Cross-subsidies can emanate from other users (e.g. industry) or from other households. Cross-subsidies can also be more direct than in differential block rates.
An earmarked tax can be applied either to all users or to a certain class of users (the financially secure, the rich or the heavier consumers). Funds from this tax can then be directed to support specific actions for the poor. A “solidarity charge” that can be imposed on high bills with revenue used to finance the expansion of the water or sewage network to any poorer neighbourhoods that do not yet have full service coverage, has been proposed (Hall, 2001).
Other measuresTargeted subsidies to high cost areas or vulnerable groups are another potential tool, especially for managing transitional periods of price reform where costs may rise steeply and impacts remain unknown (OECD, 2002).
A less conventional tool is that of targeted water
FLAT RATE SLIDING SCALE VOLUMETRIC MCEfficiency 0
Lack of incentives for efficient use
++Links consumption with cost (higher block(s) can reflect marginal cost)But individual users will face less (if in small households) or more (if in large households) than real marginal cost of their use
+++Directly linked to marginal cost of supply
Socially-aware /equitable
+++Charges linked to proxy income criteria
++Can include social lifeline category But this may not benefit large families
+Higher costsBut can manage by adjusting fixed portion of payment (even making it go ‘into the red’ to reflect income criteria
Water saving +Lack of incentives But may foster voluntary cooperative spirit
++Higher costs for heavy users But: Incentives distorted for small vs. large householdsIncentive to conserve is reduced the more one conservesConsumers given the impression that fixed costs can be “spread” by consuming more
++The more one consumes the more one has to pay. (in proportion)
Funding +++Stable and predictable revenue
++Revenue uncertainty; can be managed by fixed charge/ support measuresPossibility of revenue excess; can be managed by setting some blocks lower than fixed costs and some higher (“break even”)
++Revenue uncertainty; can be managed by fixed charge/support measuresPossibility of revenue excess; can be managed by adjusting fixed charge to “break even”
Administrative +++Easy to administerNo need for meters/ metering costs
+Relatively more complex to administer
++Easy to administer once establishedBut: administrative burden of calculating marginal costs
Table 7.1 Comparing different tariff designs (based on Chapter 7 of the Volume II)
+++ = performs very well according to the criterion 0 = fails according to this criterion

88 89
demand management programmes in poorer areas (e.g. retrofits or rebates). A reduction of the bill in this way is not achieved through direct subsidy but by acting to reduce water use, thus also contributing to conservation objectives (OECD, 2002).
Considerations for support/social tariff programmesA scheme for the qualification and verification of the users that are to receive support is central to many of the aforementioned measures. The use of existing qualification schemes (such as social benefits) can reduce the administrative and monitoring burden for the utility. It must be ensured, however, that the criteria used by existing schemes sufficiently account for all populations facing hardship through an increase in the cost of water.
Many of the measures require that users themselves claim for benefits (e.g. for special tariffs or for supports). Some of the targeted users (especially the unemployed or the uneducated may be less able to acquaint themselves with the benefits they are entitled to, or have less time or capacity to claim them. Information and assistance programmes are this essential.
Qualification schemes, assistance and information programmes, arrangements and communication with those to be disconnected, etc. all have an important administrative cost. This comes on top of the cost of the support. An important issue is who bears these costs (users, utility or the state). Each of the alternative support measures as well as the various eligibility schemes distribute costs differently. Private utilities will be less keen on undertaking related costs unless they can ensure that they will be able to recover them from charges.
Utility policies that trade-off support to vulnerable groups with reduced administrative costs should be controlled. For example, “smart” payment systems (e.g. card or token-paying connections) have been used by some utilities for “bad customers” (i.e. disconnected users who have been reconnected). These reduce administrative costs related to delayed payment and disconnections. They raise social concerns however. An unknown number of users may opt to “disconnect voluntarily” by not renewing their card. Disconnection moratoria will also be ineffective if cards are being used.
Some form of corporate accountability and social reporting can provide a voluntary impetus to utilities to adopt socially-responsible policies. It is advisable, however, to clearly define responsibilities regarding regulation and/or contract between utility and the state.
7.2.5 Wastewater and stormwater pricing
CostingPricing to control pollution has few different characteristics to pricing for water use. Full and marginal cost principles still apply. In theory environmental costs should be computed in terms of damage caused to recipient waters. A more pragmatic approach is to consider them as included in the capital and operational cost necessary for the legally mandated level of treatment although this might not tally with the actual level of damage caused by untreated wastewater (Lee et al, 2001).
Wastewater pricingWastewater management and treatment costs can be recovered either through local taxation or as an add-on to the tariff (fixed charge/tax or incorporated into the volumetric rates). Differences between the composition of the wastewater produced by different households (and hence costs imposed on the system) are expected to be small. The quantity of water used can provide a good proxy both for the amount of sewage produced and for operational and capital expenditures brought to bear on the system. However, the greater the outdoor water use, the weaker the accuracy of this approximation. The additional administrative cost of a more differentiated system does not appear to be justified neither in terms of efficiency gains nor incentives provided (Herrington, 1997).
This is not the case for industrial waste though, where pollutant loads and treatment requirements may vary considerably between industries. There is more scope for explicit and differentiated tariffs related to type of discharge reflecting the additional costs posed on the system (e.g. for handling of unconventional waste or for upgrading the treatment process). Such effluent charges are necessary to provide incentives to industries to shift to their own local treatment before they dispose of their waste into the central network.
Stormwater pricingThe recovery and pricing of stormwater costs depends on the type of system (separate or combined) and whether this duty forms part of the remit of the water utility or of another public agency. In the case of a separate public system, taxation is the most straightforward option. If this taxation is collected through housing or new construction taxes, the tax can be linked to the type of the development and provide incentives for more water-sensitive designs.
In the case of a combined or utility-managed drainage system, stormwater capital and operational costs can be part of the overall
utility costing and tariff system (fixed charge or incorporated in the volumetric rates). The connection charge is a possible instrument through which to recover stormwater costs. Economic equity can be enhanced by linking this to the surface covered by the development as a proxy indicator of the related surface drained of rainwater. The low level and one-off character of the connection charge, however, will provide limited incentives for more sensitive designs or subsequent retrofits.
These could be better promoted by a separate fixed drainage charge included in the water bill. Potentially this can be linked to proxies of the surface drained. A practical incentive-based approach would consider discounts or even an abolition of the charge contingent upon the design of a new development or stormwater retrofits (e.g. rainwater harvesting, the reduction of impermeable surface, etc.). The administrative costs of collecting and verifying information about surface coverage may be an important barrier to the implementation of advanced, stormwater tariffs.
7.2.6 Abstraction charging
Urban water utilities are themselves water users. Their use has an external cost to the environment from which water is abstracted or which has to be modified (e.g. by dams) and an opportunity cost on other users that could make use of the water resources. Efficiency, equity and conservation considerations suggest that utilities should account for this cost of their use. An abstraction charge for urban water utilities should be part of a broader charging scheme for river basin users (including agricultural and industrial ones). In EU Mediterranean countries, progress towards a more representative allocation of costs among water users is mandatory under the Water Framework Directive.
Abstraction charges can apply either to capacity (based on the allowed capacity through a permit) or to actual use, which requires metering and monitoring. Capacity systems are more common as they are easier to administer. Criteria to determine the level of the charge depend on proxies for the costs imposed.
Actual use systems are less common. They can provide an incentive to the utility to better manage its water supplies. For example reducing leakage will have the added benefit of reduced costs for raw water charges. To provide efficiency signals, an actual use price regime should take into account long-term externalities and also distinguish actual consumption from return flows with due consideration for the quality of water returned
to the system. These costs might be difficult to compute.
Abstraction charges can be used to recover environmental costs or to impose environmental (green) taxes on water consumption. Since environmental costs are difficult to evaluate, a more pragmatic approach is to recover the costs of specific environmental investments from charges, e.g. to fund an environmental or river basin agency or plan. In England and Wales, abstraction charges partially account for the operational costs of the Environment Agency.
The destination of the revenue collected from abstraction charges is a delicate issue, all the more so because water is a natural monopoly. If revenue accrues to the public purse, then water charges can be used, in effect, to subsidise other governmental expenses. Such subsidies are rejected a priori from an economic efficiency/equity perspective. From a social equity perspective, their acceptance depends on the destination of the funds and whether they contribute to the reduction of social and income disparities. Whatever the case, it is advisable that such transfers as do take place are transparent. Generally, the funding of specific activities (as in the Environment Agency example) is a preferable option.
7.2.7 The Tariff-setting Process
Price reform is difficult. Water pricing is a socially “loaded” issue and rightly so. Water is an essential public and economic good and changes in its pricing have important redistributive and environmental implications. Several parties are formally or informally (i.e. through pressure) involved in the rate setting process. These parties assign different weights to various criteria and hence envisage different balances in the trade-offs involved. These differences render the process of water tariffs an inherently political process.
Perceived unfairness is a main barrier to water price reforms. In many cases, policy debate is restricted to the two “evils” of no change vs. bad change. Justice in the process is as important as justice in the final outcome. Understandable, open and transparent water price-setting processes, with the participation of the public, are a safeguard for their later acceptance.
A basic requirement is a clearly defined regulatory framework for the process and defined criteria for the determination of prices. The basic requirements for economic regulation were presented in Chapter 3.
The process should be as open as possible with the adequate representation of stakeholders involved

90 91
through public hearings, citizen committees and related participatory processes (also see following chapter). The relative leverage of each party in the process is decisive for the final outcome. Processes in which one ministry or the water utility itself set the tariffs are inadequate. Box 7.3 presents an
example of an effective participatory process in the tariff-making procedure from California, U.S. Conditions in many Mediterranean cities may not be sufficiently mature for commitment to such a demanding participatory process (for example, holding 75 meetings and several public hearings).
Nonetheless, the Blue Ribbon case should be seen as an ideal “blueprint”; at least its basic philosophy and selected elements can be transferred to Mediterranean cities.
7.3 GUIDANCE ON THE APPROPRIATE PRICING OF URBAN WATER SERVICES
This chapter has demonstrated that urban water pricing is a very complex endeavour. Economic theory ideals point to useful directions in terms of economic efficiency but it may be impossible or too costly to apply them in full and may partially conflict with environmental goals or socially shared notions of what’s “fair”. It is important to work and develop proper multi-dimensional pricing systems that express explicit and acceptable choices on the various economic, social and environmental objectives and trade-offs. Pricing systems in most Mediterranean coastal cities are far from this goal. They are typically derived from past average costs (embedded cost approach), a significant portion of which have been subsidised. Environmental and future costs are not taken into account. Users are typically priced with volumetric tariffs, designed however without specific conservation goals in mind. Social considerations are maintained by keeping water prices low, but this benefits luxury or wasteful users too. The recent tendency to remove subsidies and increase prices, on the other hand, without due consideration for social impacts, threatens long-established social achievements.
Bearing in mind the complexity and trade-offs involved, and the specificity of the local context, some general guidelines for a proper reform of urban water prices in Mediterranean coastal urban areas can be stated:• Prices should be determined on the basis of
forward-looking (long-term), incremental costs• Costs external to the utility should be
accounted for in the prices (especially those related to environmental damage). Urban water utilities should themselves be subject to a river basin charging system, preferably based on actual use
• General subsidies of new infrastructure or of the price of water should be banned. Targeted subsidies of specific functions or uses can be implemented where deemed necessary on social or environmental grounds, after an explicit and transparent justification
• Tariffs should be designed so as to promote specific conservation goals
• Revenue from prices, together with other sources of funding, should ensure the economic sustainability of the water utility. Revenue should be tracked to avoid excesses not linked to efficiency improvements or directed to specific
investments. Reasonable administrative costs related to more advanced price systems may need to be taken up and recovered by prices
• There should be explicit measures and mechanisms to ensure affordability of water charges for low-income groups
• Prices should distribute the various costs between users in a way judged as fair by society. Economic efficiency is an important but by no means the only criterion upon which to base this allocation
• Differentiated tariffs for different types of users, different seasons of the year or different types of supplies should be used where they can contribute to efficiency, equity or conservation objectives
• The design of tariffs should be based on a thorough analysis of the characteristics and determinants of water demand in the city, with distinct user groups identified as accurately as possible
• The setting of tariffs should respect a process explicitly described in legislation. This process should be transparent, open to interested parties and based on participatory decision-making
• Water charges and bills should be clear and understandable. Price reforms should be communicated to the public with due notice. Impacts should be monitored and the transition period managed with care
BOX 7.3RATE SETTING BY THE BLUE RIBBON COMMITTEE OF LOS ANGELES (Wong, 1999)
In the summer of 1991 and after an intense drought crisis, Mayor Tom Bradley of Los Angeles appointed the “Blue Ribbon Committee on Water Rates” in response to a city council proviso. The Committee’s mandate was to learn about rate design and supply and demand factors, decide on the principles to guide rate design for the next decade and assist in the initial implementation of the rate structure. The committee was composed of 12 citizen members with voting rights and 12 non-voting members from the Department of Water and Power (DWP), the Mayor’s Office and the City Council. Citizen members were identified by the mayor’s office as representatives of groups impacted by water prices and included homeowners, tenants, landlords, the business community, the academic community, organised labour, developers, environmentalists, ethnic groups and neighbourhoods groups. Subcommittees reporting to the larger group for consideration were set up on “finance”, “economic growth and development”, “conservation and water recycling”, “equity” and “public participation”. The whole process was coordinated by a consultant responsible for collecting and analysing scientific information and facilitating meetings and decisions. A Technical Advisory Panel was established to provide guidance to the consultant on how to explore different designs to water rates.
The committee held over 75 meetings. Some lasted all day, others well into the evening. The process started with an education of the participants on water rates and water management issues. Experts and representatives from other cities were invited to testify on rate structures. Open public meetings and hearings were also held allowing a broader participation of the interested public. Meetings were held at three stages: the beginning of the process, after the first draft of recommendations and following the final proposed decision. Public meeting provided two-way feedback: from the public to the committee and from the committee informing the public and addressing concerns. Issues raised in the public meetings were reviewed and additional public meetings held on controversial issues.
The Committee proposed replacing the system of fixed and per unit charges with a two tiered volumetric structure (all fixed charges removed). The lower block aimed to secure a minimum quantity of water at a reasonable rate and to meet revenue requirements of the utility maintaining a revenue neutral structure. The second block was set equal to the marginal cost of obtaining and delivering the next big unit of water for the city. Seasonal changes were foreseen for the second block as well changes in the break point in water-short years. Following recommendations made in the public hearings, it was decided to follow a more sensitive approach to setting the range of the lower block: 12 groupings of customers were identified based on four categories of lot and household size and three climate (temperature) categories; different break points were to apply to each. In addition the Committee recommended 24 changes in water policies or practices not directly related to the rate structure.
After the public hearings, the Mayor approved and implemented the new tariffs. These have achieved water savings, a security of affordability unparalleled in other cities (especially for multi-family dwellings) and were accepted without much reaction. Furthermore, the process had broader repercussions for the functioning of the DWP and its interaction and cooperation with communities. On the other hand, the new structure was also criticised as over accommodating to the interests of heavy users with large lot sizes (see: differentiation of groups for lower block). This however was an outcome of the participatory process. The public hearing in San Fernando Valley, a heartland of estate owners and farmers, was the most heavily attended and intense. Residents of the Valley complained that the first proposal was discriminating against large lot owners and those living in warmer climates. They managed to reflect their concerns in the final rate structure.

93
8.1 THE JUSTIFICATION FOR PUBLIC PARTICIPATION
There is a growing trend in favour of the participation of the public in environmental decision-making, including the management of water resources and the planning of urban areas. There are several reasons for this (Box 8.1).
The goals of a participatory process include (in a scale of increasing ambition):• the raising of public awareness and educating
the participants on the pertinent issue• learning from participants and from their local
knowledge and improving the quality of the decision
• allowing marginalized voices to be heard and enhancing mutual understanding between the participants
• reaching consensus, or some sort of agreement • reducing conflict and delays further along the
decision-making and policy implementation path • empowering the local community to take action
8.2 DEGREES OF PARTICIPATION
The term “participation” refers to the involvement of people in decision processes. The degree of involvement and the extent of inclusion, however, may vary considerably (Figure 8.1).
8. PUBLIC PARTICIPATIONThis chapter examines processes and tools for public participation in urban water planning. It starts by justifying the need for public participation. There follows a definition of the concept and a distinction between different degrees of public involvement. After this, participation is related to the specific tasks of IWSMCA. A generic process for public participation is then presented followed by a presentation and appraisal of the main participatory methods. The chapter concludes with a discussion of the key issues and problems surrounding participation while the basic principles for a successful participatory process are identified.
BOX 8.1SOME REASONS FOR THE GROWING INTEREST IN PARTICIPATORY PROCESSES (after Pimbert and Wakeford, 2001)
Weaknesses of representative democracyThe “retreat of the state” when confronted by market forces has created a “governance void”. Groups of people, especially the underprivileged, feel excluded from decisions that affect their lives. The decisions of distant governments often fail to convey the wills of local peoples. Deliberative democracy is thought of as able to enhance democratic accountability, justice and the empowerment of people.
Scientific uncertainty and complexityEnvironmental problems (including water resource-related ones) are very complex, with uncertain dynamics, outcomes and accompanying risks. Experts are seen as no better equipped to decide on questions of values, interests or acceptable levels of risk than any other group of citizens. Additionally, some notable failures of scientists to foresee crises and a number of scientific controversies where experts came up with very different opinions have diminished public trust in the supremacy of professional expertise and
science. There is also a growing public suspicion of links between the state and scientific expertise, and pressure for the democratisation of decisions and the use of science.
Ineffectiveness in policy implementationCentralised, top-down environmental policies often fail to deliver. Participatory decision processes have the potential to improve the quality of decision-making by tapping into local knowledge and reducing conflicts at the design stage, increasing the likelihood that policy implementation will be more legitimate, effective, efficient and sustainable.
Conflicts The exclusion of groups of the population from decisions, and especially those who face their consequences, leads to conflicts further along in the implementation process. A participatory process can ease these tensions by striving for consensual decisions at an early stage.
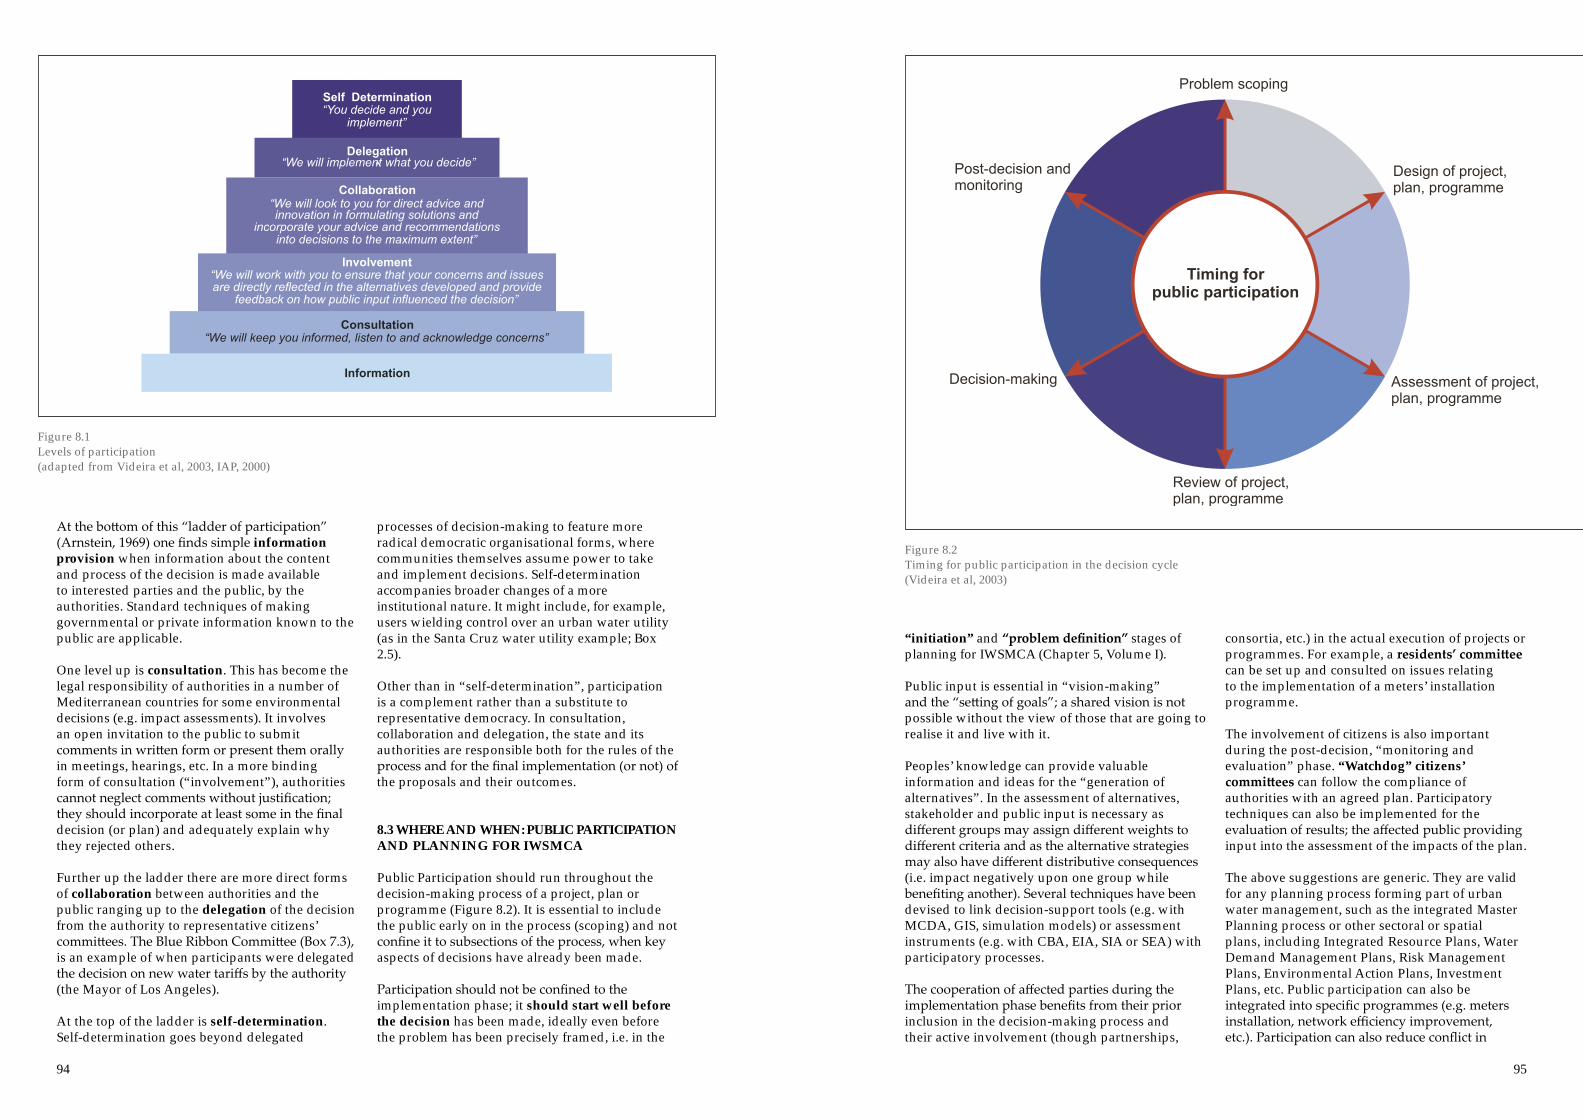
94 95
At the bottom of this “ladder of participation” (Arnstein, 1969) one finds simple information provision when information about the content and process of the decision is made available to interested parties and the public, by the authorities. Standard techniques of making governmental or private information known to the public are applicable.
One level up is consultation. This has become the legal responsibility of authorities in a number of Mediterranean countries for some environmental decisions (e.g. impact assessments). It involves an open invitation to the public to submit comments in written form or present them orally in meetings, hearings, etc. In a more binding form of consultation (“involvement”), authorities cannot neglect comments without justification; they should incorporate at least some in the final decision (or plan) and adequately explain why they rejected others.
Further up the ladder there are more direct forms of collaboration between authorities and the public ranging up to the delegation of the decision from the authority to representative citizens’ committees. The Blue Ribbon Committee (Box 7.3), is an example of when participants were delegated the decision on new water tariffs by the authority (the Mayor of Los Angeles).
At the top of the ladder is self-determination. Self-determination goes beyond delegated
processes of decision-making to feature more radical democratic organisational forms, where communities themselves assume power to take and implement decisions. Self-determination accompanies broader changes of a more institutional nature. It might include, for example, users wielding control over an urban water utility (as in the Santa Cruz water utility example; Box 2.5).
Other than in “self-determination”, participation is a complement rather than a substitute to representative democracy. In consultation, collaboration and delegation, the state and its authorities are responsible both for the rules of the process and for the final implementation (or not) of the proposals and their outcomes.
8.3 WHERE AND WHEN: PUBLIC PARTICIPATION AND PLANNING FOR IWSMCA
Public Participation should run throughout the decision-making process of a project, plan or programme (Figure 8.2). It is essential to include the public early on in the process (scoping) and not confine it to subsections of the process, when key aspects of decisions have already been made.
Participation should not be confined to the implementation phase; it should start well before the decision has been made, ideally even before the problem has been precisely framed, i.e. in the
“initiation” and “problem definition” stages of planning for IWSMCA (Chapter 5, Volume I).
Public input is essential in “vision-making” and the “setting of goals”; a shared vision is not possible without the view of those that are going to realise it and live with it.
Peoples’ knowledge can provide valuable information and ideas for the “generation of alternatives”. In the assessment of alternatives, stakeholder and public input is necessary as different groups may assign different weights to different criteria and as the alternative strategies may also have different distributive consequences (i.e. impact negatively upon one group while benefiting another). Several techniques have been devised to link decision-support tools (e.g. with MCDA, GIS, simulation models) or assessment instruments (e.g. with CBA, EIA, SIA or SEA) with participatory processes.
The cooperation of affected parties during the implementation phase benefits from their prior inclusion in the decision-making process and their active involvement (though partnerships,
consortia, etc.) in the actual execution of projects or programmes. For example, a residents’ committee can be set up and consulted on issues relating to the implementation of a meters’ installation programme.
The involvement of citizens is also important during the post-decision, “monitoring and evaluation” phase. “Watchdog” citizens’ committees can follow the compliance of authorities with an agreed plan. Participatory techniques can also be implemented for the evaluation of results; the affected public providing input into the assessment of the impacts of the plan.
The above suggestions are generic. They are valid for any planning process forming part of urban water management, such as the integrated Master Planning process or other sectoral or spatial plans, including Integrated Resource Plans, Water Demand Management Plans, Risk Management Plans, Environmental Action Plans, Investment Plans, etc. Public participation can also be integrated into specific programmes (e.g. meters installation, network efficiency improvement, etc.). Participation can also reduce conflict in
Figure 8.1 Levels of participation (adapted from Videira et al, 2003, IAP, 2000)
Figure 8.2 Timing for public participation in the decision cycle (Videira et al, 2003)
96 97
contentious decisions (such as the authorisation of new abstractions or hydraulic projects, the approval of environmental impact assessments, decisions on quality standards and levels of treatment/monitoring, design of new tariffs, etc.).
It is advisable to set up an overall, permanent organisational structure for participation in the urban water sector (e.g. a Citizens or User Advisory Committee or Forum) and implement participatory processes at the Master Planning level. This will economise on effort; new committees, processes and tools will not have to be devised every time participation for a sub-decision is needed.
8.4 ORGANISING A PARTICIPATORY PROCESS
Box 8.2 presents some general steps for the organisation of a participatory process. The sequence is not rigid. Many steps feed into each other and may be developed more or less in parallel. Clarifying the goals of the participatory process is essential as it determines the subsequent selection of process, technique and participants.
Defining participation goals and the desired impactA first key decision is whether the process aims for information, consultation, or even, self-determination and empowerment. The specific goals may depend on the nature of the decision and the stage of the planning process. In the initial planning stages, the education and information of the public will be more important. In the mid stages, learning from the participants about alternatives and important criteria is more critical. In the assessment stage, reaching a final decision with consensus may be the goal, whereas in the implementation phase, the reductions of conflict or empowerment become key goals.
A successful participatory process will not be based on a one-off event but on a well-sequenced process of events. It is generally advisable that each participatory event (e.g. a hearing or a workshop) avoids combining several participatory goals. Each event should focus on a specific goal (e.g. the education of participants at an early stage and dialogue and consensus later on).
A participatory process should be clear from the outset about its goals and expectations. Creating expectations that are not fulfilled leads to a lack of public trust in future participatory processes. These goals should be seen in relation to the broader policy process in which the participation will fit and impact. Linking the participatory process to critical decisions is important if participants are to believe in the value of the exercise. Different parties may have different expectations of the participatory process. Decision-makers may want a decision to be taken quickly, proponents of a controversial project to convince the opposition, and marginalised actors to have the time and space to express their point of view. It is the role of organisers to decide which goals are to be served, to clarify them for participants and to design the process accordingly.
Selecting participation techniquesA technique should then be selected as a “platform” for the participatory process. An inventory of available techniques is presented in the next section. Different techniques (or different designs of a technique) may be more or less suited to achieving certain participation goals. More than one techniques may be combined in a longer participatory process running throughout the planning/decision cycle. Standard methodologies should be adapted to local circumstances and the specific features and goals of the participatory process.
Recruiting participantsSelecting the participants is a key task. In an ideal inclusive process “all whose interests will be affected ought to have the opportunity to take part, and all citizens feel that their interests are being properly represented even if they do not choose to become involved themselves” (Bloomfield et al, 1998). But this is much easier said than done. In practice, there are a few generic selection procedures (Box 8.3).
The selection of participants depends on the purposes of the exercise and the technique used.
For example, adequate representation may not be that important if the goal is education. It will be crucial, however, if the goal is to reach a consensual decision. The inclusion of powerful, marginalised or reacting voices will be important if the goal is to reduce conflict. Certain methods can work with an open number of participants but others face constraints. A poll/referendum can target the whole population, but a workshop may not exceed 80 participants for practical purposes. If there is a limit on the number of participants, self-identification is ruled out.
BOX 8.2THE ORGANISATION OF A PARTICIPATORY PROCESS (adapted from IEMA, 2002)
1. Clarification of the purpose of the participation process and recognition of the issues that may arise
2. Identification of the aims, objectives and expectations from the process, on the part of both the organisers and participants
3. A consideration of the decision-making process in which participants contribute and the determination of the timescale for participation
4. The selection of an appropriate procedural technique (or techniques) and the design of specific applications
5. The identification of potential participants6. The identification of needs in terms of resources
and staff (training of existing staff or external expertise)
7. Planning how the results of participation will be analysed and used
8. The determination of evaluation criteria and processes upon which to review the success of the process
9. The actual implementation of the process and event(s)
10. Evaluation and reporting
BOX 8.3PARTICIPANT SELECTION PROCEDURES FOR A DELIBERATIVE DECISION PROCESS (adapted from Holmes and Scoones, 2000)
Open invitation – “self-identification”The event is advertised through the mass media and individuals or groups can come forward and declare an interest in being included in the process.
The identification and selection of stakeholdersThe objective is to “get a representation of the whole system into the room”. This means that in principle participants will not be able to appeal to anybody absent for the implementation of the decision. Stakeholders can be identified by analysts systematically studying the issue (“stakeholder analysis”) through interviews, brainstorming meetings with organisers, analysis of literature on the subject, etc. or by “third party identification” (i.e. the initially-selected stakeholders indicting others that should be included in the process). Box 8.4 indicates the basic groups of stakeholders identified by the EU Working Group for Public Participation in river basin planning.
Random selectionThe random (jury-like) selection of a group from the whole population.
Criteria-based random selectionRandom selection of a group from the population upon predefined representative criteria (e.g. gender, age, income group, profession, etc.).
CombinationsCombinations of the above generic selection procedures are possible. Respondents to an open invitation, for example, may be screened according to certain criteria or be limited to individuals representing constituencies (stakeholders). Stakeholder selection may be balanced according to gender, age, inclusiveness or other criteria and a limited number of places may be maintained for self-invited participants on a first come first served basis.
BOX 8.4TYPOLOGY OF POSSIBLE STAKEHOLDERS INVOLVED IN WATER MANAGEMENT (COMEC, 2002)
Professionals: public and private sector organisations, professional voluntary groups and professional NGOs (social, economic and environmental), statutory agencies, conservation groups, business, industry, insurance groups and academia.
Authorities: government departments, statutory agencies, municipalities, local authorities
Local groups and non-professional organised entities: communities centred on place (residents associations, local councils, etc.) and communities centred on interest (farmers’ groups, fishermen, birdwatchers, etc.)
Individual citizens, farmers and companies representing themselves: key individuals such as landowners, vocal individual residents.

98 99
An advanced participatory process can combine more than one method with more than one selection procedure. For example, in the Blue Ribbon case (Box 7.3), there was both a committee of representative stakeholders with voting privileges selected by the municipality, and open public hearings with voluntary self- participation.
Human resourcesThe proper planning and execution by the organisers of the actual event(s) (resources, staff expertise, location and facilities, mode of
facilitation) is essential to its success and for committing participants to the process. A neutral, professional facilitator (or team of facilitators) is necessary for an effective event.
EvaluationAn evaluation of the process or of separate events is crucial in order to assess impact and added value and to learn in order to improve future processes. Evaluation should appraise:
1. The achievement of goals set before the process (e.g. education, whether a decision was reached etc.)
2. The quality of the process (organisation, inclusiveness, etc.)
Goals will differ from case to case. Box 8.5 provides some indicative criteria for the evaluation of the process, which should be adapted to the specificities of the case.
The evaluation of the results should be done by the organisers. Some results, however, may be superficial (e.g. an agreement may mask unresolved differences). Some goals may also not be easily quantified by the organisers alone (e.g. the extent to which participants were informed). Questionnaires and interviews of the participants can help in assessing these dimensions.
8.5 TECHNIQUES
8.5.1 Information and consultation
Information provision and the enhancement of public awareness is an important first step in engaging people in decisions. Relevant techniques include (IEMA, 2002): • leaflets and brochures • newsletters • manned or unmanned stands or displays • advertising or other presentations in public
spaces • newspapers, radio, television • the dissemination of audiovisual material • organised site visits • information made available on the internet and
at public meetings
Obtaining information from the public is a (low rung in the “ladder” of public involvement) route to incorporating some public opinions into policies and decisions. Relevant tools include (IEMA, 2002, COSLA, 2002): • staffed/manned telephone lines for receiving
comments • interactive internet pages • surveys and opinion polls • interviews with selected stakeholders or with
random samples of the population and with focus groups
These are well-established market research techniques. They have been used by some advanced water utilities, though only for service-related purposes (e.g. telephone lines for complaints, service satisfaction surveys). They can be extended to serve more general consultation purposes.
8.5.2 Platforms for participatory processes
There are several platforms for consultation or deliberation processes. These platforms (e.g. an open meeting) may also be used to fulfil the purposes of informing and obtaining information from the public.
Public hearings are a widely used method in consultation. They consist of formal meetings with scheduled presentations offered. The process usually starts with the presentation of the full set of project components to the public and the provision of a forum for answering all questions and collecting/defending opinions (COMEC, 2002).
A public inquiry is a more formal legal process. An investigator (preferably with a legal and scientific background) conducts a hearing that is open to the public to which s/he invites “witnesses” on a contentious issue (e.g. the approval of construction of a new dam). The investigator then issues a report justifying their final proposal. This proposal might be formally binding, upturned only by a high-level veto. A public inquiry is not participatory since the direct involvement of the public is limited. It can be more legitimate, however, because it can be linked to a formal, judicial system, and is more effective when critical decisions need to be taken quickly.
Advisory committees are typically small member groups of representative stakeholders, with a statutory or informal role in making proposals for a specific issue or in monitoring the implementation of a decision or a policy. A User’s or Resident’s committee for example, can be set up to monitor the performance of an urban water utility with respect to performance indicators. The Committee can also assume a more active role in making proposals for specific policy issue (e.g. the Blue Ribbon Committee on water tariffs). Depending on the desired degree of involvement, less or more power may be given to the Committee (e.g. it can range from simple advice, to powers in approving urban water or investment plans).
Citizens’ panels or forums typically include more members than do committees. A “standing citizen’s panel”, for example, can include 100-200 citizens who meet on a regular (monthly) basis to act as a sounding board for an issue of concern (e.g. the implementation of an urban water master plan, supply reliability, cost of water, etc.). “User panels” have been extensively used in the utilities sector. These may consist of 50 to over 750 people who are provided with information and then reconvene in smaller groups or forums (potentially divided upon some common characteristic of the participants, e.g. young people, landowners, etc.) to discuss an issue or assess a policy (orally in
BOX 8.5QUESTIONS FOR EVALUATING THE PERFORMANCE OF PARTICIPATORY PROCESSES (IEMA, 2002)
Was the participation programme inclusive?• Did the process include a wide range of
participants representative of interested and affected parties and individuals?
• Were adequate resources provided to allow a range of individuals to participate?
• Were meetings and events arranged at times and venues most convenient for participants?
Was the means of communication appropriate for all interested and affected participants?• Was non-technical language used?• Was information translated into appropriate
languages and transcribed into appropriate formats?
• Was every participant provided with equal access to documents, sources of information etc?
Was the process open and transparent?• Were the aims and objectives of the
participation programme clear and agreed upon by all participants?
• Were the expected inputs to and outputs from the process clear?
• Were the limitations on the participation programme made clear?
• Was the process and its outcome well publicised?• Was the agenda for discussion agreed upon
with the participants?
Was the process interactive?• Did techniques for participation allow all
participants to both contribute and receive information?
• Was small group discussion and debate promoted?
• Were techniques used that allowed participants time to understand documents and information enabling them to take part in the discussion more effectively?
Was the timing of the participation programme appropriate?• Did participation begin at the earliest possible
opportunity?• Were opportunities for participation provided
throughout the decision-making process?• Was there sufficient time for the discussion of
issues and for responses to be made?
Was the participation process relevant to the decision-making process?• Was the mechanism for participation relevant to
the objectives of all participants?• Was all the information provided relevant,
accurate and up to date?
Was the process credible?• Were values and concerns elicited as well as
information being provided?• Was the participation process constructive?• Were opportunities provided for disagreements
to be aired and resolved as far as possible?• Was evidence provided of how concerns have
been dealt with?• Was peer review and independent verification
of data and knowledge promoted?• Were all the participants given an equal
opportunity to voice their concerns?• Were all issues of genuine concern responded
to?• Were participants satisfied with the way the
results were used in the process?
Did the proponent and decision-maker respond to the participation process?• Did participation inform and influence the
proposed activity and decision-making process?

100 101
group work or with the use of questionnaires). Panels and forums can be linked to environmental or social impact assessment processes (Stauth et al, 1993; Becker et al, 2003).
Workshops may include larger numbers of participants, up to one hundred plus. Work is divided into smaller manageable groups where facilitated discussion takes place, reconvening in plenary sessions where a synthesis of group inputs is conducted. Workshops may also include additional tools such as presentations or displays. A workshop requires experienced and skilled facilitators, especially for the synthesis of group work and diverse perspectives in the plenary sessions (Videira et al, 2003).
8.5.3 Deliberative Inclusion Processes (DIPs)
Deliberative processes are those in which there is social interaction, discussion and debate (in the form of verbal rather than written expression), different views are respected and decisions are reached based on negotiation (Holmes and Scoones, 2000). Kallis et al (2004) provide guidance on how to use deliberative processes for decision-making in water resource planning.
There are several standard techniques for organising and facilitating deliberative proceedings among smaller groups (e.g. committees or small panels) or in larger workshop-type events (panels, forums, hearings). Group facilitation techniques can be used for creative purposes (generating new ideas and solutions) as well as for mediation and negotiation and the building of sustainable agreements (Kaner, 1996). A group is manageable with a maximum 8-10 people. Group facilitation builds on a two-tier logic (often corresponding to respective days of a two-day meeting): the first is devoted to “divergence”, where all ideas are freely debated opening up the spectrum of solutions. The second focuses on “convergence”; participants are helped with specific techniques (including voting) to conclude on a specific plan/decision.
Conflict resolution processes usually include a group of representatives of conflicting interests coordinated by an experienced facilitator. The process follows a sequence of identifying the problem and relevant data, identifying alternative, innovative solutions that reduce conflict and then planning for implementation.
Consensus building processes are somewhat similar, only the process follows a more open flow, with ideas and suggestions first listed (e.g. in a flip chart), discussed, voted on and then debated in order to reach consensus.
There are also several more structured methods and techniques for organising and running group or committee meetings and negotiations, panel or forum workshops and hearings. These DIPs are based on formal and tested methodological processes based on theoretical foundations and often linked to decision-support systems or assessment procedures. There are several basic techniques and hundreds of variations and combinations. There is some confusion with terminology; practitioners often use different names for marginally different techniques. There is also a relative lack of cross-referencing between works in similar strands because they occur in different disciplines or policy spheres. An exhaustive presentation of all techniques is impossible. The interested reader should refer to IPPR, 1999, COSLA, 2002 or van Asselt Marjolein and Rijkens-Klomp, 2002. Only the most important types of techniques are presented here.
A citizen’s jury is a group of citizens brought together to consider a particular issue or confrontational decision (COSLA, 2002). The jury is chosen at random from the local population (as in normal court juries) with or without certain representation social profile criteria (e.g. gender, age, income). After the agreement of the jury, expert witnesses are invited to provide evidence. Cross-questioning can occur. The more sessions (and thus the longer the process), the more time there is for the jury to assimilate facts and reach a more informed decision. Typical events last up to four days, at the end of which a report is drawn up setting out the views of the jury, including differences of opinion. Citizens’ juries have been typically used as consultative bodies, but they could be also used as delegated decision-making bodies (with voting on contentious decisions), potentially in conjunction with public inquiry processes.
A consensus conference is very similar to a citizen’s jury. A panel of 10-20 volunteers convenes after advertisements have been posted, and briefed in two weekend sessions on the issue under consideration. The panel identifies the questions to be asked to experts/witnesses. The conference (hearing) is open to the public and typically lasts 3-4 days. Members of the public can also pose questions to experts. The panel then retires and issues a report with a judgement on the issue and presents it to the audience and to the mass media at a special press conference (IPPR, 1999). Whereas in citizens’ juries there is more room for different opinions in the final verdict, in a consensus conference the emphasis is more on reaching consent in the final decision.
Visioning is a tool that has been applied in public and private organisations (Weisbord, 1993), urban planning (Walzer, 1996, Okubo, 1997), technology
assessment (Andersen and Jaeger, 2001) and planning for urban sustainability (Street, 1997). A visioning event (workshop) typically lasts 2-2.5 days. Participants might range in number from 20 to 80. They work in sub-groups of 5-8 people and then reconvene to synthesise ideas in the assembly. The first day is devoted to “vision-making” and the second day to “idea generation”. During vision-making, participants are asked to articulate, discuss and finally agree on a vision statement on the issue in question. For example, a group of 48 stakeholders working on a plan for improving the water quality of the upper Colorado river basin agreed on a vision of “water management as a collaborative process with a structure based on shared data” (Rehm et al, 1993). The underlying assumption of the method, resting partially on insights from psychology and organisational science, is that by working on finding a common vision and by liberating discussion from the burden of the present and focusing on the future, a “widest common ground” can be found without forcing or compromising. The Colorado statement, for example, reflects a willingness of participants to break through a stalemate that hindered river agencies from sharing their information. The realisation of this common ground and commitment to a future goal can energise the next day of idea generation. In this phase, participants are divided into groups working on specific implementation tasks relating to the vision (e.g. in the Colorado example working on the formation of shared databases or permanent multi-agency committees) and propose concrete ideas. Ideas are then debated in detail, barriers and opportunities for their implementation identified and an “Action Plan” formulated.
In the “future search” variant of visioning (Weisbord, 1993), the emphasis is on generating innovative ideas and empowering the participants to take action. The process is less constrained in comparison to the “scenario workshop” variant (Street, 1997), where pre-prepared future scenarios are used as the basis of discussion upon which participants formulate their own vision. Scenario workshops have fewer participants than future searchers (max 32 vs. up to 80). On the first day, participants are divided into four homogenous groups: policy makers, experts, economic actors and citizens. Scenario workshops also use presentations by experts and follow a more streamlined process based on the use of matched pair interviews, etc. Box 8.6 presents a visioning workshop for water management held in a coastal city in Greece, drawing methodological elements from both variants.
Planning for real was developed in the 1970s as an alternative to conventional urban planning (IPRR, 1999). Using models, cards or visual exhibits,
panels of people debate alternative development scenarios. The outcome is a three-dimensional model of e.g. a neighbourhood or a city. This is then publicised in a public space and moveable option cards are used to allow observers to identify problem areas and suggest how they can be solved. The public exposition event is followed by workshop sessions to prioritise options and identify responsibility for action. Planning for Real may be more difficult to apply to urban water systems, where many of the important features of the system may defy easy depiction. Modern simulation techniques and graphics software, however, provide new Planning for Real opportunities.
Interactive GIS where participants (alone or with the help of a facilitator) portray the different scenarios debated in a spatial platform, can facilitate Planning for Real or visioning exercises. GIS can be used, for example, to illustrate levels of water use or water leakage in different parts of the city, areas of water stress or high costs, and hence facilitate the deliberation process.
In mediated modelling (also called “group model building”) participants develop a dynamic computer model during a series of workshops mediated by a facilitator. Alternative scenarios for the management of issues at stake are then simulated. The process can be used to collect and organise data, synthesise knowledge and communicate the key issues for decision-making. The model is used as a platform for learning but can also help in debating and agreeing on an Action Plan (Videira et al, 2003).
Participatory multi-criteria decision aid (also referred to in participation literature as multi-criteria mapping) was described in Chapter 4. Deliberation builds on a multi-criteria assessment platform, participants being involved both in the identification and assessment of alternatives. Negotiation and group facilitation techniques may be used to achieve convergence between conflicting positions. The MCDA framework is used to evaluate and illustrate divergence and convergence.
Deliberative polls are in effect opinion polls undertaken before and after a public hearing (COSLA, 2002). The number of participants can range from 100 to 300. Participants complete a questionnaire (opinion poll) on the issue at stake and then listen to briefings, talks and pose questions during a workshop event. Participants are split into groups to debate and scrutinize the issue. They then respond to the same questionnaire (at the end of the process or after some time has lapsed) and the change in opinions is assessed.

102 103
8.5.4 Polling
Beyond DIPs, polling techniques are a traditional tool for more direct forms of democracy and the participation of people in decisions. A referendum is a useful way of gauging public opinion on a controversial issue. It should always be preceded by public debate and therefore should occur at the end of a longer participatory process. The main limitation of a referendum is that it can only address simple “yes or no” types of questions. Whether the result is representative if the turnout is very low is also an issue; a minimal level of participation may have to be set for this purpose.
A referendum may also be conducted by post so that people don’t need to go to a polling station. Developments in electronic technology can in future enable easier forms of voting (through the internet) reducing the cost of organising referenda (COSLA, 2002).
Table 8.1 summarises the advantages, disadvantages and range of applicability of some important participation techniques.
A successful participatory process should combine more than one technique for an optimal result. For example, the process could start with a less
structured public hearing or focus groups where the issues and goals of the process are identified. This can be followed by a visioning workshop where urban water management goals are set and alternatives identified. A consultant could then take up the task of studying these alternatives and debate them with specific sub-committees, using multi-criteria techniques. The final Action Plan, or any confrontational decisions, could be put for approval to a citizen’s jury or a community referendum. Committees could then be set up to monitor compliance with the commitments of the Plan.
8.6 ISSUES IN PUBLIC PARTICIPATION
ScaleParticipatory processes are not free of drawbacks. A first issue concerns the spatial and temporal scale of the decisions. Participatory processes
are constrained within certain spatial or issue boundaries and this may lead participants to shift the cost of their decisions to other areas or to the future. A citizen’s committee discussing urban water policy, for example, may be biased towards shifting responsibility for water conservation to rural areas and to agricultural producers, rather than inclined to accept an increase of prices in the city. Citizens may also feel that they have limited control over determining external factors such as economic development trends or climate change. This can be partially addressed by conceiving multiple participatory processes at multiple levels (e.g. urban, river basin, national, international), but links between these may be difficult to maintain.
The use of science A second important issue is the role of scientific expertise. Urban water decisions are complex and require a degree of technical and scientific
BOX 8.6VISIONING WORKSHOP FOR SUSTAINABLE WATER MANAGEMENT ON THE GREEK ISLAND OF NAXOS (Kallis et al, 2004)
The island of Naxos (103 n.m. SE of Athens) has a permanent population of 18,000, increasing in July-August by 15-30,000 tourists and visitors. In dry years, water conflicts occur between tourism and agriculture and between the coastal, tourist city of Naxos and the mountainous, rural municipality of Drimalia. The Workshop took place on the 1st and 2nd of November 2003 and was attended by 36 selected stakeholders. Awareness, dialogue and agreement on an Action Plan were the initial goals.
On the first day, participants were divided into four homogeneous groups: policy makers and economic actors from Naxos, policy makers and economic actors from Drimalia, scientists/experts and citizen/community groups. Participants were provided in advance with four water-development scenarios for the year 2020. The “business-as-usual” scenario (S1) was for growth of mass tourism served by big waterworks. The other scenarios were: (S2) economic modernisation of the island, globalisation-fuelled growth with use of new water technologies and administrative approaches; (S3) balanced development, environmental protection, an emphasis on water conservation and small-scale, appropriate technologies; and (S4) radical “ecology” with self-sufficiency, communitarian self-organisation and dramatic reduction of water consumption. Scenarios were provided both in a technical format (including data tables and spatially differentiated demand forecasts) and in a “user-friendly” form of imaginary letters written by visitors to Naxos in the summer of 2020.
Each group reached a vision, which was then debated with other groups in the assembly. Helped by an experienced facilitator, participants reached
a shared vision that some of them described as a combination of S3 with a touch of technology from S2 and autonomy and self-sufficiency from S4. They stressed a diversified island economy where income and job opportunities for the young would be provided by a soft and qualitative tourism development and the exploitation of competitive advantage in quality agricultural products. Water in sufficient quantity and quality would be secured primarily through water conservation and new waterworks, both technologically “state-of-the-art” and based on “traditional knowledge”. Finally, they debated the organisational structure of the water sector favouring decentralisation, but without agreeing on the appropriate division of state, regional and local competencies.
On the second day, participants worked in four mixed thematic groups: water quality; water supply; water conservation, and institutional design. Ideas were prioritised by voting. Each thematic group voted for the three most popular ideas. The assembly then voted and ranked the 12 final ideas. More than 60 ideas were recorded with the three highest-scoring being: school education programmes for water-saving, preservation and repair of rural land terraces to control rainwater flow, and the establishment of a laboratory to analyse water quality. Participants proposed to distinguish in planning and allocation between water for local and for tourist purposes. The workshop achieved an unprecedented dialogue between conflicting parties and generated momentum for the setting up of an inter-municipal water authority to govern water allocation and manage reservoirs. It fell short though of producing an Action Plan, as participants felt they lacked the necessary knowledge and information.
Method Advantages Disadvantages Applicability
Citizen’s jury
• High degree of control to citizens – in line with established judicial norms
• Expert evidence: combining scientific expertise with citizens’ judgement
• Depends on quality and engagement of jurors
• Expensive, time-consuming, demanding preparatory work
• Confrontational decisions• Assessment of alternatives• Approval of plans•
ConsensusConference
• Public profile raised by press conference
• Panel representation
Visioning Workshop
• Long-term thinking• Educative• Fosters dialogue and trust• Creative thinking, innovative
ideas
• Over-general, compromise statements may result
• Much depends on the quality of facilitation
• Limited time to assimilate information and reach concrete decisions
• Initial stages of planning: scoping, framing
• Goal-setting
Participatory MCDA
• Quantitative and qualitative information used
• Use of formal assessment tools
• Platform may constrain debate in comparison to more free-flow methods
• Over-dependant on organisers
• Assessment of alternatives• Evaluation of results
Mediated Modelling
• Active learning, educative• Accommodation of
participants • with difficulties
• I.T. may estrange some participants
• Simulation model may be mislead for predictive power
• Initial stages of planning• Goal-setting
Conflict Resolution/ Consensus Building
• Clarifies different viewpoints• Builds understanding
• If fails, may lead to polarisation and the intensification of differences
• Conflicts may turn out more complex and irreconcilable than initially thought
• Confrontational decisions / plans
• Agreement on Plan• Implementation
Referendum
• Representative – directly democratic
• Well known and acceptable process
• Potential low, non-representative turnout
• Cost and organisation restricted to key decisions
• Restricted to yes/no questions
• Confrontational decisions / plans
Table 8.1 An assessment of participation techniques (based on COSLA, 2002)

104 105
knowledge that is not available to most citizens. On the other hand, giving scientific expertise a privileged status in the participatory process can disempower citizens, intensify feelings of ignorance, and lead them to defer to perceived authorities (Holmes and Scoones, 2000). A “citizen’s science” where scientific and citizens’ expertise are combined is rarely possible given the short time frame within which participatory processes usually operate.
The limits of consensusThe issue of science points to an important feature of participatory processes. An agreement, no matter how democratic or participatory, might still be fallacious or economically wasteful. A group of people might agree or vote that “one plus one equals three”; this does not make their agreement correct nor is it sustainable to base decisions on such false arithmetic. In addition, consensus does not necessarily lead to environmentally benign outcomes. A community might decide not to sacrifice present income and to live beyond the limits of its resource base (e.g. by continuing to over-abstract groundwater), displacing costs and risks to the future.
The above hints that consensus may not always be for the better. Consensus may force agreement over the minimum common denominator. In the Blue Ribbon case (Box 7.3), satisfying the large estate owners of the San Fernando Valley, led to a “watering down” of the conservation objectives of tariffs.
Participatory processes are criticised for their loose and broadly defined goals and statements. The pressure for consensus where there will always be winners and losers could silence rather than give voice to those already marginalized and has the potential to inhibit the argumentative process (Holmes and Scoones, 2000). Similarly, in majority-voting decisions, some may be left unheeded; an apparent “agreement” over a decision may nurture seeds of conflict further along in the process. In some cases, change driven by a few enlightened, visionary individuals or groups may be much more important than “watered-down” participatory agreements.
NeutralityThe outcome of a participatory process greatly depends on framing and facilitation. Organisers are often actors in the policy process, with their own perceptions, interests and agendas. Their role in framing issues and defining objectives of the process is at odds with the idea of unbiased public debate. The very decision on whether there is an issue meriting a participatory process is a positioning. For example, it is very different to frame a community debate on water policies and to focus it on the determination of the ecological
objectives of water bodies. The latter already presupposes that the need for ecological objectives is accepted; this view however, may not be always shared by the local community. In a similar example: it is very different to couch a public debate about a proposed dam in terms of “having or not having the dam”, “dam vs. all other possible alternatives” (including demand management), and “what is the appropriate design of the dam in order to minimise impacts?”. Such problems can be partially alleviated if participatory processes are implemented early on, i.e. from the problem scoping and framing phase.
Standardised facilitation techniques can reduce but cannot eliminate bias in the process. They are constrained by the initial framing of the issue, the goals of the process and the features of the methods used. Facilitators are human and cannot avoid managing the process according to their own mental models. For example, they may be tempted to force dialogue, consensus and decisions even if conditions are not mature.
The selection of participantsRepresentation is the thorniest issue in participatory processes. The self-identification of participants has the disadvantage that those with more time, resources, status, motivation and access to information may be disproportionately represented. The process might be “hijacked” by motivated, powerful or vocal interest groups (e.g. San Fernando Valley residents in the Blue Ribbon example, Box 7.3). Low participant turnout (e.g. the Santa Clara cooperative example; Box 2.4) questions the legitimacy of the results of a participatory process.
Stakeholder representation might be appropriate where the reduction of conflict between interest groups is the goal. It is less appropriate when the results of the participatory process are meant to express the “verdict” of the community, however. Stakeholders do not constitute a representative sample of the community but of the main interests affected. Individual representatives may not speak for their whole constituency, since significant internal differences may exist (e.g. evident when people from minority ethnic groups are asked to speak for their whole community). Some of their opinions or agreements may also be personal. An additional problem is that during the participatory process, representatives are not allowed to question or to reformulate the interests they are obliged to articulate (Holmes and Scoones, 2000).
In contentious issues, where a decision has to be taken, the rules upon which consent is based are very important if the result is to be representative and democratic. Voting in committees of stakeholders, for example,
raises the issue of how voting rights should be distributed. One participant – one vote is an option. This might be inequitable, however, if some stakeholders represent disproportionately smaller constituencies. By determining the composition of the participants, organisers yield power over the outcome of the process. For example, the formation of Water Councils at the river basin and national level in Spain was welcomed as an important step for democratising water planning by instituting small parliaments where citizen participation would be guaranteed. Critics argue, however, that the “very composition of the councils, with an overwhelming majority of political representatives from the governing political party and from the traditionally privileged hydroelectric and irrigator users” has blocked change (del Moral et al, 2002).
The unequal distribution of power in the participatory processPower within civil society invariably translates, unless mitigated, into systemic power within the participatory process. Participants with more resources, information or the ability to express and articulate ideas will be privileged in the process (although some of these biases may be mitigated by the design of the process and facilitation techniques). Participatory processes are political and they cannot be seen in isolation from broader political configurations (e.g. coalitions, bargains in other spheres, who has the real power to implement decisions, etc.). Furthermore, the framing of the issues, the choice of methods, the approval of certain participants and the rejection of others, are related to existing institutional contexts and configurations (Holmes and Scoones, 2000).
Policy impactAn important issue is the impact of the participatory process in real decisions. Without real impact, the process looses its credibility and citizens will be much more reluctant to participate and dedicate time and effort. The decision cycle of Figure 8.2 is in reality much more complex and repetitive, especially in Mediterranean countries. Decisions are often taken on an incremental basis with limited information. A mass of unclear objectives is often combined with inappropriate instruments. Decisions are taken through a far broader set of power and knowledge configurations across multiple interfaces. Hence, impact depends on how participatory processes are located within broader formal and informal policy processes and how those involved in participatory events are linked to wider policy networks and processes of change (Holmes and Scoones, 2000).
Financial and time resourcesA final issue concerns resource and time constraints. Decisions often need to be taken
quickly, whereas a qualitative participatory process takes time. Delays often cost. Well organised participatory processes have an important cost of their own. Economic efficiency suggests that benefits (e.g. the avoidance of judicial or litigation costs) should outweigh costs for a participatory process to be undertaken. Costs and benefits, however, are not always easy to identify or quantify. An increase in social trust between stakeholders, for example, may have important accompanying benefits. A key feature of participatory processes is that they do not see deliberation and inclusion (i.e. participation) as mere instruments towards predefined goals (such as for example enhancing the acceptance of policies). The process of dialogue and negotiation is seen as containing value in itself over and above the quality of the decisions that emerge (Holmes and Scoones, 2000).
All the aforementioned problems have led some to question the legitimacy of participatory processes in comparison to more traditional forms of representative democracy: “Conventional representative democracy may not be glamorous and may suffer from dismally low turnouts in local elections, but it is a well understood and constitutional method which bestows a genuine legitimacy on elected representatives to speak on behalf of their constituents” (Selman, 1998).
8.7 GUIDING PRINCIPLES FOR PARTICIPATORY PROCESSES
Urban water management in Mediterranean countries has seen few, if any, applications of participatory approaches. Public apathy, a lack of awareness of the possibility of participating or of the importance of urban water issues during non-crisis periods are important reasons for this. One hypothesis is that people are not passive because they do not see any value in engaging in political decisions, but that they do not engage because they think that their contribution will not be taken into account.
In most Mediterranean countries opportunities, for meaningful participation are still very few, reflecting the dominant political culture/tradition of confrontational, party or leader-based and centralised politics with little accommodation for consensual models. Urban water issues in particular are perceived as technical; managers and politicians see little scope for involving the public in decisions.
Several concerns about the effectiveness of participatory processes are well founded. They relate to the problems discussed above. The question however should not be “participation vs.
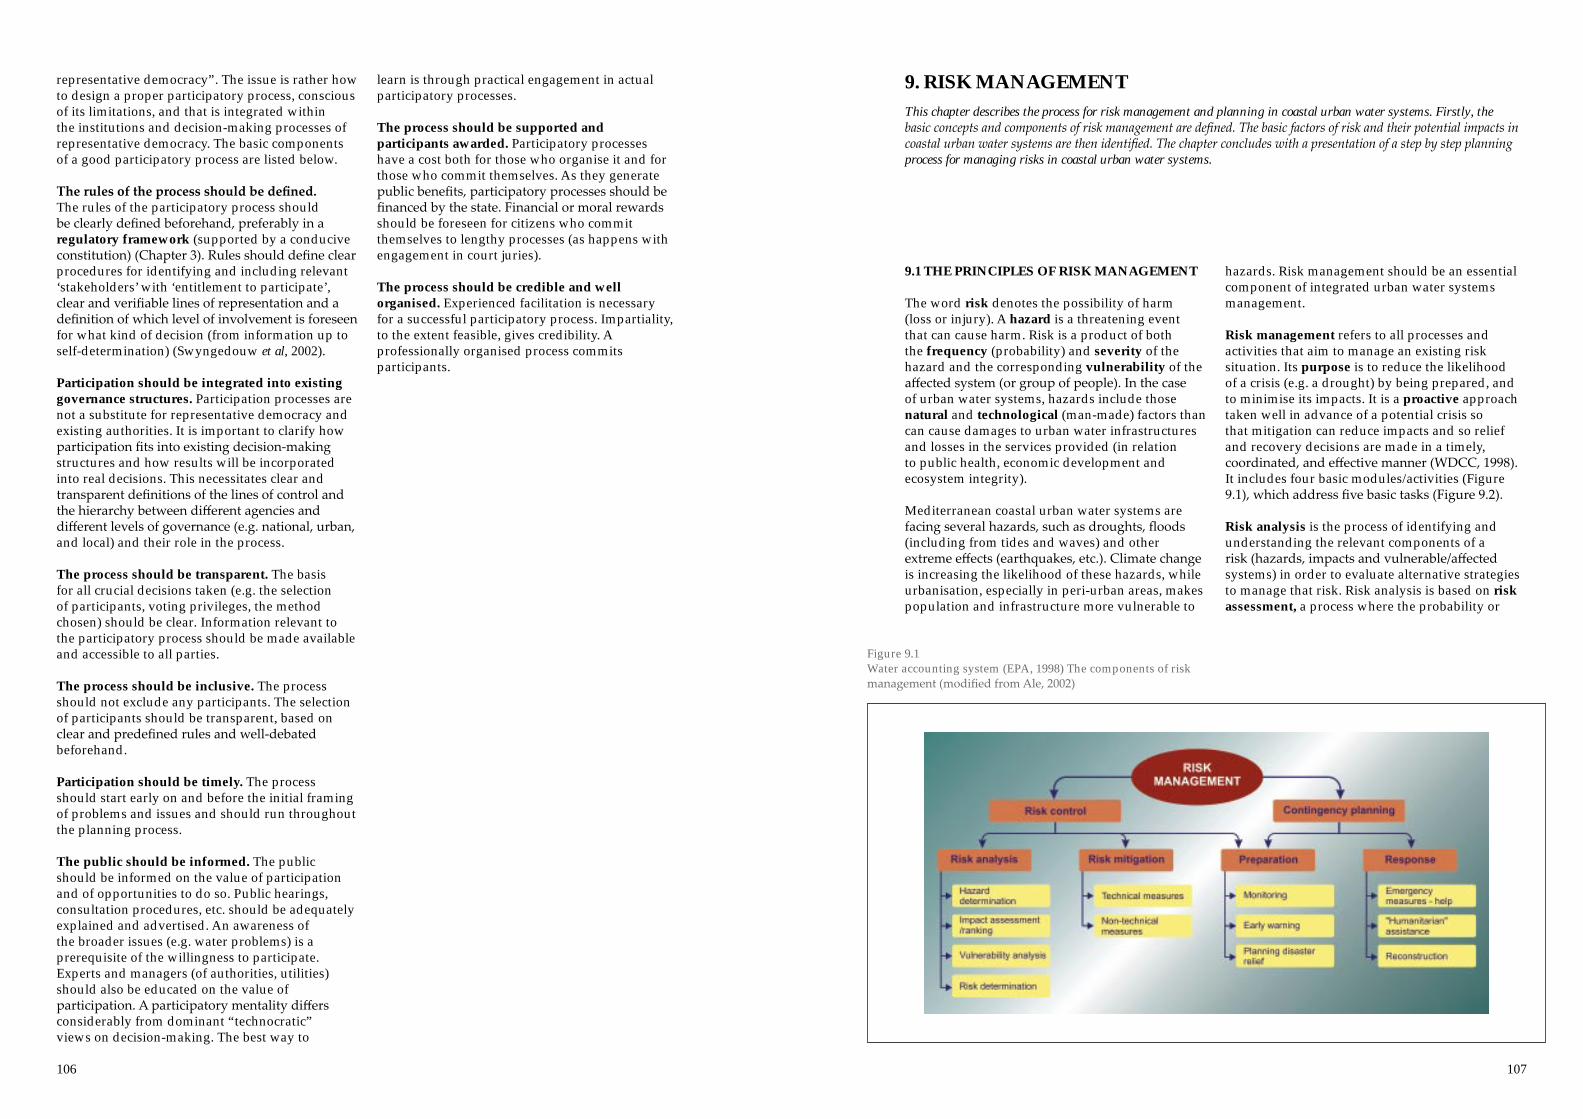
106 107
representative democracy”. The issue is rather how to design a proper participatory process, conscious of its limitations, and that is integrated within the institutions and decision-making processes of representative democracy. The basic components of a good participatory process are listed below.
The rules of the process should be defined. The rules of the participatory process should be clearly defined beforehand, preferably in a regulatory framework (supported by a conducive constitution) (Chapter 3). Rules should define clear procedures for identifying and including relevant ‘stakeholders’ with ‘entitlement to participate’, clear and verifiable lines of representation and a definition of which level of involvement is foreseen for what kind of decision (from information up to self-determination) (Swyngedouw et al, 2002).
Participation should be integrated into existing governance structures. Participation processes are not a substitute for representative democracy and existing authorities. It is important to clarify how participation fits into existing decision-making structures and how results will be incorporated into real decisions. This necessitates clear and transparent definitions of the lines of control and the hierarchy between different agencies and different levels of governance (e.g. national, urban, and local) and their role in the process.
The process should be transparent. The basis for all crucial decisions taken (e.g. the selection of participants, voting privileges, the method chosen) should be clear. Information relevant to the participatory process should be made available and accessible to all parties.
The process should be inclusive. The process should not exclude any participants. The selection of participants should be transparent, based on clear and predefined rules and well-debated beforehand.
Participation should be timely. The process should start early on and before the initial framing of problems and issues and should run throughout the planning process.
The public should be informed. The public should be informed on the value of participation and of opportunities to do so. Public hearings, consultation procedures, etc. should be adequately explained and advertised. An awareness of the broader issues (e.g. water problems) is a prerequisite of the willingness to participate. Experts and managers (of authorities, utilities) should also be educated on the value of participation. A participatory mentality differs considerably from dominant “technocratic” views on decision-making. The best way to
learn is through practical engagement in actual participatory processes.
The process should be supported and participants awarded. Participatory processes have a cost both for those who organise it and for those who commit themselves. As they generate public benefits, participatory processes should be financed by the state. Financial or moral rewards should be foreseen for citizens who commit themselves to lengthy processes (as happens with engagement in court juries).
The process should be credible and well organised. Experienced facilitation is necessary for a successful participatory process. Impartiality, to the extent feasible, gives credibility. A professionally organised process commits participants.
9.1 THE PRINCIPLES OF RISK MANAGEMENT
The word risk denotes the possibility of harm (loss or injury). A hazard is a threatening event that can cause harm. Risk is a product of both the frequency (probability) and severity of the hazard and the corresponding vulnerability of the affected system (or group of people). In the case of urban water systems, hazards include those natural and technological (man-made) factors than can cause damages to urban water infrastructures and losses in the services provided (in relation to public health, economic development and ecosystem integrity).
Mediterranean coastal urban water systems are facing several hazards, such as droughts, floods (including from tides and waves) and other extreme effects (earthquakes, etc.). Climate change is increasing the likelihood of these hazards, while urbanisation, especially in peri-urban areas, makes population and infrastructure more vulnerable to
hazards. Risk management should be an essential component of integrated urban water systems management.
Risk management refers to all processes and activities that aim to manage an existing risk situation. Its purpose is to reduce the likelihood of a crisis (e.g. a drought) by being prepared, and to minimise its impacts. It is a proactive approach taken well in advance of a potential crisis so that mitigation can reduce impacts and so relief and recovery decisions are made in a timely, coordinated, and effective manner (WDCC, 1998). It includes four basic modules/activities (Figure 9.1), which address five basic tasks (Figure 9.2).
Risk analysis is the process of identifying and understanding the relevant components of a risk (hazards, impacts and vulnerable/affected systems) in order to evaluate alternative strategies to manage that risk. Risk analysis is based on risk assessment, a process where the probability or
9. RISK MANAGEMENT This chapter describes the process for risk management and planning in coastal urban water systems. Firstly, the basic concepts and components of risk management are defined. The basic factors of risk and their potential impacts in coastal urban water systems are then identified. The chapter concludes with a presentation of a step by step planning process for managing risks in coastal urban water systems.
Figure 9.1 Water accounting system (EPA, 1998) The components of risk management (modified from Ale, 2002)

108 109
frequency of harm for a given inherent hazard (an event or agent that has the potential to cause harm) is estimated either quantitatively or qualitatively. The assessment and determination of a risk proceeds through the following stages (Harrop & Nixon, 1999, WDCC, 1998): • the identification of sources and components of
a hazard• the frequency and probability analysis of the
hazard occurring• the identification, assessment and ranking
(prioritisation) of impacts from the hazard• a vulnerability assessment of the exposed areas,
groups of people or ecosystems
Risk analysis rests on the definition of an acceptable (or tolerable) level of risk, i.e. a level of vulnerability that is considered to be “acceptable” balancing factors such as the probability of hazard and the intensity of impact, cost, equity, etc.
Risk analysis is based on the application of objective science and scientific principles (Eduljee, 2000). In most assessments, risk is reduced to a single equation, which quantitatively links the probability of a hazard’s impact with the costs of the consequences if the event were to actually occur. Risk is not only a technical and scientific matter, however, but also a social one, because:1. Risk is not only a natural phenomenon, but also
a cultural one. It depends on which dangers societies define (perceive) as troublesome (Rees, 2002).
2. Often, it is not only physical events that cause risks, human activities do too (e.g. urbanising flood-plains and coastal zones or growing water-intensive crops in drought-prone areas). Economic, political and social uncertainties are often more important than natural ones (Rees, 2002).
The definition of an acceptable level of risk and the selection from among alternative measures cannot be determined “objectively” and independently of the people who will face the consequences.
Having identified and quantified the likely risks (to the extent possible), the next step is to decide on the necessary actions (short-term and long-term actions, programmes or policies) to reduce these risks. Firstly, this involves the maintenance and improvement of the existing operation and management of the system (risk mitigation) and next, preparation work on facing hazards and crises if they occur. Mitigation can reduce but can never eliminate risk; preparation addresses this residual risk. Mitigation and preparation measures need to not only focus on technical operational and management measures, but also to directly target the vulnerable systems with non-technical interventions (e.g. relocating populations, changing land uses, etc.). Decisions on which mitigation and preparation actions to adopt are likely to be based on some reasonable economic and social analysis. Cost-benefit or multi-criteria techniques such as those described in Chapter 4 can be useful.
The final component of risk management, i.e. that of response to contingencies has the objective of providing a coordinated response framework in the event of a disaster situation. The aim is to define who does what in the case of an emergency and to foresee all actions necessary to quickly assess damages and reinstate the service as soon as possible (Mearns and Overmars, 2000).
The different components of risk management are not isolated, but interrelated. The risk management process is repetitive. Risk analysis identifies risk mitigation measures; in turn, their implementation may identify different sources of risk or demand a recalculation of risks. Risk mitigation identifies residual risk; in turn, the design of a contingency plan may identify areas where further preparatory or mitigation measures are needed.
9.2 RISK FACTORS AND IMPACTS IN COASTAL URBAN WATER SYSTEMS
9.2.1 Hazards
Box 9.1 summarises the main hazards for coastal urban water systems and some of their impacts.
These include natural and technological hazards. Natural hazards are caused by natural, geological or meteorological phenomena (Mearns and Overmars, 2000). These can cause disruption to the water system by jeopardising the adequacy and quality of resources, by causing damage to the water and sewage pipe network or treatment plants, and by obstructing the normal functioning of the system. The vulnerability of the Mediterranean region to climatic changes has intensified over the last years with the changing demographic, economic growth and resource use patterns (Ameziane, 2002).
Meteorological phenomena include droughts and floods. Their frequency is intensified by the impacts of climate change. Droughts are recurrent in the Mediterranean. They should be treated as a systemic, rather than an exceptional event (Ameziane, 2002). Droughts cause severe water shortages and decrease the flow of surface or groundwater putting water availability in risk. They may also impact on water quality, as they reduce the self-cleansing capacity of natural water-ways, thus leading to pollution and eutrophication in natural and man-made reservoirs (PAHO/WHO, 1998).
Figure 9.2 The five tasks of a risk management process (Ale, 2002)
BOX 9.1HAZARDS AND THEIR IMPACTS ON COASTAL URBAN WATER SYSTEMS
Hazard EffectNatural HazardsDrought Water supply inadequacy
Water quality deteriorationFlood Damage to urban / water infrastructure
Pollution of potable water supply Overflow of wastewater treatment plantsHydraulic damage to water-ways
Earthquake Destruction of the water system infrastructureLandslide Destruction of infrastructure
Contamination of water-waysVolcanic activityExtreme weather events Destruction of infrastructure
Intense peak demands Ecosystem changes or damage Reduction or disappearance of natural outlets, like
rivers, wetlands, and estuariesSea level rise Erosion
Increased flood frequencySeawater intrusion
Technological hazardsPower loss The functioning of treatment plants, pump stations and
other activities e.g. monitoringFire Damage to water system infrastructureChemical spillage – contamination accidents Pollution and supply quality Design and construction failure Operation interruption – service failure
Damage to urban infrastructureDeliberate sabotage (terrorism) Infrastructure damage, contamination

110 111
Floods are a common natural hazard in the Mediterranean (Guerieri, 2002). There are two basic types of floods: • those occurring in the alluvial plain by
swelling rivers • flash floods caused by intense localised
thunderstorm activities
Following drought, desiccated lands are less able to collect run-off and flood intensity worsens. In urbanised areas, the effects of a flood are aggravated by the extended impervious surfaces that increase run-off (studies have shown that run-off in urban areas is 1.1 to 4.6 times greater than pre-urban run-off, Ameziane, 2002). Floods can contaminate drinking and groundwater; the overflow of wastewater treatment plants is a particular concern. Floods can also cause infrastructural damage to pipelines, pumping equipment or electrical installations, as well as to dams and reservoirs (PAHO/WHO, 1998).
In addition to the increasing frequency of drought and floods, climate change can also endanger water resources by ecosystem changes or damage. Examples include the reduction in aquifer recharge resulting in the reduction or disappearance of natural outlets; sea level rises, associated with coastal erosion and seawater intrusion to the coastal aquifers; and desertification.
Extreme weather events, such as unexpected freezing temperatures or heat waves, have the potential to disrupt the water system, either by infrastructural damage (burst pipes) or by changing consumption patterns and affecting source availability. For example, in February 2004 an unexpected spell of freezing weather in the city of Athens, Greece, skyrocketed daily water consumption to record levels (higher even than in a heat wave), as households used water to clean snow or left water running from the taps to protect pipes from freezing. Damages to the network combined with the depletion of the urban storage tanks due to the unexpected peak demand and left many households without water for several days.
The frequency of meteorological phenomena mainly relates to natural causes (with the exception of the contribution from anthropogenic-induced climate change); hence the name “natural” hazards. The impacts of these natural hazards, however, depend on human activity. Increasing urban water demand or the urbanisation of a flood-plain may be more important factors of a drought and a flood crisis respectively, than meteorological phenomena alone.
Damaging geological phenomena are very common in Mediterranean countries. The Mediterranean region experiences earthquakes
of considerable magnitude. The most obvious impact from earthquakes is damage to the system infrastructure (along with the rest of the urban infrastructure). Earthquakes can also change the morphology of groundwater reservoirs, altering water routes, flowrates and outlets. They can also cause contamination of surface water because of accompanying landslides (PAHO/WHO, 1998). Landslides can also occur due to volcanic activity and increased rainfall. Volcanic activity can also impact in many other ways on urban water systems.
Technological hazards are primarily caused by human activities. They include power loss, fire, pollution etc. Natural hazards can contribute to technological hazards (e.g. an earthquake can cause a fire or a power loss). Power loss disrupts the functioning of monitoring, treatment plants and pumping stations that rely on electricity, thus reducing the water supply quantity as well as quality. Fire can have similar effects and can contribute to damage to the water system infrastructure. Dam and other construction failures in infrastructure can have devastating effects on downstream regions and all other regions dependant on the water supply of the dam. Operational failure is also possible, e.g. error in the release of sewage from combined sewers.
Chemical spillage and contamination accidents can infringe supply quality and pose health risks. Urban areas, which are utilising drinking sources from rivers used also for navigation and transport, or other surface or groundwater sources that receive industrial or other urban effluents, are particularly vulnerable to such hazards.
Deliberate sabotage to urban water infrastructure, as part of a terrorism act, although it has never occurred in the Mediterranean to date, is a risk that should receive attention in the future. This can take the form of a physical attack with the destruction of system infrastructure, or a more sinister one involving the pollution of supplies with chemical or biological agents. Protection measures are needed to reduce such possibilities.
9.2.2 Risks to urban water infrastructure
Different parts of the urban water infrastructure are subject to different hazards and risks. Water sources can be infringed upon by natural hazards like droughts, which reduce the available resources; floods, which can pollute with organic load and debris, and by earthquakes, which can cause landslides and block and pollute the water-ways. Volcanic activity can deposit ash and other materials in surface waters. Pollution from industries, transport or upstream wastewater treatment plants and other human activities can be a technical risk, threatening water quality (Mearns and Overmars, 2000).
Wastewater sources, either domestic or industrial, face danger from earthquakes and volcanic activity that can cause structural change and subsequent pollution.
Water supply intakes, including artificial catchments, structures in rivers and water-ways, boreholes etc. can be structurally damaged or undergo changes to the pipe work alignment as a result of volcanoes and earthquakes. Floods and landslides pose the additional threat of blocking the intakes with debris and silt.
Water supply storage structures, dams or storage reservoirs, are vulnerable to damage from earthquakes. Storage structures are also vulnerable to terrorist acts.The extended nature of the distribution system increases risks. Earthquakes, landslides and volcanic activity can rupture water and wastewater pipelines, resulting in water and wastewater leakage and the pollution of fresh and coastal waters. Power failures affect pumping stations, thus compromising water supply and safe wastewater transfer (Mearns and Overmars, 2000).
Both water and wastewater treatment plants can experience structural damage due to natural hazards, such as earthquakes, volcanic eruptions, etc. which can disrupt the supply of clean water and the safe disposal of wastewater. Floods can cause stormwater to accumulate in wastewater plants, exceeding their capacity, in which case the overflow of untreated sewage can threaten local water-ways. Moreover, the chemicals used in water treatment, and the sludge and the only partially treated effluent in wastewater treatment plants pose a serious contamination risk to fresh water and/or coastal waters in the case of spillage and leaks (Mearns and Overmars, 2000).
9.2.3 Impacts
These refer to the consequences of a hazard. They relate to failures to provide the desired level of urban water services. Impacts can be classified as economic, environmental or social, even though several of those actually span more than one of these categories. For example, impacts might include:• public health impacts from interruptions to
supply due to deteriorated drinking water quality• impacts on productive activities (industries,
enterprises, urban agriculture) due to interruptions in supply or decreased quality (in activities that demand high water quality)
• the contamination of recreational areas and impacts on tourism activities
• damages to ecosystems from pollution or reduced water quantities
There are numerous possible impacts and not all can be listed here. Box 9.2 identifies some of the potential impacts on a city from just one type of a hazard – a drought.
A hazard is just one of the causes of an impact. There are several other basal causes that contribute to an impact. The depletion of a reservoir during a drought, for example, may be partially due to an irregular meteorological event, but may also be due to over consumption during the previous years, which in turn may be due to changes in urban form, demography and economy.
9.2.4 Developing a Risk Management Plan for Coastal Urban Water Systems
A generic multi-staged process is described below based on the principles of risk management discussed above.
Step 1 – Getting the process started Risk planning can be part of the overall Master Planning process (Chapter 5, Volume I) or it can be conducted separately by the utility, a public agency or a specialised consultant. An interdisciplinary type of analysis with sound data and decision-support is needed (Chapter 4).
A kick-off scenario workshop (Chapters 4, 8) could be a useful platform from which to start the planning process. Presenting disaster scenarios and discussing mitigation and response strategies is an excellent tool for developing response plans and procedures and for getting the staff and the public involved (Mearns and Overmars, 2000).
Step 2 – Getting the public and the stakeholders involvedThe participation of stakeholders and of the public should be an integral part of the risk management process (Figure 9.3). Participation is necessary for addressing key questions, such as (Rees, 2002):1. Which levels of expenditure on risk mitigation
can be justified in user preference terms?2. Under capital and human capacity constrains
which risks are least acceptable and thus the priorities for action?
3. Who will bear the remaining risk costs and to whom should the costs and benefits of risk mitigation be allocated?
4. Which risk mitigation methods are most acceptable in economic, social and political terms?
5. How will the affected public respond to different risk reduction measures?
6. Which risk reduction measures does the community have the will or capacity to introduce and maintain?
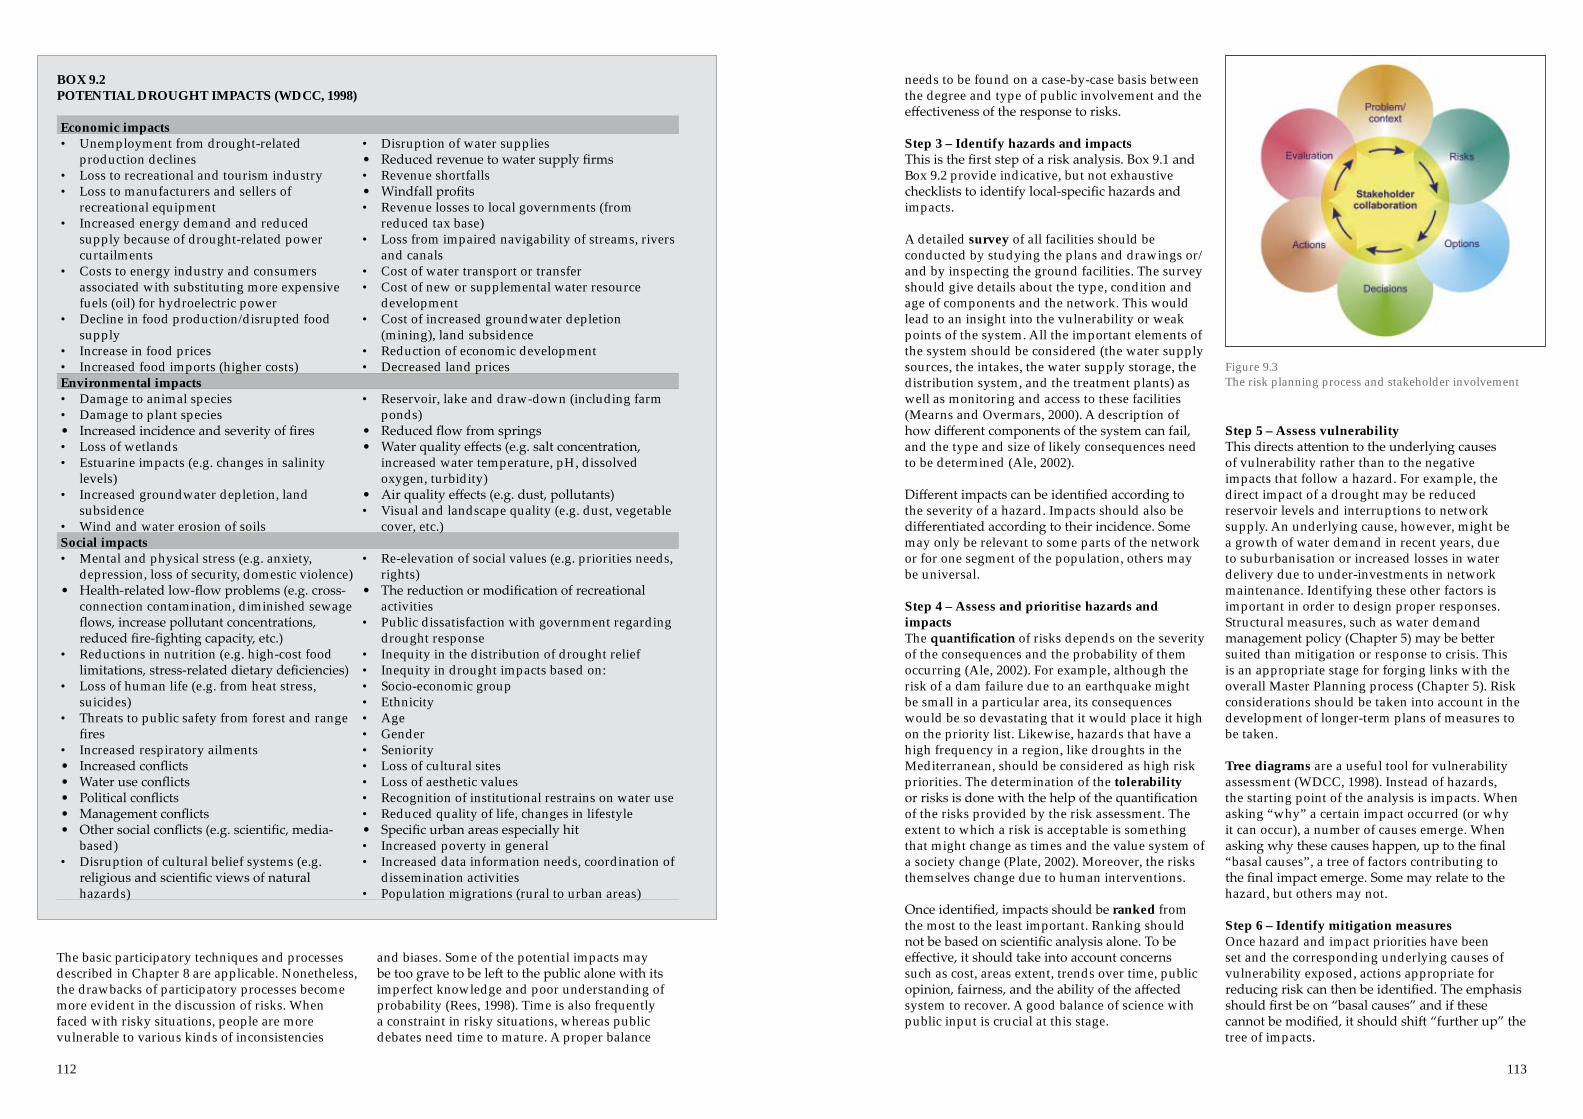
112 113
The basic participatory techniques and processes described in Chapter 8 are applicable. Nonetheless, the drawbacks of participatory processes become more evident in the discussion of risks. When faced with risky situations, people are more vulnerable to various kinds of inconsistencies
and biases. Some of the potential impacts may be too grave to be left to the public alone with its imperfect knowledge and poor understanding of probability (Rees, 1998). Time is also frequently a constraint in risky situations, whereas public debates need time to mature. A proper balance
needs to be found on a case-by-case basis between the degree and type of public involvement and the effectiveness of the response to risks.
Step 3 – Identify hazards and impacts This is the first step of a risk analysis. Box 9.1 and Box 9.2 provide indicative, but not exhaustive checklists to identify local-specific hazards and impacts.
A detailed survey of all facilities should be conducted by studying the plans and drawings or/and by inspecting the ground facilities. The survey should give details about the type, condition and age of components and the network. This would lead to an insight into the vulnerability or weak points of the system. All the important elements of the system should be considered (the water supply sources, the intakes, the water supply storage, the distribution system, and the treatment plants) as well as monitoring and access to these facilities (Mearns and Overmars, 2000). A description of how different components of the system can fail, and the type and size of likely consequences need to be determined (Ale, 2002).
Different impacts can be identified according to the severity of a hazard. Impacts should also be differentiated according to their incidence. Some may only be relevant to some parts of the network or for one segment of the population, others may be universal.
Step 4 – Assess and prioritise hazards and impactsThe quantification of risks depends on the severity of the consequences and the probability of them occurring (Ale, 2002). For example, although the risk of a dam failure due to an earthquake might be small in a particular area, its consequences would be so devastating that it would place it high on the priority list. Likewise, hazards that have a high frequency in a region, like droughts in the Mediterranean, should be considered as high risk priorities. The determination of the tolerability or risks is done with the help of the quantification of the risks provided by the risk assessment. The extent to which a risk is acceptable is something that might change as times and the value system of a society change (Plate, 2002). Moreover, the risks themselves change due to human interventions.
Once identified, impacts should be ranked from the most to the least important. Ranking should not be based on scientific analysis alone. To be effective, it should take into account concerns such as cost, areas extent, trends over time, public opinion, fairness, and the ability of the affected system to recover. A good balance of science with public input is crucial at this stage.
Step 5 – Assess vulnerabilityThis directs attention to the underlying causes of vulnerability rather than to the negative impacts that follow a hazard. For example, the direct impact of a drought may be reduced reservoir levels and interruptions to network supply. An underlying cause, however, might be a growth of water demand in recent years, due to suburbanisation or increased losses in water delivery due to under-investments in network maintenance. Identifying these other factors is important in order to design proper responses. Structural measures, such as water demand management policy (Chapter 5) may be better suited than mitigation or response to crisis. This is an appropriate stage for forging links with the overall Master Planning process (Chapter 5). Risk considerations should be taken into account in the development of longer-term plans of measures to be taken.
Tree diagrams are a useful tool for vulnerability assessment (WDCC, 1998). Instead of hazards, the starting point of the analysis is impacts. When asking “why” a certain impact occurred (or why it can occur), a number of causes emerge. When asking why these causes happen, up to the final “basal causes”, a tree of factors contributing to the final impact emerge. Some may relate to the hazard, but others may not.
Step 6 – Identify mitigation measures Once hazard and impact priorities have been set and the corresponding underlying causes of vulnerability exposed, actions appropriate for reducing risk can then be identified. The emphasis should first be on “basal causes” and if these cannot be modified, it should shift “further up” the tree of impacts.
BOX 9.2POTENTIAL DROUGHT IMPACTS (WDCC, 1998)
Economic impacts• Unemployment from drought-related
production declines• Loss to recreational and tourism industry• Loss to manufacturers and sellers of
recreational equipment• Increased energy demand and reduced
supply because of drought-related power curtailments
• Costs to energy industry and consumers associated with substituting more expensive fuels (oil) for hydroelectric power
• Decline in food production/disrupted food supply
• Increase in food prices • Increased food imports (higher costs)
• Disruption of water supplies• Reduced revenue to water supply firms • Revenue shortfalls• Windfall profits• Revenue losses to local governments (from
reduced tax base)• Loss from impaired navigability of streams, rivers
and canals• Cost of water transport or transfer• Cost of new or supplemental water resource
development• Cost of increased groundwater depletion
(mining), land subsidence• Reduction of economic development • Decreased land prices
Environmental impacts• Damage to animal species• Damage to plant species• Increased incidence and severity of fires• Loss of wetlands• Estuarine impacts (e.g. changes in salinity
levels)• Increased groundwater depletion, land
subsidence• Wind and water erosion of soils
• Reservoir, lake and draw-down (including farm ponds)
• Reduced flow from springs• Water quality effects (e.g. salt concentration,
increased water temperature, pH, dissolved oxygen, turbidity)
• Air quality effects (e.g. dust, pollutants)• Visual and landscape quality (e.g. dust, vegetable
cover, etc.)Social impacts• Mental and physical stress (e.g. anxiety,
depression, loss of security, domestic violence)• Health-related low-flow problems (e.g. cross-
connection contamination, diminished sewage flows, increase pollutant concentrations, reduced fire-fighting capacity, etc.)
• Reductions in nutrition (e.g. high-cost food limitations, stress-related dietary deficiencies)
• Loss of human life (e.g. from heat stress, suicides)
• Threats to public safety from forest and range fires
• Increased respiratory ailments • Increased conflicts • Water use conflicts• Political conflicts• Management conflicts• Other social conflicts (e.g. scientific, media-
based)• Disruption of cultural belief systems (e.g.
religious and scientific views of natural hazards)
• Re-elevation of social values (e.g. priorities needs, rights)
• The reduction or modification of recreational activities
• Public dissatisfaction with government regarding drought response
• Inequity in the distribution of drought relief• Inequity in drought impacts based on:• Socio-economic group• Ethnicity• Age• Gender• Seniority• Loss of cultural sites• Loss of aesthetic values• Recognition of institutional restrains on water use• Reduced quality of life, changes in lifestyle• Specific urban areas especially hit• Increased poverty in general• Increased data information needs, coordination of
dissemination activities• Population migrations (rural to urban areas)
Figure 9.3 The risk planning process and stakeholder involvement

114 115
Mitigation measures might include:• technical measures, such as engineering
measures and the construction of hazard-resistant and protective structures and infrastructure, e.g. flood protection works
• non-technical measures, e.g. water demand management, zoning or land-use permits.
Risk reduction measures may vary from the most advanced (e.g. the latest wastewater recycling or stormwater management technologies) to the very simple, such as relocating or rerouting pipelines so as to avoid risks to high points like rivers. Silt traps can protect downstream intakes, and pipes made from appropriate materials can minimise chances of breakage. Identification of these relatively easy, low-cost interventions is crucial, especially in smaller, lower-income urban settlements where there are fewer opportunities for adopting advanced measures.
Step 7 – Identify preparation measuresMonitoring of the system is crucial in order to secure awareness of the first indications of a problem. For example, sudden changes in water pressure, water levels or flow rates can be indicative of burst pipelines and leaks. Water quality monitoring is indispensable in preventing contamination risks and mitigating disasters. Precipitation or reservoir levels should be continuously monitored and analysed with respect to historical data to identify a drought early on. In the case of meteorological hazards such as floods and drought, it is imperative to have a reliable early warning system. Early warning systems include three primary elements (i) the forecasting of impending events, (ii) the processing and dissemination of warnings to political authorities and population, and (iii) the undertaking of appropriate and timely actions (UN, 2004). The use of remote sensing technology and the use of mathematical models of meteorological weather simulations are opening up great possibilities for accurate forecasting (Plate, 2002). The basis for any good monitoring and warning system is obviously an effective forecasting system (Chapter 4).
There are also some very practical aspects of preparedness that have to be considered. Without proper access to storage, treatment and network facilities no damage can be assessed, evaluated or repaired. Particularly at times of natural disasters, access to the whole extent of the network can be obstructed. Roads can become impassable due to swelling streams, destructive earthquakes or lava flows. It is crucial to establish ways of reaching every point of the water system in order to repair damages (Mearns and Overmars, 2000). Furthermore, spare equipment and materials must be at hand and become available as required.
Step 8 – Identify contingency responsesSome residual risk is unavoidable, whatever the mitigation measures. Contingency responses should be envisaged for different events and for different intensities (response phases). The roles of specific utility staff and other implicated stakeholders must be determined for each response phase. The responsibility for acting during a crisis typically falls on the utility. However, the planning and the organisation of the actions takes place at a higher level, for instance that of river basin authorities, public authorities (ministries, municipalities) etc. (Suzenet et al, 2001).
Step 9 – Formulate risk management and contingency plansNow that the potential actions have been identified, the next step is to choose which actions will be taken (i.e. form a “to do” action list). When making a decision about protection measures, the available technologies, financial resources and public perception of urgency of protection are taken into account. Other concerns such as feasibility, effectiveness, cost and equity are also very important. When selecting mitigation actions for example, it might be helpful to answer some of the following questions (WDCC, 1998):• What are the cost/benefit ratios? • Which actions are deemed feasible and
appropriate by the general public? • Which actions are sensitive to the local
environment (i.e. sustainable processes)?• Do actions address the right combination
of causes to adequately reduce the relevant impact?
• Do actions address short-term and long-term solutions?
• Which actions would fairly represent the needs of affected individuals and groups?
Actions should be formulated into a risk management plan (including a contingency response plan). The plan should include basic background information on the water utility and the water system facilities, such as the age of components, the location of and access to the various facilities etc. An overview of the considered weak points of the system, vulnerable to the risk in question, would prove useful. The management and coordination arrangements between the water service provider and the authorities should be established. Specific responsibilities should be allocated to authorities, managers and employees and the course of action and options clearly outlined.
A contingency plan should additionally define response phases (i.e. immediate, partial/temporary and full service restoration), with the specific roles and responsibilities of the staff fully outlined for each. Box 9.3 presents an example of a drought
BOX 9.3A BEST CASE EXAMPLE OF DROUGHT CONTINGENCY PLANNING: SEVILLE, SPAIN (EMASESA Drought Manual, 2000, from Suzenet et al, 2001)
EMASESA is the Municipal Water Company of the city of Seville. Following a dramatic spell of droughts in the 1990s, where supply in the city had to be interrupted, the utility decided to produce and share a “drought contingency plan” (the “Drought Manual” – “Manual de Sequia”) with other river basin actors. The document describes all actions to be implemented during each of five classified drought stages, ranging from the first alert to the most severe situation. The triggering criteria for each response stage are based on a continuous analysis of climatic/hydrologic data and reservoir levels and on the analysed vulnerability of the water supply sources and water distribution systems. Response actions are organised in four categories: institutional/organisational, water supply measures, water demand measures and legal aspects. These vary according to the level of drought severity. The first two stages are designed as “alert phases” as EMASESA monitors the start of an apparent drought situation. The plan foresees the establishment of two framework agreements with the Electricity Company in Seville and The Association of Irrigators in the region of Viar for the transfer of water from their reservoirs. A regional Drought Committee is also to be set up, one which will remain in place throughout all the drought response stages to coordinate requests and actions and carry out the evaluations and recommended actions. The Drought Committee will be presided over by the Director of EMASESA and include executives of water utilities. Different subcommittees on resources, finances, and demand management, water quality and legal aspects will assist the Drought Committee.On the supply side, during the first stages of the drought, EMASESA has to adopt an “emergency water supply strategy”. This entails the monitoring and evaluation of existing sources, preparation for the temporary use of marginal sources (such as use of lower-quality water following careful monitoring from the Guadalquivir River) and/or transfers from other users. On the demand side, measures initially include a reduced use in public buildings and institutions and the subsequent prohibition of non-essential public and private uses. A public information programme to educate users is also to be conducted during these first stages of the drought as is a programme for enlisting support for voluntary water use restrictions. The Municipality of Seville as well as other municipalities supplied by EMASESA should approve a Municipal Order regulating the exceptional measures to be applied to domestic water use as a consequence of the drought. This Municipal Order
foresees the possibility of adopting, according to the level of drought severity, the following measures: the prohibition of drinking water use for outdoor uses; the establishment of saving objectives; an allowance for interruptions to supply.At the next “drought stage” the plan calls for intensifying the ongoing supply and demand-side actions. At the institutional level, the Drought Committee should activate a “Drought Monitoring Roundtable” (DMR) as an interface between the Drought Committee and representatives from the Electricity Company of Seville, The Association of Irrigators, The Municipality of Seville and other municipalities supplied by EMASESA, Aljarafe – a neighbouring water supply company, the Guadalquivir River Basin Authority, and other user associations and heavy consumers. This Roundtable will be extended, at the severe drought stage, to the Andalucia Health Service, the Regional Directorates of Public Works & Transport, Environment, Economy and the Interior and to media representatives. The DMR would be established for the purpose of providing input into the Drought Committee’s decision-making process with regard to the use of water in the interest of water user groups and the general public. Within the Drought Committee, a working group will be set up aiming to analyse and assess the potential exceptional measures to be implemented before entering the next phase of a very severe drought stage (the fourth stage) is reached.Finally, the Plan foresees actions for the most severe drought stage, whereby the situation for the water system is considered to be very critical. During this phase, in addition to continuing actions ongoing in the previous stage, the Ministry of the Interior will be requested to implement an “Emergency Drought Plan”, as contained in a Legal Order of 1983. Demand management response measures will be more stringent, extended to the reduction of night supply over 8 hours or even a rota of daily cuts and the implementation of additional more stringent tariff measures (to be defined). Resources at this stage will mainly have to come from the lower-quality Guadalquivir River. Finally, the Plan proposes the establishment of a special drought law. The law would establish the exceptional measures to be taken by the Municipality in the case of a drought situation and potential shortages (e.g. use of water of lower quality, tariff revision). The law should also judge on the procedures for reaching agreements regarding the diversion of water from other regional reservoirs to the city and make provisions in case there is a failure to reach voluntary agreements.
116 117
contingency plan prepared by an urban water utility in Spain.
Step 10 – Revise plansThe preparation of the plan is just the first step. This must be followed by specific scenario exercises involving a range of stakeholders to ensure that the plan works effectively. It should also be reviewed at least every two years and following each hazard-related crisis. Plans should be sensitive to changes in social values and perceptions as well as to new knowledge or information about potential risks. Ale, B.J.M. (2002), “Risk Assessment Practices in
The Netherlands”, Safety Science, Vol. 40, pp.105-126.
Ameziane El Hassani, T. (2002), “Drought Preparedness and Risk Management in the Mediterranean Region”, paper presented at the IUNC Mediterranean Regional Roundtable, Athens Greece, December 2002.
Andersen, I. and Jaeger, B. (2001), “Scenario Workshops and Urban Planning in Denmark”, PLA Notes, Vol. 40, pp.53-56.
Appan, A. (1999), “Economic and Water Quality Aspects of Rainwater Catchment Systems”, Proceedings of the International Symposium on Efficient Water Use in Urban Areas, IETC. Report 9, Osaka: UNEP International Environmental Technology Centre.
Arnstein, S.R. (1969), “A Ladder of Citizen Participation”, Journal of the American Institute of Planners, Vol. 30, pp.216-224.
Asano, T. (1999), “Wastewater Reuse for non-potable Applications: An introduction”, Proceedings of the International Symposium on Efficient Water Use in Urban Areas, IETC. Report 9, Osaka: UNEP International Environmental Technology Centre.
Attané, I. and Courbage, Y. (2001), La démographie en Méditerranée: Situation et Projections, (Les Fascicules du Plan Bleu n°11), Paris, Economica; Plan Bleu.
Bakker, K. (2001), “Paying for Water: Water Pricing and Equity in England and Wales”, Transactions of the Institute of British Geographers, Vol.26, pp.143-164.
Baumann, D.D. and Boland, J.J. (1998), “The Case for Managing Urban Water”, in Baumann D.D., Boland J.J and Hanemann, W.M. (eds), Urban Water Demand Management and Planning, pp.1-30, New York, McGraw-Hill.
Becker, D.R., Harris, C.C., McLaughlin W.J., and Nielsen, E.A. (2003), “A Participatory Approach to Social Impact Assessment: the Interactive Community Forum”, Environmental Impact Assessment Review, Vol.23, pp.367-382.
Becker, H.A., Vnclay, F. (eds) (2003), The International Handbook of Social Impact Assessment: Conceptual and Methodological Advances, Cheltenham, Edward Elgar.
Beecher, J.A. (1998), “Integrating Water Supply and Demand Management”, in Baumann D.D., Boland J.J and W.M. Hanemann (eds), Urban Water Demand Management and Planning, pp. 303-324, New York, McGraw-Hill.
Bindra, S.P., Abosh, W. (2001), “Recent Developments in Water Desalination”, Desalination, Vol.136, pp.45-56.
Blockland, M., Braadbaart, O and Schwarz, K. (1999), Private Business. Public Owners: Government Shareholding in Water Enterprises, The Hague, Ministry of Housing, Spatial Planning and the Environment.
Bloomfield, D., Collins, K., Fry, C. and Munton, R. (1998), “Deliberative and Inclusionary Processes: their Contribution to Environmental Governance”, paper presented at the first ESRC “DIPs in environmental decision-making” Seminar, 17th December 1998.
Blue Plan (2001), “Urban Sprawl in the Mediteranean Region”, Working Document, Sophia Antipolis, Blue Plan Regional Activity Centre.
Bolland, D.D. (1998), “Forecasting Urban Water Use: Theory and Principles”, in Baumann, D.D., Boland, J.J. and Hanemann, W.M. (eds), Urban Water Demand Management and Planning, pp.77-94, New York, McGraw-Hill.
Bowman, M. (1996), “On-Site Tertiary Treatment Using Ecomax Systems”, Desalination, Vol 106, pp.305-310.
Bromley, D.W. (1998), “Searching for Sustainability: the Poverty of Spontaneous Order”, Ecological Economics, Vol.24, pp.231-240.
Burkhard, R., Deletic, A. and Craig, A. (2000), “Techniques for Water and Wastewater Management: a Review of Techniques and their Integration in Planning”, Urban Water, Vol.2, pp.197-221.
5. BIBLIOGRAPHY (VOLUMES I AND II)

118 119
Butler, D. and Maksimovic, C. (2001), “Interactions with the environment”, in Maksimovic, C. and Tejada-Guibert J.A.(eds) (2001), Frontiers in Urban Water Management: Deadlock or Hope, pp. 84-142, London, International Water Association (IWA) Publishing.
Centre for Watershed Protection Inc. (CWP) (2000), “The Stormwater Manager’s Resource Centre Factsheets”, Ellicott City, MD, available at: http://www.stormwatercenter.net.
Commission of the European Communities (COMEC) (1996), European Sustainable Cities, Brussels, Expert Group on the Urban Environment, European Commission, DG XI.
Commission of the European Communities (COMEC) (2001), Proposal for a Directive of the European Parliament and of the Council providing for public participation in respect of drawing up of certain plans and programmes relating to the environment and amending Council Directives 85/337/EEC and 96/61/EEC.
Commission of the European Communities (COMEC) (2002), Guidance on Public Participation in relation to the Water Framework Directive - Active involvement, Consultation and Public Access to Information, Common Implementation Strategy Working Group 2.9, Brussels.
Construction Industry Research and Information Association (CIRIA) (2001), C523 Sustainable Urban Drainage Systems - Best Practice Manual, Construction Industry Research and Information Association (CIRIA), UK.
Coombes, P.J. and Kuczera, G. (2002), “Integrated Urban Water Cycle Management: moving towards Systems Understanding”, Proceedings of the 2nd Water Sensitive Urban Design Conference, Brisbane, Australia.
Corral, S. (2000), “Una Metodologya Integrada de Exploraciσn y Comprensiσn de los Procesos de Elaboracion de Politicas Publicas”, EUR 19724 ES, Italy.
COSLA (2002), Focussing on Citizens: A Guide to Approaches and Methods, COSLA, Edinburgh.
Council of the European Communities (CEC) (1991), “Directive Concerning Urban Waste Water Treatment (91/271/EEC)”, Official Journal, Vol. L135, pp.40-52.
Council of the European Communities (CEC) (2000), Directive of the European Parliament and of the Council establishing a Framework for Community Action in the field of Water Policy.
Dalhuisen, J.M., de Groot H.L.F., Rodenburg, C.A. and Nijkamp, P. (2002), “The Economics of Urban Drinking Water Use”, Built Environment, Vol.28 (2), pp.111-123.
De Marchi, B., Funtowicz, S.O., Lo Cascio, S., and Munda, G. (2002), “Combining Participative and Institutional Approaches with Multicriteria Evaluation. An Empirical Study for Water Issues in Troina, Sicily”, Ecological Economics, Vol.34, pp.267-282.
del Moral, L., Pedregal, B., Calvo, M., Paneque, P. (2002), River Ebro Interbasin Water Transfer, Report prepared for ADVISOR project (EVK1-CT-2000-00074), Departamento de Geografia Humana, University of Seville, Spain.
Dziegelewski, B., Opitz, E., Hanemann, W. M. and Mitchell, D.L. (1995), Urban Water Conservation Programmes Volume III: Experience and Outlook for Managing Urban Water Demands, Planning and Management Consultants, Carbondale.
Eduljee, G.H. (2000), “Trends in Risk Assessment and Risk Management”, The Science of the Total Environment, Vol.249, pp.13-23.
Environmental Protection Agency (EPA) Municipal Technology Branch, (1999, 2000, 2001), “Technology Fact Sheets”, available at: http://www.epa.gov/OWM/mtb/mtbfact.htm.
Environmental Protection Agency (EPA) (1998), “USEPA Water Conservation Plan Guidelines, U.S Environmental Protection Agency”, available at: http://www.epa.gov/owm/genwave.htm.
Estrela, T., Marcuello, C. and Iglesias, A. (1996), Water Resources Problems in Southern Europe Topic report 15/96, Copenhagen, Denmark, (EEA) European Environment Agency.
European Environment Agency (EEA) (1995), Europe’s Environment: The Dobris Assessment, Stanners, D. and Burdeau P. (Eds), Copenhagen, Denmark, (EEA) European Environment Agency.
European Environment Agency (EEA) (2000), Sustainable Water Use in Europe - Part 2: Demand Management, Copenhagen, Denmark, (EEA) European Environment Agency.
Food Agriculture Organisation (FAO) (1992), ‘Integrated Management of Coastal Zones’, FAO Fisheries Technical Paper 327, Rome, Food and Agricultural Organisation.
Fox, P. (1999), “Advantages of Aquifer Recharge for a Sustainable Water Supply”, Proceedings of the International Symposium on Efficient Water Use in Urban Areas, IETC. Report 9, Osaka: UNEP International Environmental Technology Centre.
Funtowisz, S.O. and Ravetz, J.R. (1991), “A New Scientific Methodology for Global Environmental Issues”, in Constanza, R. (ed), Ecological Economics, pp.137-152, New York, Columbia.
Gleick, P.H., Wolff, G., Chalecki, E.L., and Reyes, R. (2002), The New Economy of Water. The Risks and Benefits of Globalisation and Privatisation of Fresh Water, Oakland, Pacific Institute.
Global Water Partnership (GWP) (2000), “Integrated Water Resources Management”, TAC Background Papers no 4, Technical Advisory Committee, Stockholm, Global Water Partnership.
Grigg, N.S. (1996), Water Resources Management - Principles, Regulations and Cases, New York, McGraw-Hill.
Guerrieri, L. (2002), “Adaptation Strategies for Improved Flood Management in the Mediterranean”, paper presented at the IUNC Mediterranean Regional Roundtable, Athens Greece, December 2002.
Hall, D. (2001), Water in Public Hands. Public Sector Water Management a Necessary Option, Greenwich, Public Services International.
Hall, D. (2003), Water Multinationals. No Longer Business as Usual, Greenwich, Public Services International.
Hall, D., Lobina, E., Vieiro, O.M. and Maltz, H. (2002), Water in Porto Alegre, Brazil, Greenwich, Public Services International Research Unit.
Hanemann, W.M. (1998), “Price and Rate Structures”, in Baumann D.D., Boland J.J and Hanemann, W.M. (Eds), Urban Water Demand Management and Planning, pp.137-180, New York, Mc Graw-Hill.
Harrop, D.O., Nixon J.A. (1999), Environmental Assessment in Practice, London, Routledge.
Haughton, G. and Hunter, C. (1994), Sustainable Cities, Regional Policy and Development Series 7, Jessica Kingsley, London.
Hengeveld, H. and de Vocht, C. (1982), Role of Water in Urban Ecology, Developments in Landscape Management and Urban Planning, 5, Amsterdam, Elsevier.
Herrington, P.R. (1997), “Pricing Water properly”, in O’Riordan, T. (1997), Ecotaxation, London, Earthscan.
Holmes, T. and Scoones, I. (2000), “Participatory Environmental Policy Processes: Experiences from North and South”, IDS Working Paper no 113, Institute for Development Studies.
Hukka, J.J. and Katko, T.S. (2004), Water Privatisation Revisited. Panacea or Pancake?, Delft, The Netherlands, IRC International Water and Sanitation Centre.
IAP (2000), “Public Participation Spectrum, International Association for Public Participation”, available at: http://www.iap2.org.
IAURIF (1997), “Integrating the Management of Water into Town Planning”, Les Cahiers De l’ IAURIF, Paris, IAURIF.
Institute of Environmental Management and Assessment (IEMA) (2002), “Guidelines on Participation in Environmental Decision-Making”, Perspectives Series, Lincoln, Institute of Environmental Management and Assessment.
International Water Association (IWA) (1999), “Performance Indicators for Water Supply Services”, Operations and Maintenance Specialist Group, International Water Association.
IPTS (1999), “End-Use Technologies and Practices”, METRON Project Report, Seville, European Commission DGXII.
Janssen, R. (1992), Multi-objective Decision Support for Environmental Problems, Dordrecht, Kluwer.
Jefferson, B., Laine, A., Parsons, S., Stephenson T., Judd, S. (1999), “Technologies for Domestic Wastewater Recycling”, Urban Water, Vol.1, pp.285-292.
Joliffe, I.P and Patmann C.R. (1985), ”The Coastal Zone: The Challenge” Journal of Shoreline Management, Vol. 1 (1), pp.3-36.
Kallis, G. and Butler, D. (2001), “The New EU Water Framework Directive: Measures and Implications”, Water Policy, Vol. 3(3), pp.125-142.
Kallis, G. and Coccossis, H. (1999), “Geography of Metropolitan Areas and Use of Water”, METRON Project, University of the Aegean, Mytilini, Greece.
Kallis, G. and Coccossis, H, (2000), “Indicators for Assessing Water Use in Metropolitan Areas”, METRON Project, Mytilini, Greece, University of the Aegean.

120 121
Kallis, G. and Coccossis, H. (2001), Water for the City: Critical Issues and the Challenge of Sustainability, Mytilini, Greece, University of the Aegean.
Kallis, G. and Coccossis, H. (2003), “Managing Water for Athens: from the Hydraulic to the Rational Growth Paradigm”, European Planning Studies, Vol. 11(3), pp.245-261.
Kallis, G. and Coccossis, H. (2004), Barriers to and Conditions for the Involvement of Private Capital and Enterprise on Water Supply and Sanitation: Cross Comparative Report on Environmental Sustainability, PRINWASS Research project, Mytilini, Greece, University of the Aegean.
Kallis, G., Videira, N., Antunes, P. and Santos, R. (2004), Integrated Deliberative Decision Processes for Water Resource Planning and Evaluation. A Guidance Document, European Commission, Lisbon: New University of Lisbon, ECOMAN Centre.
Kaner, S., Lind, L., Toldi, C., Fisk, S. and Berger, D. (1996), Facilitator’s Guide to Participatory Decision-Making, Philadelphia, New Society Publishers.
Konig, K. (1999), “Rainwater Utilisation: Facilities and Equipment, Proceedings of the International Symposium on Efficient Water Use in Urban Areas”, IETC. Report 9, Osaka: UNEP International Environmental Technology Centre.
Kraemer, R.A. (1998), “Public and Private Water Management in Europe”, in Correia F.N. (ed.), Selected Issues in Water Resources Management in Europe, Vol. 2, Rotterdam, A.A. Balkema.
Lambert, A., Hirner, W. (2000), “Losses from Water Supply Systems: Standard Terminology and Recommended Performance Measures”, The Blue Pages, London, International Water Association (IWA) Publishing.
Lee, T., Oliver, J-L., Teniere-Buchot, P-F. and Valiron, F. (2001), Economic and Financial Aspects, in Maksimovic, C. and Tejada-Guibert J.A.(Eds) (2001), Frontiers in Urban Water Management: Deadlock or Hope, pp. 313-343, London, International Water Association (IWA) Publishing.
Lundin, M. (1999), Assessment of Environmental Sustainability of Urban Water Systems, Department of Technical Environmental Planning, Goteborg, Chalmers University of Technology.
Maksimovic, C. and Tejada-Guibert J.A.(eds) (2001), “Frontiers in Urban Water Management: Deadlock or Hope”, London, International Water Association (IWA) Publishing.
Martinez-Allier J., Munda, G. and O’Neill, J. (1998), “Weak Comparability of Values as a Foundation for Ecological Economics”, Ecological Economics, Vol.26, pp.277-286.
Matsui, S., Henze, M., Ho. G. and Otterpohl, R. (2001), “Emerigng paradigms in water supply and sanitation”, in Maksimovic, C. and Tejada-Guibert J.A.(eds) (2001), Frontiers in Urban Water Management: Deadlock or Hope, pp. 229-263, London, International Water Association (IWA) Publishing.
McPherson, M. B. (1979), “Urban Water Balances Considering Conservation”, in ASCE (ed), Water Conservation, pp.28-36.
Mearns and Overmars (2000), Guidelines for Water and Sanitation Utilities, Risk Management Planning: A Disaster Preparedness Approach for Small Island Development States, SOPAC Technical Reports, Suva, Fiji Islands, SOPAC.
Metropolis (1996), Metropolis for the People: Seeking a Solution among the World’s Citizens, Metropolis ’96, April 23-26, Tokyo.
Mouritz, M., Evangelisti, M. and McAlister T. (2003), “Water Sensitive Urban Design”, in National Committee on Water Engineering - Engineers Australia, Australia Run-off Quality, Albury Symposium, 16-17 June, 2003.
Munda, J. (1995), Multicriteria Evaluation in a Fuzzy Environment: Theory and Applications in Ecological Economics, Heidelberg, Physica-Verlag.
Norgaard, R.B. (1992), “Sustainability as Intergenerational Equity: Economic Theory and Environmental Planning”, Environmental Impact Assessment Review, Vol. 12, pp.85-124.
Nunes-Correia, F. (ed) (1998), Institutions for Water Resources Management in Europe, Rotterdam, A.A.Balkema.
OECD (1990), Water Resource Management; Integrated Policies, Paris, (OECD) Organisation for Economic Cooperation and Development.
OECD (1999), “Household Water Pricing in OECD Countries”, GEEI (98)12, Paris, (OECD) Organisation for Economic Cooperation and Development.
OECD (2002), Social Issues in the Provision and Pricing of Water Services, Paris, (OECD) Organisation for Economic Cooperation and Development.
Okubo, D. (1997), The Community Visioning and Strategic Planning Handbook, Denver, CO, The National Civic League.
Opitz, E.M. and Dziegelewski, B. (1998), “Demand Management Methods”, in Baumann D.D., Boland, J.J and Hanemann, W.M. (eds) Urban Water Demand Management and Planning, pp.283-302, New York, McGraw-Hill.
Opitz, E.M., Langowski, J.F., Dziegelewski, B., Hanna-Somers, N.A., Willett. J.S. and Hauer, R. (1998), “Forecasting Urban Water Use: Models and Applications”, in Baumann D.D., Boland, J.J and Hanemann, W.M. (eds) Urban Water Demand Management and Planning, pp.95-135, New York, McGraw-Hill.
Pan American Health Organisation, Regional Office of WHO (PAHO/WHO) (1998), Natural Disaster Mitigation in Drinking Water & Sewage Systems: Guidelines for Vulnerability Analysis, Disaster Mitigation Series.
Parliamentary Commissioner for the Environment (PCE) (2000), Ageing Pipes and Murky Waters. Urban Water System Issues for the 21st century, Wellington, Parliamentary Commissioner for the Environment.
Pimbert, M and Wakeford, T. (2001), “Overview, Deliberative Democracy and Citizen Empowerment”, PLA Notes, Vol. 40, pp.23-28.
Plate, E. J. (2002), Flood Risk and Flood Management, Journal of Hydrology, Vol. 267, pp.2-11.
Rees, J.A. (1998), “Regulation and Private Participation in the Water and Sanitation Sector”, TAC Background Papers No1, Technical Advisory Committee, Stockholm, Global Water Partnership. Rees, J.A. (2002), “Risk and Integrated Water Management”, TAC Background Papers No 6, Technical Advisory Committee, Stockholm, Global Water Partnership.
Rehm B, Schweitz R and Granata, E (1993), “Water quality in the upper Colorado river basin”, in Weisbord, M and International Co-authors, Discovering Common Ground. How Future Search Conferences Bring People Together to Achieve Breakthrough Innovation, Empowerment, Shared Vision, and Collaborative Action, San Francisco, Berrett-Koehler Publishers.
Rogers, P., de Silva, R. and Bhatia, R. (2002), “Water is an Economic Good: How to Use Prices to Promote Equity, Efficiency, and Sustainability”, Water Policy, Vol. 4(1), pp.1-17.
Sakrison (1997), “Water Use in Compact Communities: The Effect of New Urbanism, Growth Management and Conservation Measures on Residential Water Demands”, Ph.D Thesis, Department of Urban Design and Planning, Seattle, Washington, University of Washington.
Sekman, P. (1998), “Local Agenda 21: Substance or Spin”, Journal of Environmental Planning and Management, Vol. 41, 5, pp.533-553.
Semiat R. (2000), “Desalination: Present and Future”, Water International, Vol.25, pp.54-65.
Seppala, O., Hukka, J and Katko, T. (2001), “Public Private Partnerships in Water Services”, Public Works Management and Policy, 6, 1 , pp.42-58.
Slater, S., Marvin, S. and Newson, M. (1994), “Land-use Planning and the Water Sector”, Town Planning Review, Vol. 65 (4), pp.375-397.
Sonnesson, U., Björklund A., Carlsson, M. and Dalemo, M. (2000), “Environmental and Economic Analysis of Management Systems for Biodegradable Waste”, Resources, Conservation and Recycling, Vol.28, pp.29-53.
Spiller (1993), “Strategies for Funding Urban Infrastructure”, Urban Futures, Vol.3 (2), pp.1-9.
Stauth, R., Sowman, M. and Grindley, S. (1993), “The Panel Evaluation Method: An approach to evaluating controversial resource allocation proposals”, Environmental Impact Assessment Review, Vol.13, pp.13-35.
STOA (2000), New Technologies and Cost of Water in view of the Water Framework Directive, Scientific and Technological Options Unity, Luxembourg, European Parliament.
Street, P. (1997), “Scenario Workshops: a Participatory Approach to Sustainable Urban Living?”, Futures, Vol.29 (2), pp.139-158.
Suzenet, G., Kallis, G. and Coccossis, H. (2001), “Sustainable Management of Water for the City: Policy Guidelines”, Mytilini, Greece, University of the Aegean.
Swyngedouw, E., Page, B. and Kaika, M. (2002), Crosscutting Issues in the Water Sector, Project Report, Achieving Participatory Governance: Sustainability and Policy Innovation in a multi-level Context, Oxford, University of Oxford.
Tillman, A.M., Syingby, M. and Lundström, H. (1998), “Life Cycle Assessment of Municipal Waste Water Systems”, International Journal of LCA, Vol. 3 (3), pp.145-157.

122 123
UNEP (2004), “MAESTRO II Directory for Environmentally Sound Technologies”, available at: http://www.unep.or.jp/maestro2.
UNEP/MAP/PAP (1997), Integrated Approach to Development, Management and Use of Water Resources, Split, Priority Actions Programme, Mediterranean Action Plan.
UNEP/MAP/PAP (1999), Conceptual Framework and Planning Guidelines for Integrated Coastal Area and River Basin Management, Split, Priority Actions Programme, Mediterranean Action Plan.
UNEP-IETC. (2000), Proceedings of the International Symposium on Efficient Water Use in Urban Areas- Innovative Ways of Finding Water for Cities, Newsletter and Technical Publications RS9.
UNEP-IETC. (2002), International Source Book on Environmentally Sound Technologies for Wastewater and Stormwater Management, Technical Publications Step 15.
UNEP (1995), Guidelines for Integrated Management of Coastal and Marine Areas, UNEP Regional Seas Reports and Studies No. 161, Nairobi: United Nations Environment Programme.
United Nations Economic Commission for Europe (UNECE) (1998), “Convention on Access to Information, Public Participation in Decision-Making and Access to Justice in Environmental Matters”, United Nations Treaty Collection.
United Nations (2004), “International Strategy for Disaster Reduction, Terminology of Disaster Risk Reduction”, available at: http://www.unisdr.org/eng/library/lib-terminology-eng.
US Commission on Marine Science, Engineering and Resources (1969), Our Nation and the Sea, Washington DC, United States Government Printing Office.
Vatn, A. and Bromley, D.W. (1994), “Choices without Prices without Apologies”, Journal of Environmental Economics and Management, Vol. 26, pp.129-148.
Van Asselt Marjolein, B.A. and N. Rijkens-Klomp (2002), “A look in the mirror: reflection on participation in Integrated Assessment from a methodological perspective”, Global Environmental Change, Vol. 12, pp. 167-184.
Van Tilburg, B. (1997), “Environmental Analysis for choosing between a single or dual domestic water supply”, 5th LCA Case Studies Symposium, December 1997, Brussels: SETAC-Europe.
VEWIN (2000), “Reflections of Performance 2000. Benchmarking in the Dutch Drinking Water Industry”, Rijswijk: The Netherlands Waterworks Association.
Videira, N., Antunes, P., Santos, R., and Gamito, S. (2003), “Participatory Modelling in Environmental Decision-Making: the Rio Formosa Natural Park Case Study”, Journal of Environmental Assessment Policy and Management, Vol. 5(3), pp.421-447.
Vinnerås, B. and Jönsson, H. (2002), “The Performance and Potential of Faecal Separation and Urine Diversion to Recycle Plant Nutrients in Household Wastewater”, Biosource Technology, Vol.84, pp.275-282.
VSC (1999), “Water Sensitive Urban Design”, in Urban Stormwater. Best Practice Environmental Management Guidelines, pp.47-62, Victoria Stormwater Committee, CSIRO Pub.
Walzer, W. (ed) (1996), Community Strategic Visioning Programmes, Westport, Praeger.
Water U.K. (1999), Towards Environmental Sustainability, Report on Indicators.
WCED (1987), Our Common Future, London, Oxford University Press.
Weisbord, M. and 35 International Coauthors (1993), Discovering common ground. How future search conferences bring people together to achieve breakthrough innovation, empowerment, shared vision, and collaborative action, San Francisco, Berrett-Koehler Publishers.
Western Drought Coordination Council (WDCC) (1998), How to Reduce Drought Risk, Preparedness and Mitigation Working Group, Texas.
WHO (2001), Leakage Management and Control, A Best Practice Training Manual, Geneva, World Health Organisation.
WHO/UNICEF (2000), Global Water Supply and Sanitation Assessment 2000 Report, WHO/UNICEF Joint Monitoring Programme for Water Supply and Sanitation.
Wilson, M.A. and Howarth, R.B. (2002), “Discourse-based Valuation of Ecosystem Services: Establishing Fair Outcomes through Group Deliberation”, Ecological Economics, Vol. 41 (3), pp. 431-443.
Wong, A.K. (1999), “Effective Public Participation in the Rate Setting Process: LADWP Blue Ribbon Committee on Rates”, Gleick, P.H and A.K. Wong (eds), Sustainable Use of Water California Success Stories, Oakland, Pacific Institute.
World Resource Institute (1997), “Environmental Indicators: a Systemic Approach to measuring and reporting on environmental policy performance in the context of sustainable development”, Washington D.C., World Resource Institute.
Zabel, T., Milne, I. and McKay, G. (2001), “Approaches adopted by the European Union and selected Member States for the control of urban pollution”, Urban Water, Vol. 3 (1-2), pp.25-32.


Water management is a key factor for sustainable urban development in coastal areas. By the same token, the sustainable urban development of coastal regions is necessary for the sustainable management of scarce Mediterranean water resources. Coastal cities in the Mediterranean are facing significant problems relating to the management of their water resources. Pollution, scarcity, droughts and floods are becoming more frequent and are triggering tensions and conflicts, both within cities and between cities and rural areas. The existing infrastructure is ageing while its replacement is costly. Continuous urbanisation, especially in peri-urban areas, poses costly demands for new infrastructure. Urbanisation pressures are particularly intense on the coast. Assorted activities and competing uses are concentrated in a narrow coastal zone (settlements, infrastructure, various economic activities, ecosystems, etc.). Coastal water resources have particular characteristics that merit a special approach due to the complex interaction between surface waters, groundwater and sea water.
Urban water management in coastal Mediterranean settlements is currently approached as a series of separated tasks: drinking water supply, sewage management and drainage. Many of the current problems are the result of a fragmented approach. There is a need to move to a more integrated management approach whereby the three tasks are managed together and furthermore, in close coordination with urban development and management, coastal zone management and water resource management at the river basin level. These Guidelines represent a response to these issues. The Guidelines are divided into two volumes. Volume I presents the principles and planning for urban water system management, while Volume II presents the most important instruments and tools. Our intention is to facilitate a broader use of these Guidelines. Our intention is to facilitate a broader use of these Guidelines. Volume I thoroughly explains the problems relating to integrated urban water system management, while the Volume II presents the tools and techniques needed for management in more detail. Accordingly, the Volume I is intended for all those who wish to get to know the problems of integrated urban water system management, while the Volume II is intended for those who wish to engage in the solutions to these problems.
The Regional Activity Centre for the Priority Actions Programme (PAP/RAC) is part of the Mediterranean Action Plan (MAP) of the United Nations Environment Programme (UNEP). PAP/RAC is focused on practical activities which are expected to yield immediate results contributing to the protection and enhancement of the
Mediterranean coastal environment, and to the strengthening of national and local capacities for integrated coastal area management. PAP/RAC co-operates with a large number of specialised organisations in the UN system (UNEP, FAO, IMO, UNESCO, IOC, WHO, IAEA, WTO, UNDP), financial institutions (World Bank, European Investment Bank) and other international organisations (European Union, Council of Europe), and national and local authorities in the Mediterranean region.