Urban Water Security Research Alliance Technical … · Figure 9: Schematic diagram of reservoir...
28
Evaporation Reduction by Manipulation of Surface Area to Volume Ratios: Overview, Analysis and Effectiveness David McJannet, Freeman Cook, and Stewart Burn July 2008 Urban Water Security Research Alliance Technical Report No. 8
Transcript of Urban Water Security Research Alliance Technical … · Figure 9: Schematic diagram of reservoir...

Evaporation Reduction by Manipulation of Surface Area to Volume Ratios: Overview, Analysis and Effectiveness
David McJannet, Freeman Cook, and Stewart Burn
July 2008
Urban Water Security Research AllianceTechnical Report No. 8
Urban Water Security Research Alliance Technical Report ISSN 1836-5566 (Online) Urban Water Security Research Alliance Technical Report ISSN 1836-5558 (Print)
The Urban Water Security Research Alliance (UWSRA) is a $50 million partnership over five years between the Queensland Government, CSIRO’s Water for a Healthy Country Flagship, Griffith University and The University of Queensland. The Alliance has been formed to address South-East Queensland's emerging urban water issues with a focus on water security and recycling. The program will bring new research capacity to South-East Queensland tailored to tackling existing and anticipated future issues to inform the implementation of the Water Strategy.
For more information about the: UWSRA - visit http://www.urbanwateralliance.org.au/Queensland Government - visit http://www.qld.gov.au/Water for a Healthy Country Flagship - visit www.csiro.au/org/HealthyCountry.htmlThe University of Queensland - visit http://www.uq.edu.au/Griffith University - visit http://www.griffith.edu.au/
Enquiries should be addressed to:
The Urban Water Security Research Alliance PO Box 15087 CITY EAST QLD 4002
Ph: 07-3247 3005; Fax: 07-3405 0373 Email: [email protected]
Citation: McJannet, D., Cook, F. and Burn, S. Evaporation reduction by manipulation of surface area to volume ratios: overview, analysis and effectiveness. CSIRO: Water for a Healthy Country National Research Flagship. Urban Water Security Research Alliance Technical Report No. 8.
Copyright and Disclaimer
© 2008 CSIRO To the extent permitted by law, all rights are reserved and no part of this publication covered by copyright may be reproduced or copied in any form or by any means except with the written permission of CSIRO.
Disclaimer:
The partners in the UWSRA advise that the information contained in this publication comprises general statements based on scientific research and does not warrant or represent the accuracy, currency and completeness of any information or material in this publication. The reader is advised and needs to be aware that such information may be incomplete or unable to be used in any specific situation. No action shall be made in reliance on that information without seeking prior expert professional, scientific and technical advice. To the extent permitted by law, UWSRA (including its Partner’s employees and consultants) excludes all liability to any person for any consequences, including but not limited to all losses, damages, costs, expenses and any other compensation, arising directly or indirectly from using this publication (in part or in whole) and any information or material contained in it.
Cover Image:
Description: Bathymetry of Wivenhoe Reservoir in south-east Queensland. © 2008 CSIRO

Evaporation Reduction by Manipulation of Surface Area to Volume Ratios: Overview, Analysis and Effectiveness Page iii
ACKNOWLEDGEMENTSFunding for this research was provided by the Urban Water Security Research Alliance.
SEQ Water allowed access to SEQ Water data which was kindly supplied by Badin Gibbes and David Lockington from University of Queensland. We thank Peter Hairsine and John Knight for their constructive reviews of this report.
Evaporation Reduction by Manipulation of Surface Area to Volume Ratios: Overview, Analysis and Effectiveness Page iv
FOREWORDWater is fundamental to our quality of life, to economic growth and to the environment. With its booming economy and growing population, Australia's South-East Queensland (SEQ) region faces increasing pressure on its water resources. These pressures are compounded by the impact of climate variability and accelerating climate change.
The Urban Water Security Research Alliance, through targeted, multidisciplinary research initiatives, has been formed to address the region’s emerging urban water issues.
As the largest regionally focused urban water research program in Australia, the Alliance is focused on water security and recycling, but will align research where appropriate with other water research programs such as those of other SEQ water agencies, CSIRO’s Water for a Healthy Country National Research Flagship, Water Quality Research Australia, eWater CRC and the Water Services Association of Australia (WSAA).
The Alliance is a partnership between the Queensland Government, CSIRO’s Water for a Healthy Country National Research Flagship, The University of Queensland and Griffith University. It brings new research capacity to SEQ, tailored to tackling existing and anticipated future risks, assumptions and uncertainties facing water supply strategy. It is a $50 million partnership over five years.
Alliance research is examining fundamental issues necessary to deliver the region's water needs, including:
� ensuring the reliability and safety of recycled water systems. � advising on infrastructure and technology for the recycling of wastewater and stormwater. � building scientific knowledge into the management of health and safety risks in the water supply
system. � increasing community confidence in the future of water supply.
This report is part of a series summarising the output from the Urban Water Security Research Alliance. All reports and additional information about the Alliance can be found at http://www.urbanwateralliance.org.au/about.html.
Chris Davis Chair, Urban Water Security Research Alliance

Evaporation Reduction by Manipulation of Surface Area to Volume Ratios: Overview, Analysis and Effectiveness Page v
CONTENTSAcknowledgements ............................................................................................................. iiiForeword .............................................................................................................................. iv1. Introduction ................................................................................................................. 12. Mechanism for reducing evaporation........................................................................ 13. Review of existing studies ......................................................................................... 14. Desktop analysis description..................................................................................... 25. Desktop analysis results ............................................................................................ 5
5.1. Bathymetric analysis of shape modification....................................................................... 5
6. Potential effects of storage water quality and biology .......................................... 127. Social impacts ........................................................................................................... 128. Suggestions for further research ............................................................................ 129. Key Messages............................................................................................................ 13References .......................................................................................................................... 13Appendix A - Theoretical shape analysis......................................................................... 14
Basic shape representation ............................................................................................................14Half pyramid representation ...........................................................................................................18Application of pyramid representation to Wivenhoe Dam...............................................................19

Evaporation Reduction by Manipulation of Surface Area to Volume Ratios: Overview, Analysis and Effectiveness Page vi
LIST OF FIGURES Figure 1: Surface area modification for a given volume of water and its effect of surface area to
volume ratios. ....................................................................................................................................1Figure 2: Bathymetric data from Wivenhoe Dam. .............................................................................................6Figure 3: Surface area and volume relationship for Wivenhoe Dam.................................................................7Figure 4: Bathymetric contour maps used to identify large areas of shallow water in the 70-90%
capacity range and the 50-70% capacity range. Colours represent 1m contour widths. Grey area represents dam areas above the capacity range and black areas represent areas below the capacity range. ............................................................................................................................8
Figure 5: Bathymetric contour maps used to identify large areas of shallow water in the 30-50% capacity range and the 10-30% capacity range. Colours represent 1m contour widths. Grey area represents dam areas above the capacity range and black areas represent areas below the capacity range. ............................................................................................................................9
Figure 6: Bathymetric contour map for the 10-50% capacity range. Region highlighted in green represents area where effects of partitioning of shallow water on evaporation will be tested. Colours represent 1m contour widths. Grey area represents dam areas above the capacity range and black areas represent areas below the capacity range. .................................................10
Figure 7: Difference in surface area and volume relationship for Wivenhoe Dam from original to modified shape. ...............................................................................................................................11
Figure 8: Time series of dam volume for the original and modified dam shape illustrating the long-term effects of the proposed modification. ...............................................................................................11
Figure 9: Schematic diagram of reservoir profiles for a rectangular reservoir (a) and a triangular reservoir. .........................................................................................................................................14
Figure 10: Relationship between H and, a) A and b) V for rectangular and triangular profiles of with D = 20m and unit length for L. The horizontal dashed line represents equivalent surface area and vertical dashed lines represent corresponding storage volumes. .............................................15
Figure 11: The cumulative loss of water from reservoirs with characteristics given in Table 1, a) when the area is kept constant and the angle varied and b) when the volume is kept constant and the angle varied. ..............................................................................................................................17
Figure 12: Schematic of idealised reservoir shape using a half pyramid. Reservoir wall, top and side views are shown along with angles and lengths used in the analysis..............................................18
Figure 13: Cumulative water evaporated for Scenarios 1, 2 and 3 over a 10 year period assuming the same surface area as a starting point..............................................................................................20
Figure 14: Cumulative water evaporated for Scenarios 1, 2 and 3 over a 10 year period assuming the same surface volume as a starting point. ........................................................................................20
LIST OF TABLES Table 1: Values of parameters used in Scenario 1 and 2 to derive data in Figure 11. ................................... 16

Evaporation Reduction by Manipulation of Surface Area to Volume Ratios: Overview, Analysis and Effectiveness Page 1
1. INTRODUCTION
Unprecedented drought conditions and a growing population are putting pressure on the water supplies of south-east Queensland (SEQ). Water management authorities are assessing all possible means by which to create a sustainable water supply in the region. This report has been prepared for the SEQ Urban Water Security Research Alliance for the purposes of assessing the potential for using adjustments to reservoir surface area to volume ratios to reduce evaporation. This report forms one of a group of reports which each assess the applicability of different evaporation mitigation techniques to south-east Queensland water supply systems.
2. MECHANISM FOR REDUCING EVAPORATION
The volume of water lost from a water body through evaporation is controlled by the rate of evaporation and the surface area of the water exposed to the atmosphere. Any change to the surface area of the water transfers directly into a change in evaporation volume, i.e. 20% reduction in surface area results in a 20% reduction in evaporation volume. The volume of evaporation is so strongly controlled by surface area that the opportunity exists to exploit this factor so as to reduce evaporation. For a given water storage, reducing the surface area for the available volume of water is a way to achieve this. This is illustrated in Figure 1 where the effect of changing to the configuration from the left hand design to the right hand design would be a 75% reduction in evaporation volume.
Figure 1: Surface area modification for a given volume of water and its effect of surface area to volume ratios.
3. REVIEW OF EXISTING STUDIES
While manipulation of the surface area to volume ratios is often mentioned in the evaporation mitigation literature, we can find no examples of application or testing on large scale storages. A number of authors have proposed different shape configurations for minimising evaporation (Burton, 1962; Doyle, 1953; Hamilton and Jepson, 1940; Pazzi, 1963) but all of these have been for small scale storages. These configurations are also more relevant to situations where the entire dam is constructed using earthworks and excavations (see Fietz (1970) for overview). In such situations excavated earth can also be used as wind breaks which can also be used to reduce evaporation.
Other research which has suggested that shape modification may be able to help reduce evaporation has come from the work of Condie and Webster (1995) and Dalton et al. (2001). These studies present designs where the depth is maximised to minimise the surface area exposed to the atmosphere and some costs of construction and productivity gains are used to work out repayment times for such designs. Once again, however, this work is relevant to farm dam situations.
1 m
4 m
5 m5 m
10 m
10 m
Volume = 100 m3
Upper Surface area= 100 m2
Surface Area/Volume = 1
Volume = 100 m3
Upper Surface area = 25 m2
Surface Area/Volume = 0.25
Evaporation Reduction by Manipulation of Surface Area to Volume Ratios: Overview, Analysis and Effectiveness Page 2
Realisation of the importance of using deeper dams with lower surface area to volume ratios has even led one author (Leech, 1969) to assess the suitability of using nuclear blasts to excavate huge areas. With reference to large storages, Frenkiel (1965) recommends using dikes to partition off shallow areas; one of the approaches we will assess in this report.
4. DESKTOP ANALYSIS DESCRIPTION
The desktop analysis undertaken includes two main components, a theoretical analysis of area to volume ratios for contrasting shapes, and an analysis of a particular dam modification based on bathymetric data for Wivenhoe Dam. The theoretical analysis is used to assess the impacts of changing shapes on the surface area to volume ratio and to assess the applicability of certain techniques for achieving shape changes. To keep the main body of the report as simple as possible the vast majority of the theoretical analysis has been included in Appendix A at the end of this report; the key findings only are present in the main text. The theoretical analysis provided information relevant to the modification of existing dams and the importance of choosing the right site for proposed dams. This simple analysis is thus used to guide the techniques tested in the applied section of this analysis which will use bathymetric data.
In order to assess the potential of surface area to volume modifications to reduce evaporation from a large storage, we have chosen to use Wivenhoe Dam as an example test case. At full capacity this dam has a volume of 1,165,000 ML and a surface area of 109km2. Once a potential treatment was identified (see process below) bathymetric data were modified to reflect the required shape modification to be implemented. This modified bathymetric dataset is then used to undertake an analysis of the net effect of the identified treatment on dam volume for a given period. A time series of storage depth ( Z , in m) produced by SEQ Water for Wivenhoe Dam for the period between 10/01/1994 and 26/02/2008 was used as the basis for the analysis.
Using storage curves for the existing dam, a corresponding time series of dam volume (V , in ML) and surface area ( A , in km2) was produced. Next, the equilibrium temperature evaporation model (see description below) was used to produce a corresponding time series of evaporation rate (mm/d) using climatic data for this area from the SILO database (Jeffrey et al., 2001). Multiplying surface area for a given day by the evaporation rate on the same day, it was possible to construct a time series of evaporation volume losses ( ET , in ML). Subtracting the storage volume from the previous day (
0TV )
from the day of interest (1TV ) gave the change in volume between days ( � �1 0T TV �� ). Then, by
subtracting the volume of evaporation on the previous day (0TET ) it was possible to calculate a change
in storage discharge (balance of rainfall, leakage, and dam releases) between the two days ( � �1 0T TD �� ,
in ML).
The next step was to use the volume of the dam at the first time step (0TV ) to work out an equivalent
depth in the modified version of Wivenhoe Dam. This was achieved by using volume-to-depth storage curves which were produced for the modified dam using Surfer (Golden Software, v8). The depth in the modified dam at the first time step (
0
MODTZ ) was then converted to a surface area (
0
MODTA ) using the
depth-to-area storage curves for the modified dam. By multiplying the surface area by the evaporation for that day, a corresponding evaporation volume (
0
MODTET ) was calculated. On the next day, the
volume of the dam (1
MODTV ) was calculated by adding the difference between change in discharge for
the existing dam ( � �1 0T TD �� ) and evaporation volume from the previous day 0
MODTET . This makes the
assumption that the change in discharge was the same for the original and modified dam scenarios. The volume for this day (
1
MODTV ) was then used to calculate depth (
1
MODTZ ) and area (
1
MODTA ), which
was in turn used to calculate evaporation volume ( 1MOD
TET ).
Evaporation Reduction by Manipulation of Surface Area to Volume Ratios: Overview, Analysis and Effectiveness Page 3
This process was then repeated through the entire data record to create a time series of volume for the modified dam which could be compared to the existing dam for the purposes of assessing the effects of the proposed dam modification.
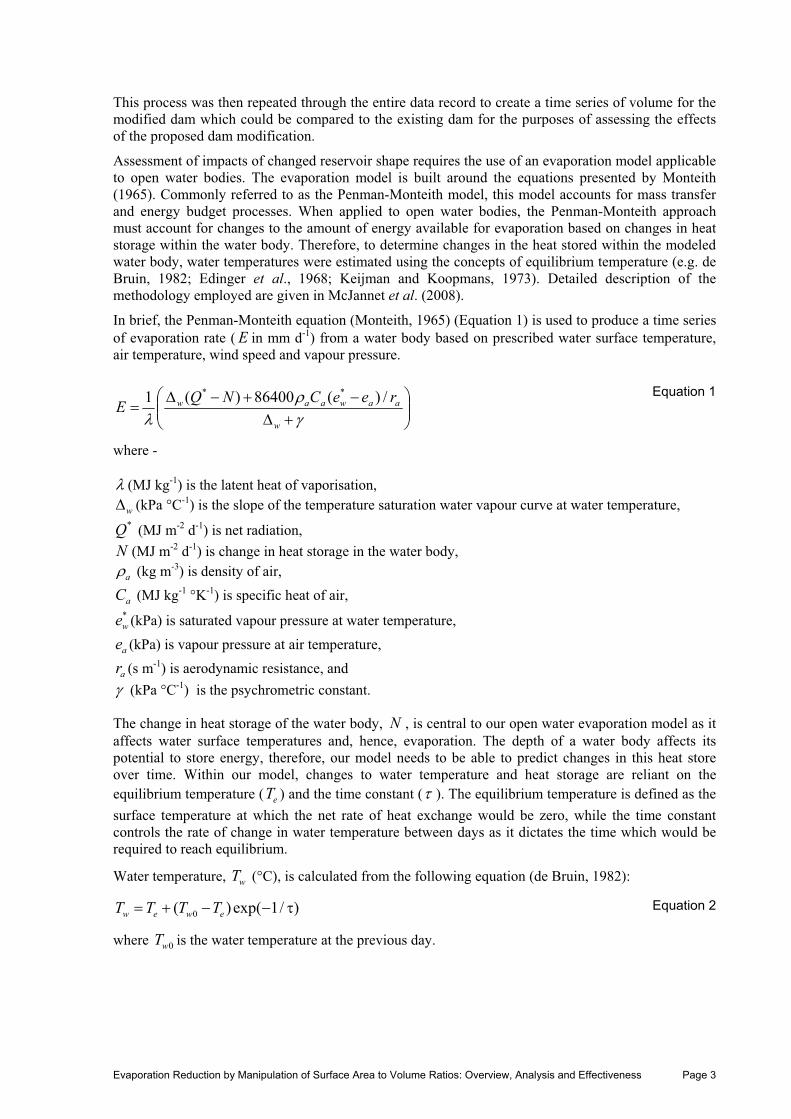
Assessment of impacts of changed reservoir shape requires the use of an evaporation model applicable to open water bodies. The evaporation model is built around the equations presented by Monteith (1965). Commonly referred to as the Penman-Monteith model, this model accounts for mass transfer and energy budget processes. When applied to open water bodies, the Penman-Monteith approach must account for changes to the amount of energy available for evaporation based on changes in heat storage within the water body. Therefore, to determine changes in the heat stored within the modeled water body, water temperatures were estimated using the concepts of equilibrium temperature (e.g. de Bruin, 1982; Edinger et al., 1968; Keijman and Koopmans, 1973). Detailed description of the methodology employed are given in McJannet et al. (2008).
In brief, the Penman-Monteith equation (Monteith, 1965) (Equation 1) is used to produce a time series of evaporation rate ( E in mm d-1) from a water body based on prescribed water surface temperature, air temperature, wind speed and vapour pressure.
���
�
� �
� ���
��
� w
aawaaw reeCNQE /)(86400)(1 ** Equation 1
where -
� (MJ kg-1) is the latent heat of vaporisation, w� (kPa °C-1) is the slope of the temperature saturation water vapour curve at water temperature, *Q (MJ m-2 d-1) is net radiation,
N (MJ m-2 d-1) is change in heat storage in the water body, a� (kg m-3) is density of air,
aC (MJ kg-1 °K-1) is specific heat of air, *we (kPa) is saturated vapour pressure at water temperature,
ae (kPa) is vapour pressure at air temperature,
ar (s m-1) is aerodynamic resistance, and � (kPa °C-1) is the psychrometric constant.
The change in heat storage of the water body, N , is central to our open water evaporation model as it affects water surface temperatures and, hence, evaporation. The depth of a water body affects its potential to store energy, therefore, our model needs to be able to predict changes in this heat store over time. Within our model, changes to water temperature and heat storage are reliant on the equilibrium temperature ( eT ) and the time constant (� ). The equilibrium temperature is defined as the surface temperature at which the net rate of heat exchange would be zero, while the time constant controls the rate of change in water temperature between days as it dictates the time which would be required to reach equilibrium.
Water temperature, wT (°C), is calculated from the following equation (de Bruin, 1982):
0( ) exp( 1/ )w e w eT T T T� � � � Equation 2
where 0wT is the water temperature at the previous day.

Evaporation Reduction by Manipulation of Surface Area to Volume Ratios: Overview, Analysis and Effectiveness Page 4
The Equilibrium temperature, eT (°C), is calculated from the following equation (de Bruin, 1982):
*
34 ( 273.15) ( )( )n
e nn n
QT TT f U� �
� �
Equation 3
where -
nT (°C) is the wet-bulb temperature,
nQ* (MJ m-2 d-1) is the net radiation at wet-bulb temperature, � (MJ m-2 °K-4 d-1) is the Stefan-Boltzmann constant,
( )f U (MJ m-2 d-1 kPa-1) is the wind function (see below), and
n� (kPa °C-1) is the slope of the temperature saturation water vapour curve at air temperature.
The time constant,� , in days is calculated as follows (de Bruin, 1982):
34 ( 273.15) ( )( )w w
n n
C ZT f U
��� �
� �
Equation 4
where -
w� (kg m-3) is the density of water,
wC (MJ kg-1 °K-1) is the specific heat of water, and Z (m) is the depth of water.
The wind function, ( )f U , is used in heat budget studies to define the evaporation rate from which latent heat loss is calculated. Studies from a number of different sized water bodies suggest that the evaporation coefficient should be not only a function of wind speed, but also of water body size. It seems that water body size affects the aerodynamic resistance to evaporative mass transfer. As air flows from the land to over the water, the surface roughness reduces abruptly. The turbulence in the air flow gradually adjusts itself to this change at increasing distances from the shore. Further, as water is being gradually evaporated into the air flow, the humidity of the air increases downwind from the shore. Both of these effects tend to cause variation in evaporation rate over the water surface and so with water body size (area). For this model we use the area adjusted wind function developed by McJannet et al (In Prep):
0.0510( ) (6.79+3.92 )f U A U�� Equation 5
where -
10U (m s-1) is the wind speed at 10m height, and A (m2) is the area of the water body.
The primary source of meteorological data is the SILO database which consists of interpolated meteorological variables on a 0.05° (5 km) grid for the whole of Australia (Jeffrey et al., 2001). The climate variables from SILO used by the evaporation model were air temperature, vapour pressure, and solar radiation. For evaporation modelling the SILO data drill was used to extract data relevant to the water body location. Wind speed data was taken from the nearest Bureau of Meteorology station.
Evaporation Reduction by Manipulation of Surface Area to Volume Ratios: Overview, Analysis and Effectiveness Page 5
5. DESKTOP ANALYSIS RESULTS
As a precursor to analysis of the effects of shape modification on evaporation we undertook a detailed theoretical shape analysis using a series of two and three dimensional shapes. Details of this analysis are included in Appendix A. This analysis illustrated how it is possible to reduce evaporative losses for a volume of water by changing the shape of the storage in which it is contained. A three dimensional half pyramid type representation was used to explore the costs and evaporation reductions which could be expected from a storage of similar dimensions as Wivenhoe Dam.
However, the main conclusion of this analysis is that large scale shape modification through deepening of very large storages is not a viable option. The scale of the modifications makes the cost of water savings extremely large with very long periods of time required before financial investment is realised (>250 years).
As suggested by Frenkiel (1965) it seems that more localised partitioning of shallow areas using earth walls could be a better approach. Partitioning using walls would require far less earthworks for a given change of surface area than large scale excavations, although there will be some loss of storage capacity for structures designed not to be over topped. The most obvious location to look for shallow areas would be in the dendritic ‘arms’ of the storage, however these areas are also the input pathways for streams draining the catchment and engineering works to allow water to continue to flow through any type of partitioning barrier would add significant additional cost. A more suitable location for a partitioning barrier could then be shallow areas through which no stream flow occurs. Such modifications are the subject of the following section.
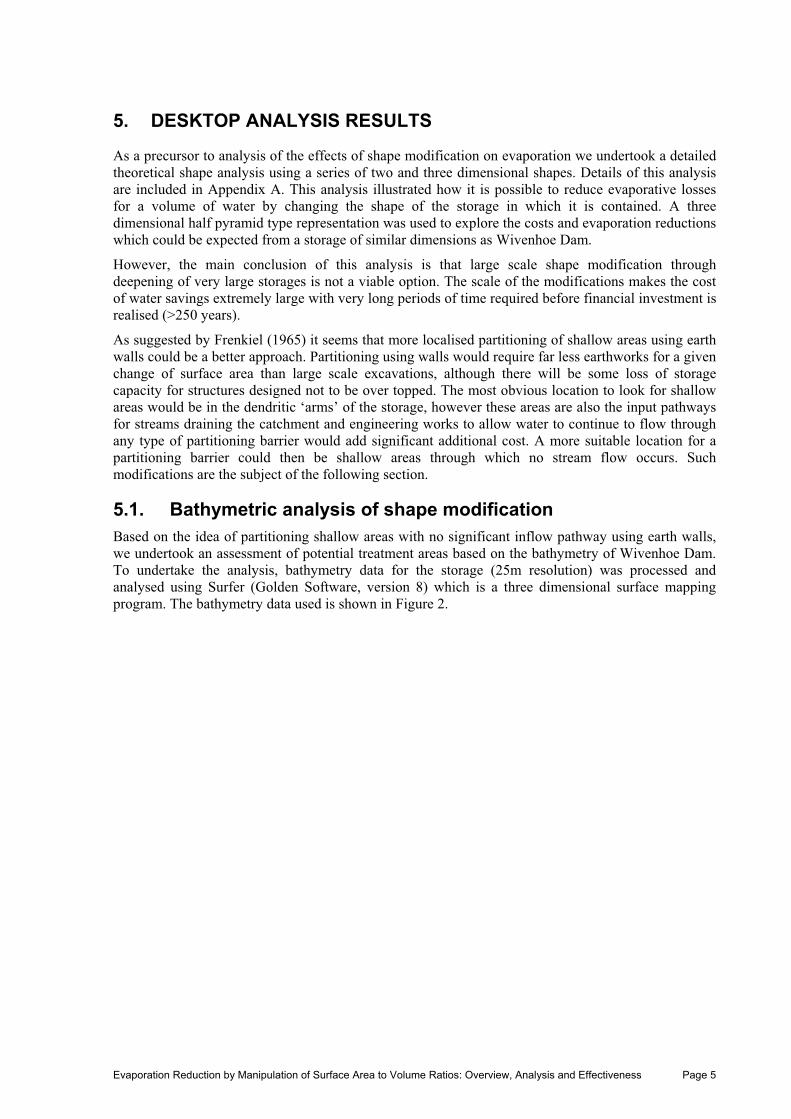
5.1. Bathymetric analysis of shape modification Based on the idea of partitioning shallow areas with no significant inflow pathway using earth walls, we undertook an assessment of potential treatment areas based on the bathymetry of Wivenhoe Dam. To undertake the analysis, bathymetry data for the storage (25m resolution) was processed and analysed using Surfer (Golden Software, version 8) which is a three dimensional surface mapping program. The bathymetry data used is shown in Figure 2.
Evaporation Reduction by Manipulation of Surface Area to Volume Ratios: Overview, Analysis and Effectiveness Page 6
Figure 2: Bathymetric data from Wivenhoe Dam.
The first step in the analysis was to look at the relationship between surface area and volume for the entire dam in order to determine if certain stages of storage in the dam offered more opportunities for modification of surface area to volume ratios than others. The results of this analysis are shown in Figure 3. This figure shows that the relationship between surface area and volume for this storage is essentially linear. This result suggest that the valley in which the Wivenhoe Dam sits is essentially ‘V’ shaped and that there appears to be little information to suggest that a certain stage of storage is better suited to shape modification than others. It should be remembered, however, that Figure 3 represents the average condition for the dam and that more detailed scrutiny of the bathymetric data may still reveal areas suitable for modification.

Evaporation Reduction by Manipulation of Surface Area to Volume Ratios: Overview, Analysis and Effectiveness Page 7
0
200
400
600
800
1000
0 20 40 60 80 100
Area (km2)
Vol
ume
(GL)
Figure 3: Surface area and volume relationship for Wivenhoe Dam.
To more carefully identify the location of areas of shallow water (i.e. where the potential exists to modify the dam shape) a detailed analysis of contour bands at different storage capacities was undertaken. For this analysis it was assumed that the zones greater than 90% capacity and less than 10% capacity were not of interest. The remaining zone was divided into 4 bands; each covering 20% of the dam storage capacity. Within each of these bands we tried to identify areas with widely spaced contours (i.e. areas of larger surface area to volume ratio) that covered significant areas.
The data used for analysis in the 70 to 90% and 50 to 70% capacity zones is shown in Figure 4 where different contour colours represent 1m depth changes. From this figure it can be seen that there are no large areas where contour bands are widely spaced for either the 70 to 90% or 50 to 70% capacity ranges.
Evaporation Reduction by Manipulation of Surface Area to Volume Ratios: Overview, Analysis and Effectiveness Page 8
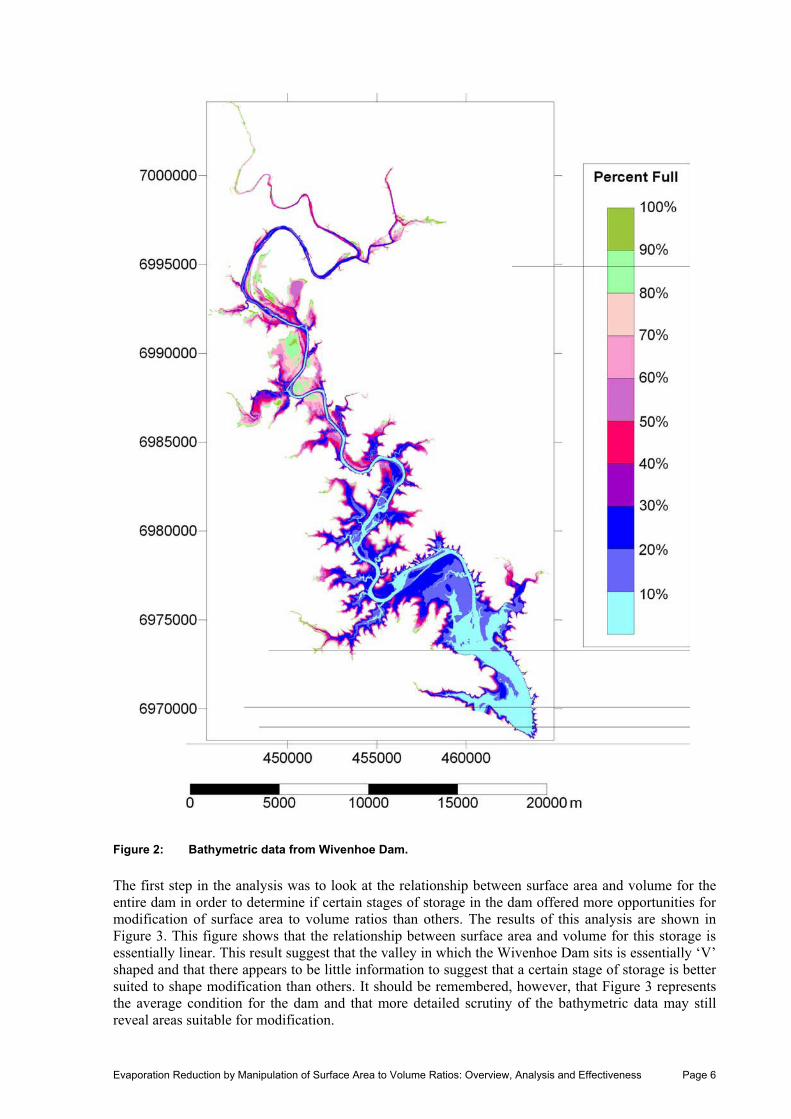
Figure 4: Bathymetric contour maps used to identify large areas of shallow water in the 70-90% capacity range and the 50-70% capacity range. Colours represent 1m contour widths. Grey area represents dam areas above the capacity range and black areas represent areas below the capacity range.
Figure 5 shows the same analysis for the 30 to 50% and 10 to 30% capacity ranges.
In these figures, one reasonably sized area stands out as having widely spaced contours. This area is identified in Figure 5 by the red arrows.

Evaporation Reduction by Manipulation of Surface Area to Volume Ratios: Overview, Analysis and Effectiveness Page 9
Figure 5: Bathymetric contour maps used to identify large areas of shallow water in the 30-50% capacity range and the 10-30% capacity range. Colours represent 1m contour widths. Grey area represents dam areas above the capacity range and black areas represent areas below the capacity range.
Based on this identified area, a zone for treatment was identified and is shown in Figure 6. For the purposes of this analysis the bathymetric data within this zone were set to a height above the 100% capacity level, thereby effectively removing this area from the dam storage. This is representative of an earth wall which is designed to not be over-topped. To enable such a modification to be achieved the construction of a wall approximately 10 km long with an average height of 15m would be necessary. These figures are based on a full water supply capacity and not a full flood mitigation capacity which would mean that in reality this wall should in fact be higher. Ignoring logistics, costs or feasibility of such an exercise, we can proceed to analyse the effects of this modification on long-term dam storage.

Evaporation Reduction by Manipulation of Surface Area to Volume Ratios: Overview, Analysis and Effectiveness Page 10
Figure 6: Bathymetric contour map for the 10-50% capacity range. Region highlighted in green represents area where effects of partitioning of shallow water on evaporation will be tested. Colours represent 1m contour widths. Grey area represents dam areas above the capacity range and black areas represent areas below the capacity range.
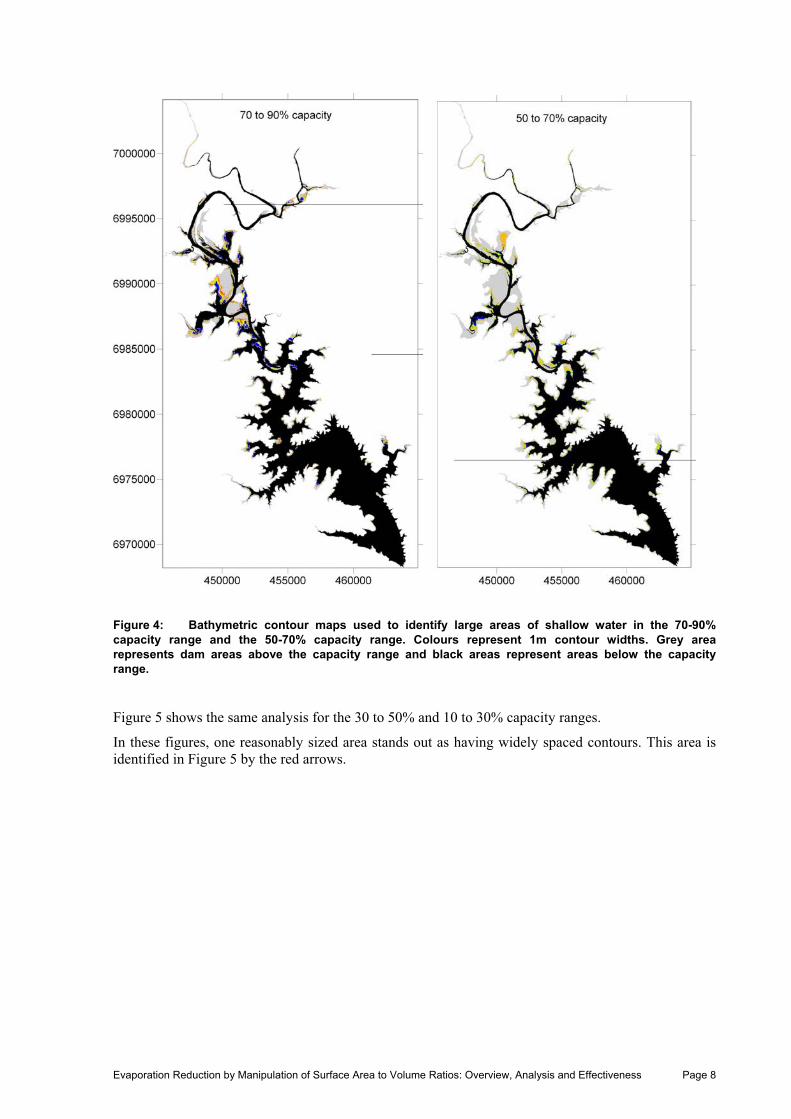
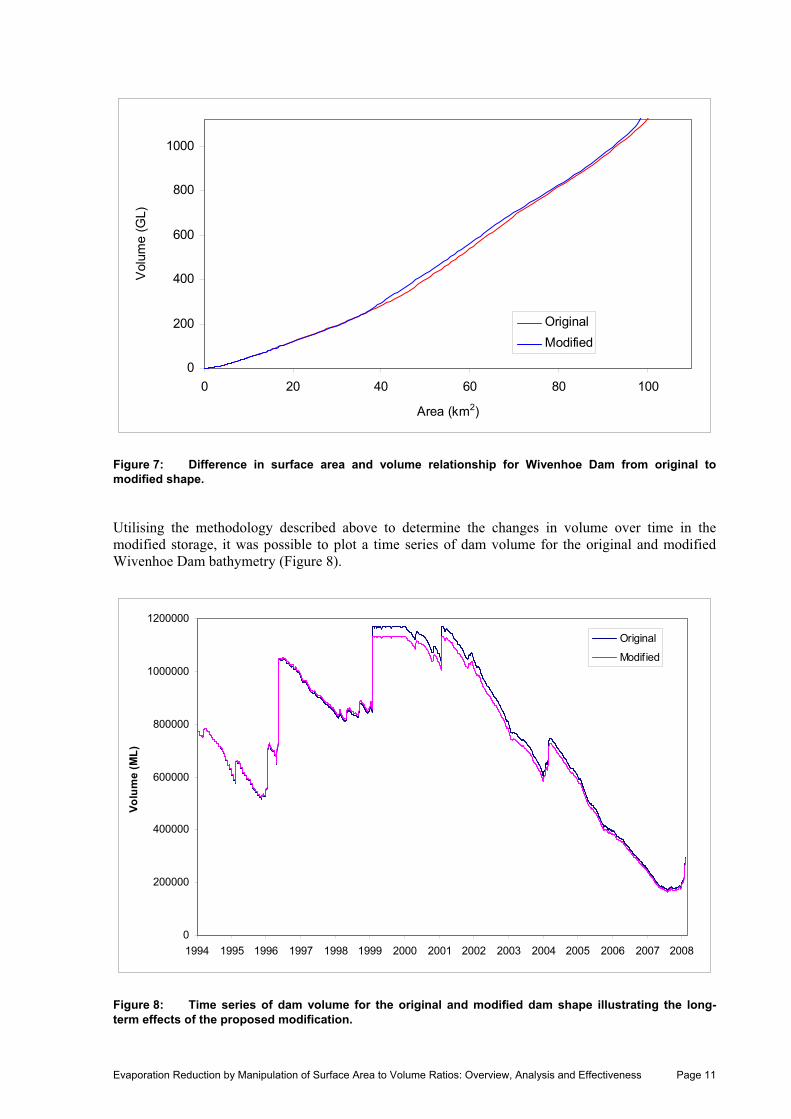
Using the modified bathymetric data it was then possible to look at the resulting changes to the relationship between surface area and dam volume Figure 7. The result is an increase in the volume stored per unit area for storage levels with a surface area greater than 40 km2.
Evaporation Reduction by Manipulation of Surface Area to Volume Ratios: Overview, Analysis and Effectiveness Page 11
0
200
400
600
800
1000
0 20 40 60 80 100
Area (km2)
Vol
ume
(GL)
OriginalModified
Figure 7: Difference in surface area and volume relationship for Wivenhoe Dam from original to modified shape.
Utilising the methodology described above to determine the changes in volume over time in the modified storage, it was possible to plot a time series of dam volume for the original and modified Wivenhoe Dam bathymetry (Figure 8).
0
200000
400000
600000
800000
1000000
1200000
1994 1995 1996 1997 1998 1999 2000 2001 2002 2003 2004 2005 2006 2007 2008
Volu
me
(ML)
Original
Modif ied
Figure 8: Time series of dam volume for the original and modified dam shape illustrating the long-term effects of the proposed modification.

Evaporation Reduction by Manipulation of Surface Area to Volume Ratios: Overview, Analysis and Effectiveness Page 12
From this figure it is possible to estimate the actual effect of the dam modification on stored water volume. For the first five years of record the modified dam has a volume that is becoming increasingly greater than that of the original configuration although the differences are not large. During 1999 inflows to the dam were such that the existing dam reached capacity. The interesting thing to note here, however is that the modified dam reaches capacity at a lower volume because the overall volume of the dam has been reduced by the shape modification. The net result of this is that once inflows drop again the amount of water in the modified dam is less than that in the original dam. It then takes about 7 years for the volume of the modified dam to return to that of the existing dam through evaporation savings. At the end of the simulation period the volume of storage in the modified dam is roughly equal to that of the existing dam so there has been no net benefit.
There are three main reasons why the modification did not result in any net increase in volume over the duration of the analysis. Firstly, the modification resulted in a reduction of the volume of the dam at full capacity. This meant that the modified dam had a lower volume once inflows to the dam dropped off and capacity was less than 100 % again. Secondly, the area of the zone of treatment relative to total dam surface area at a given water depth was only small meaning that evaporation reductions were not very significant. The largest area reduction through the modification was just 5%. Thirdly, the reduction in evaporation results in an increase in dam depth which, because of the dam shape, results in a slight increase in surface area and hence evaporation. While not larger than the evaporation saving the slight increase in evaporation reduces the overall effectiveness.
Without even taking into account the logistics or extremely high costs of such an exercise there are some key lessons that can be learnt from this analysis. The sheer size of this storage, and others similar to this in south-east Queensland, means that to expect any significant reduction in evaporation, very large surface areas need to be excluded from the storage. To produce evaporation savings that are a significant proportion of the 430 GL supplied to south-east Queensland each year (SEQ Water 2005 figures) costs are likely to be astronomical. Therefore, while there are likely to be real benefits to be realised through modification of volume to surface area ratios for small storages it is highly unlikely that such modifications will yield the same benefits for large storages because of the scale of the water bodies in question.
6. POTENTIAL EFFECTS OF STORAGE WATER QUALITY AND BIOLOGY
The potential impacts of surface area to volume ratio modifications on storage water quality and biology will be minimal as long as appropriate earthwork precautions are employed. Some enhanced delivery of sediment is to be expected during construction but this will be minimal when considered with respect to the life of the works. There has also been some suggestion that keeping water deeper for longer may result in the production of more pronounced stratification (Burston et al., 2005) but for this to happen the modifications would need to encompass a large proportion of the total dam volume. It is unlikely that any biological process are likely to be affected by the types of modifications that are feasible on large storages.
7. SOCIAL IMPACTS
The social impacts of surface area to volume modifications are likely to be greatest when storages have recreational uses. Construction of new walls may require exclusion zones and the total area for recreation will be reduced. Other than this, social impacts are likely to be minimal.
8. SUGGESTIONS FOR FURTHER RESEARCH
Based on the results of this analysis for Wivenhoe Dam, it is highly likely that decreasing evaporation from large storages in south-east Queensland through reducing surface area to volume ratios will not be cost effective. Such techniques are probably best suited to smaller storages where more detailed research and testing is definitely warranted. Unless large storages have very significant proportions of

Evaporation Reduction by Manipulation of Surface Area to Volume Ratios: Overview, Analysis and Effectiveness Page 13
their total area as shallow water then it is unlikely that any adjustments will be economically or technically feasible.
9. KEY MESSAGES
Through this desktop based approach to assessing the effectiveness of modifying surface area to volume ratios for reducing evaporation, several key messages have evolved:
� Modifying surface area to volume ratios for major storages in south-east Queensland is unlikely to yield significant or cost effective evaporation volume reductions.
� Reducing surface area to volume ratios is a viable means by which to reduce evaporation but issues of scale make such techniques best suited to small storages.
� A scenario for reducing surface area to volume ratios through shallow water partitioning was assessed for Wivenhoe Dam and no net benefit was achieved over a ~14 year analysis period.
� While small increases in dam volume were realised for extended periods, over the 14 year analysis period the net savings were more than cancelled out by the reduced storage capacity of the dam.
REFERENCESBurston, I., Grynberg, H., Finnigan, J., Webster, I., Simmonds, C. and Milnes, T., 2005. Review of cost
effective systems to minimise water losses by evaporation from mine site process water storages. Job No AMI613, EWL Sciences Pty Ltd.
Burton, J.R., 1962. Water storage on flat country. Wool Technology and Sheep Breeding, 9(1): 31-38. Condie, S.A. and Webster, I.T., 1995. Evaporation mitigation from on-farm water storages. Technical
Report No. 90, CSIRO Centre for Environmental Mechanics. Dalton, P., Raine, S. and Broadfoot, K., 2001. Best management practices for maximising whole farm
irrigation efficiency in the Australian cotton industry. . Final Report for CRDC project NEC2C, National Centre for Engineering in Agriculture Publication 179707/2, USQ, Toowoomba.
de Bruin, H.A.R., 1982. Temperature and energy balance of a water reservoir determined from standard weather data of a land station. Journal of Hydrology, 59: 261-274.
Doyle, A.B., 1953. Engineering in primary production. Journal of the Institute of Engineers Australia, 25(9): 163-174.
Edinger, J.E., Duttweiler, D.W. and Geyer, J.C., 1968. The response of water temperature to meteorological conditions. Water Resources Research, 4: 1137-1143.
Fietz, T.R., 1970. Engineering aspects of evaporation reduction for small water storages. Report No. 33, Water Research Foundation of Australia Limited.
Frenkiel, J., 1965. Evaporation reduction. Physical and chemical principles and review of experiments. UNESCO Arid Zone Research, Paris, 79 pp.
Hamilton, C.L. and Jepson, H.G., 1940. Stock water developments: Wells, springs and ponds. Farmers Bulletin No.1859, US Department of Agriculture.
Jeffrey, S.J., Carter, J.O., Moodie, K.B. and Beswick, A.R., 2001. Using spatial interpolation to construct a comprehensive archive of Australian climate data. Environmental Modelling and Software with Environment Data News, 16(4): 309-330.
Keijman, J.Q. and Koopmans, R.W.R., 1973. A comparison of several methods of estimating evaporation of Lake Flevo, Hydrology of lakes. IAHS publication no 109, Helsinki, pp. 225-232.
Leech, T.D.J., 1969. Diffusion blasting and its potential for the development of Australia's inland surface water resources. Journal of the Institute of Engineers Australia, 41: 165-173.
McJannet, D.L., Webster, I.T. and Cook, F.J., In Prep. An evaporative wind function for open water bodies of variable size. Water Resources Research.
McJannet, D.L., Webster, I.T., Stenson, M. and Sherman, B., 2008. A method to estimate open water evaporation losses across the Murray Darling Basin. CSIRO Science Report.
Monteith, J.L., 1965. Evaporation and the environment. In: G.E. Fogg (Editor), The state and movement of water in living organisms. Cambridge University Press, London.
Pazzi, J.J.O., 1963. The building of farm dams. Bulletin No. 365, Department of Agricultural and Technical Services.

Evaporation Reduction by Manipulation of Surface Area to Volume Ratios: Overview, Analysis and Effectiveness Page 14
APPENDIX A - THEORETICAL SHAPE ANALYSIS
Basic shape representation Consider two reservoirs, one with a profile which is described by a rectangle with a width D and the other with a triangular profile with an angle of slope from the horizontal of � (Figure 9).
Figure 9: Schematic diagram of reservoir profiles for a rectangular reservoir (a) and a triangular reservoir.
The relationship between the depth (H), area (A), volume (V) and volume to area ratio (V/A) for the rectangular profile is given by:
.. .
A D LV H D LV HA
��
�
Equation 6
where L is distance along the profile (projection into the page).
For the triangular profile A, H and V/A are given by:
2
2 . tan(90 )tan(90 )
2
A L HV LHV HA
�
�
� �
� �
�
Equation 7
We will assume that L is unit length and hence is 1. Note that if A/V is plotted against H, then the relationship is a straight line. This means that the slope of A/V versus H will be constant (slope = 1 for rectangular, slope = 2 for triangular). This will determine what kind of profile the reservoir has. Most reservoirs are likely to have slopes somewhere between these two extremes as they are likely to be more trapezoidal in profile, hence the following equation applies:
� �/ 1 tan(90 ) / 2 tan(90 )V A H H D H� �� �� � � �� �Equation 8
D
H
�
H
ab

Evaporation Reduction by Manipulation of Surface Area to Volume Ratios: Overview, Analysis and Effectiveness Page 15
The departure from a triangle towards a rectangle is described by the slope of A/V versus H. This slope may be a useful descriptor of the average cross-sectional profile of a reservoir. The affect of this change in shape towards a rectangle is illustrated in Figure 10 where A and V are plotted as functions of H. In this figure, three triangular representations with � = 10°, 20° and 30° area used. This analysis shows that for the same surface area a deeper reservoir stores more water. The next thing to assess is the rate of change in volume and area with H for these given shapes. This can be found by differentiating Equation 7 with respect to H (Equation 9).
a
H (m)
0 2 4 6 8 10 12
A (m
2 )
0
20
40
60
80
100
120
Triangular, � = 10o
Triangular, � = 20o
Triangular, � = 30o
b
H (m)
0 2 4 6 8 10 12
V (m
3 )
0
100
200
300
400
500
600
Figure 10: Relationship between H and, a) A and b) V for rectangular and triangular profiles of with D = 20m and unit length for L. The horizontal dashed line represents equivalent surface area and vertical dashed lines represent corresponding storage volumes.

Evaporation Reduction by Manipulation of Surface Area to Volume Ratios: Overview, Analysis and Effectiveness Page 16
/ 2 . tan(90 )/ 2 . . tan(90 )//
dA dH LdV dH L HdV dH HdA dH
��
� �� �
�
Equation 9
We consider that the depth change is only due to evaporation at the water surface and use the above relationships to investigate the effect of angle on the cumulative loss from reservoirs. For illustrative purposes two scenarios were considered:
1. The area of the triangular sections was constant and the angle varied from 10° to 30°, which will result in the initial volumes varying.
2. The volume was constant and the angle will vary from 10° to 30°, which will result in the initial surface area varying.
The values used in this analysis are given in Table 1.
Table 1: Values of parameters used in Scenario 1 and 2 to derive data in Figure 11.
� = 10° � = 20° � = 30° V
(m3 m-1)
A(m2 m-1)
H(m)
V(m3 m-1)
A(m2 m-1)
H(m)
V(m3 m-1)
A(m2 m-1)
H(m)
1 1984 150 13.22 4095 150 27.30 6495 150 43.30
2 1000 150.6 13.28 1000 104.8 19.10 1000 83.2 24.03
Figure 11a shows what happens if the surface area of storages is the same and the angle is steeper (scenario 1). In this case, although more water is stored in the reservoir with the high angle (30°), the amount being lost to evaporation is always higher. This is because the surface area for this situation remains larger as the depth decreases compared to the lower angle reservoir (10°). The second example (Figure 11b) shows that if the volume is kept constant and the angle increased then the reservoir depth will increase and surface area will decrease. The cumulative loss due to evaporation will now decrease with the angle of the reservoir due to the initially smaller surface area. This means that if reservoirs have the same volume but one is deeper and steeper, storing water in the steeper angled reservoir will reduce evaporative losses.

Evaporation Reduction by Manipulation of Surface Area to Volume Ratios: Overview, Analysis and Effectiveness Page 17
a
Time (day)
0 100 200 300 400 500C
umul
ativ
e vo
lum
e lo
ss (m
3 m-1
)
0
50
100
150
200
250
300
350
angle = 10o
angle = 20o
angle = 30o
b
Time (day)
0 100 200 300 400 500
Cum
ulat
ive
volu
me
loss
(m3 m
-1)
0
50
100
150
200
250
300
350
Figure 11: The cumulative loss of water from reservoirs with characteristics given in Table 1, a) when the area is kept constant and the angle varied and b) when the volume is kept constant and the angle varied.
The examples given above are for reservoirs that do not change their depth over the length of the reservoir and are like troughs. This is unlikely, so a further idealised reservoir based on a half pyramid is also analysed.

Evaporation Reduction by Manipulation of Surface Area to Volume Ratios: Overview, Analysis and Effectiveness Page 18
Half pyramid representation We can consider an idealised reservoir as equivalent of a pyramid sliced in half (Figure 12). This idealised reservoir can then be used to investigate the effects of changing the surface area and angles on the evaporation losses from a reservoir.
Figure 12: Schematic of idealised reservoir shape using a half pyramid. Reservoir wall, top and side views are shown along with angles and lengths used in the analysis.
The surface area (Sm), angles and volume (Vm) of the reservoir when full ( H = Hm) are given by:
. / 2. . / 6,
m m
m m m
S D LV D H L
��
Equation 10
and the angles in Figure 12 are given by:
� �� �� �
1
1
1
tan 2 /
tan / 2
tan /
m m
m
m
H D
D L
H L
�
�
�
�
�
�
�
�
�
Equation 11
As the water level in the reservoir decreases, the depth of water at the reservoir wall (H) decreases from Hm to 0. The decrease in H also means the length of the water in the reservoir (xm) decreases as does the width at the reservoir (D). These new values can be easily calculated from the reservoir full values and the angles as follows.
�
�
Dm
L
Hm
Hm
Hm
L
�
Dm
Side view
Top view
Reservoir wall
Dm

Evaporation Reduction by Manipulation of Surface Area to Volume Ratios: Overview, Analysis and Effectiveness Page 19
/ tan . /2 / tan . /
m m
m m
x H H L HD H H D H
��
� �� �
Equation 12
The surface area (S) and volume (V) in the reservoir as a function H are then given by:
2 2
3 2
( ) . . /(2 )
( ) . . / 6 . . /(6 )m m
m m m
S H H L D HV H H D x H D L H
�
� �
Equation 13
From the relationships in Equation 11 and Equation 12 it can be shown that the angle � is constant with H.
Application of pyramid representation to Wivenhoe Dam For Wivenhoe Dam we have data on the maximum depth (Hm), the maximum surface area (Sm) and the maximum volume (Vm). Using these values an estimate of Dm.L can be obtained from Sm, and Vm to see how applicable this simple description is. The results for Wivenhoe are Dm.L = 2.04x10⁸ m2 from the maximum surface area and Dm.L = 1.78x10⁸ m2 from the maximum volume. This indicates that Wivenhoe deviates about 15% from the half prism representation.
Assuming a value for Dm of 4,500m and using the value of Dm.L derived from the volume, a value of Lwas estimated as 39.6 km. These values were used as the base values for estimating the effects of changing the shape of the Wivenhoe Dam on losses due to evaporation. Calculations were made with evaporation being the only processes that lowers the water level so that this effect alone can be studied. A constant evaporation rate of 5mm per day was used and this then lowers the depth of the reservoir (H) by this amount on a daily basis. The volume evaporated during this day is calculated from the surface area multiplied by the evaporation rate and the cumulative volume lost to evaporation (CEt) is the sum with time.
Three scenarios where assessed:
1. The base case - Dm = 4500m, L = 39.6 km, Hm = 40.2m, Sm = 89 km2, and Vm = 1194 GL
2. Reduced width to reduce surface area - Dm = 3000m, L = 39.6 km, Hm = 40.2m, Sm = 59 km2,and Vm = 796 GL
3. Increased depth to increase volume - Dm = 4500m, L = 39.6 km, Hm = 60m, Sm = 89 km2, and Vm= 1783 GL
As expected from the simple analysis of the profile shape described above, the greatest CEt loss occurred for Scenario 3 when starting area was kept constant (Figure 13). The steeper angle in Scenario 3 means that the surface area does not reduce at the same rate as the other scenarios as water level drops. Perhaps a more realistic scenario is to assess how the same volume of water in the three different dam configurations would reduce over time, this is shown in Figure 14. From this analysis we can see that the evaporative loss from the storage that has been deepened (Scenario 3) is much less than the other scenarios, this is because the same volume has a much smaller surface area than the other configurations. Interestingly, Scenario 2 resulted in an increase in evaporative loss due to the interplay of volume and surface area for this configuration which actually leads to a higher surface area for the same volume when compared to the baseline scenario.

Evaporation Reduction by Manipulation of Surface Area to Volume Ratios: Overview, Analysis and Effectiveness Page 20
Day
0 1000 2000 3000 4000
CEt (
GL)
0
200
400
600
800
1000
1200
Scenario 1Scenario 2Scenario 3
Figure 13: Cumulative water evaporated for Scenarios 1, 2 and 3 over a 10 year period assuming the same surface area as a starting point.
Day
0 1000 2000 3000 4000
CEt (
GL)
0
100
200
300
400
500
600
Scenario 1Scenario 2Scenario 3
Figure 14: Cumulative water evaporated for Scenarios 1, 2 and 3 over a 10 year period assuming the same surface volume as a starting point.
Evaporation Reduction by Manipulation of Surface Area to Volume Ratios: Overview, Analysis and Effectiveness Page 21
After 10 years the cumulative volume evaporated is 458, 506 and 370 GL for Scenarios 1 to 3 respectively when the same starting volume of 750 GL is used. Scenario 3 represents an evaporation volume saving of about 20%. The percentage difference in evaporation volume between Scenario 1 and 3 for ten years remains at approximately 20% regardless of the starting volume. Taking Scenario 1 with a surface area of 75km2 (the average for the last 14 years) and an annual evaporation rate of 1,560mm the volume loss to evaporation would be approximately 117 GL. Making the assumption that Scenario 3 would result in 20% less evaporation volume we arrive at a saving of 23.4 GL/year.
To move from Scenario 1 to Scenario 3 a total of 588 million m3 of earth needs to be excavated and taken off site. If we assume a cost of $20/m3 the total cost of these earthworks would be approximately $8 billion. Based on these costs, it would take approximately 250 years before the cost of water saved from deepening the reservoir was within the $1.20 - $1.50/KL range estimated for the Gold Coast desalination plant (http://www.waterforever.com.au/_uploads/67_Desalination.pdf).
It should be noted that the scenarios we discuss above do not take into account the impact of changing the total storage volume. While evaporation savings may be possible by increasing the angle of slope from the horizontal, �, to reduce surface area, this needs to be considered in light of the potential loss of storage capacity and the long term implications of this. It is highly unlikely that any management strategy that resulted in a major reduction in the total storage capacity would be implemented. Clearly, for a reservoir of this size, excavation to deepen the storage would be out of the question due to logistics and costs of excavation and material transport.
Another alternative would be to create a number of terraced banks around the storage using cut and fill methods. The aim of this would be to increase the depth of the water at a given volume, however the length of earthworks involved in such modifications would be extremely large and the change in surface area relative to the entire surface area at a given depth would be insignificant unless terraces were very large. Due to these factors, this option is unlikely to produce evaporation savings at a reasonable cost.

Urban Water Security Research Alliance
www.urbanwateralliance.org.au