Transportation Impact Fees - Official Website - City of Bellingham, WA
Upload
duongkhanhCategory
view
216download
0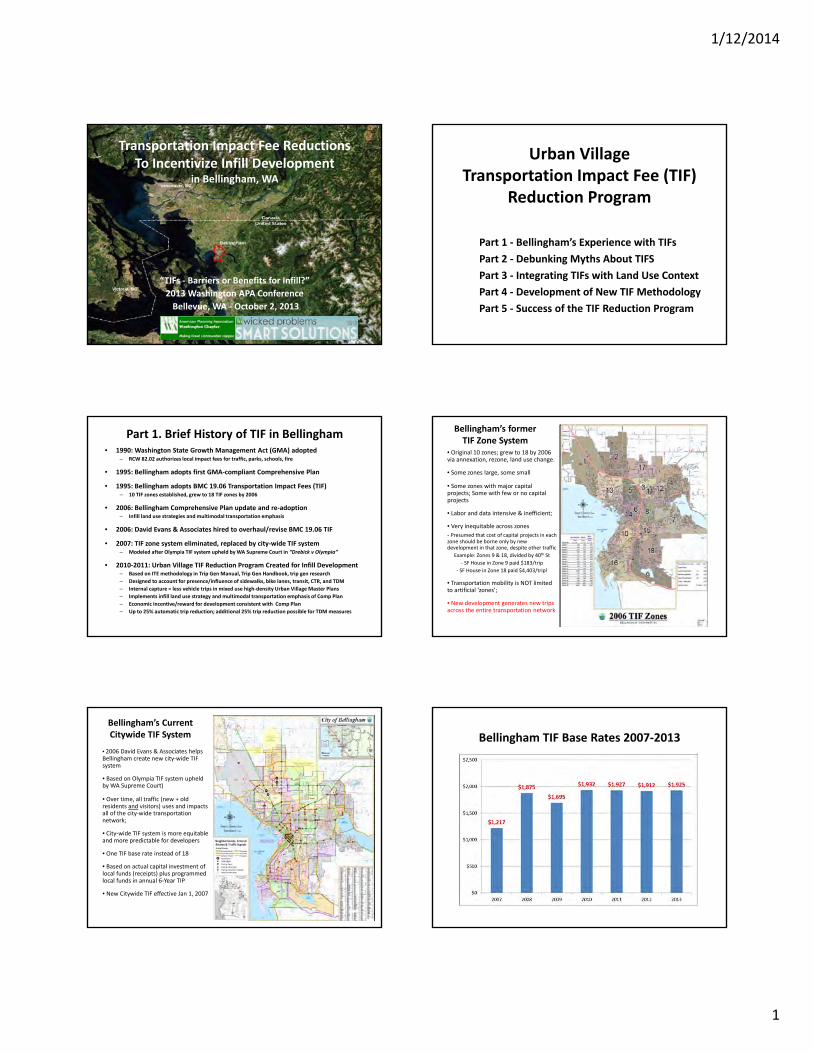
1/12/2014
1
Transportation Impact Fee ReductionsTo Incentivize Infill Development
in Bellingham, WA
“TIFs ‐ Barriers or Benefits for Infill?”
2013 Washington APA Conference
Bellevue, WA ‐ October 2, 2013
Urban VillageTransportation Impact Fee (TIF)
Reduction Program
Part 1 ‐ Bellingham’s Experience with TIFs
Part 2 ‐ Debunking Myths About TIFS
Part 3 ‐ Integrating TIFs with Land Use Context
Part 4 ‐ Development of New TIF Methodology
Part 5 ‐ Success of the TIF Reduction Program
Part 1. Brief History of TIF in Bellingham • 1990: Washington State Growth Management Act (GMA) adopted
– RCW 82.02 authorizes local impact fees for traffic, parks, schools, fire
• 1995: Bellingham adopts first GMA‐compliant Comprehensive Plan
• 1995: Bellingham adopts BMC 19.06 Transportation Impact Fees (TIF)– 10 TIF zones established, grew to 18 TIF zones by 2006
• 2006: Bellingham Comprehensive Plan update and re‐adoption– Infill land use strategies and multimodal transportation emphasis
• 2006: David Evans & Associates hired to overhaul/revise BMC 19.06 TIF
• 2007: TIF zone system eliminated, replaced by city‐wide TIF system– Modeled after Olympia TIF system upheld by WA Supreme Court in “Drebick v Olympia”
• 2010‐2011: Urban Village TIF Reduction Program Created for Infill Development– Based on ITE methodology in Trip Gen Manual, Trip Gen Handbook, trip gen research
– Designed to account for presence/influence of sidewalks, bike lanes, transit, CTR, and TDM
– Internal capture = less vehicle trips in mixed use high‐density Urban Village Master Plans
– Implements infill land use strategy and multimodal transportation emphasis of Comp Plan
– Economic incentive/reward for development consistent with Comp Plan
– Up to 25% automatic trip reduction; additional 25% trip reduction possible for TDM measures
Bellingham’s former TIF Zone System
• Original 10 zones; grew to 18 by 2006 via annexation, rezone, land use change.
• Some zones large, some small
• Some zones with major capital projects; Some with few or no capital projects
• Labor and data intensive & inefficient;
• Very inequitable across zones ‐ Presumed that cost of capital projects in each zone should be borne only by new development in that zone, despite other traffic
Example: Zones 9 & 18, divided by 40th St
‐ SF House in Zone 9 paid $183/trip
‐ SF House in Zone 18 paid $4,403/trip!
• Transportation mobility is NOT limited to artificial ‘zones’;
• New development generates new trips across the entire transportation network
Bellingham’s Current Citywide TIF System
• 2006 David Evans & Associates helps Bellingham create new city‐wide TIF system
• Based on Olympia TIF system upheld by WA Supreme Court)
• Over time, all traffic (new + old residents and visitors) uses and impacts all of the city‐wide transportation network;
• City‐wide TIF system is more equitable and more predictable for developers
• One TIF base rate instead of 18
• Based on actual capital investment of local funds (receipts) plus programmed local funds in annual 6‐Year TIP
• New Citywide TIF effective Jan 1, 2007
Bellingham TIF Base Rates 2007‐2013

1/12/2014
2
Part 2. Debunking Myths About TIFsNegative Perspectives Are Not Supported By Facts
“Well no wonder businesses are leaving Bellingham for Ferndale!"General unhappy attitude expressed by uninformed applicants when they discover that they are
required to pay a Transportation Impact Fee for the peak hour vehicle trips produced by their project
“City fees seen as barrier to downtown Bellingham growth"July 5, 2012 ‐ Bellingham Business Journal
"Fighting to limit economic consequences of transportation impact fees"The Bellingham/Whatcom Chamber of Commerce & Industry currently (2013) has the following listed as a "Core Competency" of the Chamber on its web site http://bellingham.com/about‐the‐chamber
"I think that's phenomenal, I didn't expect something so logical to come from the city." Government Affairs Director, Whatcom County Association of Realtors after learning about Bellingham's Urban Village TIF Reduction Program
October 25, 2010 ‐ Bellingham Herald
How Bellingham TIFs Compare in Western WA
• 2012 Study of 60 cities + 5 counties in Western WA that charge TIF
‐ Graph excludes Sammamish, WA ($14,707/trip)
• 2013 Average TIF = $2,880/trip
• 2013 Median TIF = $2,466/trip
• 2013 Bellingham TIF = $1,925/trip TIF Base Rate = 66% of Western WA avg
TIF Base Rate = bottom 30% of all jurisdictions in Western WA
Urban Village TIF Rate = bottom 25% of all jurisdictions in Western WA
• Locally, Bellingham invests more in multimodal transportation infrastructure, but charges less TIF per trip than both
Ferndale ($2,698) and
Lynden ($1,997)
Bellingham = Lowest 2013 TIF Rate in Whatcom County Bellingham Annual TIF Revenue 2004 through 2012
$889,224 $907,063
$592,093
$872,615
$656,620 $637,812
$779,463
$572,788
$912,904
$0
$100,000
$200,000
$300,000
$400,000
$500,000
$600,000
$700,000
$800,000
$900,000
$1,000,000
2004 2005 2006 2007 2008 2009 2010 2011 2012
Chart 3. Citywide Percent of Actual Transportation Investments (2005 ‐ 2010) Compared to Collected TIF Revenue (2005 – 20101)
[12010 TIF Revenue Collected Through October 21, 2010]
0.0% 10.0% 20.0% 30.0% 40.0% 50.0% 60.0% 70.0% 80.0% 90.0% 100.0%
2005
2006
2007
2008
2009
2010
17.8%
8.2%
11.9%
10.6%
14.2%
18.1%
82.2%
91.8%
88.1%
89.4%
85.8%
81.9%
Local Funds Construction Cost TIF Revenue Collected
Percent of Actual and Planned Transportation Investments (2000 ‐ 2016) Compared to Projected TIF Revenue (2010 – 2032) in Urban Villages
0.0% 10.0% 20.0% 30.0% 40.0% 50.0% 60.0% 70.0% 80.0% 90.0% 100.0%
Fairhaven
Fountain
N. Samish Way
City Center
Old Town
Barkley
7.9%
82.7%
77.0%
80.0%
75.6%
18.9%
92.1%
17.3%
23.0%
20.0%
24.4%
81.1%
TIF Funds (2010 ‐ 2032) City Funds (2000 ‐ 2016)

1/12/2014
3
Transportation Improvements Constructed in Downtown Bellingham Since 2002
Who Should Pay the Costs of Growth?Q. New development and businesses or the City tax‐payers? A. BOTH because transportation benefits accrue to both
Part 3.TIF Adjustments for Local Realities
Integration of: ‐ Land Use & Transportation Policy;‐ Economic Development; and‐ Local Politics
Slide 16
Bellingham, WA “City of Subdued Excitement”
Whatcom’s Regional Center
• City limits = 81,000 residents
• Urban Growth Area = 11,000 pop.
• 45%Whatcom County 201,140 pop.
• Seat of Whatcom County government
• 18 of Top 25 employers in County
• Bellingham International Airport
• 3 universities (WWU, WCC, BTC)
• Major regional hospital (St Joseph)
• Restaurants, Pubs, Social Places
• Theaters & performing arts centers
• Parks and Recreational Facilities
Slide 17Slide 18
Washington’s Regulatory Tools for Transportation
• Multimodal Concurrency: Sidewalks, bike lanes, transit service, and arterial improvements;
• TIA (Traffic Studies): Traffic signals, turn lanes, safety, connectivity of non‐motorized facilities;
• Street Frontage Standards: Sidewalks, bike lanes, street trees, ADA‐ramps;
• Transportation Impact Fee:Recoup portion of City’s capital investment in citywide multimodal transportation network.

1/12/2014
4
Slide 19
Traditional HCM “Level of Service” (LOS) is Auto‐centric
Slide 20
Land Use Goals Several compact mixed use
“Urban Villages” adopted in
Comp Plan Land Use Element‐ Downtown Bellingham‐ Fairhaven District
‐ Barkley Village
‐ Old Town Village
‐ Samish Way Village
‐ Fountain District
‐ Future Waterfront District
All of Bellingham’s Urban Villages are well‐ connected with
High‐frequency (15 min) transit
ADA Pedestrian Sidewalks
Marked Arterial Bike Lanes
Multi‐use “Greenways” Trails
Multimodal Arterial Streets
Ease of Walking
0
1,000
2,000
3,000
4,000
5,000
6,000
7,000
8,000
9,000
Residents Currently (2010)Living Within 1/4‐mile
(5‐min) Walk of Urban Villages
Non‐Motorized Facilities
Pedestrian Master Plan• Approved August 2012
• Defines 266‐mile “primary pedestrian network”
• 170 miles (64%) complete
• Identifies pedestrian needs
• Prioritizes improvements
Bicycle Master Plan• Planning effort 2013‐2014
• 63 miles existing bike lanes
• 62 miles of planned bike lanes
• Will further define 125‐mile (+) bicycle network
• Will identify bicycle needs
• Will prioritize improvements
Multiuse Greenways Trails• Extensive citywide trail system
• 65 existing trail milesSlide 22
Slide 23
Bellingham’s Multimodal Transportation Mode Shift Goals
TG‐28: Set target goals to increase the mode share of pedestrian, bicycle, and transit trips and reduce automobile trips as a percentage of total trips, as listed below.
Mode 20041 20102 20152 20222
Auto 87% 84% 80% 75%Transit 2% 3% 4% 6%Bike 3% 4% 5% 6%Ped 8% 9% 11% 13%
Notes: 1. 2004 raw data from FTA/Social Data Study2. City/WTA recommendations based on 2004 raw data from FTA/Social Data Study
Walking11% Bicycling
5%
Public Transit
3%
Private Auto81%
2004 Mode Share Measurements
Walking13%
Bicycling6%
Public Transit
6%
Private Auto75%
2022 Mode Share Goals
Bellingham's "Complete Streets" Approach to Transportation Planning
1/12/2014
5
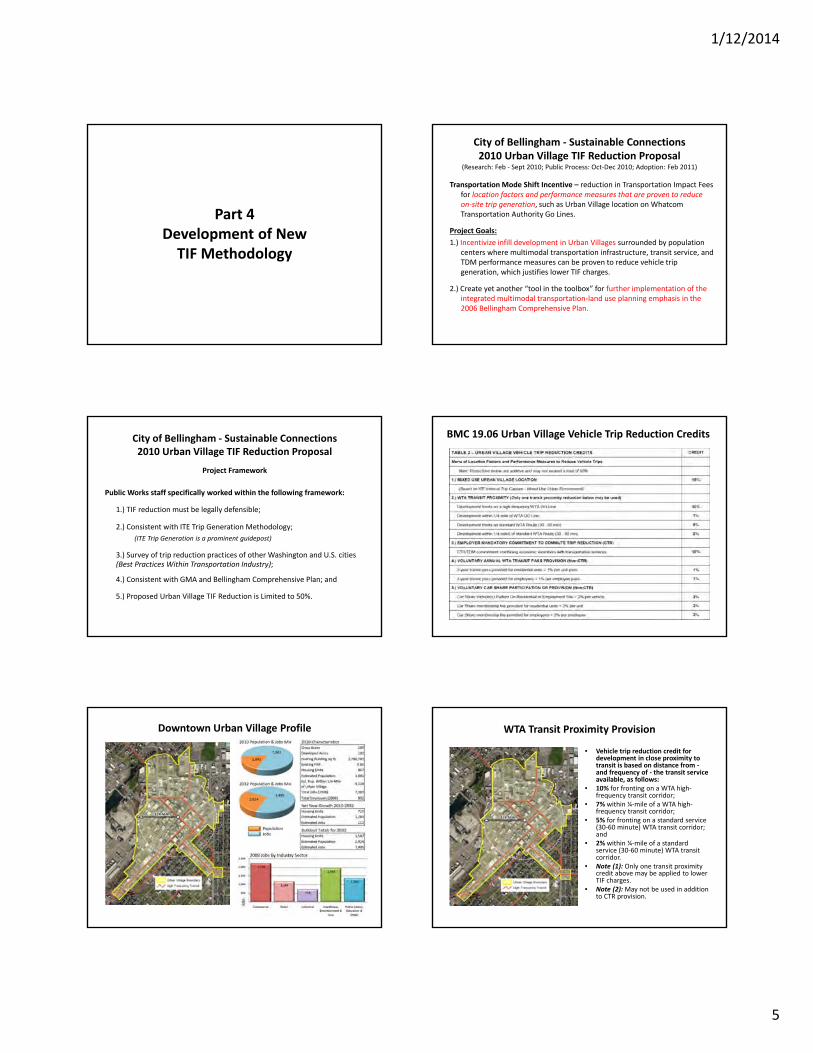
Part 4Development of New TIF Methodology
City of Bellingham ‐ Sustainable Connections 2010 Urban Village TIF Reduction Proposal
(Research: Feb ‐ Sept 2010; Public Process: Oct‐Dec 2010; Adoption: Feb 2011)
Transportation Mode Shift Incentive – reduction in Transportation Impact Fees for location factors and performance measures that are proven to reduce on‐site trip generation, such as Urban Village location on Whatcom Transportation Authority Go Lines.
Project Goals:
1.) Incentivize infill development in Urban Villages surrounded by population centers where multimodal transportation infrastructure, transit service, and TDM performance measures can be proven to reduce vehicle trip generation, which justifies lower TIF charges.
2.) Create yet another “tool in the toolbox” for further implementation of the integrated multimodal transportation‐land use planning emphasis in the 2006 Bellingham Comprehensive Plan.
Project Framework
Public Works staff specifically worked within the following framework:
1.) TIF reduction must be legally defensible;
2.) Consistent with ITE Trip Generation Methodology;
(ITE Trip Generation is a prominent guidepost)
3.) Survey of trip reduction practices of other Washington and U.S. cities (Best Practices Within Transportation Industry);
4.) Consistent with GMA and Bellingham Comprehensive Plan; and
5.) Proposed Urban Village TIF Reduction is Limited to 50%.
City of Bellingham ‐ Sustainable Connections 2010 Urban Village TIF Reduction Proposal
BMC 19.06 Urban Village Vehicle Trip Reduction Credits
Downtown Urban Village Profile WTA Transit Proximity Provision
• Vehicle trip reduction credit for development in close proximity to transit is based on distance from ‐and frequency of ‐ the transit service available, as follows:
• 10% for fronting on a WTA high‐frequency transit corridor;
• 7% within ¼‐mile of a WTA high‐frequency transit corridor;
• 5% for fronting on a standard service (30‐60 minute) WTA transit corridor; and
• 2% within ¼‐mile of a standard service (30‐60 minute) WTA transit corridor.
• Note (1): Only one transit proximity credit above may be applied to lower TIF charges.
• Note (2): May not be used in addition to CTR provision.
1/12/2014
6
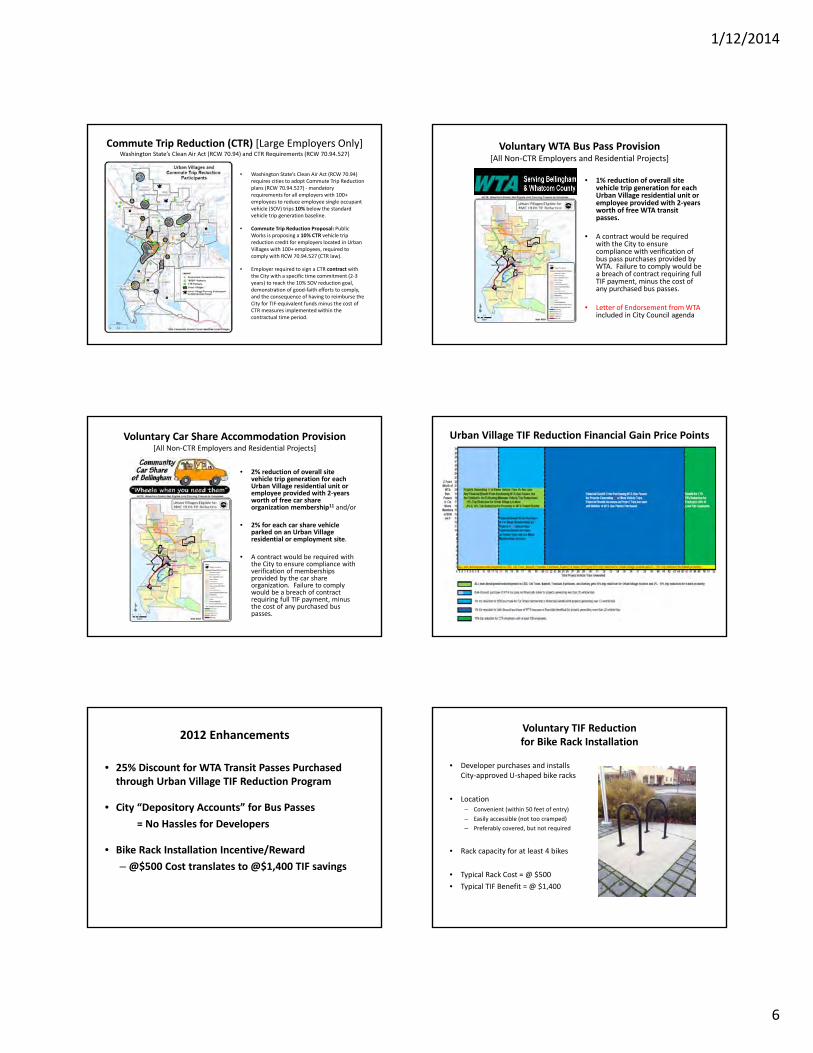
Commute Trip Reduction (CTR) [Large Employers Only]Washington State’s Clean Air Act (RCW 70.94) and CTR Requirements (RCW 70.94.527)
• Washington State’s Clean Air Act (RCW 70.94) requires cities to adopt Commute Trip Reduction plans (RCW 70.94.527) ‐mandatory requirements for all employers with 100+ employees to reduce employee single occupant vehicle (SOV) trips 10% below the standard vehicle trip generation baseline.
• Commute Trip Reduction Proposal: Public Works is proposing a 10% CTR vehicle trip reduction credit for employers located in Urban Villages with 100+ employees, required to comply with RCW 70.94.527 (CTR law).
• Employer required to sign a CTR contractwith the City with a specific time commitment (2‐3 years) to reach the 10% SOV reduction goal, demonstration of good‐faith efforts to comply, and the consequence of having to reimburse the City for TIF‐equivalent funds minus the cost of CTR measures implemented within the contractual time period.
Voluntary WTA Bus Pass Provision [All Non‐CTR Employers and Residential Projects]
• 1% reduction of overall site vehicle trip generation for each Urban Village residential unit or employee provided with 2‐years worth of free WTA transit passes.
• A contract would be required with the City to ensure compliance with verification of bus pass purchases provided by WTA. Failure to comply would be a breach of contract requiring full TIF payment, minus the cost of any purchased bus passes.
• Letter of Endorsement from WTA included in City Council agenda
Voluntary Car Share Accommodation Provision[All Non‐CTR Employers and Residential Projects]
• 2% reduction of overall site vehicle trip generation for each Urban Village residential unit or employee provided with 2‐years worth of free car share organization membership11 and/or
• 2% for each car share vehicle parked on an Urban Village residential or employment site.
• A contract would be required with the City to ensure compliance with verification of memberships provided by the car share organization. Failure to comply would be a breach of contract requiring full TIF payment, minus the cost of any purchased bus passes.
Urban Village TIF Reduction Financial Gain Price Points
2012 Enhancements
• 25% Discount for WTA Transit Passes Purchased through Urban Village TIF Reduction Program
• City “Depository Accounts” for Bus Passes
= No Hassles for Developers
• Bike Rack Installation Incentive/Reward
– @$500 Cost translates to @$1,400 TIF savings
Voluntary TIF Reduction for Bike Rack Installation
• Developer purchases and installs City‐approved U‐shaped bike racks
• Location– Convenient (within 50 feet of entry)
– Easily accessible (not too cramped)
– Preferably covered, but not required
• Rack capacity for at least 4 bikes
• Typical Rack Cost = @ $500
• Typical TIF Benefit = @ $1,400

1/12/2014
7
Part 5. Success of the Urban Village TIF Reduction Program
March 1, 2011 to August 1, 2013, the Bellingham Urban Village TIF Reduction Program has saved developers over $300,000 in TIF savings (Table 4.), as follows:
• Year 1 = $117,976;
• Year 2 = $100,178;
• Year 3 (5 mos) = $87,878; and
• TIF savings (to date) = $306,032
Details of Success
• 30 Projects in 30 months– 433 residential apartments in compact mixed use areas
– 115,249 SF commercial space
– 31,897 SF office space
– $246,175 in automatic (22% ‐ 25%s) TIF savings
• 3 Major Developers (274 apartments) have voluntarily purchased WTA bus passes for 2 years at a 25% discount– $47,737 in TIF savings for voluntary performance measures
• 6 Businesses have purchased and installed bike racks– $11,524 in TIF savings for voluntary performance measures
Case Study Example – Barkley Urban Village Bellingham = Lowest 2013 TIF Rate of Any City in Whatcom CountyUrban Village TIF = 46% of Ferndale’s “Mainstreet” TIF
Who Should Pay the Costs of Growth?Q. New development and businesses OR the City tax‐payers? A. BOTH because transportation benefits accrue to both
Awards & Recognition
2012 APA‐PAW Award for Transportation Planning in Washington State
2013 ITE Transportation Planning Council Best Program Award – Runner Up (International)
Program featured in many State and National APA and ITE Publications
AICP Journal Practicing Planner Volume 11, No. 3 (Sept 2013)“The Urban Village TIF Reduction Program in Bellingham, Washington” http://www.planning.org/practicingplanner/
[Example copy available here]
1/12/2014
8
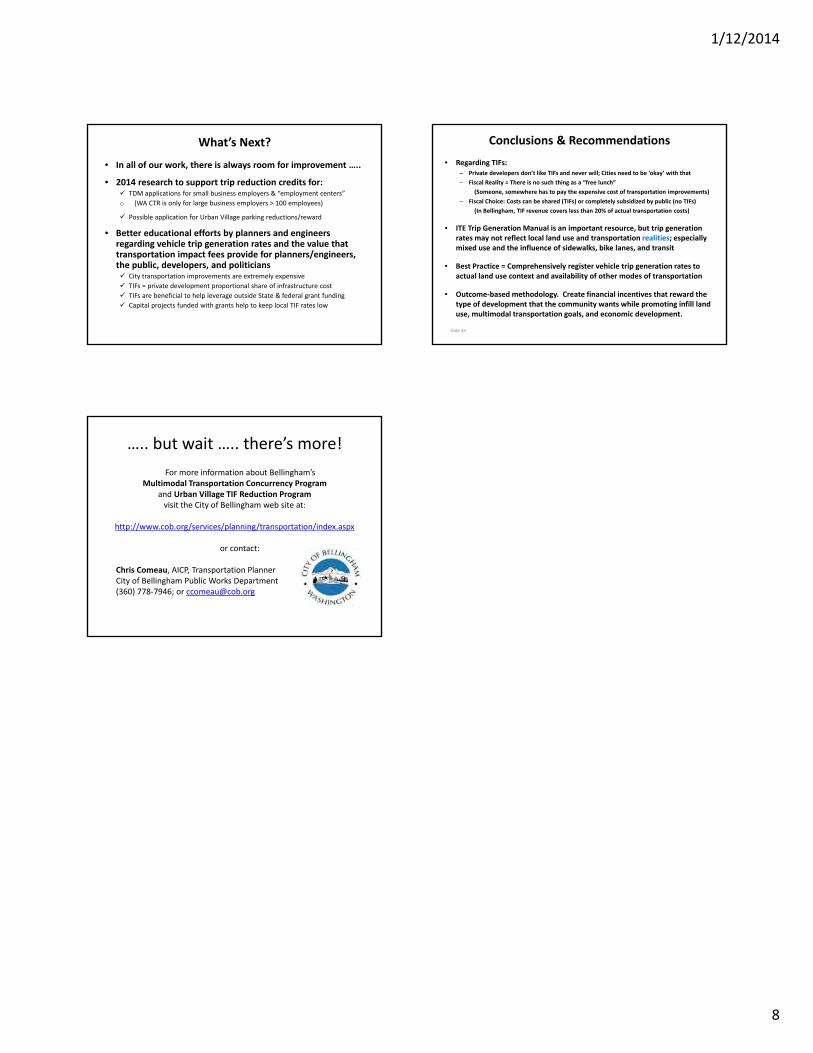
What’s Next?
• In all of our work, there is always room for improvement …..
• 2014 research to support trip reduction credits for: TDM applications for small business employers & “employment centers”
o (WA CTR is only for large business employers > 100 employees)
Possible application for Urban Village parking reductions/reward
• Better educational efforts by planners and engineers regarding vehicle trip generation rates and the value that transportation impact fees provide for planners/engineers, the public, developers, and politicians City transportation improvements are extremely expensive
TIFs = private development proportional share of infrastructure cost
TIFs are beneficial to help leverage outside State & federal grant funding
Capital projects funded with grants help to keep local TIF rates low
Conclusions & Recommendations
• Regarding TIFs:– Private developers don’t like TIFs and never will; Cities need to be ‘okay’ with that
– Fiscal Reality = There is no such thing as a “free lunch”
(Someone, somewhere has to pay the expensive cost of transportation improvements)
– Fiscal Choice: Costs can be shared (TIFs) or completely subsidized by public (no TIFs)
(In Bellingham, TIF revenue covers less than 20% of actual transportation costs)
• ITE Trip Generation Manual is an important resource, but trip generation rates may not reflect local land use and transportation realities; especially mixed use and the influence of sidewalks, bike lanes, and transit
• Best Practice = Comprehensively register vehicle trip generation rates to actual land use context and availability of other modes of transportation
• Outcome‐based methodology. Create financial incentives that reward the type of development that the community wants while promoting infill land use, multimodal transportation goals, and economic development.
Slide 44
….. but wait ….. there’s more!
For more information about Bellingham’s Multimodal Transportation Concurrency Program
and Urban Village TIF Reduction Programvisit the City of Bellingham web site at:
http://www.cob.org/services/planning/transportation/index.aspx
or contact:
Chris Comeau, AICP, Transportation PlannerCity of Bellingham Public Works Department(360) 778‐7946; or [email protected]

1/12/2014
1
Spokane Transportation Impact Fee Program
Update
WA APA Conference 2013Louis Meuler, City Planner
Planning and Development Services
October 2013American Planning Association – Washington Chapter2013 Annual Conference – Bellevue, Washington
Why am I here?1. Close to Shameless Self Promotion
2. Wicked Problems3. Smart Solutions
Background and History
• What are we doing to ourselves?• Past crisis to current crisis
– Don’t let a good crisis go to waste.
• Maintenance Backlog and Needs vs. Wants
• Current Program• Where to from here?
Spo·kaneA city of eastern Washington near the Idaho border on the falls of the Spokane River, about 193 km (120 mi) long. Settled on the site of a trading fort established in 1810, Spokane is a trade and processing center in an agricultural, lumbering, and mining region.
Source: http://www.thefreedictionary.com/Spokane
Spokanistan
Another nickname for the city of Spokane in Washington State USA. This nickname began growing in popularity when some Spokane residents began to notice similarities between their surroundings and the pictures of dusty towns in Afghanistan being shown on TV news.
Source: http://www.urbandictionary.com

1/12/2014
2
Spokane
Missoula
Coeur d’Alene
Inland Northwest Regional Center
Seattle
Portland
• 1,700,000 people within Spokane Trade Area – Very Spread Out – 150 mile radius
• 471,000 people within Spokane County
• Spokane County “Urban” = 387,847
• Spokane / Coeur d’Alene CSA = 674,600
• 210,000 people within the City of Spokane
• About 1,000 a year growth – slow growth?
• As of 2012 – Just under 70 Square Miles
• City’s median household income $41,466
• Region’s poverty issues
• Spokane County’s median household income $49,257
Spokane Demographics
Source: http://wellpinit.wednet.edu

1/12/2014
3
Trolley Era to Current Transit
1883 – First Rail Transit Service1922 – Spokane United Railway
Regional light & trolley service1938 – Trolley to Bus transition
(motorized coaches)2010 – Private U-District Bus
Central Spokane Streetcar Lines – 1923
1/12/2014
4
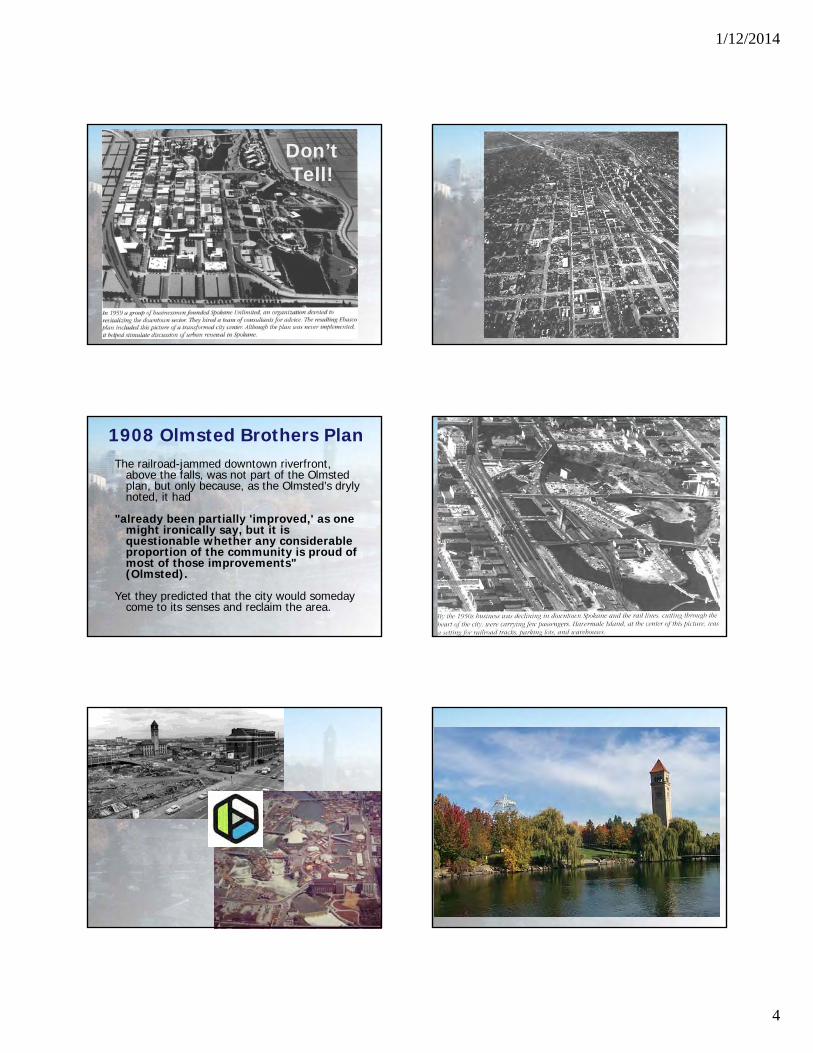
Don’t Tell!
1908 Olmsted Brothers PlanThe railroad-jammed downtown riverfront,
above the falls, was not part of the Olmsted plan, but only because, as the Olmsted’s dryly noted, it had
"already been partially 'improved,' as one might ironically say, but it is questionable whether any considerable proportion of the community is proud of most of those improvements" (Olmsted).
Yet they predicted that the city would someday come to its senses and reclaim the area.

1/12/2014
5
25 26
1948 1992

1/12/2014
6
2007 TIF 1.0: A five-year mission (15?) To boldly go?
• Attempted to integrate with land use plan vision– Centers and Corridors– Multi-modal
Level of Service
• LOS currently based solely on intersection LOS and auto capacity.
• Adjusted this LOS based on Land Use desires – Generally perceived as not achieving desire results.
LOS Policy Mapped
Impact Fee ProgramsAre these controversial?
• Still not satisfied with SEPA Mitigation process• March 2005 – City-Wide Voluntary Impact Fee
System Developed – It worked before?
Our 1st “Voluntary” System Created
• Mid 2005 – Traffic mitigation process still not working.
• Through 2006 – Staff effort not inclusive enough.
• December 2006 – Mayor appointed TIF Work Group
– Let us make this official!
• October 2007 TIF Rate Study - Only 10 Months!
– Council says “Not adequate” - Sticker shock?
• November 2008 – Council adopts TIF “shell” ordinance. Required more process (reduce price tag, better data & model) before going into effect.
• TIF 2.0: Program finally adopted in January, 2011
• 4 Zones: Latest annexation area not covered.

1/12/2014
7
TIF Reductionsfor Good Behavior
• Downtown Zone lowest rate• Credits
– Reduced rate for Center or Corridor –10%
– Mixed use for “active” first floor – 10%– “Complete Street” upgrades – 10%– Maximum of 20% Credit
• Parking garage pays zero – no use that generates trips
TIF Rates• Downtown = $90 a Peak Hour Trip MF DU = $68
• Outside Downtown = $587 to $860• SF DU = $750 to $1,004
• TIF collected $1.3 m since Jan. 2011. Downtown = $11,500
The Sky is Falling – Crisis?
• Recession – Spokane 1.5 to 2 Years Behind• City administration change
– Different Philosophy – Familiar?
• Infrastructure O&M and Life Cycle Cost– Bills for infrastructure replacement coming
– www.StrongTowns.org
& the streets are falling apart
•Regional grant outlook allocates $20M/year for maintenance.
•Current local investment is about $5M/year.
•Even investing $30M/year does not reign in deferred maintenance.
•In addition, bridge work amounts to roughly $355M deferred maintenance.
Pavement Maintenance Funding
$0
$50
$100
$150
$200
$250
$300
$350
$400
$450
2012 2013 2014 2015 2016 2017 2018 2019 2020 2021
Cos
t (M
illio
ns)
Deferred Maintenance vs. InvestmentInvest Current Level ($5M/Year)
Deferred Maint based on Current
Invest $30M/Year
Deferred Maint Based on $30M
Invest for NO Deferred Maint
Combined Sewer OverflowWater & Sewer
• Build our way out with huge tanks -$500 to $600 per household.
• Is there another way?
• TIF 3.0 System to support integrated approach?
Infrastructure Integration• Make sure our Level of Service definition fits
what we want and can afford.– Transportation– Land Use– Storm-water / CSO– Water / Sewer MaintenceGreat opportunity to look at everything differently and be SMART about how we look at our future needs within the right of wayHELP - “Right of Way Infrastructure Chapter” ?

1/12/2014
8
Performance Measures
• Are we measuring the right things?• Are we happy?• Are we achieving desired results?• Do we really have a congestion problem?• What can we afford?
What are we doing?
• Public health partnership• Trying to include next generation
– Is Facebook already dead?– Is there a conference session?
• What can we afford rather than what we think we would like?– What can we maintain?– What do we want to maintain?
Back to a Transportation Vision
• Pedestrian First?• Reduce Demand?• Viable Public Transit?• Reduce Sprawl / Continue to Encourage Infill? Who pays?
• Use Fiscal Resources Efficiently?
Trade-offs in Cities
Seconds
LargeGain
VE
HIC
UL
AR
SE
RV
ICE
LIVABILITY
Con
vent
iona
l App
roac
h
MoreEfficiency
Syst
em
Man
agem
ent
More Pavement
Mor
e La
nes
Mor
e R
oads
ITS
Mor
e C
ars
Conventional Approach
Lateral Approach
User View and ComfortContext-Sensitive DesignTraffic CalmingPersonal Security
Mixture of UsesRoad NetworkPedestrian-Oriented EnvironmentCompact Development
Lane LimitsChange Standards
Manage, Not “Solve”
Conv
entio
nal A
ppro
ach
MoreEfficiency
Mor
e La
nes
Mor
e Ro
ads
Mor
e Ca
rs
TransitBicyclingWalkingHOV/HOT Lanes
Syst
em
Man
agem
ent
More Pavement
ITS
Balanced Approach

1/12/2014
9
What I’ve Heard
• Reduce integrated costsRe-evaluate what is really needed
• Reduced lane widths?• Rebuild existing streets to narrower / lower
cost?• Stormwater Integration? Green?!• Multi-modal is important? Economy?
• Integrate Capital and O&M with Vision?

1
October 2, 2013American Planning Association – Washington Chapter2013 Annual Conference – Bellevue, Washington
City of VancouverTraffic Impact Fee Program
TIF Program – A Complete Overhaul
Ryan Lopossa, P.E.Transportation Development Review Services
Agenda
Background Existing Program Structure Historical TIF Collections Role of TIF in City’s Transportation Budget Goals & Objectives for New TIF Program Scope of Program Overhaul Schedule Questions & Discussion
2
Background
City Size – 46 Square Miles Population – 165,000 (4th largest in WA) Over 1,800 Lane Miles of City Streets Over 3,800 Acres of City Owned ROW 234 Traffic Signals 17,300 (+/-) Street Lights Thousands of Traffic Control Signs Hundreds of miles of pavement striping >$16 Million in Annual Street O&M >$430 Million in Future Street Upgrades
3
Background
Current TIF Program adopted in 2001 with origins going back to County’s 1991 program
TIF collected pursuant to RCW 82.02 TIF assessed based on “trips” from
development site TIF must be related to “new growth” (impacts)
on transportation system Significant Case Law guides program design
and policy framework Most Cities in WA state and other states
implement “impact fee”
4
Existing TIF Program
5
Vancouver
Hazel Dell
S. Orchards
Evergreen
East City
Historical TIF Collections
6
2
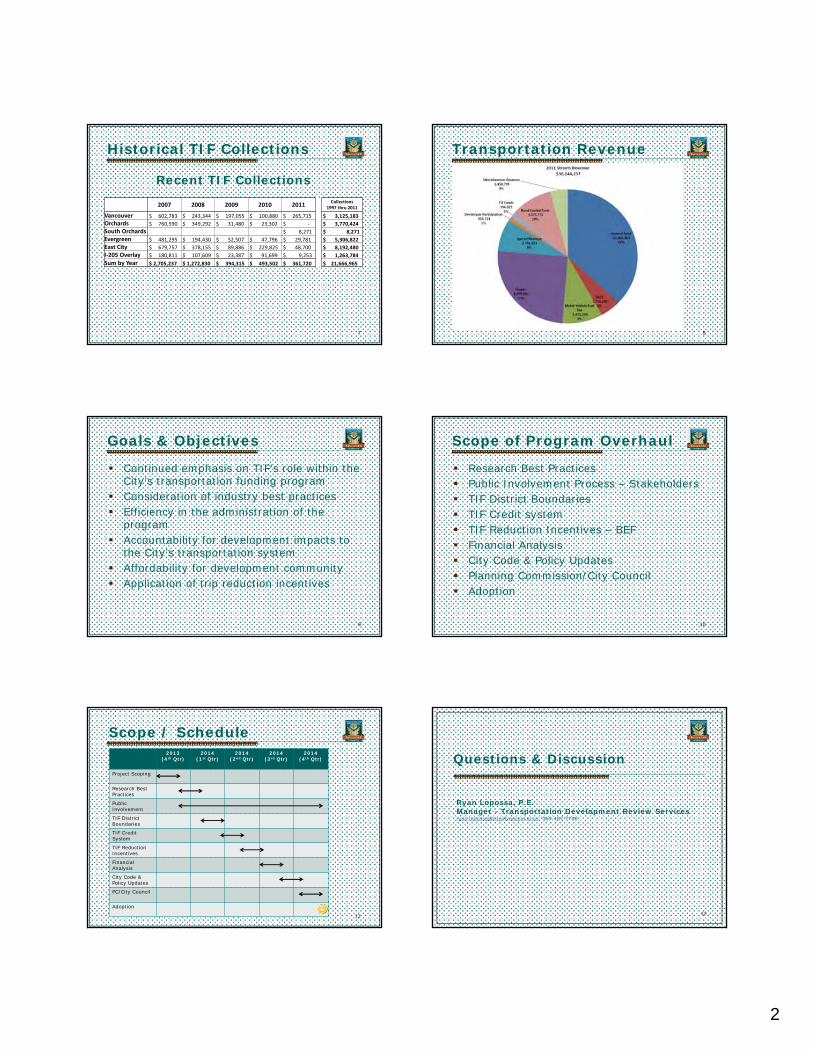
Historical TIF Collections
Recent TIF Collections
7
2007 2008 2009 2010 2011Collections
1997 thru 2011
Vancouver $ 602,783 $ 243,344 $ 197,055 $ 100,880 $ 265,715 $ 3,125,183
Orchards $ 760,590 $ 349,292 $ 31,480 $ 23,302 $ ‐ $ 3,770,424
South Orchards $ 8,271 $ 8,271
Evergreen $ 481,295 $ 194,430 $ 52,507 $ 47,796 $ 29,781 $ 5,306,822
East City $ 679,757 $ 378,155 $ 89,886 $ 229,825 $ 48,700 $ 8,192,480
I‐205 Overlay $ 180,811 $ 107,609 $ 23,387 $ 91,699 $ 9,253 $ 1,263,784
Sum by Year $ 2,705,237 $ 1,272,830 $ 394,315 $ 493,502 $ 361,720 $ 21,666,965
Transportation Revenue
8
Goals & Objectives
Continued emphasis on TIF’s role within the City’s transportation funding program
Consideration of industry best practices Efficiency in the administration of the
program Accountability for development impacts to
the City’s transportation system Affordability for development community Application of trip reduction incentives
9
Scope of Program Overhaul
Research Best Practices Public Involvement Process – Stakeholders TIF District Boundaries TIF Credit system TIF Reduction Incentives – BEF Financial Analysis City Code & Policy Updates Planning Commission/City Council Adoption
10
Scope / Schedule
11
2013 (4th Qtr)
2014 (1st Qtr)
2014 (2nd Qtr)
2014 (3rd Qtr)
2014 (4th Qtr)
Project Scoping
Research Best Practices
Public Involvement
TIF District Boundaries
TIF Credit System
TIF Reduction Incentives
Financial Analysis
City Code & Policy Updates
PC/City Council
Adoption12
Questions & Discussion
Ryan Lopossa, P.E.Manager - Transportation Development Review [email protected]; 360-487-7706