Urban Plant Factories: High in the Sky o Pie in the Sky? in the Sky or… Pie in the Sky? S k y s c...
64
Urban Plant Factories: High in the Sky or… Pie in the Sky?
Transcript of Urban Plant Factories: High in the Sky o Pie in the Sky? in the Sky or… Pie in the Sky? S k y s c...
Urban Plant Factories:
High in the Sky
or…
Pie in the Sky?
S
k
y
s
c
r
a
p
e
r
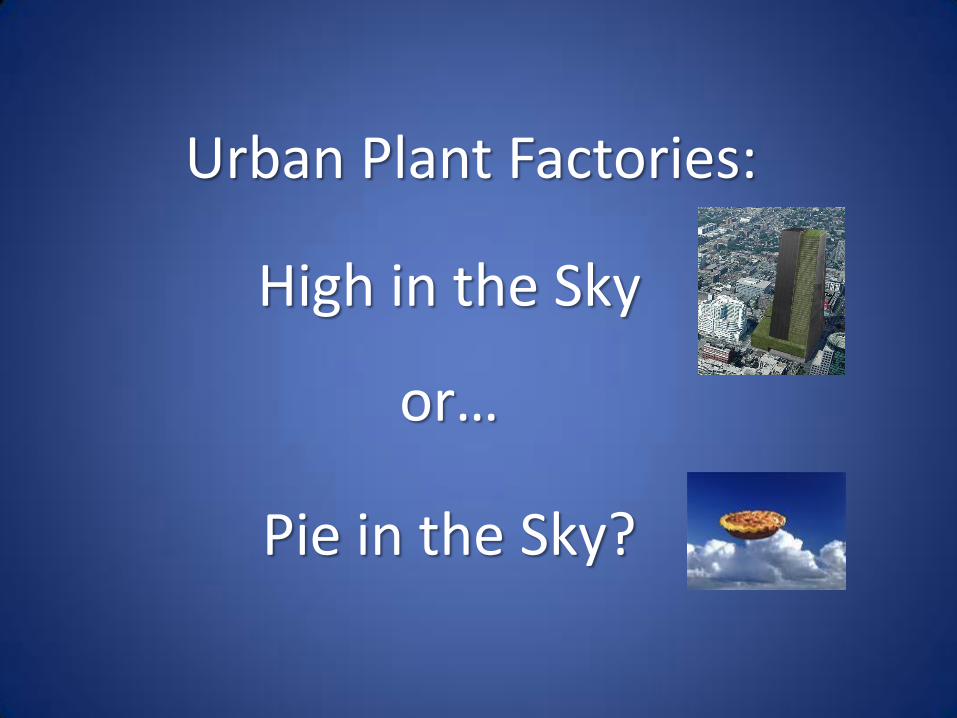
F
a
r
m
s
And Abandoned Warehouses
Are greenhouses
really wearing
new clothes????
Vertical Greenhouses and Plant Factories
2014 NGMA Annual Meeting, Miami, Florida
Lou Albright, Professor Emeritus
Biological and Environmental Engineering
Cornell University, Ithaca, New York
[email protected], www.cornellcea.com
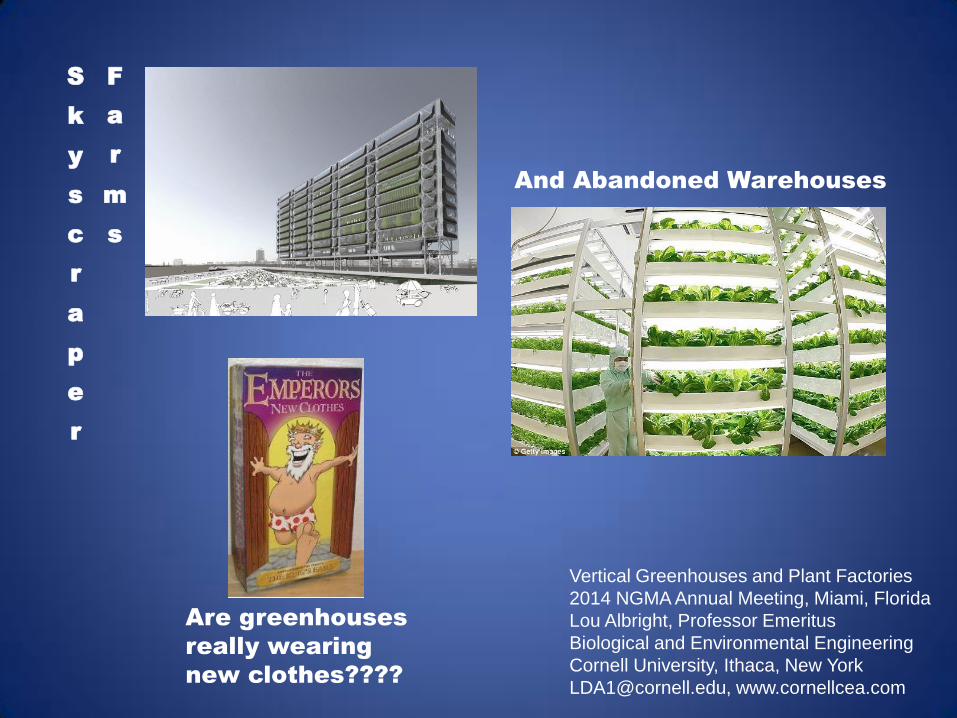
Various proposals related to hi-tech agriculture have been
frequently based on growing food crops with no natural light,
or at least very little natural light.
Plant factories and vertical greenhouses are today’s buzz.
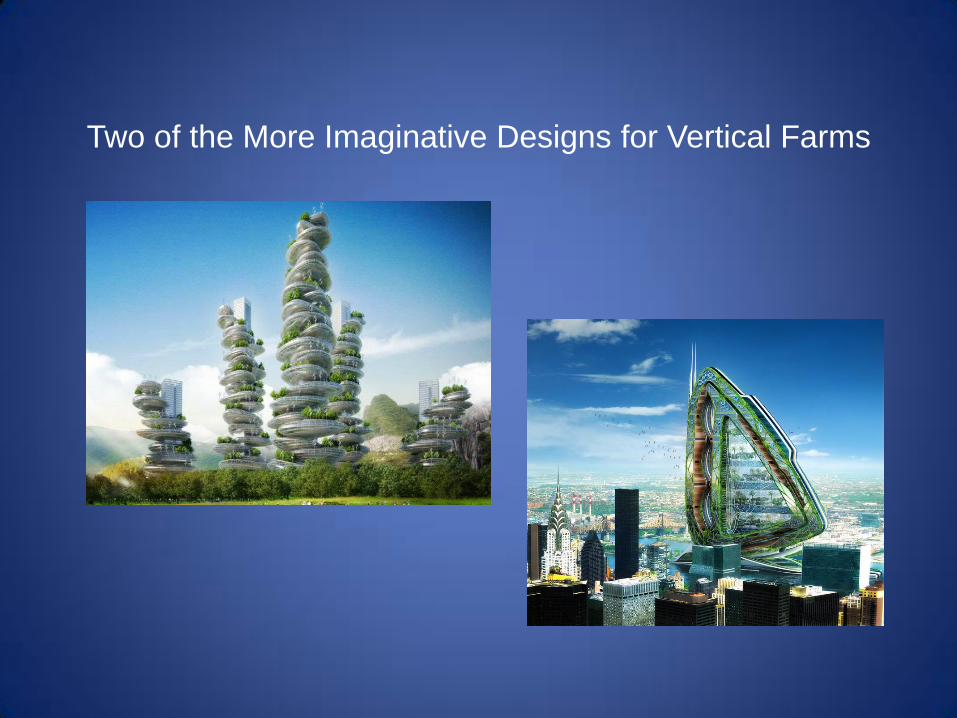
Two of the More Imaginative Designs for Vertical Farms
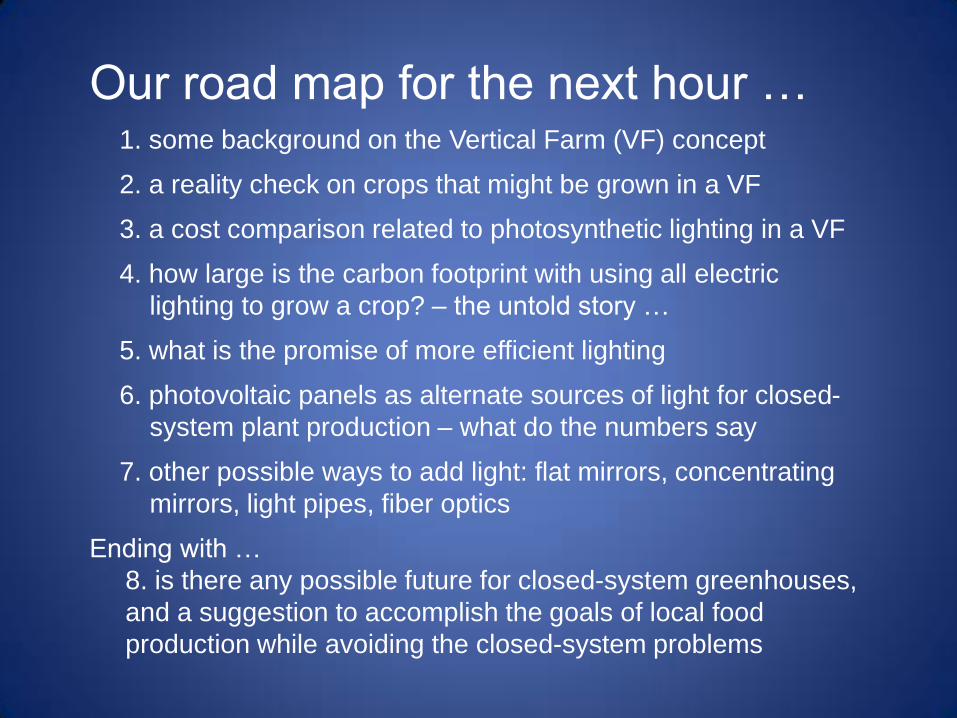
Our road map for the next hour …
1. some background on the Vertical Farm (VF) concept
2. a reality check on crops that might be grown in a VF
3. a cost comparison related to photosynthetic lighting in a VF
4. how large is the carbon footprint with using all electric
lighting to grow a crop? – the untold story …
5. what is the promise of more efficient lighting
6. photovoltaic panels as alternate sources of light for closed-
system plant production – what do the numbers say
7. other possible ways to add light: flat mirrors, concentrating
mirrors, light pipes, fiber optics
Ending with …
8. is there any possible future for closed-system greenhouses,
and a suggestion to accomplish the goals of local food
production while avoiding the closed-system problems

Our road map for the next hour …
And, if all goes well, time at the end
for questions and discussion
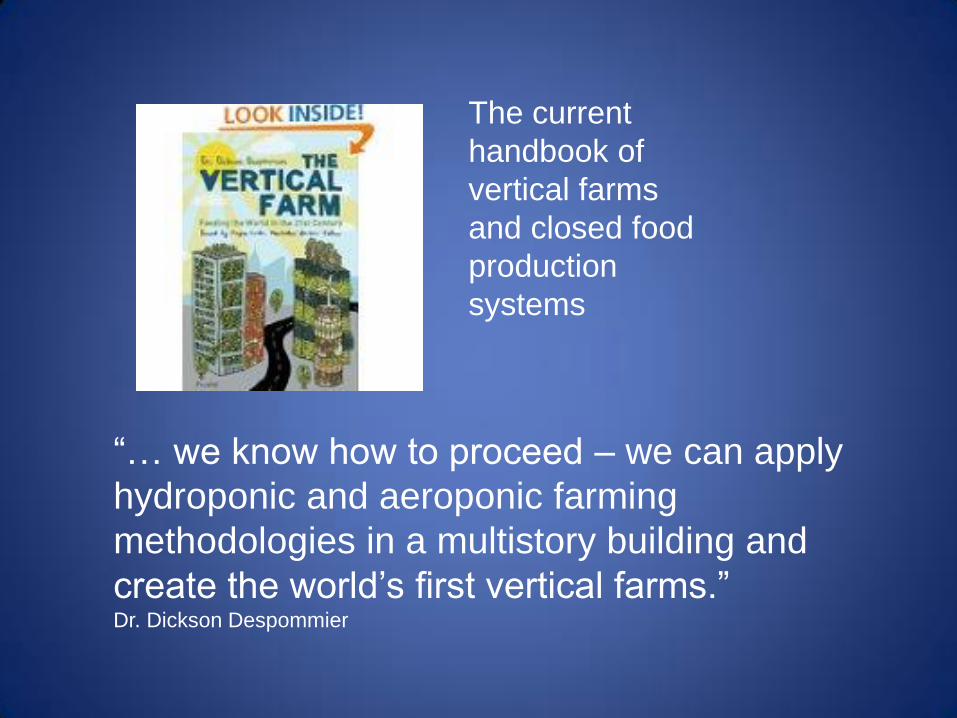
The current
handbook of
vertical farms
and closed food
production
systems
“… we know how to proceed – we can apply
hydroponic and aeroponic farming
methodologies in a multistory building and
create the world’s first vertical farms.” Dr. Dickson Despommier
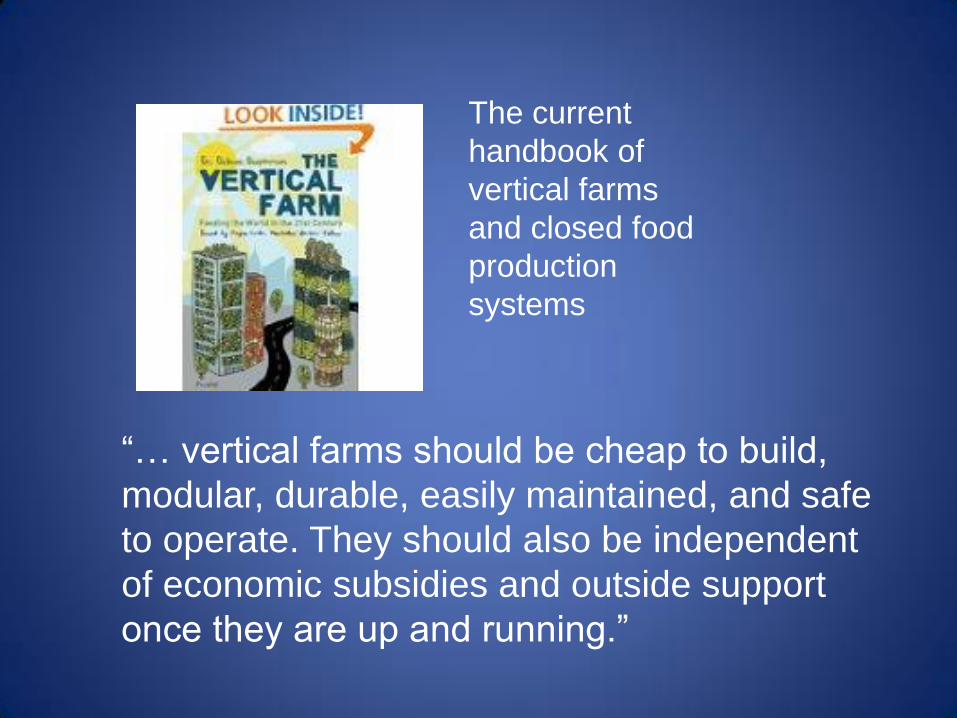
“… vertical farms should be cheap to build,
modular, durable, easily maintained, and safe
to operate. They should also be independent
of economic subsidies and outside support
once they are up and running.”
The current
handbook of
vertical farms
and closed food
production
systems
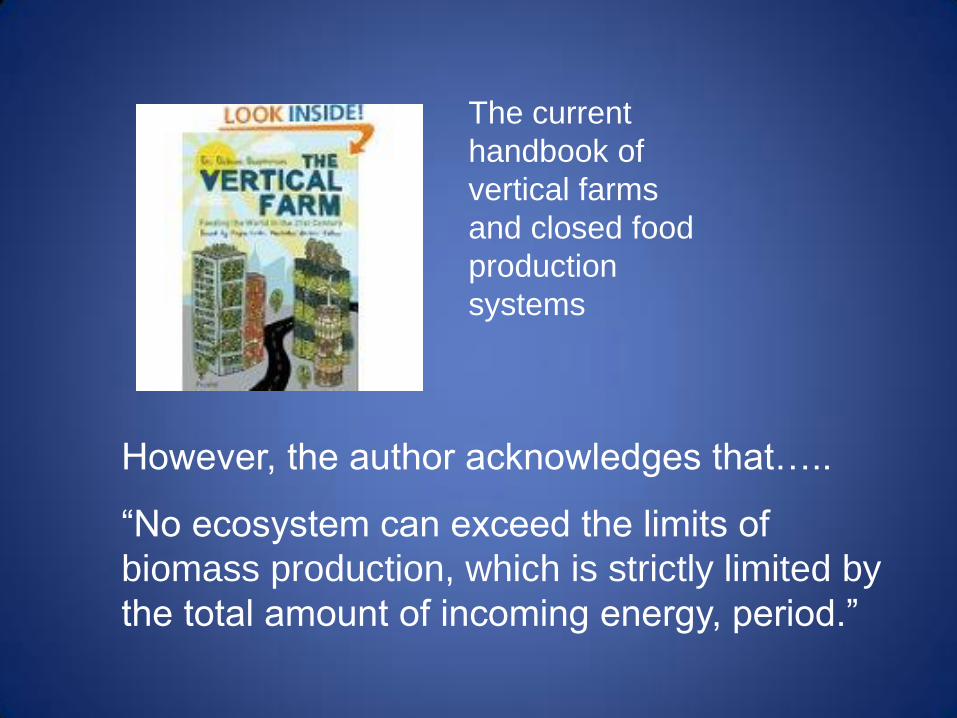
However, the author acknowledges that…..
“No ecosystem can exceed the limits of
biomass production, which is strictly limited by
the total amount of incoming energy, period.”
The current
handbook of
vertical farms
and closed food
production
systems
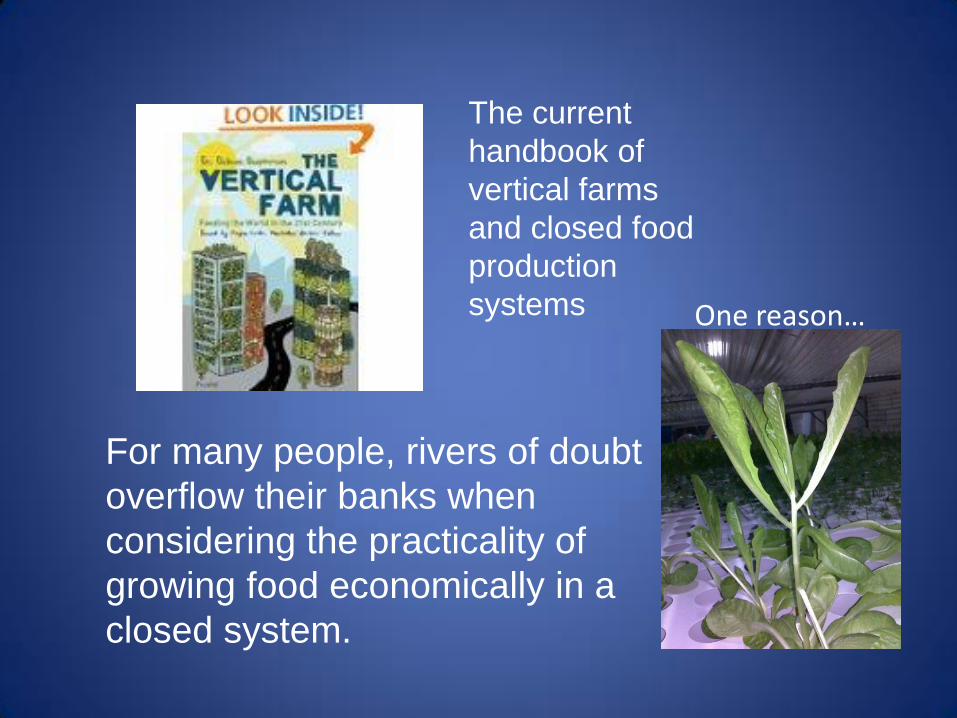
For many people, rivers of doubt
overflow their banks when
considering the practicality of
growing food economically in a
closed system.
The current
handbook of
vertical farms
and closed food
production
systems One reason…

Tackling Doubts, One at a Time…
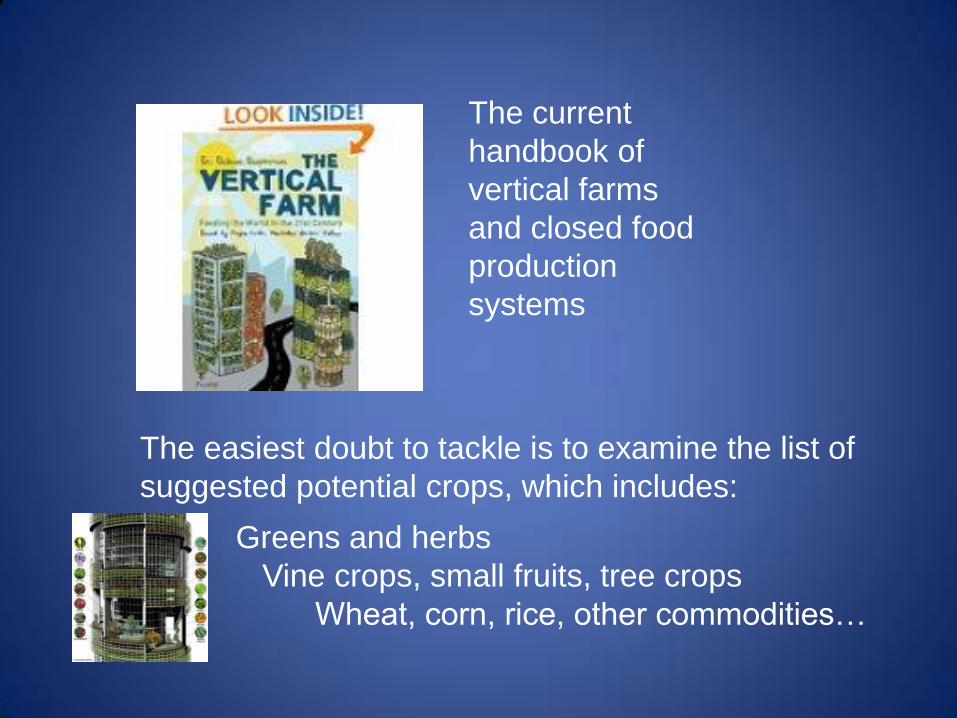
The easiest doubt to tackle is to examine the list of
suggested potential crops, which includes:
Greens and herbs
Vine crops, small fruits, tree crops
Wheat, corn, rice, other commodities…
The current
handbook of
vertical farms
and closed food
production
systems
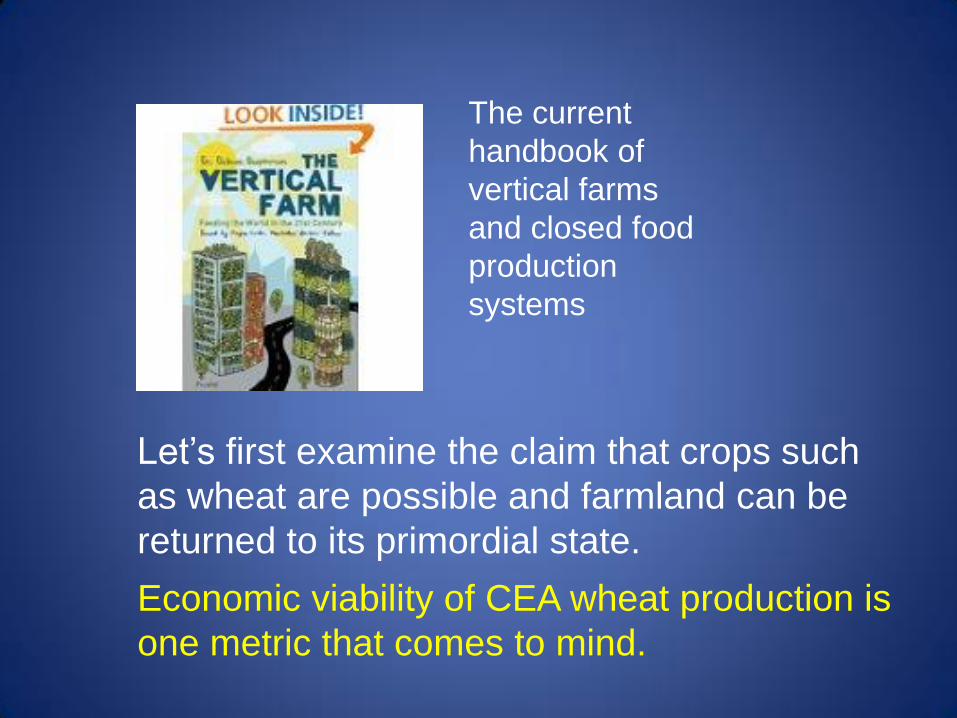
Let’s first examine the claim that crops such
as wheat are possible and farmland can be
returned to its primordial state.
Economic viability of CEA wheat production is
one metric that comes to mind.
The current
handbook of
vertical farms
and closed food
production
systems
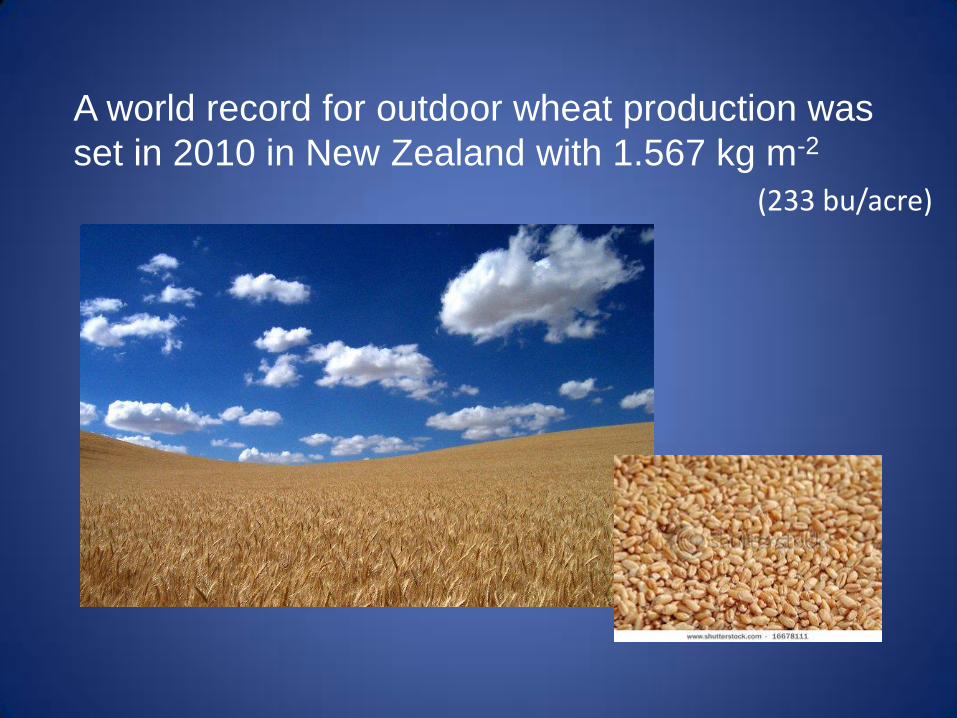
A world record for outdoor wheat production was
set in 2010 in New Zealand with 1.567 kg m-2
(233 bu/acre)
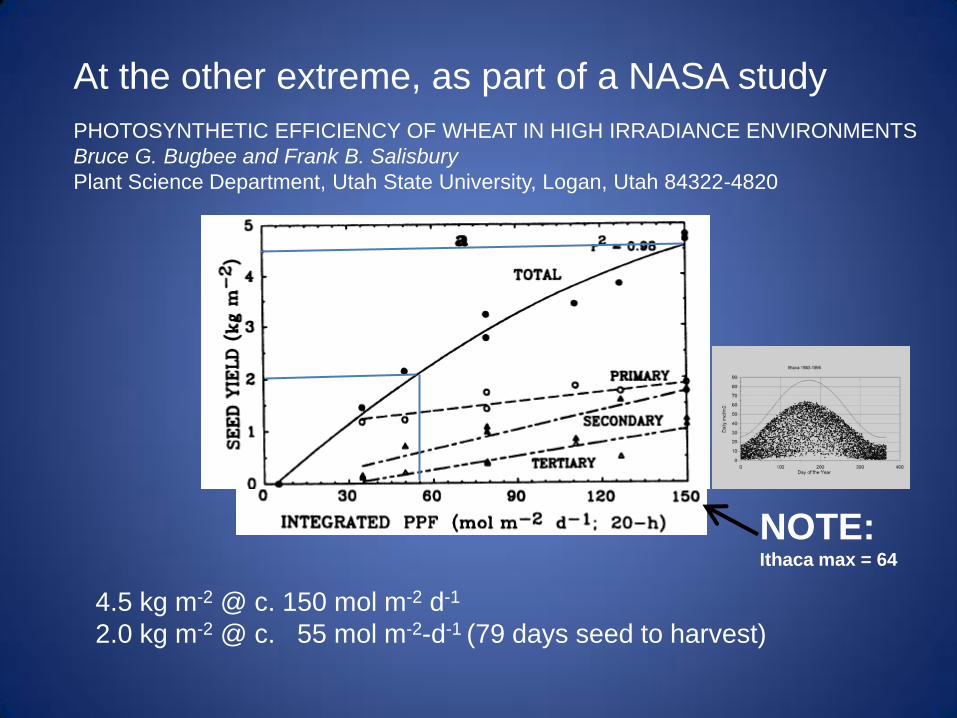
PHOTOSYNTHETIC EFFICIENCY OF WHEAT IN HIGH IRRADIANCE ENVIRONMENTS
Bruce G. Bugbee and Frank B. Salisbury
Plant Science Department, Utah State University, Logan, Utah 84322-4820
4.5 kg m-2 @ c. 150 mol m-2 d-1
2.0 kg m-2 @ c. 55 mol m-2-d-1 (79 days seed to harvest)
NOTE: Ithaca max = 64
At the other extreme, as part of a NASA study

PHOTOSYNTHETIC EFFICIENCY OF WHEAT IN HIGH IRRADIANCE ENVIRONMENTS
Bruce G. Bugbee and Frank B. Salisbury
Plant Science Department, Utah State University, Logan, Utah 84322-4820
NOTE: Ithaca max = 64
At the other extreme, as part of a NASA study
Note: Outdoor values
4.5 kg m-2 @ c. 150 mol m-2 d-1
2.0 kg m-2 @ c. 55 mol m-2-d-1 (79 days seed to harvest)
(outdoors)
c. April 20 c. August 8
Relating 55 mol m-2 day -1 to reality……
Outside the atmosphere
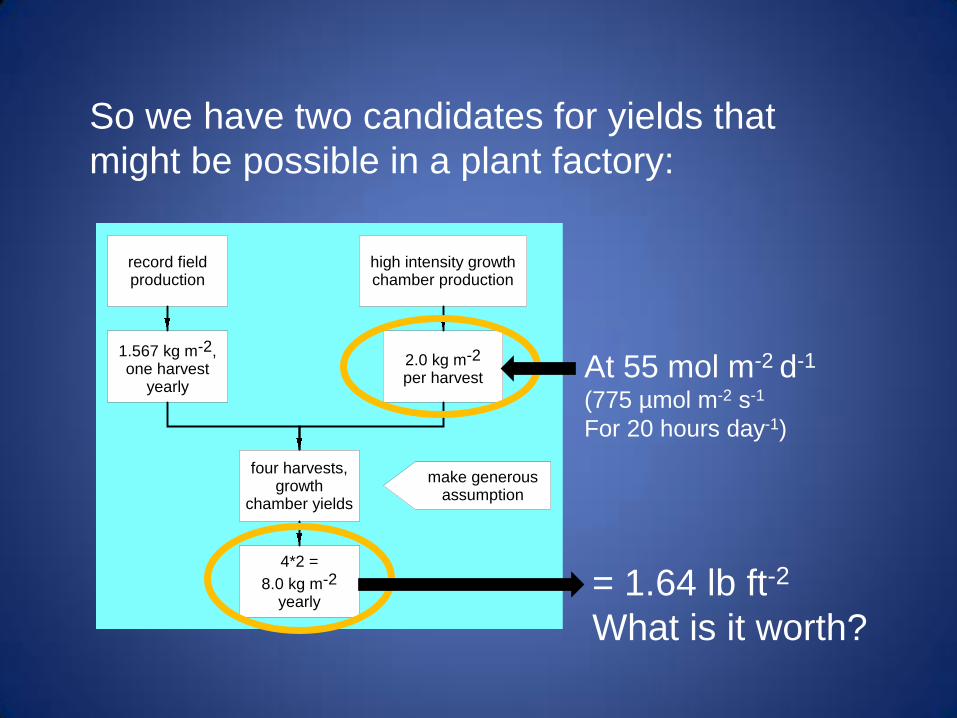
record field production
high intensity growth chamber production
1.567 kg m-2,one harvest
yearly
2.0 kg m-2
per harvest
four harvests, growth
chamber yields
4*2 =
8.0 kg m-2 yearly
make generous assumption
So we have two candidates for yields that
might be possible in a plant factory:
= 1.64 lb ft-2
What is it worth?
At 55 mol m-2 d-1
(775 µmol m-2 s-1
For 20 hours day-1)
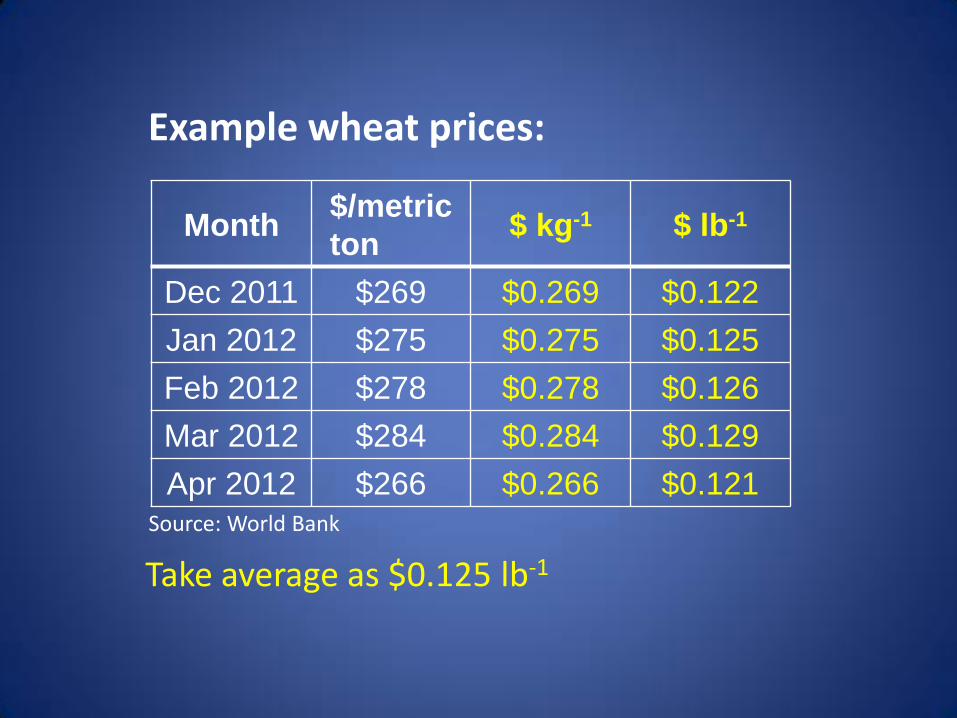
Example wheat prices:
Source: World Bank
Month $/metric
ton $ kg-1 $ lb-1
Dec 2011 $269 $0.269 $0.122
Jan 2012 $275 $0.275 $0.125
Feb 2012 $278 $0.278 $0.126
Mar 2012 $284 $0.284 $0.129
Apr 2012 $266 $0.266 $0.121
Take average as $0.125 lb-1
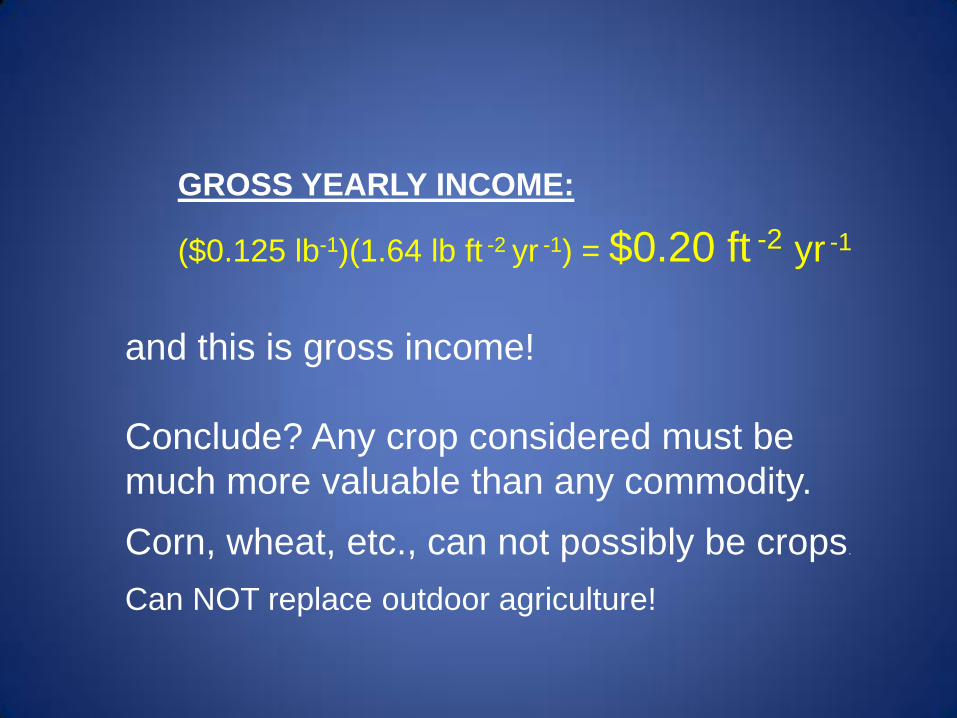
GROSS YEARLY INCOME:
($0.125 lb-1)(1.64 lb ft -2 yr
-1) = $0.20 ft -2 yr
-1
and this is gross income!
Conclude? Any crop considered must be
much more valuable than any commodity.
Corn, wheat, etc., can not possibly be crops.
Can NOT replace outdoor agriculture!
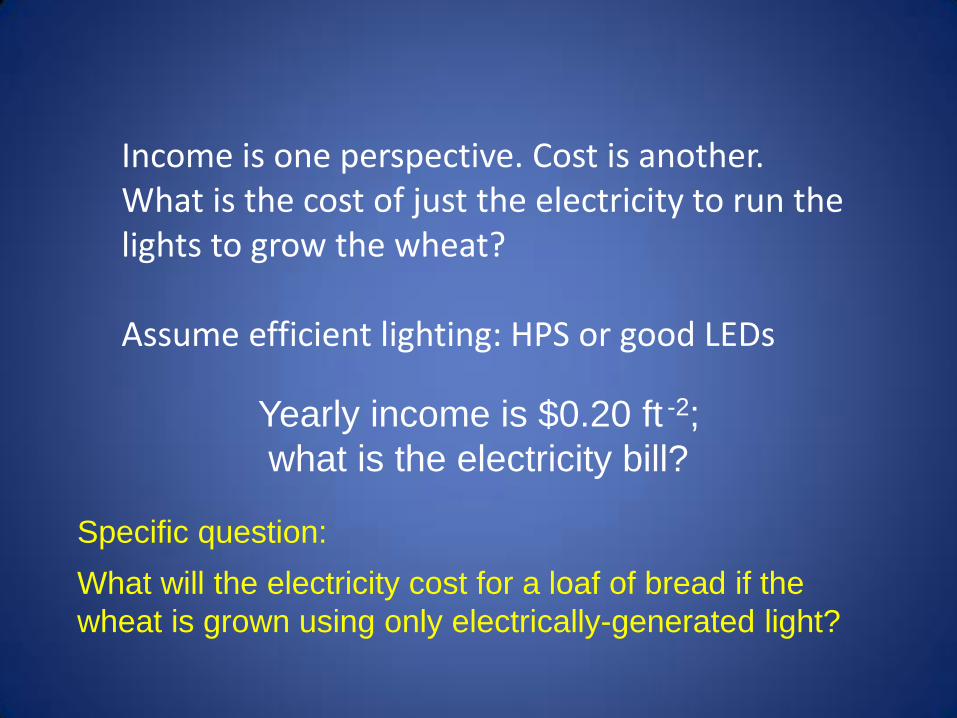
Income is one perspective. Cost is another. What is the cost of just the electricity to run the lights to grow the wheat? Assume efficient lighting: HPS or good LEDs
Yearly income is $0.20 ft -2;
what is the electricity bill?
Specific question:
What will the electricity cost for a loaf of bread if the
wheat is grown using only electrically-generated light?
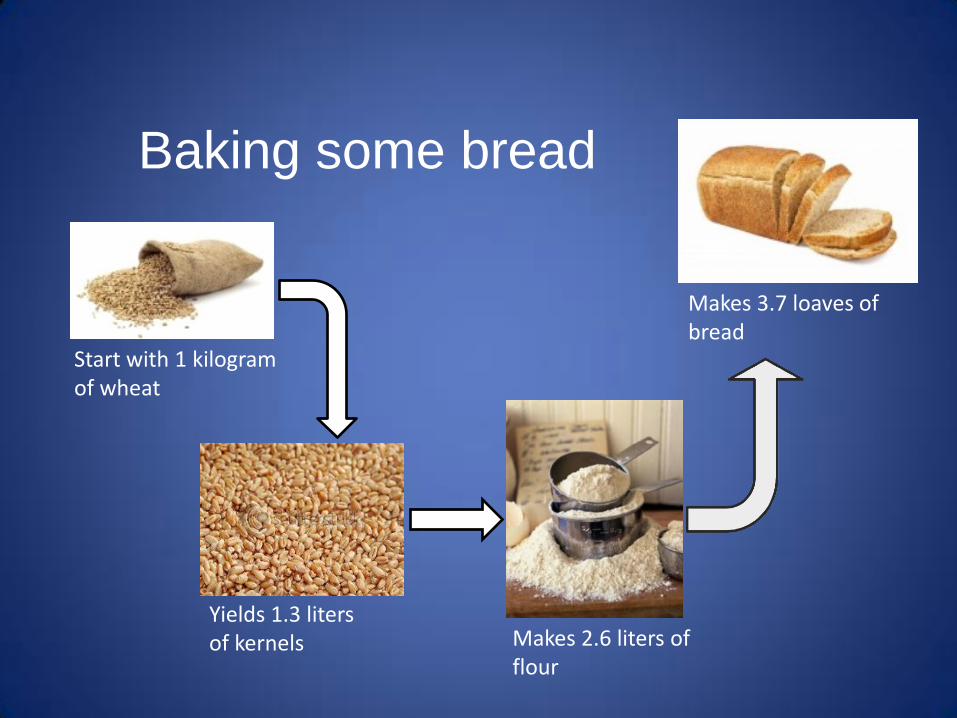
Baking some bread
Makes 3.7 loaves of bread
Start with 1 kilogram of wheat
Yields 1.3 liters of kernels Makes 2.6 liters of
flour
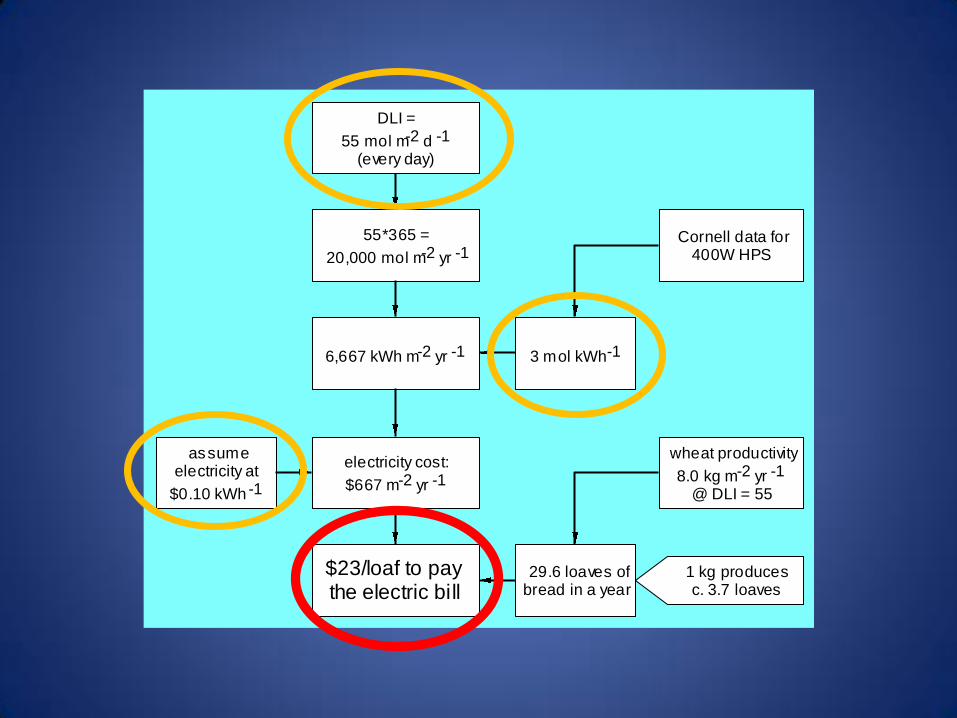
DLI =
55 mol m-2 d -1
(every day)
29.6 loaves of bread in a year
55*365 =
20,000 mol m-2 yr -1
3 mol kWh -1
assumeelectricity at
$0.10 kWh -1
6,667 kWh m-2 yr -1
electricity cost:
$667 m-2 yr -1
wheat productivity
8.0 kg m-2 yr -1
@ DLI = 55
$23/loaf to pay the electric bill
Cornell data for 400W HPS
1 kg producesc. 3.7 loaves
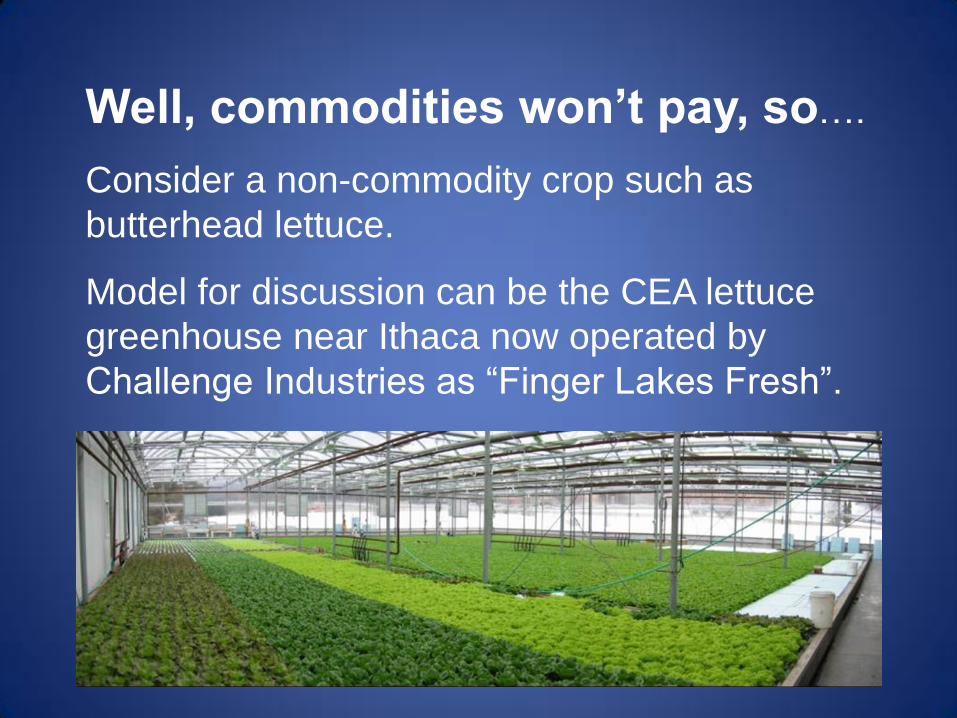
Well, commodities won’t pay, so….
Consider a non-commodity crop such as
butterhead lettuce.
Model for discussion can be the CEA lettuce
greenhouse near Ithaca now operated by
Challenge Industries as “Finger Lakes Fresh”.
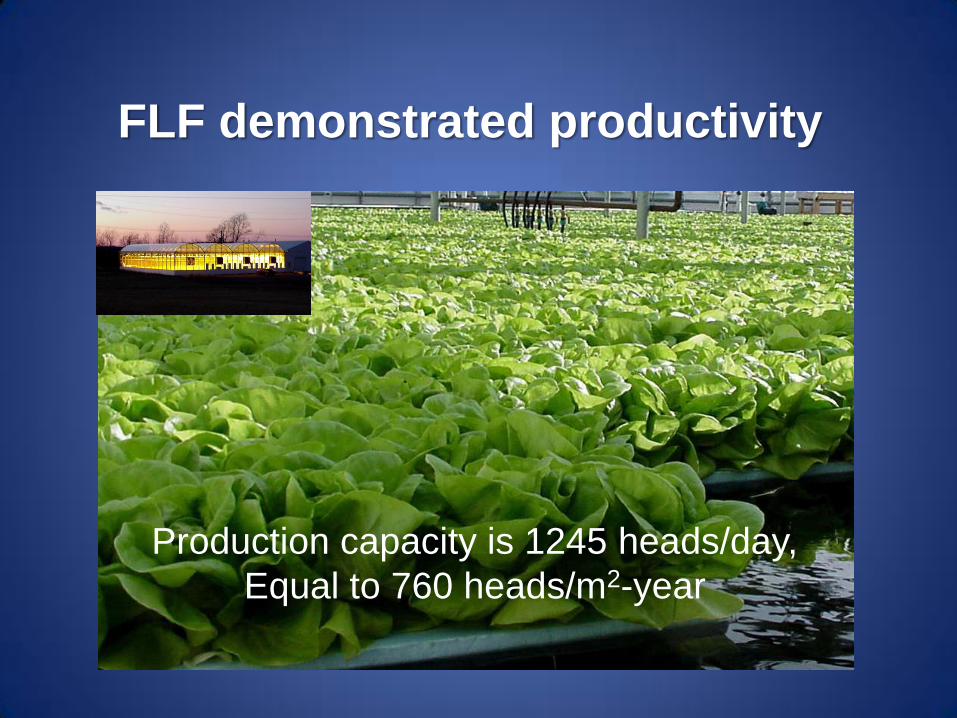
Production capacity is 1245 heads/day,
Equal to 760 heads/m2-year
FLF demonstrated productivity
What is the extra cost of total
closure???
Meaning 100% Artificial Light
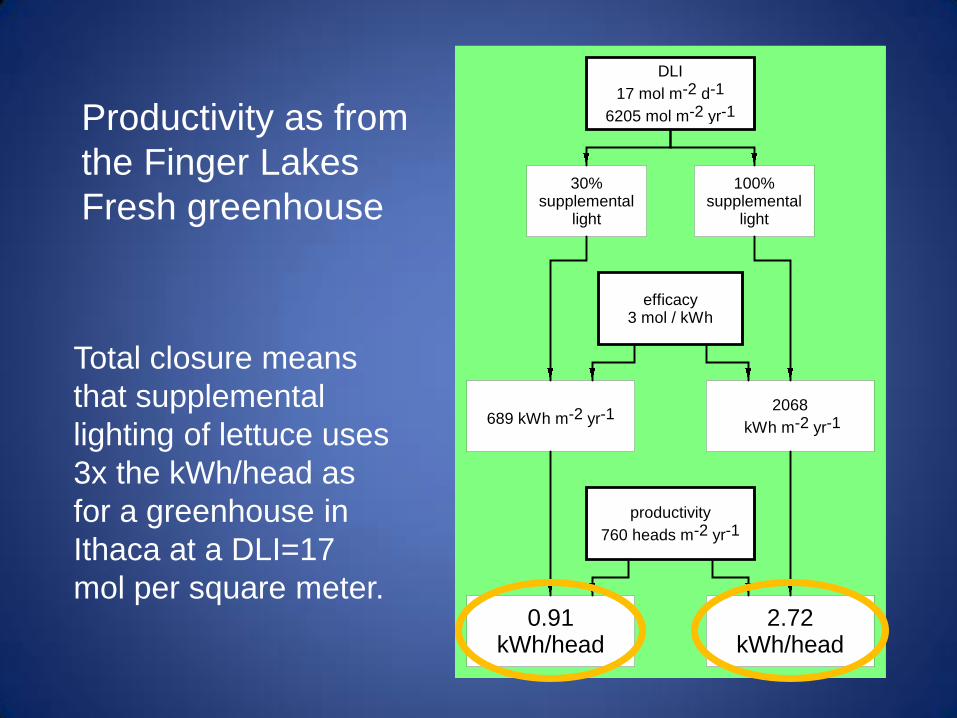
productivity
760 heads m-2 yr-1
100% supplemental
light
30% supplemental
light
DLI
17 mol m-2 d-1
6205 mol m-2 yr-1
efficacy3 mol / kWh
689 kWh m-2 yr-1
0.91 kWh/head
2068
kWh m-2 yr-1
2.72 kWh/head
Productivity as from
the Finger Lakes
Fresh greenhouse
Total closure means
that supplemental
lighting of lettuce uses
3x the kWh/head as
for a greenhouse in
Ithaca at a DLI=17
mol per square meter.
Conclude?
Hydroponic vegetable production is
already marginal in many situations.
Tripling the kWh per head of lettuce,
for example, seems economically
questionable today, and in the
foreseeable future.
But…depends on the market price.
But…depends on the market price.
This is where the enthusiasts base
their argument on cost, for example
They have a “special” deal.
Their local market will support a
higher price for locally-grown food.
The greater quality will make a
higher price acceptable.
OK, probably true -- but, let’s explore some other factors outside lighting energy input and cost… But first, some asides …
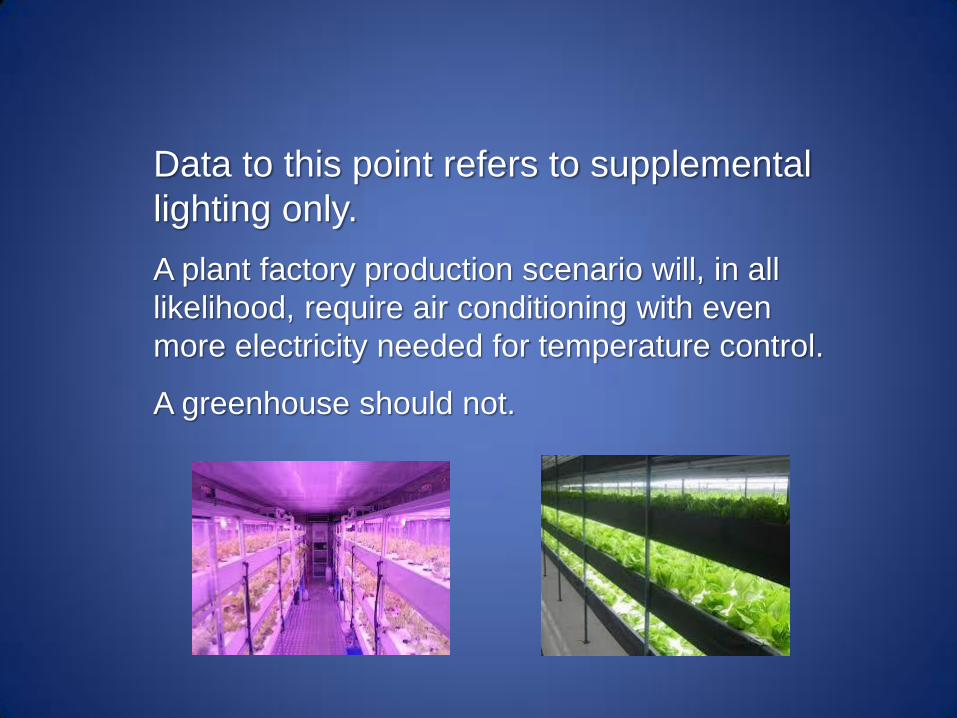
Data to this point refers to supplemental
lighting only.
A plant factory production scenario will, in all
likelihood, require air conditioning with even
more electricity needed for temperature control.
A greenhouse should not.
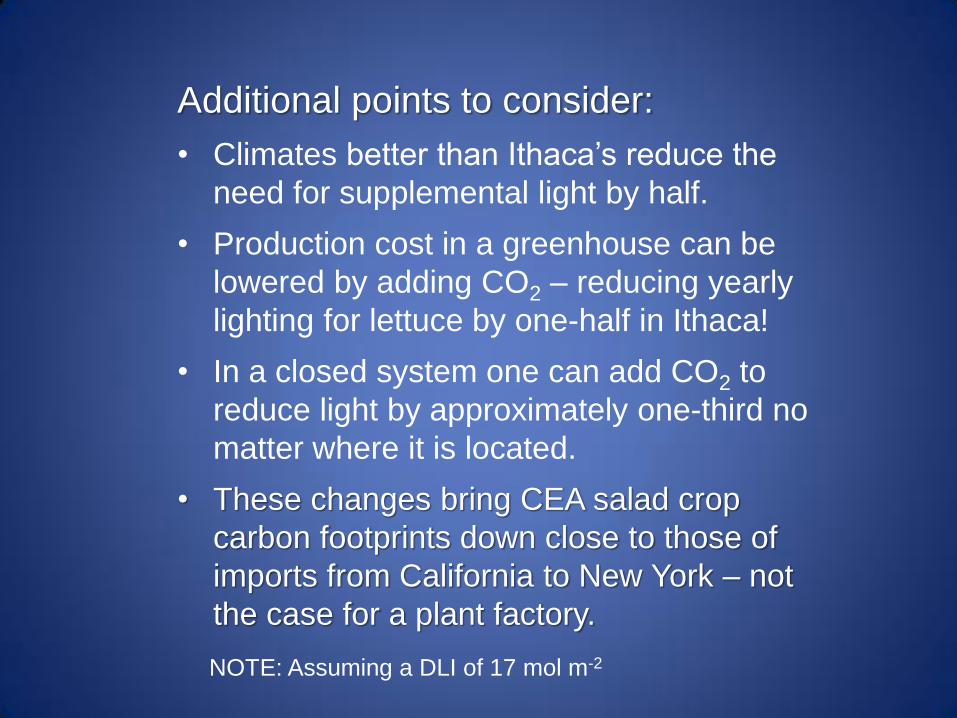
Additional points to consider:
• Climates better than Ithaca’s reduce the
need for supplemental light by half.
• Production cost in a greenhouse can be
lowered by adding CO2 – reducing yearly
lighting for lettuce by one-half in Ithaca!
• In a closed system one can add CO2 to
reduce light by approximately one-third no
matter where it is located.
• These changes bring CEA salad crop
carbon footprints down close to those of
imports from California to New York – not
the case for a plant factory.
NOTE: Assuming a DLI of 17 mol m-2
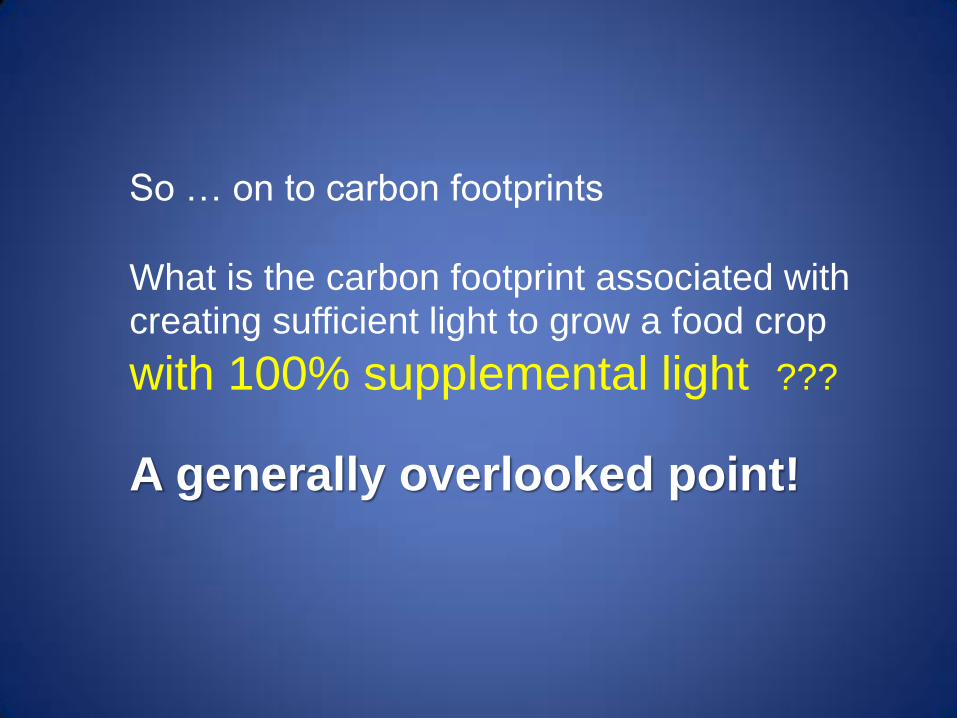
So … on to carbon footprints
What is the carbon footprint associated with creating sufficient light to grow a food crop
with 100% supplemental light ???
A generally overlooked point!
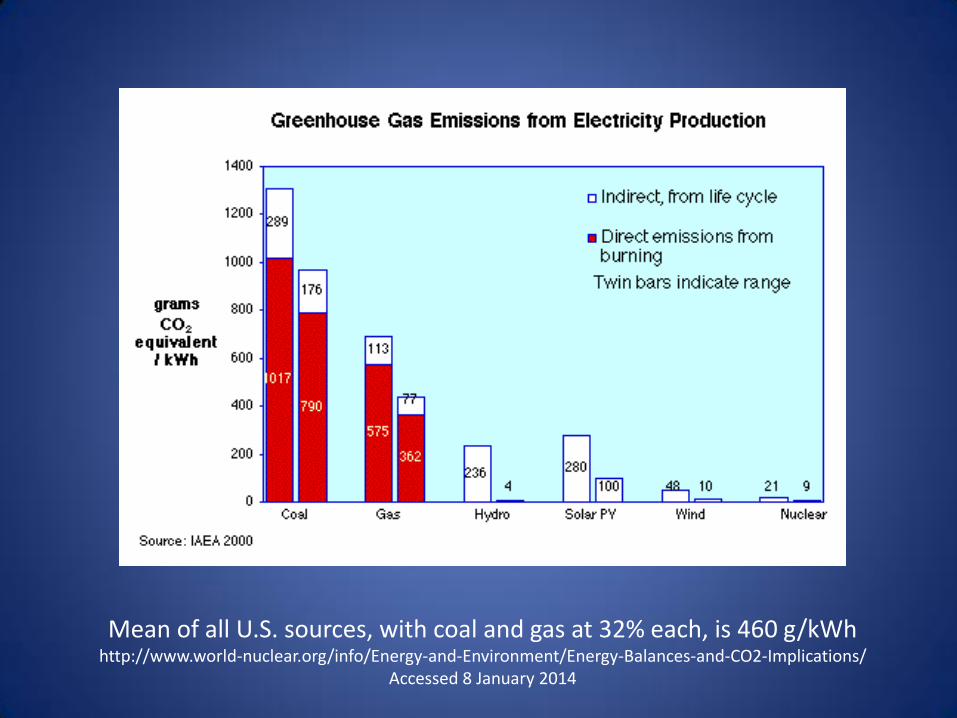
Mean of all U.S. sources, with coal and gas at 32% each, is 460 g/kWh http://www.world-nuclear.org/info/Energy-and-Environment/Energy-Balances-and-CO2-Implications/
Accessed 8 January 2014

What does this mean in a practical sense????
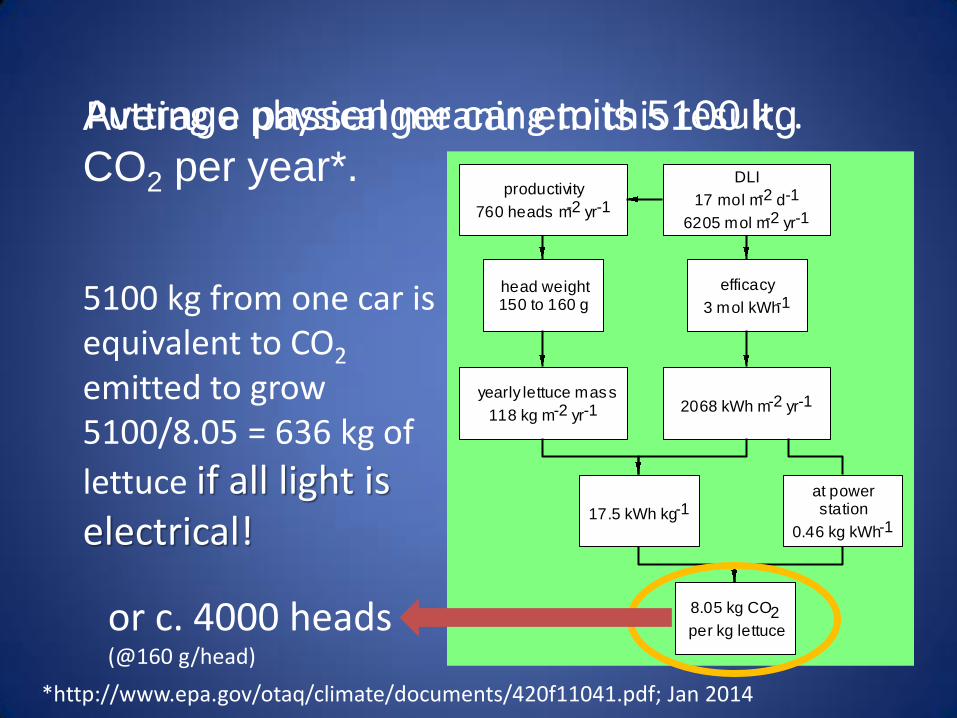
productivity
760 heads m-2 yr-1
head weight150 to 160 g
yearly lettuce mass
118 kg m-2 yr-1
DLI
17 mol m-2 d-1
6205 mol m-2 yr-1
efficacy
3 mol kWh-1
2068 kWh m-2 yr-1
17.5 kWh kg-1at power station
0.46 kg kWh-1
8.05 kg CO2per kg lettuce
Average passenger car emits 5100 kg
CO2 per year*.
5100 kg from one car is equivalent to CO2 emitted to grow 5100/8.05 = 636 kg of
lettuce if all light is electrical!
*http://www.epa.gov/otaq/climate/documents/420f11041.pdf; Jan 2014
or c. 4000 heads (@160 g/head)
Putting a physical meaning to this result…
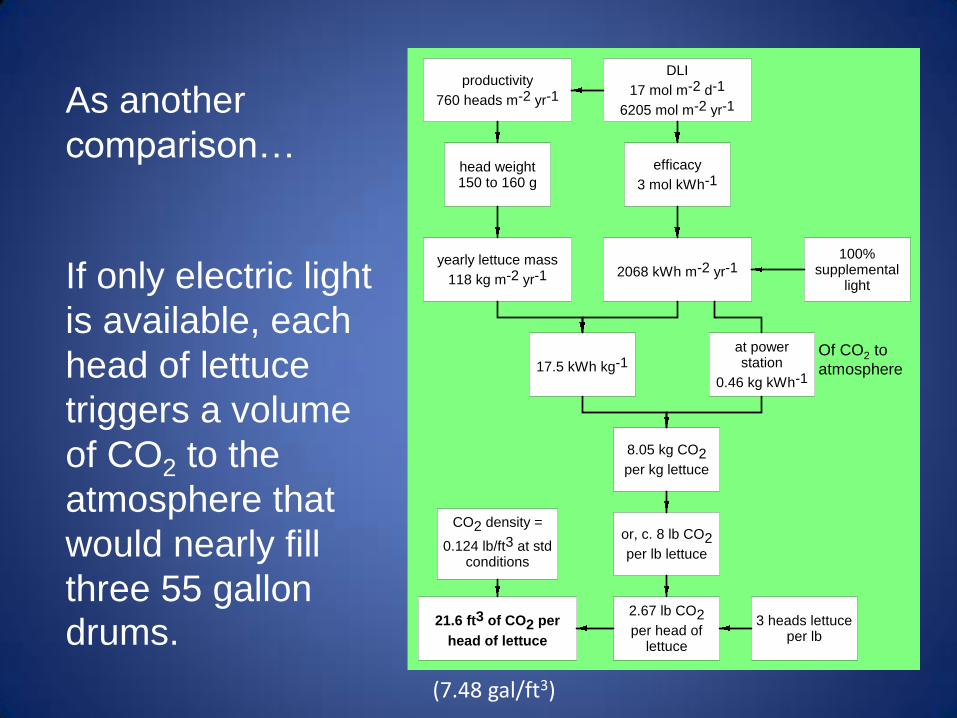
As another
comparison…
productivity
760 heads m-2 yr-1
head weight150 to 160 g
yearly lettuce mass
118 kg m-2 yr-1
DLI
17 mol m-2 d-1
6205 mol m-2 yr-1
efficacy
3 mol kWh-1
2068 kWh m-2 yr-1
17.5 kWh kg-1at power station
0.46 kg kWh-1
8.05 kg CO2per kg lettuce
or, c. 8 lb CO2
per lb lettuce
3 heads lettuce per lb
2.67 lb CO2
per head of lettuce
CO2 density =
0.124 lb/ft3 at std
conditions
21.6 ft3 of CO2 per
head of lettuce
100% supplemental
light
Of CO2 to
atmosphere
(7.48 gal/ft3)
If only electric light
is available, each
head of lettuce
triggers a volume
of CO2 to the
atmosphere that
would nearly fill
three 55 gallon drums.
How about in an Ithaca greenhouse?
productivity
760 heads m-2 yr-1
head weight150 to 160 g
yearly lettuce mass
118 kg m-2 yr-1
DLI
17 mol m-2 d-1
6205 mol m-2 yr-1
efficacy
3 mol kWh-1
620 kWh m-2 yr-1
5.3 kWh kg-1at power station
0.46 kg kWh-1
2.42 kg CO2per kg lettuce
70% from the sun30% from the utility
In cloudy Ithaca
Compared to 8.05
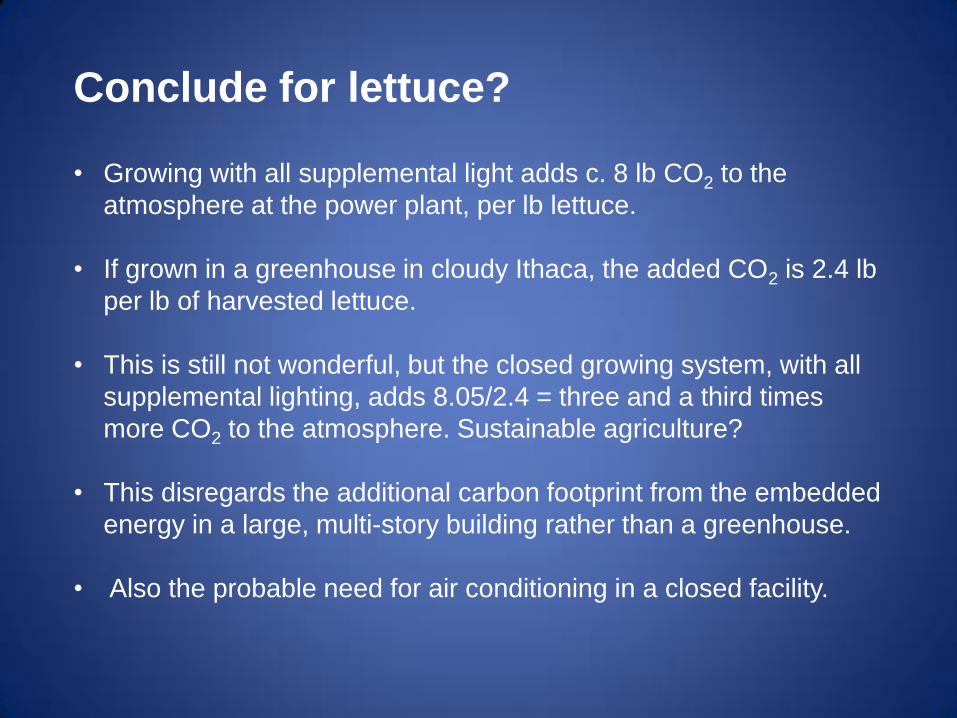
Conclude for lettuce? • Growing with all supplemental light adds c. 8 lb CO2 to the
atmosphere at the power plant, per lb lettuce.
• If grown in a greenhouse in cloudy Ithaca, the added CO2 is 2.4 lb
per lb of harvested lettuce.
• This is still not wonderful, but the closed growing system, with all
supplemental lighting, adds 8.05/2.4 = three and a third times
more CO2 to the atmosphere. Sustainable agriculture?
• This disregards the additional carbon footprint from the embedded
energy in a large, multi-story building rather than a greenhouse.
• Also the probable need for air conditioning in a closed facility.
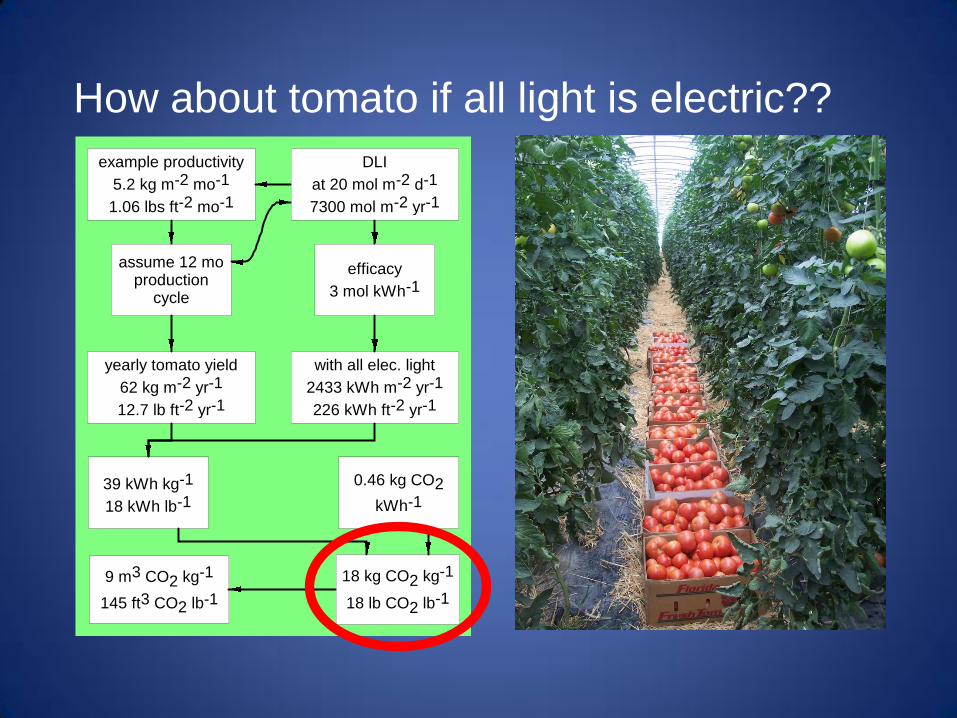
example productivity
5.2 kg m-2 mo-1
1.06 lbs ft-2 mo-1
assume 12 mo production
cycle
yearly tomato yield
62 kg m-2 yr-1
12.7 lb ft-2 yr-1
DLI
at 20 mol m-2 d-1
7300 mol m-2 yr-1
efficacy
3 mol kWh-1
with all elec. light
2433 kWh m-2 yr-1
226 kWh ft-2 yr-1
39 kWh kg-1
18 kWh lb-1
18 kg CO2 kg-1
18 lb CO2 lb-1
0.46 kg CO2
kWh-1
9 m3 CO2 kg-1
145 ft3 CO2 lb-1
How about tomato if all light is electric??
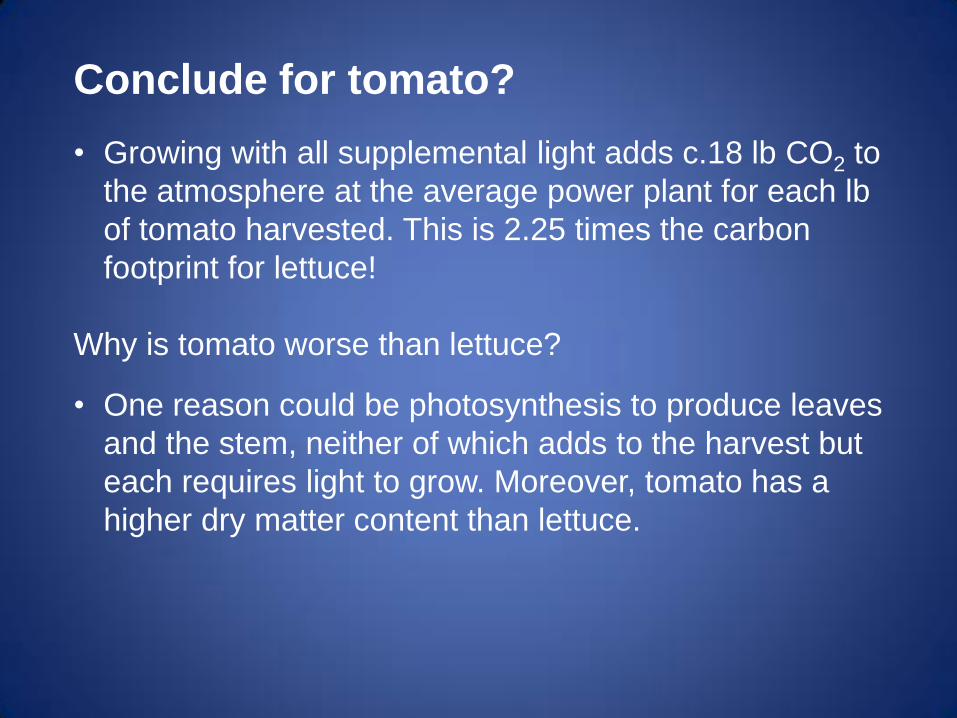
Conclude for tomato?
• Growing with all supplemental light adds c.18 lb CO2 to
the atmosphere at the average power plant for each lb
of tomato harvested. This is 2.25 times the carbon
footprint for lettuce!
Why is tomato worse than lettuce?
• One reason could be photosynthesis to produce leaves
and the stem, neither of which adds to the harvest but
each requires light to grow. Moreover, tomato has a
higher dry matter content than lettuce.
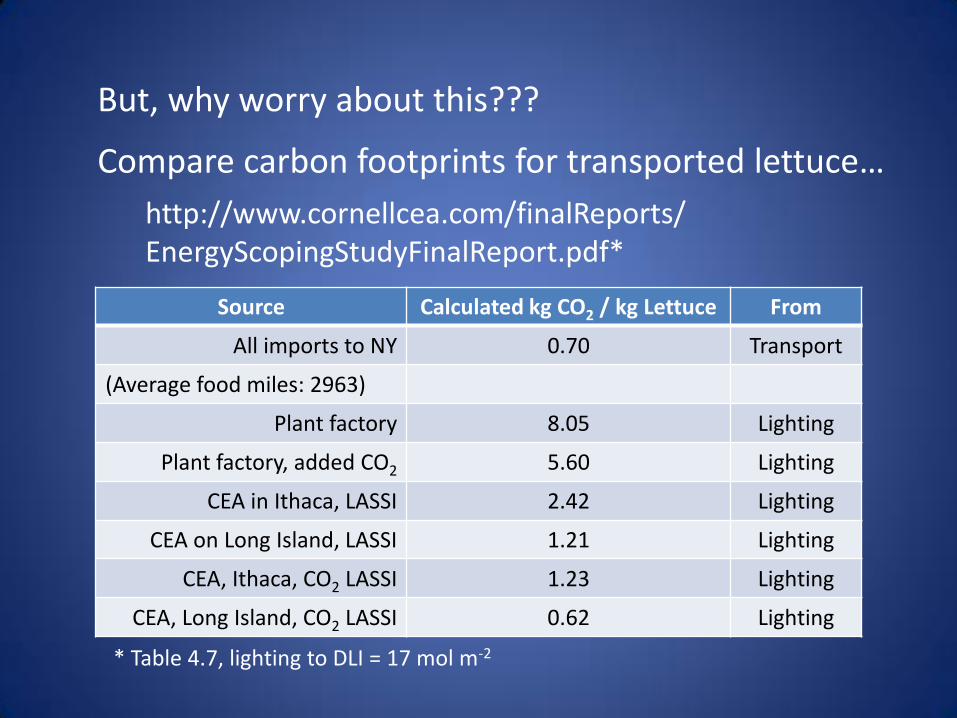
But, why worry about this???
Compare carbon footprints for transported lettuce…
http://www.cornellcea.com/finalReports/ EnergyScopingStudyFinalReport.pdf*
Source Calculated kg CO2 / kg Lettuce From
All imports to NY 0.70 Transport
(Average food miles: 2963)
Plant factory 8.05 Lighting
Plant factory, added CO2 5.60 Lighting
CEA in Ithaca, LASSI 2.42 Lighting
CEA on Long Island, LASSI 1.21 Lighting
CEA, Ithaca, CO2 LASSI 1.23 Lighting
CEA, Long Island, CO2 LASSI 0.62 Lighting
* Table 4.7, lighting to DLI = 17 mol m-2
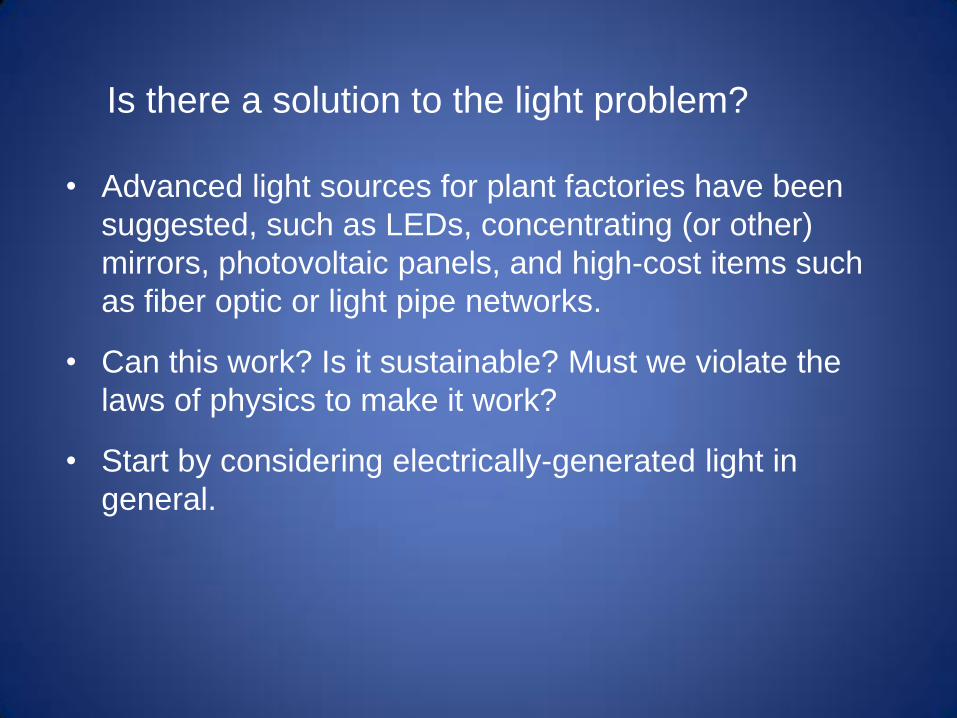
Is there a solution to the light problem?
• Advanced light sources for plant factories have been
suggested, such as LEDs, concentrating (or other)
mirrors, photovoltaic panels, and high-cost items such
as fiber optic or light pipe networks.
• Can this work? Is it sustainable? Must we violate the
laws of physics to make it work?
• Start by considering electrically-generated light in
general.
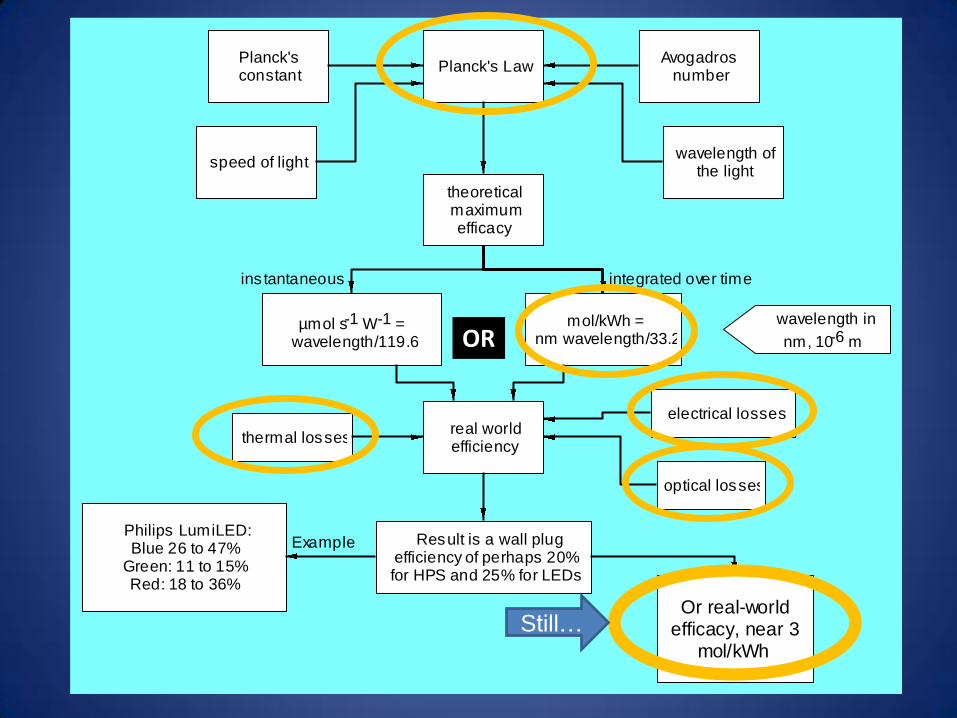
theoretical maximum efficacy
Planck's LawPlanck's constant
speed of light
Avogadros number
wavelength of the light
µmol s-1 W-1 = wavelength/119.6
mol/kWh =nm wavelength/33.2
real world efficiency
Result is a wall plug efficiency of perhaps 20% for HPS and 25% for LEDs
Philips LumiLED:Blue 26 to 47%
Green: 11 to 15%Red: 18 to 36%
optical losses
electrical losses
thermal losses
wavelength in
nm, 10-6 m
Or real-world efficacy, near 3
mol/kWh
ins tantaneous integrated over time
Example
OR
Still…
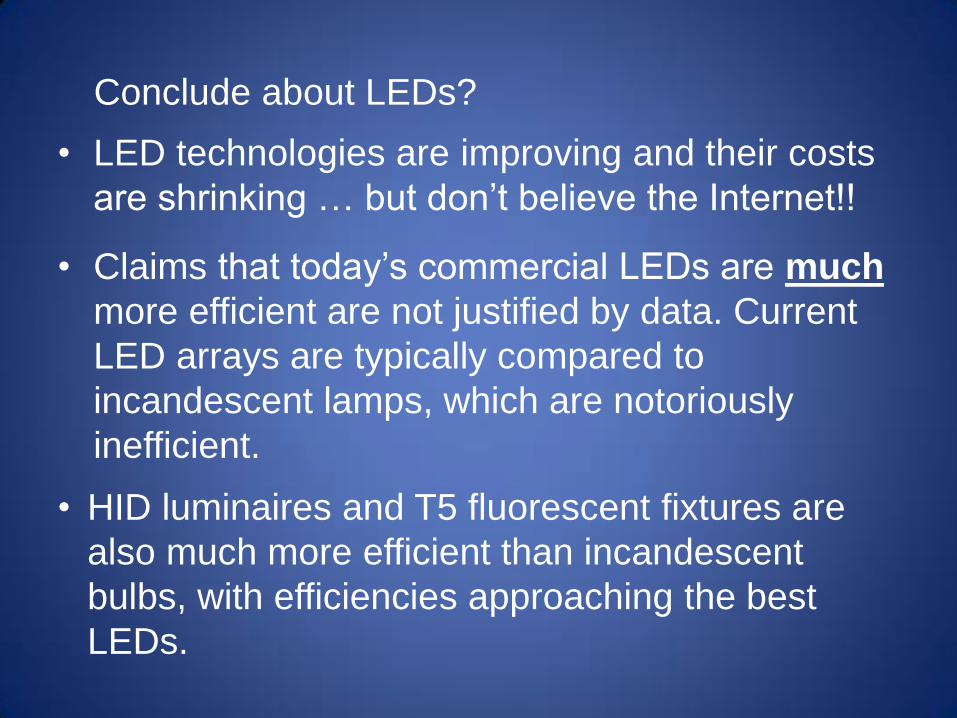
• LED technologies are improving and their costs
are shrinking … but don’t believe the Internet!!
• Claims that today’s commercial LEDs are much
more efficient are not justified by data. Current
LED arrays are typically compared to
incandescent lamps, which are notoriously
inefficient.
• HID luminaires and T5 fluorescent fixtures are
also much more efficient than incandescent
bulbs, with efficiencies approaching the best
LEDs.
Conclude about LEDs?
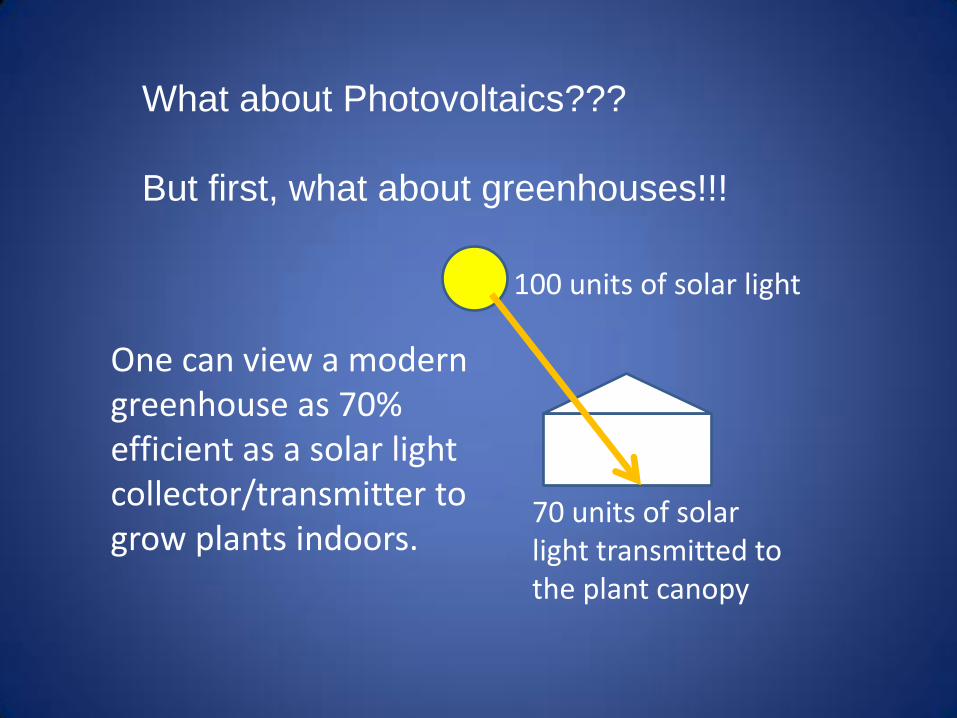
What about Photovoltaics???
But first, what about greenhouses!!!
100 units of solar light
70 units of solar light transmitted to the plant canopy
One can view a modern greenhouse as 70% efficient as a solar light collector/transmitter to grow plants indoors.
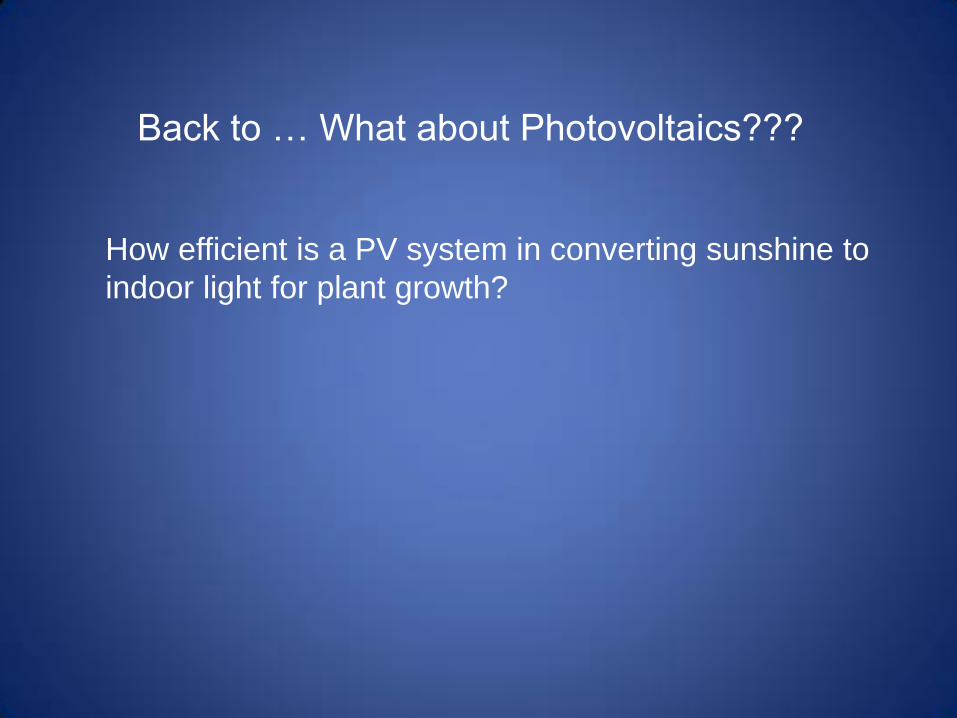
How efficient is a PV system in converting sunshine to
indoor light for plant growth?
Back to … What about Photovoltaics???
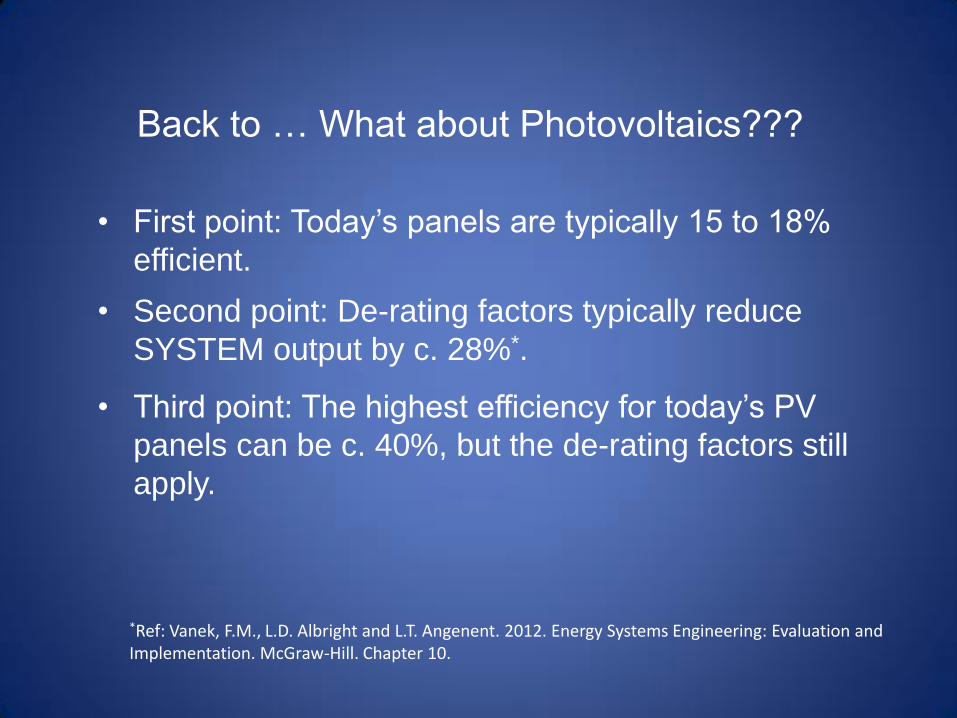
Back to … What about Photovoltaics???
• First point: Today’s panels are typically 15 to 18%
efficient.
• Second point: De-rating factors typically reduce
SYSTEM output by c. 28%*.
• Third point: The highest efficiency for today’s PV
panels can be c. 40%, but the de-rating factors still
apply.
*Ref: Vanek, F.M., L.D. Albright and L.T. Angenent. 2012. Energy Systems Engineering: Evaluation and Implementation. McGraw-Hill. Chapter 10.
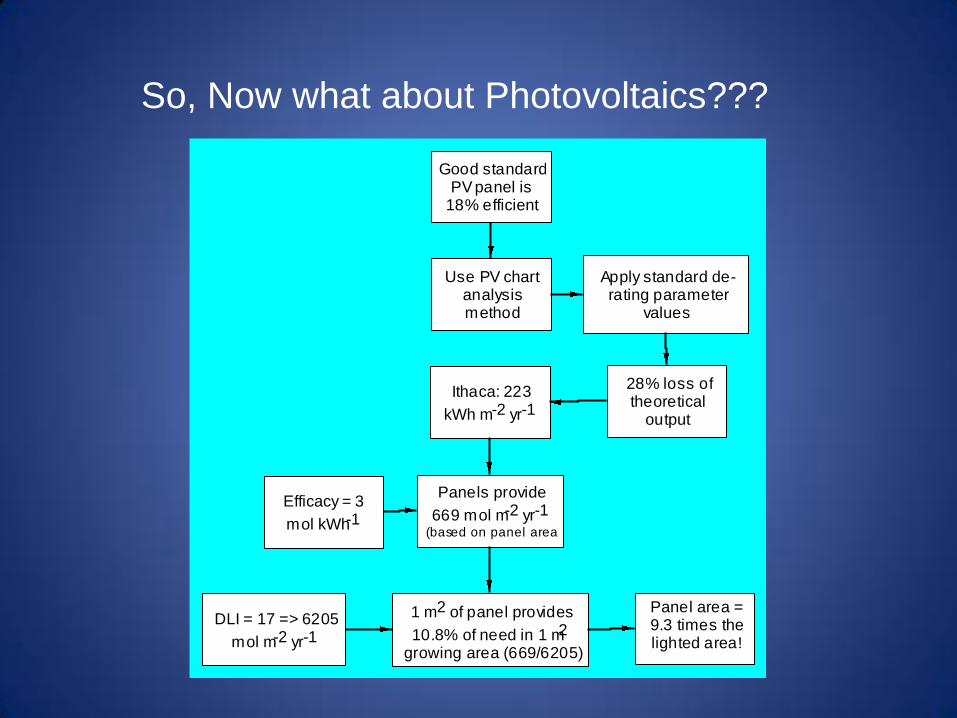
Good standard PV panel is
18% efficient
Use PV chart analysis method
Apply standard de-rating parameter
values
28% loss of theoretical
output
Ithaca: 223
kWh m-2 yr-1
DLI = 17 => 6205
mol m-2 yr-1
Efficacy = 3
mol kWh-1
1 m2 of panel provides
10.8% of need in 1 m2 growing area (669/6205)
Panels provide
669 mol m-2 yr-1
(based on panel area!)
Panel area =9.3 times the lighted area!
So, Now what about Photovoltaics???
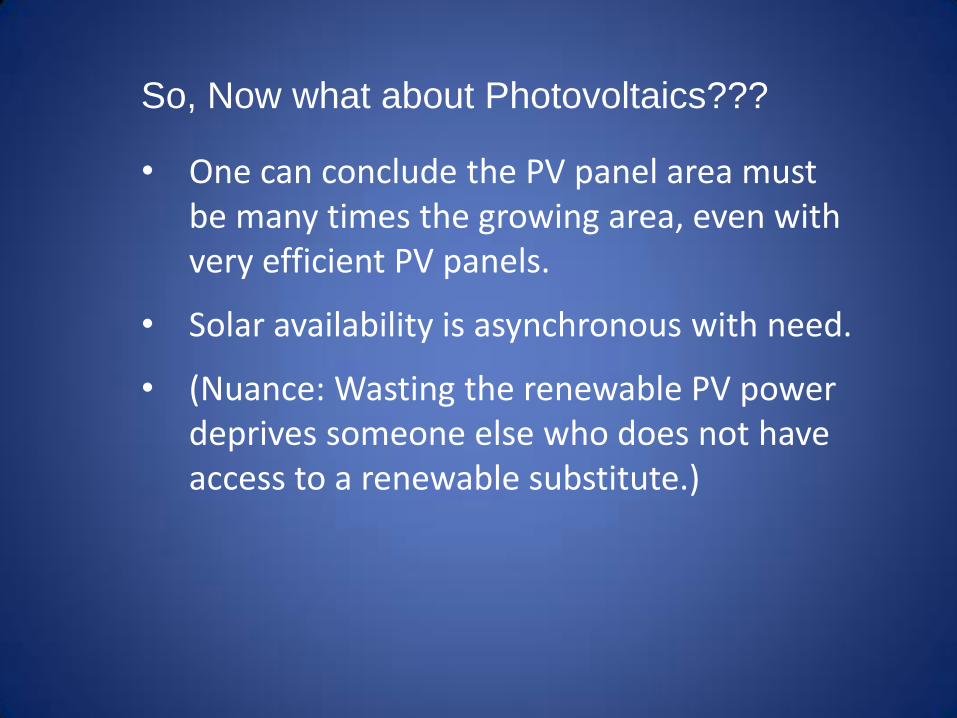
• One can conclude the PV panel area must be many times the growing area, even with very efficient PV panels.
• Solar availability is asynchronous with need.
• (Nuance: Wasting the renewable PV power deprives someone else who does not have access to a renewable substitute.)
So, Now what about Photovoltaics???
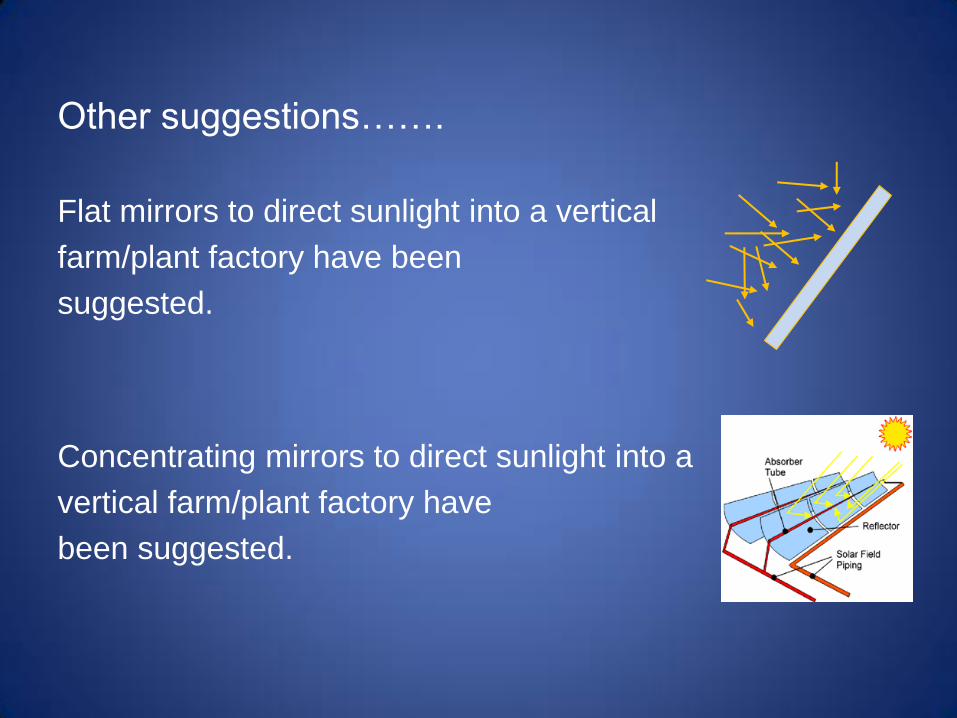
Other suggestions…….
Flat mirrors to direct sunlight into a vertical
farm/plant factory have been
suggested.
Concentrating mirrors to direct sunlight into a
vertical farm/plant factory have
been suggested.

Can we use flat Mirrors?
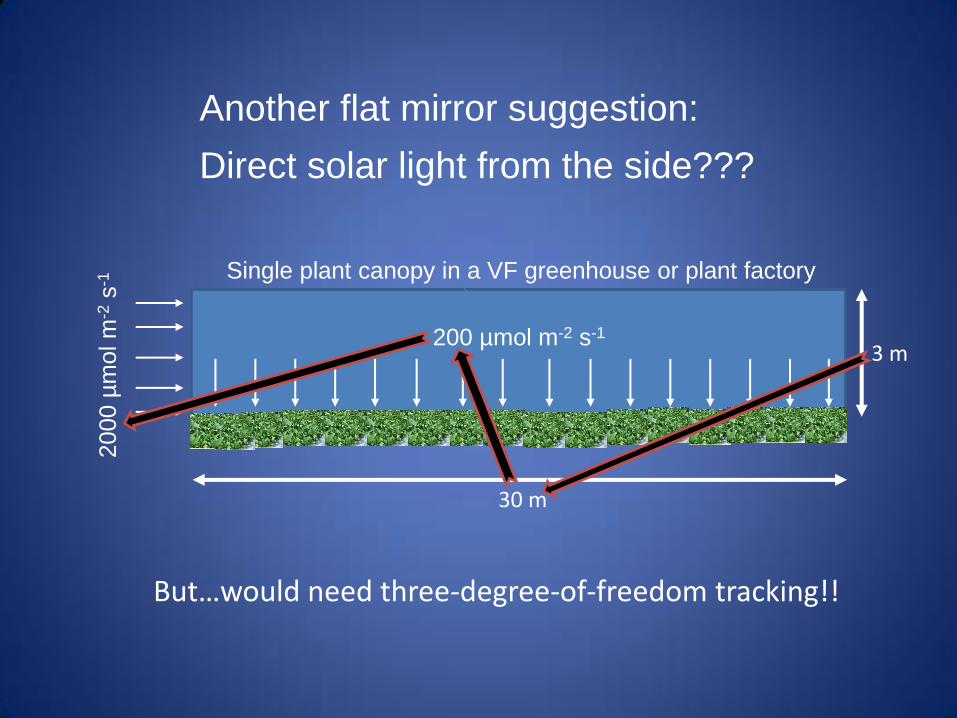
30 m
3 m 200 µmol m-2 s-1
2000 µ
mol m
-2 s
-1
Another flat mirror suggestion:
Direct solar light from the side???
Single plant canopy in a VF greenhouse or plant factory
But…would need three-degree-of-freedom tracking!!
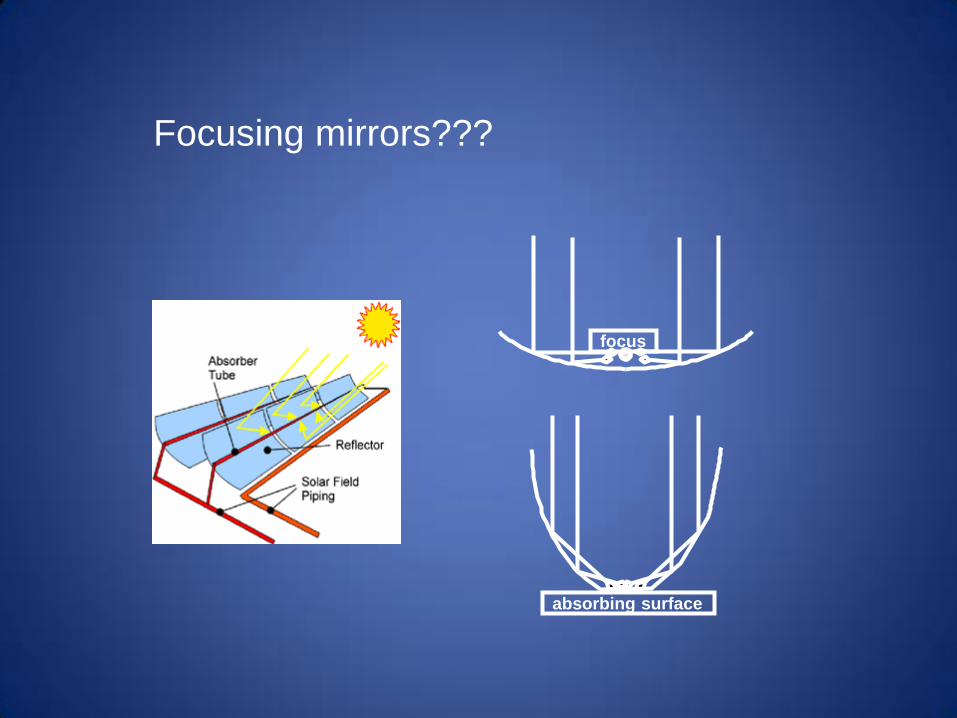
focus
absorbing surface
Focusing mirrors???
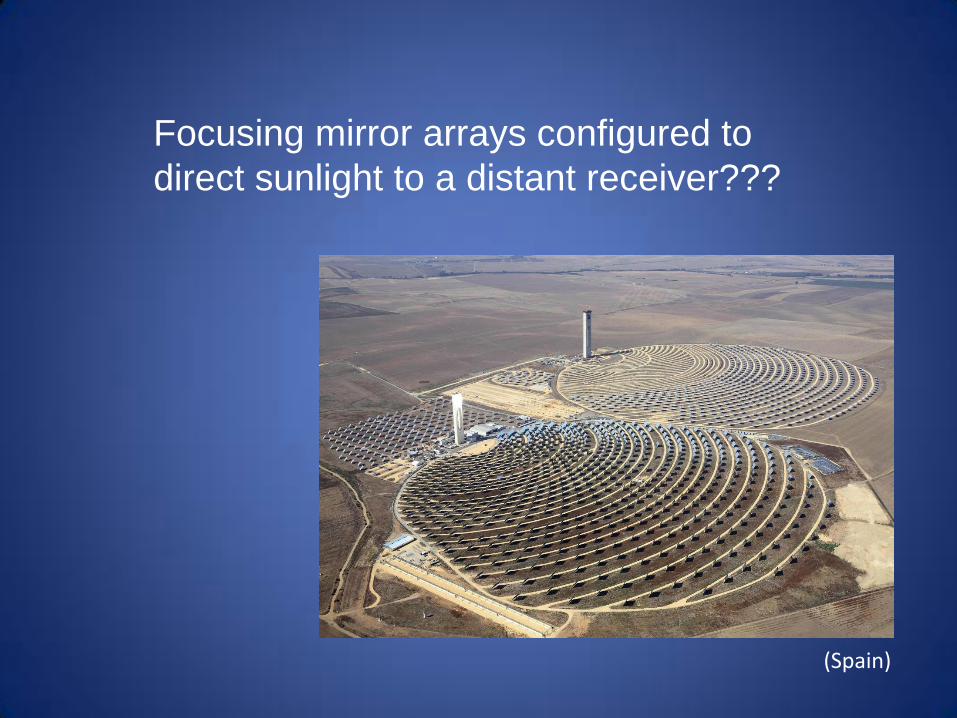
Focusing mirror arrays configured to
direct sunlight to a distant receiver???
(Spain)
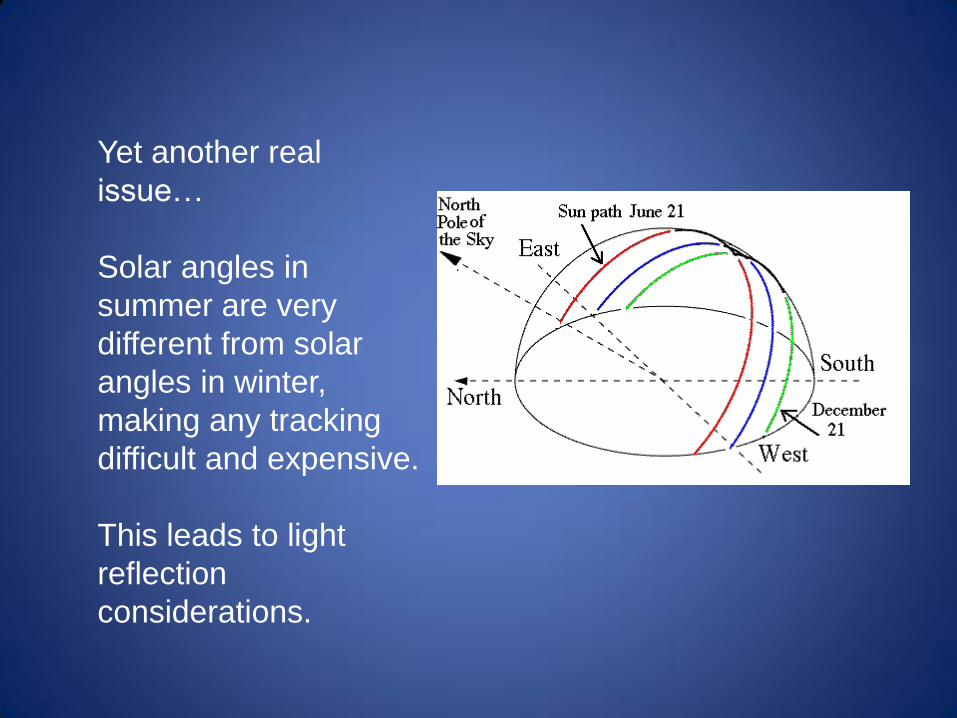
Yet another real
issue…
Solar angles in
summer are very
different from solar
angles in winter,
making any tracking
difficult and expensive.
This leads to light
reflection
considerations.
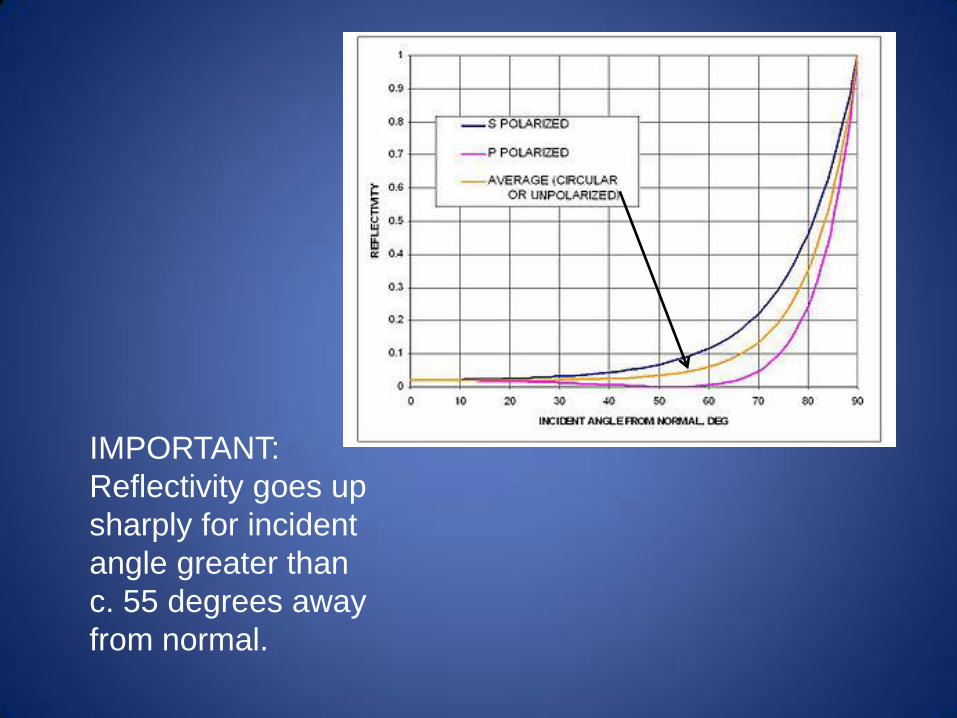
IMPORTANT:
Reflectivity goes up
sharply for incident
angle greater than
c. 55 degrees away
from normal.
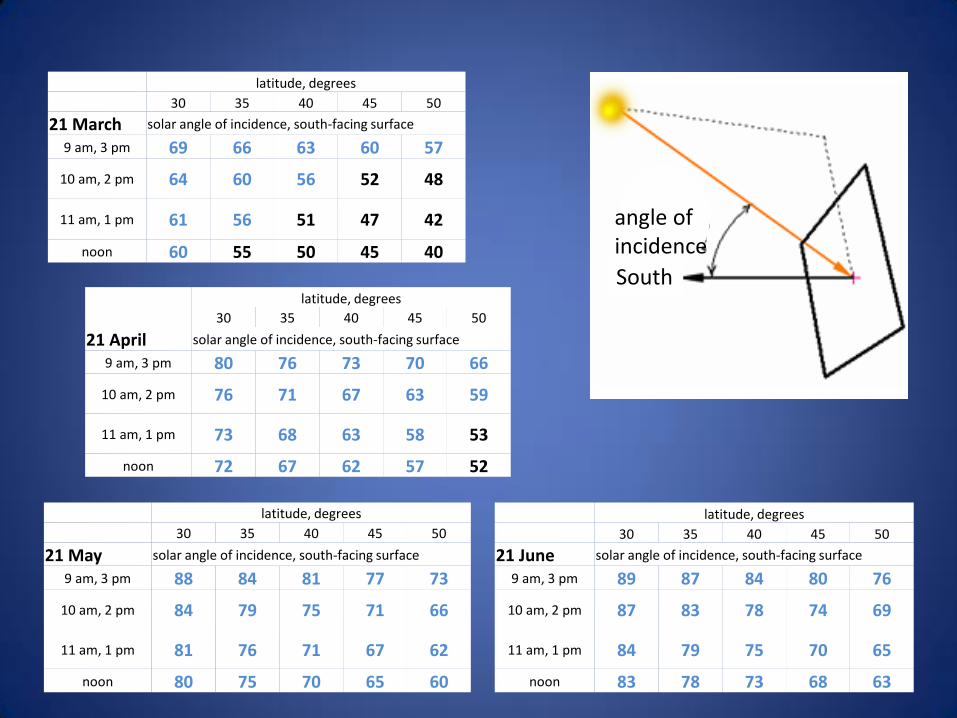
latitude, degrees
30 35 40 45 50
21 March solar angle of incidence, south-facing surface
9 am, 3 pm 69 66 63 60 57
10 am, 2 pm 64 60 56 52 48
11 am, 1 pm 61 56 51 47 42
noon 60 55 50 45 40
latitude, degrees
30 35 40 45 50
21 April solar angle of incidence, south-facing surface
9 am, 3 pm 80 76 73 70 66
10 am, 2 pm 76 71 67 63 59
11 am, 1 pm 73 68 63 58 53
noon 72 67 62 57 52
latitude, degrees
30 35 40 45 50
21 May solar angle of incidence, south-facing surface
9 am, 3 pm 88 84 81 77 73
10 am, 2 pm 84 79 75 71 66
11 am, 1 pm 81 76 71 67 62
noon 80 75 70 65 60
latitude, degrees
30 35 40 45 50
21 June solar angle of incidence, south-facing surface
9 am, 3 pm 89 87 84 80 76
10 am, 2 pm 87 83 78 74 69
11 am, 1 pm 84 79 75 70 65
noon 83 78 73 68 63
angle of incidence
South

But, ending on a somewhat
more positive note…
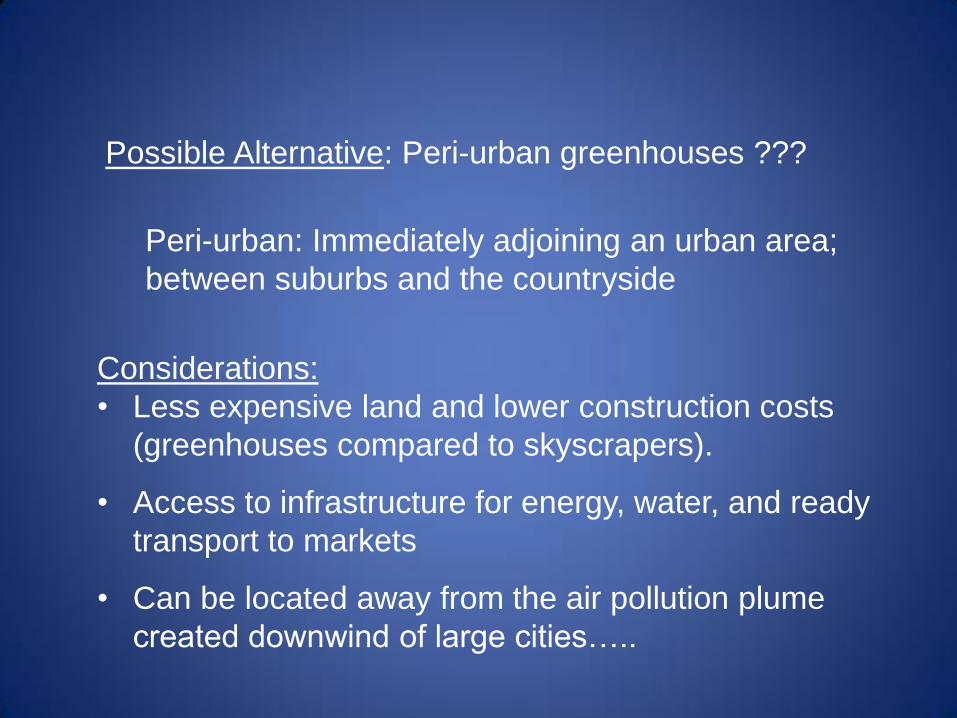
Possible Alternative: Peri-urban greenhouses ???
Peri-urban: Immediately adjoining an urban area;
between suburbs and the countryside
Considerations:
• Less expensive land and lower construction costs
(greenhouses compared to skyscrapers).
• Access to infrastructure for energy, water, and ready
transport to markets
• Can be located away from the air pollution plume
created downwind of large cities…..
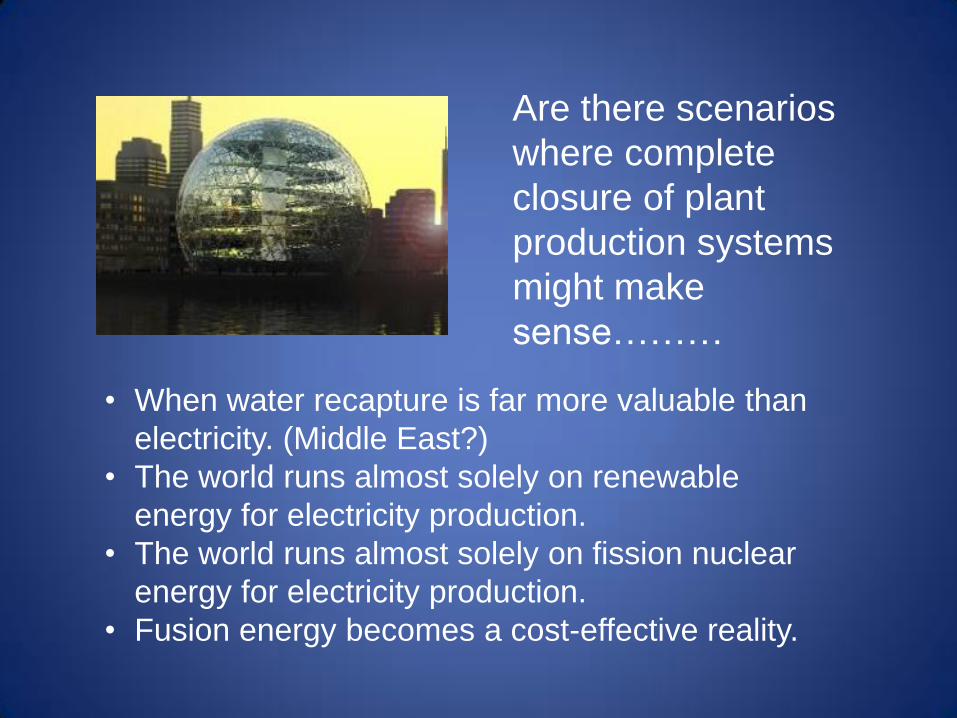
Are there scenarios
where complete
closure of plant
production systems
might make
sense………
• When water recapture is far more valuable than
electricity. (Middle East?)
• The world runs almost solely on renewable
energy for electricity production.
• The world runs almost solely on fission nuclear
energy for electricity production.
• Fusion energy becomes a cost-effective reality.
But, except for possible water
recapture benefits, these
scenarios are unlikely in our
lifetimes.
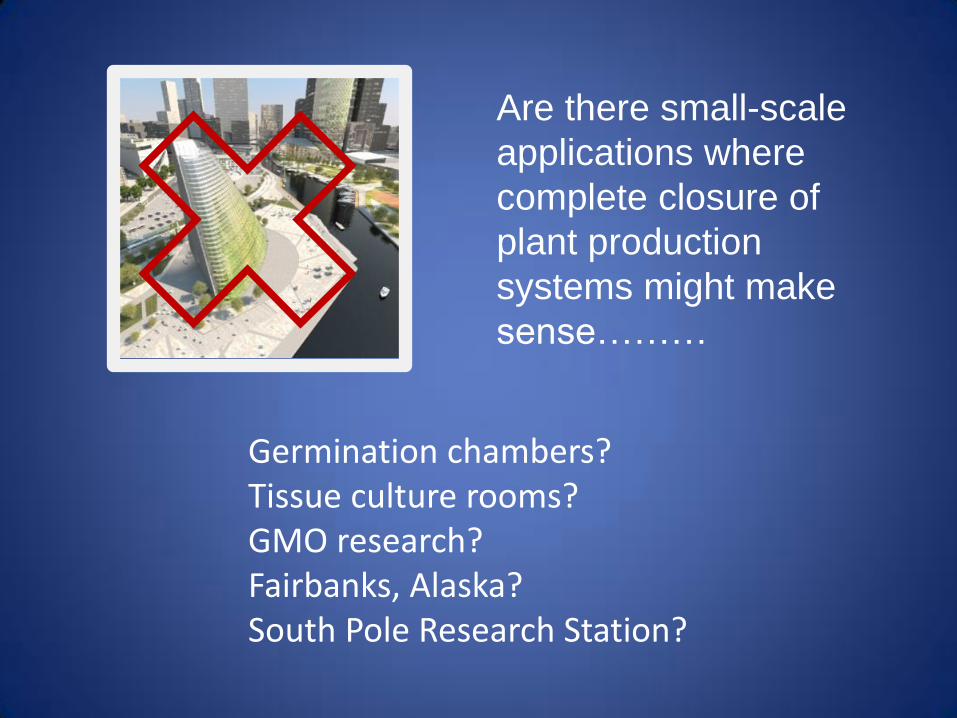
Are there small-scale
applications where
complete closure of
plant production
systems might make
sense………
Germination chambers? Tissue culture rooms? GMO research? Fairbanks, Alaska? South Pole Research Station?
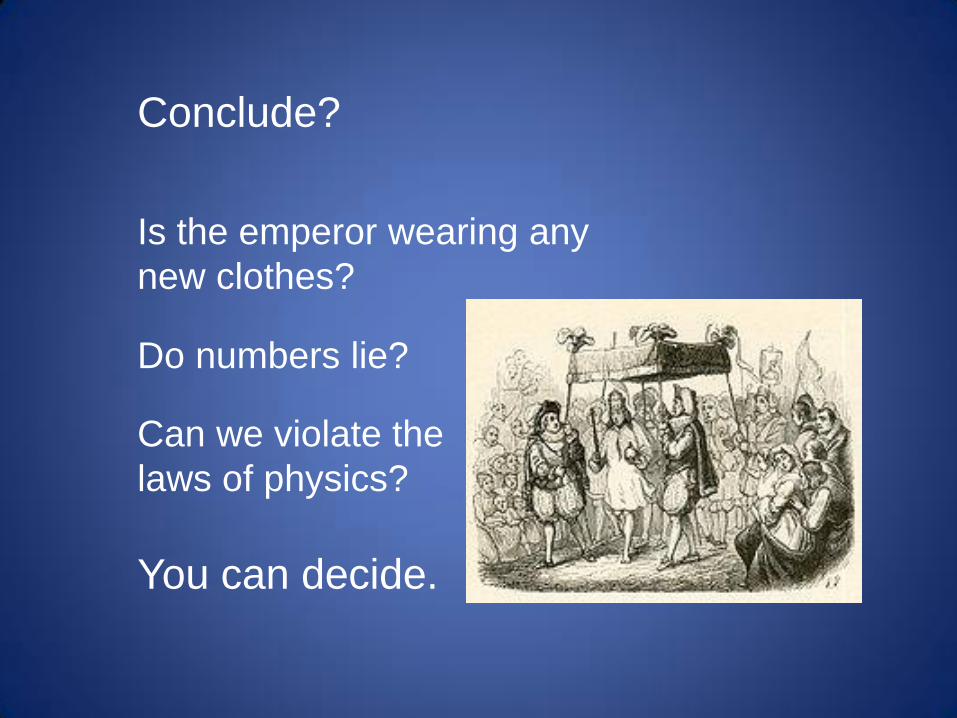
Is the emperor wearing any
new clothes?
Conclude?
You can decide.
Do numbers lie?
Can we violate the
laws of physics?
Thank You !