Urban Microgrids - Actu-Environnement
55
URBAN MICROGRIDS January 2017 Overview, challenges and opportunities A study funded by:
Transcript of Urban Microgrids - Actu-Environnement

URBAN MICROGRIDS January 2017
Overview, challenges and opportunities
A study funded by:

2 URBAN MICROGRIDS
ENEA ADVISES AND SUPPORTS INDUSTRIAL AND INSTITUTIONAL ACTORS IN THE ENERGY SECTOR
About ENEA Consulting
Since 2007, ENEA has been advising and supporting leading private sector companies and public authorities around the world on the topic of energy transition sectors and markets. Through dedicated consulting services and pro bono support to NGOs and social entrepreneurs selected for their high potential impact, ENEA is also
committed to energy access.
The present document is ENEA’s final report that compiles the data and presents the analyses carried out for the “Urban Microgrid” study funded by Paris Aéroport, Caisse des Dépôts et Consignations, ENEDIS, Fondation Tuck, OMEXOM, and TOTAL. This document is intended for public dissemination.
Authors and Contributors
Authors:
Maeva Faure – Analyst, ENEA Consulting, [email protected]
Martin Salmon – Analyst, ENEA Consulting, [email protected]
Safae El Fadili – Manager, ENEA Consulting, [email protected]
Luc Payen – Manager, ENEA Consulting, [email protected]
Key project contributors:
Arnaud Banner – Technical Managing Director, OMEXOM, [email protected]
Andreas Ehinger – Managing Director, Fondation Tuck, [email protected]
Sebastien Illouz – Energy Efficiency Expert, Groupe Caisse des Dépôts, [email protected]
Guillaume Kerlero – Director, ENEA Consulting, [email protected]
Veronique Jolivet – Solar Business Development Manager for Africa, TOTAL, [email protected]
Jeanne Michon Savarit – Senior Energy Manager, Groupe ADP, [email protected]
Roland Picot - Renewable Energy Investment Officer, Groupe Caisse des Dépôts, [email protected]
Karl Axel Strang - Strategy advisor, Strategy Division, ENEDIS, [email protected]
ENEA, 2017
Reproduction is authorized provided the source is acknowledged

Executive summary 3
ENEA ADVISES AND SUPPORTS INDUSTRIAL AND INSTITUTIONAL ACTORS IN THE ENERGY SECTOR
1 EXECUTIVE SUMMARY Microgrids: promising potential for a modernized electric infrastructure?
The electricity production and distribution system, the backbone of an increasingly urban and energy-dependent society, must urgently be shifted towards more resilient, efficient and environment-friendly infrastructures. Decentralized electricity production in densely populated areas is an opportunity to achieve this transition. Local electricity production and self-consumption in cities is hardly new: the energy security needs of some sensitive sites (hospitals, military bases, research centers, etc.) have long been addressed by local private networks able to provide back-up electricity if the main grid goes down. Some have been upgraded to “microgrids” where local production supplies base electricity to grid-connected end-user(s), and on-site assets are still able to run the microgrid in off-grid mode for a limited period of time. The integration of recent advances in renewable energy and smart grid technologies in such urban microgrids holds many promises: resiliency, reduced costs, and sustainability of electricity supply. This potential has sparked interest among different stakeholders, such as energy companies, utilities, end-users and public authorities; however the functionalities and expected benefits of microgrids are still diverse and sometimes intangible. The present study offers a vision of the definition of an urban microgrid, the value brought by a microgrid in different contexts based on real case studies1, and the upcoming challenges that microgrid stakeholders will face.
Study outcomes suggest that islanding, an inherent feature of the microgrid concept, leads to a significant premium on electricity costs, especially in systems highly reliant on intermittent electricity production. In this case, a smart embedded network, with local energy production and no islanding, can be customized according to end-user needs to meet their sustainability and cost savings goals at lower costs. Whether these local networks island or not, they face strong regulatory challenges that must be overcome to foster the further development of embedded networks.
The technical hurdles associated with islanding can be overcome with existing solutions, but might generate substantial costs
Several issues need to be addressed to properly harvest the value lying in microgrids: complex and sometimes costly technologies, business models for viable value redistribution, and a constraining regulatory framework.
According to a microgrid’s maturity and complexity, its energy production, distribution and storage assets, as well as smart grid equipment, may require significant upfront investments. The complexity of islanding triggers additional costs that cannot be overlooked and that are especially high when the microgrid is based only on renewable intermittent electricity sources and batteries for energy storage. Project developers need to evaluate the microgrid costs carefully in order to check that they are in line with what the end user is prepared to pay for their energy security requirements, and if a relevant business model can be designed on this basis. In Europe, energy reliability requirements are well met by the main grids that provide high-quality reliable power, which is rarely jeopardized by exceptional events, such as natural or industrial disasters. Thus, potential customers are not likely to be ready to pay for the resiliency provided by a microgrid.
1 Three case studies have been conducted, based on an EcoDistrict with peak air-conditioning loads in San Diego,
California, a French airport looking for increased sustainability, and an industrial site with heavy thermal needs in a congested electricity network area.

4 URBAN MICROGRIDS
ENEA ADVISES AND SUPPORTS INDUSTRIAL AND INSTITUTIONAL ACTORS IN THE ENERGY SECTOR
Embedded smart networks (no islanding) are more adapted than are microgrids (islanding) when there are based on a high proportion of intermittent energy production in urban areas
In case studies of the tertiary sector, (EcoDistrict, buildings with low heat or electrified heat demand), renewable power source-based islanding does not seem to pay itself off2. However, the local production of greener and more affordable energy is also possible without introducing microgrid islanding. The grid tariff structure, the origin of yearly peak demand (heating or A/C) and the availability of renewable resources are the three significant sizing factors in the economic optimization of such networks:
With high grid demand charges3, abundant solar, and an A/C-linked yearly peak, a 50% share of local renewable energy is the economic optimum in 2020 in an EcoDistrict with local roof-mounted solar production and distributed batteries. Most of the savings come from the optimization of power demand from the grid, which can also be seen as an optimization of the main grid for the community.
With low grid demand charges, limited solar, and a heating-linked yearly peak, local production is used only when its LCOE is lower than the full grid prices. In such cases, the focus is on total energy consumed (MWh) rather than instantaneous power demand (MW), and the PV plant will be sized so that all of its production can be self-consumed. The study however highlights the potential of Vehicle-to-Grid technologies to optimize the power demand profile of the microgrid and decrease costs.
Microgrids can be economically profitable in the presence of a high share of dispatchable energy production and thermal energy demand
For the industrial case model, microgrid capabilities (including islanding) have only been found economically relevant in this study for applications with a strong heat demand (or heat and cold demand), such as demonstrated in industrial zones. The microgrid electric network is then coupled to a heat network. The overall system is optimized with a high share of cogeneration (electric and thermal energy) from natural gas in its energy mix. Profitability varies according to the relative prices of gas versus electricity, which depend on the spark spread4 at the consumer level. In such cases, electricity consumption from the grid is very limited, and most of the grid costs come from demand charges rather than energy charges. Grid tariffs need to be wisely set to ensure economic fairness between the customer and the grid operator.
Both microgrids and embedded smart networks face major regulatory obstacles today, limiting the emergence of promising new business models
All embedded grids, be they microgrids or embedded smart networks, face regulatory challenges related to the unique status of an embedded grid positioned between the main grid operator and electricity end-users. The following points focus on microgrids but are also relevant for embedded smart networks.
The value created by a microgrid must be redistributed in order to ensure an economic benefit for all stakeholders. Profitable business models are possible based on the different value streams stemming from the services performed by the microgrid. However, microgrid implementation will be significantly hindered by the lack of adapted regulations.
2 Islanding with traditional gensets, already widespread and facing no innovation breakthrough, was not of interest
in the study.
3 Demand charges are the grid fees related to the highest power demand recorded during a given billing period,
usually the highest average 15-minute usage within a given month.
4 The spark spread, from the industrial consumer point of view, is the difference between the retail price of
electricity and the price of electricity locally produced with natural gas in a gas-fired plant.

Executive summary 5
ENEA ADVISES AND SUPPORTS INDUSTRIAL AND INSTITUTIONAL ACTORS IN THE ENERGY SECTOR
Firstly, utilities cannot rely on existing international standards to ensure that the electricity produced by a microgrid and fed back into the main grid is compliant with the technical requirements for the power quality and consistency.
Furthermore, large European utilities have set up their business units to handle electricity production, transmission, distribution and retail separately. This framework prevents the development of a bundled microgrid offer.
A microgrid service package must also take into account consumers’ rights. In projects with multiple end-users, the billing system should ensure that every consumer can choose their electricity retailer. Digital systems might help solve sensitive issues for multi-actor microgrids – digital tools would provide simplified operation and increased transparency for billing systems, as illustrated by the introduction of blockchains.
Finally, in areas with a grid tariff structure mainly based on variable energy charges, microgrids will tend to decrease consumption and hence the main grid operator grid fee. Yet, the main grid operator still provides an insurance-like service to the customer, based on its contracted peak power, and covers the associated investments and operational costs. In such cases, the competent regulatory authorities might need to reassess the optimal tariff structure (based mostly on peak power or on energy consumption) to adapt it to the paradigm shift caused by microgrids.
Regardless of whether islanding is or is not integrated into the system, end-user demand for a greener, more local, affordable and reliable energy, and the additional services provided to the grid are both strong drivers for local production and consumption. In some specific cases, relevant business models can turn into viable commercial projects, provided that the constraints imposed by the regulatory frameworks are adapted. Microgrids make economic sense when they supply both electricity and thermal needs from a dispatchable energy source. For intermittent energy source microgrids, islanding entails significant additional investments that should be carefully weighed against the value assigned to energy resiliency. Smart embedded networks do not provide the islanding function and thus provide cheaper and greener energy with local production. Regardless of the network type, regulatory constraints need to be addressed in order to foster the development of microgrids and smart embedded networks.

6 URBAN MICROGRIDS
ENEA ADVISES AND SUPPORTS INDUSTRIAL AND INSTITUTIONAL ACTORS IN THE ENERGY SECTOR
2 RÉSUMÉ EXECUTIF Les microgrids urbains, une solution prometteuse pour les infrastructures électriques modernes ?
La production et la distribution d’électricité, piliers d’une société en croissance toujours plus urbanisée et dépendante de son approvisionnement énergétique, vont évoluer vers des infrastructures plus résilientes, plus efficaces et plus durables. La décentralisation de la production électrique au sein de zones densément peuplées représente une opportunité pour réussir cette transition. La production électrique locale et l’autoconsommation dans les villes ne constituent pourtant pas une nouveauté : les besoins en énergie des installations critiques (hôpitaux, bases militaires, centres de recherche…) sont depuis longtemps couverts par des réseaux locaux privés, capables de fournir une alimentation électrique de secours en cas de coupure du réseau principal. Certains de ces réseaux ont été transformés en « microgrid » capables de s’îloter et de fonctionner en autonomie pendant une durée limitée. L’intégration des nouvelles sources d’énergies renouvelables distribuées et des technologies smart grid à ces microgrids urbains permettent d’envisager une véritable transition vers des infrastructures plus résilientes, moins coûteuses et plus durables. Ce potentiel a suscité l’intérêt des acteurs de la chaîne de valeur de l’électricité : producteurs, gestionnaires de réseaux, consommateurs finaux, autorités publiques… Néanmoins, les fonctionnalités et les avantages des microgrids restent encore vastes et parfois intangibles. La présente étude vise à définir ce que sont les microgrids urbains, la valeur qu’ils peuvent apporter à partir de plusieurs cas d’étude concrets5, et les défis qui doivent être relevés pour permettre leur émergence.
Les résultats de cette étude montrent que la capacité d’îlotage, une fonctionnalité inhérente des microgrids, peut impliquer un surcoût significatif, particulièrement dans les systèmes avec une forte production intermittente. Dans ce cas, un réseau local intelligent avec production d’énergie locale et sans capacité d’îlotage peut être conçu pour répondre aux besoins des clients finaux, permettant d’atteindre des objectifs de pénétration des renouvelables et une réduction de coûts avec des investissements moindres.
Les défis techniques liés à la capacité d’îlotage peuvent être dépassés mais à un coût potentiellement élevé
Plusieurs défis doivent être relevés pour exploiter la valeur potentielle des microgrids : des technologies complexes et parfois coûteuses, la définition de modèles d’affaires permettant une juste redistribution de la valeur, et un cadre réglementaire encore trop contraignant.
En fonction de la maturité et de la complexité du microgrid, les infrastructures de production, de distribution et de stockage de l’électricité ainsi que celles liées au réseau intelligent peuvent représenter des coûts d’investissement élevés. La complexité de la fonction d’îlotage amène des coûts additionnels qui ne doivent pas être négligés ; ils sont particulièrement élevés quand le microgrid est alimenté par des sources d’électricité renouvelables intermittentes et est équipé d’un système de stockage. Ces coûts devront être estimés avec précaution afin d’évaluer leur adéquation avec le besoin de sécurité énergétique des clients finaux, et de mettre en place un modèle d’affaire pertinent le cas échéant. En Europe, le réseau principal répond largement aux exigences de fiabilité de l’approvisionnement énergétique ; les coupures sont exceptionnelles et le plus souvent liées à une catastrophe naturelle ou un accident industriel. Par conséquent, les clients ne sont souvent pas prêts à payer le surcoût d’îlotage lié aux microgrids pour assurer la résilience de leurs installations.
5 Trois cas ont été étudiés : un éco-quartier caractérisé par des pics de demande liés à la climatisation à San Diego
en Californie, un aéroport français souhaitant améliorer son empreinte carbone et un site industriel avec des besoins thermiques importants.

Résumé exécutif 7
ENEA ADVISES AND SUPPORTS INDUSTRIAL AND INSTITUTIONAL ACTORS IN THE ENERGY SECTOR
Les réseaux locaux intelligents (sans îlotage) sont mieux adaptés que les microgrids dans un contexte de production d’énergie intermittente en milieu urbain
Les cas étudiés au sein du secteur tertiaire (éco-quartiers, bâtiments à faibles besoins en chaleur ou chauffés à l’électricité) montrent que l’îlotage alimenté par des sources d’énergie renouvelables est rarement économiquement viable6. En revanche, la production locale d’énergie plus durable et à moindre coût ne nécessite pas forcément l’introduction d’une capacité d’îlotage. La structure du tarif d’utilisation du réseau, l’origine du pic annuel de la demande électrique (chauffage ou climatisation) et la disponibilité des sources d’énergie renouvelables sont les trois facteurs clés permettant de dimensionner les réseaux locaux intelligents.
Dans le cas d’une tarification reposant fortement sur la puissance souscrite, d’un potentiel solaire
important et d’un pic annuel lié à la climatisation, l’optimum économique en 2020 est atteint avec
50% d’énergie renouvelable pour un éco-quartier équipé de panneaux solaires en toiture et de
batteries. La majorité des économies réalisées proviennent de l’optimisation de la consommation
d’électricité issue du réseau principal, ce qui peut également être considéré comme une optimisation
du réseau principal pour la communauté.
Dans le cas d’une tarification reposant fortement sur l’énergie soutirée, d’un potentiel solaire limité
et d’un pic annuel lié au chauffage, la génération d’électricité locale est effectuée lorsque son LCOE
est inférieur au prix de vente de l’électricité. Dans ce cas, l’optimisation est effectuée à partir de la
consommation en énergie totale (MWh) plutôt que sur la demande électrique instantanée (MW), et
les panneaux solaires sont dimensionnés de telle façon que l’intégralité de leur production puisse
être autoconsommée. L’étude souligne cependant le potentiel des technologies Vehicle-to-Grid afin
d’optimiser les profils de demande électrique et réduire les coûts du microgrid.
Les microgrids peuvent être viables économiquement pour des installations industrielles disposant d’une large part de sources d’énergie non intermittentes installées et une forte demande d’énergie thermique
La modélisation d’un cas d’étude pour un industriel a montré que les microgrids sont rentables uniquement pour des installations à forte demande thermique (chaleur et froid). Le microgrid peut alors être couplé au réseau de chaleur. Le système énergétique est ainsi optimisé dans son ensemble, avec une forte part de cogénération (énergie thermique et électrique) au gaz naturel dans son mix énergétique. La rentabilité varie en fonction du différentiel entre le prix du gaz et celui de l’électricité, qui dépend du « spark spread » à l’échelle du consommateur.7 Dans ce cas, la consommation d’électricité à partir du réseau principal est très limitée, et la facture électrique est majoritairement liée aux pics de demande. Les tarifs d’utilisation des réseaux devraient prendre en compte ces cas de manière à garantir une juste répartition des coûts entre le consommateur et l’opérateur de réseau.
Les microgrids et les réseaux locaux intelligents font tous deux face à des obstacles qui limitent l’émergence de modèles d’affaires
Tout réseau local, qu’il s’agisse d’un microgrid ou d’un réseau local intelligent, est confronté à des obstacles règlementaires du fait de sa position entre les opérateurs du réseau principal et les clients finaux. Les arguments suivants sont centrés sur les microgrids mais concernent également les réseaux locaux intelligents.
6 L’îlotage basé sur les générateurs diesel traditionnels, un système déjà développé et sans innovation de rupture,
ne fait pas l’objet de cette étude.
7 Le « spark spread », du point de vue du consommateur industriel, est la différence entre le prix de vente de
l’électricité et le prix de l’électricité produite localement à partir d’une centrale à gaz

8 URBAN MICROGRIDS
ENEA ADVISES AND SUPPORTS INDUSTRIAL AND INSTITUTIONAL ACTORS IN THE ENERGY SECTOR
La valeur ajoutée des microgrids doit être redistribuée de manière équitable afin d’assurer une attractivité pour toutes les parties prenantes. Les sources de valeur créées par les microgrids sont nombreuses et permettent ainsi de nombreux modèles d’affaires. Néanmoins, les lacunes réglementaires limitent aujourd’hui leur développement.
En premier lieu, il n’existe pas de standards internationaux permettant de vérifier que l’électricité
injectée dans le réseau par les microgrids répond aux exigences de qualité requises.
La réglementation européenne impose aujourd’hui la dissociation des activités : production,
transmission, distribution et fourniture. Cette dissociation constitue un frein pour le
développement d’offres tout-en-un de microgrids.
L’offre de microgrids doit également respecter les droits des consommateurs. Dans les projets de
microgrids impliquant des clients multiples, ces derniers doivent pouvoir garder leur droit de libre
choix du fournisseur d’électricité. Néanmoins, des outils digitaux, du type blockachain par exemple,
peuvent apporter des solutions en simplifiant et améliorant la performance du système de
facturation.
Finalement, dans les zones où le tarif de l’électricité est essentiellement basé sur la consommation
d’énergie, les microgrids ont tendance à diminuer cette consommation et par conséquent diminuer
les revenus de l’opérateur de réseau. L’opérateur doit cependant toujours être en mesure de
fournir aux consomateurs un service d’assurance à hauteur de la capacité de pic souscrite, mais en
couvrant lui-même les investissements et coûts opérationnels. Les autorités compétentes devront
probablement procéder à une révision de la structure du tarif (principalement basé sur le pic de
demande ou sur la consommation en énergie) pour s’adapter à ce changement de paradigme.
Qu’une capacité d’îlotage soit intégrée ou non dans le système, la volonté des utilisateurs d’une énergie plus verte, plus locale et plus abordable ainsi que les services additionnels fournis au réseau sont des incitations fortes à la production décentralisée et à l’autoconsommation. Dans certains cas spécifiques, des modèles d’affaires appropriés peuvent se transformer en projets commerciaux viables, à condition que les cadres réglementaires soient suffisament adaptés.
En conclusion, les microgrids peuvent être économiquement viables lorsqu’ils fournissent à la fois des besoins en électricité et en chaleur ou froid, et sont alimentés par des sources d’énergie non intermittentes. Les microgrids basés sur des sources d’énergie intermittentes ont un coût bien plus élevé, qui doit être correctement évalué face à la valeur ajoutée créée par la capacité d’îlotage. Les réseaux locaux intelligents ne sont pas en mesure de fournir cette capacité d’îlotage mais permettent d’avoir une énergie produite localement à moindre coût. Quelque soit le modèle, microgrid ou réseau ocal intelligent, les contraintes réglementaires doivent être levées afin de favoriser le développement des microgrids et des réseaux locaux intelligents.

Résumé exécutif 9
ENEA ADVISES AND SUPPORTS INDUSTRIAL AND INSTITUTIONAL ACTORS IN THE ENERGY SECTOR
TABLE OF CONTENTS
1 Executive summary 3
2 Résumé exécutif 6
3 Objectives and contents 10
4 Overview of urban microgrids 11
4.1 Global overview of urban microgrids 11
4.1.1 Definition 11
4.1.2 Components 13
4.1.3 Drivers 14
4.1.4 Review of existing microgrids 14
5 Takeaways from 3 urban microgrids case studies 16
5.1 Method 16
5.2 EcoDistrict case 17
5.2.1 Case presentation 18
5.2.2 From grid-only to microgrid 18
5.2.3 Renewable and storage to decrease the grid demand charge 20
5.3 Airport case 21
5.3.1 Case presentation 21
5.3.2 From grid-only to microgrid 22
5.3.3 Conclusions of the airport case study 25
5.4 Industrial case 26
5.4.1 Case presentation 27
5.4.2 From grid-only to microgrid 27
5.4.3 Costs and benefits of grid connection 29
6 Main challenges and lessons learnt on urban microgrids 31
6.1 Regulatory challenges 31
6.2 Business model challenges 36
6.2.1 Microgrid stakeholders and value streams 36
6.2.2 Business models identification 38
6.3 Technical challenges 42
6.4 Microgrid costs analysis 45
7 List of figures 48
8 Bibliography 49

10 URBAN MICROGRIDS
ENEA ADVISES AND SUPPORTS INDUSTRIAL AND INSTITUTIONAL ACTORS IN THE ENERGY SECTOR
3 OBJECTIVES AND CONTENTS The centralized electric power system, predominant in most countries, is evolving towards an allegedly more efficient and more flexible decentralized layout, able to integrate distributed renewable sources. Microgrids may have a privileged place in the design of such electrical networks and have received significant attention from potential stakeholders in its value chain, from assets providers and electricity producers to end-users.
In remote areas, microgrids may be the only sources of access to electricity given the lack of electricity network coverage. Conversely, end-users in an urban environment have access to the city’s electricity network but may choose to rely on a microgrid system to meet their energy needs.
The present study focuses on microgrids in an urban environment in developed countries. It was carried out for a consortium of six partners: Groupe Caisse des Dépôts, ENEDIS, Fondation Tuck, Groupe ADP, OMEXOM and TOTAL. The objectives of the study were to identify urban microgrid concepts, drivers and barriers through a detailed overview of existing projects, to perform case study simulations and to analyze the main challenges for the further development of microgrids.
The study aims at sharing an unbiased analysis of microgrids and their potential. It does not seek to promote microgrids but to highlight their main added value for current electrical systems and their present limitations. The study steering committee, comprising companies with different backgrounds and interests, fully respected this goal of objectivity.
This report is structured as follows:
A thorough overview of urban microgrid projects, with a detailed focus on six cases Results and analyses of three different microgrid case studies modeled with HOMER Energy software Analysis of the challenges related to business models, regulation, technologies and costs that should be
addressed in order to promote the development of microgrids

Overview of urban microgrids 11
ENEA ADVISES AND SUPPORTS INDUSTRIAL AND INSTITUTIONAL ACTORS IN THE ENERGY SECTOR
4 OVERVIEW OF URBAN MICROGRIDS
4.1 Global overview of urban microgrids
4.1.1 Definition
4.1.1.1 Microgrid concept
In the present study, the microgrid is considered as a microcosm of the broader energy network, which includes all the necessary components to operate in islanded mode. It has three main components: generation, loads and controls within a delimited and controlled network [1, 2, 3]. The key characteristic of a microgrid is its ability to island, which is not present in other projects improperly called “microgrids”. An actual microgrid is connected to the grid and may island only for a limited time, for an emergency reason, with no degradation8 of the service. This unique feature requires the implementation of smart grid tools to optimize energy flows, which is crucial to the project economics and to the technical operation of the islanded microgrid.
4.1.1.2 Scope of the present study
The present study takes into account relevant urban microgrids in the preliminary overview. For the case studies and complementary analyses, the focus is on microgrids that:
Are in an urban environment: this includes microgrids in a semi-urban environment, such as in an industrial facility close to a city, and excludes microgrids in remote locations where they are the only way to access a reliable source of electricity.
Are in developed countries: this excludes urban microgrids in developing countries that belong to a very different context, where several power outages can occur on the main grid on a daily basis.
Can operate in nominal mode even during islanding: this excludes microgrids with back-up power units that are brought onto the network to power critical loads, or microgrids with significant load shedding during emergency islanding to power only limited critical loads.
The present study is limited to electrical microgrid networks, especially for the business model and regulation analyses. The electricity vector is the focal point of the study, even though thermal storage and other networks can be coupled and integrated into the system optimization.
4.1.1.3 Microgrid position in the “grid clustering” classification
The main grid operators and electricity suppliers traditionally offer their services on a single-customer basis. Alternatives that aim at creating value through the clustering of electricity consumers and/or producers have been flourishing over the last decade (see Figure 1). There are several levels of complexity in these different forms of clustering: the more independent a system is with respect to the main grid, the more complex it is. The microgrid system is the most advanced example of an independent cluster, as it can completely island from the main grid.
8 Or limited degradation of service
12 URBAN MICROGRIDS
ENEA ADVISES AND SUPPORTS INDUSTRIAL AND INSTITUTIONAL ACTORS IN THE ENERGY SECTOR
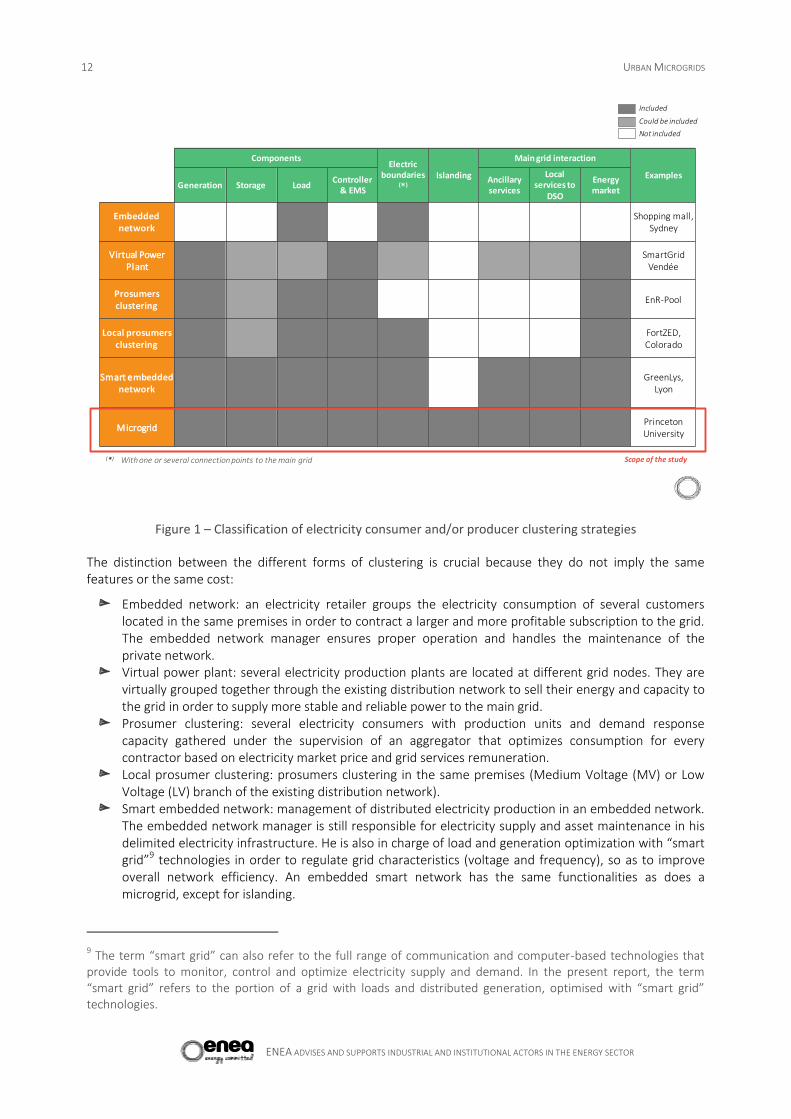
Figure 1 – Classification of electricity consumer and/or producer clustering strategies
The distinction between the different forms of clustering is crucial because they do not imply the same features or the same cost:
Embedded network: an electricity retailer groups the electricity consumption of several customers located in the same premises in order to contract a larger and more profitable subscription to the grid. The embedded network manager ensures proper operation and handles the maintenance of the private network.
Virtual power plant: several electricity production plants are located at different grid nodes. They are virtually grouped together through the existing distribution network to sell their energy and capacity to the grid in order to supply more stable and reliable power to the main grid.
Prosumer clustering: several electricity consumers with production units and demand response capacity gathered under the supervision of an aggregator that optimizes consumption for every contractor based on electricity market price and grid services remuneration.
Local prosumer clustering: prosumers clustering in the same premises (Medium Voltage (MV) or Low Voltage (LV) branch of the existing distribution network).
Smart embedded network: management of distributed electricity production in an embedded network. The embedded network manager is still responsible for electricity supply and asset maintenance in his delimited electricity infrastructure. He is also in charge of load and generation optimization with “smart grid”9 technologies in order to regulate grid characteristics (voltage and frequency), so as to improve overall network efficiency. An embedded smart network has the same functionalities as does a microgrid, except for islanding.
9 The term “smart grid” can also refer to the full range of communication and computer-based technologies that
provide tools to monitor, control and optimize electricity supply and demand. In the present report, the term “smart grid” refers to the portion of a grid with loads and distributed generation, optimised with “smart grid” technologies.
ComponentsElectric
boundaries (*)
Islanding
Main grid interaction
ExamplesGeneration Storage Load
Controller& EMS
Ancillary services
Local services to
DSO
Energymarket
Embedded network
Shopping mall, Sydney
Virtual PowerPlant
SmartGridVendée
Prosumersclustering
EnR-Pool
Local prosumersclustering
FortZED, Colorado
Smart embedded network
GreenLys,Lyon
MicrogridPrinceton University
Included
Could be included
Not included
Scope of the study(*) With one or several connection points to the main grid

Overview of urban microgrids 13
ENEA ADVISES AND SUPPORTS INDUSTRIAL AND INSTITUTIONAL ACTORS IN THE ENERGY SECTOR
Microgrid: it is a smart embedded network that can operate in islanded mode, which generates additional technical challenges. The network must be controlled without the reference input of the main grid and be able to detect fault signals from main grid in order to island in time. After islanding, load and generation must almost immediately be balanced and be kept balanced at all times.
The distinction between smart embedded networks and microgrids may be difficult to appreciate, and smart embedded networks are often called microgrids because they are small, include private local assets and integrate renewable sources. In the present study, the key feature that differentiates a microgrid from a smart embedded network is islanding capability. The report reviews the challenges related to the development of small, private smart embedded networks. It focuses on the potential added value to be derived from upgrading these networks into actual microgrids with the possibility to island.
4.1.2 Components
The components that might be present in a microgrid are represented in Figure 2:
Generation: dispatchable or intermittent generation. Loads: critical loads have to be served under all conditions; deferrable loads can be adjusted for
microgrid load balancing or for economic reasons. Storage: from batteries (centralized, decentralized, electric vehicles...) and/or thermal storage10. Controller: in charge of the instantaneous operation of the system. It translates the energy
requirements of the microgrid and the EMS arbitrage into sequences of operation to the microgrid assets.
EMS (Energy Management System): software for generation and load dispatching based on economic and reliability criteria. Coupled with the relevant instrumentation (meters, communication tools...), the EMS ensures the smart management of the microgrid.
PCC (Point of Common Coupling): the transformer that represents the physical separation between main grid and microgrid.
Figure 2 - General representation of a grid-connected microgrid11
The PCC, the control system and the Energy Management System are common to all microgrids. They can be merged into one component and are more or less complex depending on the type of microgrid. Load,
10 Storage is not essential if the microgrid includes a reliable generation unit, such as a gas engine.
11 Example of loads, generation sources and storage assets are not exhaustive.
PCC
Dispatchable generation
Limited or intermittent generation
Critical loads Controllable loads
StorageController
CHP
Diesel Gen.
Gas Gen.
Fuel Cell
Biogas
Hydro.
Solar
Wind
Batteries
Thermal
Lighting
Heat pumps
HVAC
Refrigeration
Security
Data Centre Life support
EV
MAIN GRID EMS

14 URBAN MICROGRIDS
ENEA ADVISES AND SUPPORTS INDUSTRIAL AND INSTITUTIONAL ACTORS IN THE ENERGY SECTOR
generation and storage types are highly dependent on the type of microgrid designed and the underlying motivations of the project.
4.1.3 Drivers
Based on the information stemming from the interviews with microgrid stakeholders and the projects reviewed in §Erreur ! Source du renvoi introuvable., urban microgrids are developed in an urban environment for three main reasons (see Figure 3):
Energy security: a microgrid ensures energy autonomy off the main grid for a limited amount of time, in case of grid outage.
Cost savings: local generation and storage, coupled with customer pooling can reduce the energy bills of end users or a consortium of electricity consumers.
Sustainability: with on-site production, the microgrid stakeholders can control the level of renewable penetration they want to integrate into local consumption.
Figure 3 - Drivers of an urban microgrid
A microgrid project can address all or some of these three drivers simultaneously, with different levels of requirements for each. Based on the distinction between smart embedded networks and microgrids established in §4.1.1.3, a smart embedded network can meet with sustainability and cost savings goals, but a microgrid is the only system that can ensure energy security. A smart embedded network, even with on-site storage, would not be able to operate independently from the main grid if it was not designed to do so. The upgrading of a smart embedded network to a microgrid is driven by energy autonomy requirements. The motivations behind microgrid implementation differ depending on the types of stakeholders involved in the project: residential customers, distribution system operator (DSO), third-party company, facilities with critical loads, etc.
4.1.4 Review of existing microgrids
There are over seventy projects identified in the world as fully operational microgrids implemented in an urban area and able to island. They are of all sizes and the largest ones exceed 1 MW of installed capacity. Projects were first developed in the US and in Japan. Those developed in Japan mainly aimed at improving network quality for critical loads and achieving energy security, after the 2011 earthquake and tsunami. The US went down the same path, driven by economics and the need for resiliency, especially after the confrontation with terrorist threats and natural disasters, such as hurricanes Sandy (2012) and Katrina (2005). New projects are implemented every year, and the US now has the largest and most dynamic market with 124 projects and 1100 MW [4] installed capacity in 2016. The European projects reviewed are smaller than 1 MW and still in the pilot phase as microgrids have not yet met any actual commercial demand in Europe.
ENERGY SECURITY
SUSTAINABILITYCOST SAVINGS

Overview of urban microgrids 15
ENEA ADVISES AND SUPPORTS INDUSTRIAL AND INSTITUTIONAL ACTORS IN THE ENERGY SECTOR
Based on this review, we decided to focus on the five projects represented on Figure 4.
Figure 4 – Location of urban microgrid projects selected for the overview
The projects represented in Figure 4 have been in operation for over a year and they are located in both the US and Japan, the regions with the most mature market. They serve an important local load (over 950 kW) and cover different drivers, actors and business models. Project stakeholders were available for interviews: in total, 9 interviews were conducted for the detailed review of the selected projects. The characteristics of the projects are listed in Table 1.
Microgrid Location Capacity Stakeholders Comments
Santa Rita Jail California, U.S. PV – 1.5 MW Fuel cell – 1.2 MW Battery – 2 MW
Public owner: Alameda county
Pioneer in the microgrid sector with innovative technology
Stafford Hill Vermont, U.S. PV – 2 MW Battery – 4 MW
Private owner: Green Mountain Power, the local utility
Utility-owned microgrid aiming at both sustainability and cost savings
Manhattan Beer Distributor
New York, U.S. Gas CHP – 3.6 MW Private owner: Manhattan Beer Distributor
Off-grid site due to congested network in downtown Manhattan
Princeton University
New Jersey, U.S.
Gas CHP – 15 MW PV – 4.5 MW
Private owner: Princeton University
High level of grid interaction (grid services, arbitrage)
Sendai Japan Gas CHP – 0.7 MW Fuel cell – 0.25 MW PV – 0.05 MW
Private owner: NTT facilities, a telecom operator
Experimentation facilities, with no associated business model
Table 1 – Description of selected urban microgrid projects
Hawaii
Santa Rita Jail Stafford Hill Solar Farm
Manhattan Beer Distributor
Princeton
Sendai
Cost savings
Energy security
Sustainability
Country with othermature microgrid projects
No mature microgrid projects spotted
Source: Enea Consulting analysis

16 URBAN MICROGRIDS
ENEA ADVISES AND SUPPORTS INDUSTRIAL AND INSTITUTIONAL ACTORS IN THE ENERGY SECTOR
5 TAKEAWAYS FROM 3 URBAN MICROGRIDS
CASE STUDIES This section presents three different case studies modeled with HOMER software. The case studies are simplified representations of complex microgrids. They aim at identifying the key success factors for microgrids and the conditions that make them profitable. The models do not take into account technical issues, regulations and business models: these challenges are thoroughly studied in the complementary analyses in §5.4.
The three cases under consideration are:
An EcoDistrict in California looking for cost savings and increased sustainability through clustering of individuals
An electric airport in France willing to increase renewable penetration through local production and a fleet of electric vehicles
An industrial site with thermal loads located in a congested network zone in France
The software used is HOMER– Hybrid Renewable and Distributed Generation System – that is licensed and maintained by HOMER Energy. It was originally created by the National Renewable Energy Laboratory and is targeted at microgrid economic simulation.
5.1 Method
HOMER optimizes a microgrid design based on the desired components and a set of inputs and constraints:
The software optimizes the size of the components that were integrated in the model beforehand. The model needs detailed yearly input such as load profiles, irradiance data and main grid energy and
power prices. Optimization results are framed by constraints on renewable penetration or the duration of islanding.
The different microgrid designs built by the HOMER software are compared on the basis of two metrics:
The Net Present Cost (NPC) of the microgrid12: the sum of the present value of all costs over the period of interest, including residual values as negative costs. The levelized cost of energy (LCOE) is the ratio of the NPC over the discounted flow of energy supplied to the microgrid. A weighted average cost of capital (WACC) of 5.8813% was assumed. Costs were separated into initial CAPEX, replacement CAPEX for batteries only and maintenance costs.
12 LCOE is also included in the HOMER outputs and can be used as an economic metric. However, the LCOE
calculated in HOMER amortizes the NPC over the total amount of energy produced, even when sold back to the grid. Furthermore, the deferrable load and the cost of gas consumed by the boiler are not taken into account into the calculation. Therefore, the LCOE is calculated independently from HOMER in order to have an economic metric relevant to the microgrid manager. In the present study, the NPC is amortized over the total amount of energy consumed by the microgrid.
13 Calculated based on 8% discount rate and 2% inflation rate.

Takeaways from 3 urban microgrids case studies 17
ENEA ADVISES AND SUPPORTS INDUSTRIAL AND INSTITUTIONAL ACTORS IN THE ENERGY SECTOR
The renewable electricity penetration (%RE), equivalent to the ratio of renewable energy locally produced and self-consumed over total energy consumed. The metric calculated by HOMER assumes that electricity from the grid is not renewable and that on-site fossil generation is meant for microgrid consumption and is not sold back to the grid. The renewable electricity penetration only takes into account renewable energy consumed by the microgrid, and does not integrate surplus renewable energy produced on-site and fed back into the grid.
5.2 EcoDistrict case
This case has been designed to highlight the dynamics behind the potential energy autonomy of EcoDistricts. The aim of this case study is to understand the economics behind the different situations (embedded network, smart embedded network and microgrid) and thus to anticipate the potential evolution of the electricity distribution market. A 300-household Californian EcoDistrict built in 2020 was used to illustrate the case, based on a 2015 grid and market prices and 2020 forecast technology prices.
Electricity pooling (in an embedded network without local production) at the EcoDistrict scale can already trigger significant cost savings of about $90/MWh (from $290 to roughly $200/MWh) for a residential customer. Furthermore, full cost efficiency is reached by targeting a decrease in peak consumption during peak summer periods. This is possible with a mix of a small solar capacity (up to one third of non-deferrable load) coupled with a small-scale battery. Even when the additional costs of private network investment and smart grid equipment are taken into account, this solution is 2% less expensive than grid-only pooling. Local RE share is then 9% of consumption.
Based on these analyses, a renewable islanding capacity in an urban EcoDistrict connected to the main grid generates a very high cost premium for the service delivered. However, a significant increase of RE share can be reached with limited additional costs, reaching up to 50% of the network consumption for an LCOE of $200/MWh (same as for pooling).
This case highlights very interesting dynamics:
In this case, value for the EcoDistrict comes mainly from decreased peak load rather than energy self-consumption. Limited additional value could be harnessed through grid services – if battery storage is available and a relevant grid service program is implemented.
An embedded smart network with optimized self-consumption can provide high value for the consumers (cost decrease and increased share of renewable energy consumption).
When applied to a greenfield case, community network investment could also be optimized through smart peak shaving.
This case has been designed to highlight the dynamics behind the potential energy autonomy of EcoDistricts. This is a case of primary interest for most actors as it involves prosumers (consumers with significant production on their roof), potential independent microgrid managers (new entrant in the market), DSO (who could see potential value transferred to other stakeholders). The aim of this case study is to understand the economics behind the different situations (embedded network, smart embedded network, microgrid) and thus anticipate the potential evolution of the electricity distribution market. The study will not investigate the regulatory and business model challenges associated with such a case, but investigate what would be the

18 URBAN MICROGRIDS
ENEA ADVISES AND SUPPORTS INDUSTRIAL AND INSTITUTIONAL ACTORS IN THE ENERGY SECTOR
most relevant cost savings options for the inhabitants of the EcoDistrict, and to what extent sustainability goals can be integrated into the cost reduction strategy.
5.2.1 Case presentation
The case study focuses on an all-electric14 EcoDistrict composed of residential and small businesses customers15. The region is also impacted by high afternoon peak loads due to air conditioning in summer time. The EcoDistrict has a private distribution network with a single connection with the main grid and can buy power from the grid on an individual or on a collective basis, as well as produce its own electricity with PV rooftops and batteries16.
5.2.2 From grid-only to microgrid
5.2.2.1 Embedded network case
The first step towards a microgrid in residential areas today is an embedded network (see definition §4.1.1.3). Figure 5 shows the comparison of the Levelized Cost of Energy results for a single residential customer, a single small business customer, and an EcoDistrict with 300 residential customers, 30 small business customers, and a deferrable load that represent 25% of total load. The EcoDistrict’s annual peak power demand after pooling is 1.1 MW.
Figure 5 – Embedded network case results
Electricity pooling (in an embedded network) at the EcoDistrict scale can already trigger significant cost savings, of about $90/MWh (from $290 to roughly $200/MWh) for a residential customer. As a large
14 Thermal load (air-conditioning or heating) is ensured by electrical appliances.
15 For the study, this EcoDistrict was located in San Diego, California. Load profile and tariffs are based on 2015
archives data from local Californian utility SDG&E [59] [60]. Global horizontal irradiance data [64, 65] is based on data consolidated over several years. Price forecasts for PV and batteries take into account potential decreases in the cost of technology (modules or cells), Balance of System, and soft costs in 2020 (Enea Consulting analysis based on [70, 71, 39, 38]).
16 Grid services delivered by the EcoDistrict to the main grid were not considered in the case study. Indeed, a smart
grid with controlled local generation and storage could enter into a demand respond scheme or provide ancillary services to obtain minor additional income. However, this value stream is limited and would not have a significant impact on the trends illustrated by the EcoDistrict case.
Residential customer Small business customer
$287/MWh $229/MWh
Not included: franchise fees and taxes
Ecodistrict pooling
$199/MWh
Not included: franchise fees and taxesIncluded: $20/MWh for private network
Not included: franchise fees and taxes
Takeaways from 3 urban microgrids case studies 19
ENEA ADVISES AND SUPPORTS INDUSTRIAL AND INSTITUTIONAL ACTORS IN THE ENERGY SECTOR
customer, parts of the EcoDistrict bills are related to power charges. With a large deferrable load, the EcoDistrict is able to adjust its load profile to decrease the power part of the electricity bill.
5.2.2.2 Potential smart embedded networks
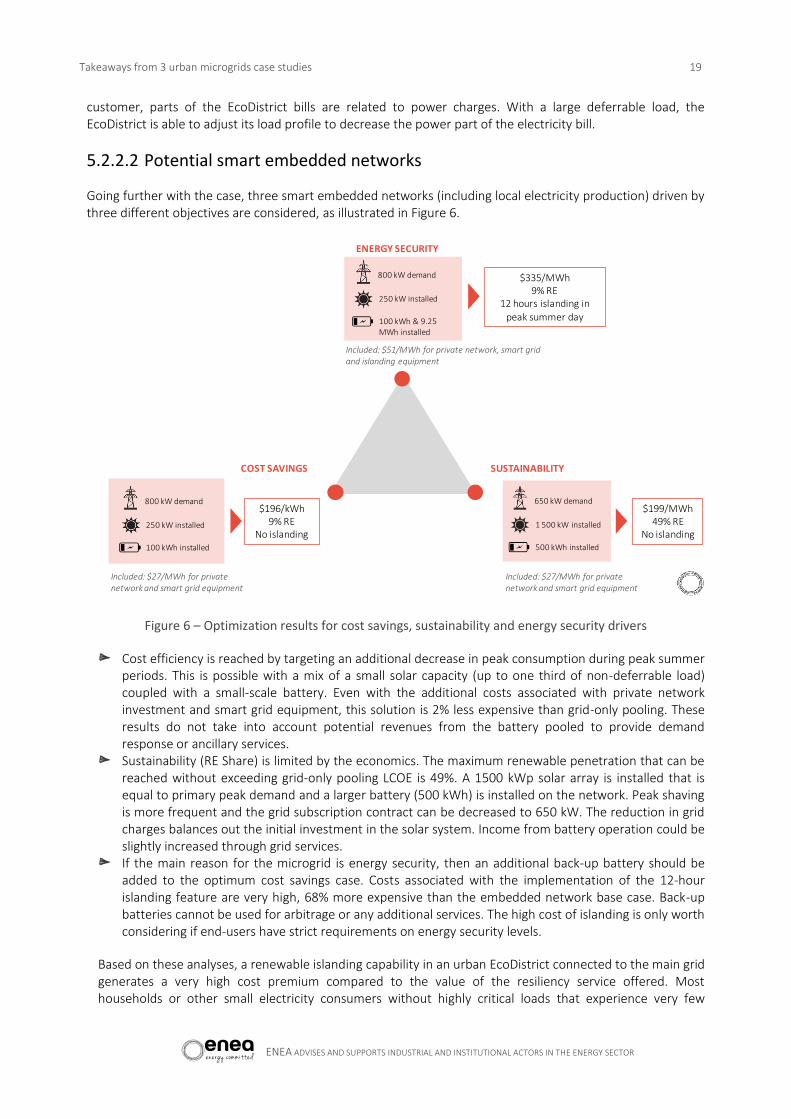
Going further with the case, three smart embedded networks (including local electricity production) driven by three different objectives are considered, as illustrated in Figure 6.
Figure 6 – Optimization results for cost savings, sustainability and energy security drivers
Cost efficiency is reached by targeting an additional decrease in peak consumption during peak summer periods. This is possible with a mix of a small solar capacity (up to one third of non-deferrable load) coupled with a small-scale battery. Even with the additional costs associated with private network investment and smart grid equipment, this solution is 2% less expensive than grid-only pooling. These results do not take into account potential revenues from the battery pooled to provide demand response or ancillary services.
Sustainability (RE Share) is limited by the economics. The maximum renewable penetration that can be reached without exceeding grid-only pooling LCOE is 49%. A 1500 kWp solar array is installed that is equal to primary peak demand and a larger battery (500 kWh) is installed on the network. Peak shaving is more frequent and the grid subscription contract can be decreased to 650 kW. The reduction in grid charges balances out the initial investment in the solar system. Income from battery operation could be slightly increased through grid services.
If the main reason for the microgrid is energy security, then an additional back-up battery should be added to the optimum cost savings case. Costs associated with the implementation of the 12-hour islanding feature are very high, 68% more expensive than the embedded network base case. Back-up batteries cannot be used for arbitrage or any additional services. The high cost of islanding is only worth considering if end-users have strict requirements on energy security levels.
Based on these analyses, a renewable islanding capability in an urban EcoDistrict connected to the main grid generates a very high cost premium compared to the value of the resiliency service offered. Most households or other small electricity consumers without highly critical loads that experience very few
SUSTAINABILITYCOST SAVINGS
$196/kWh9% RE
No islanding
ENERGY SECURITY
$335/MWh9% RE
12 hours islanding in peak summer day
$199/MWh49% RE
No islanding
800 kW demand
250 kW installed
100 kWh installed
650 kW demand
1 500 kW installed
500 kWh installed
800 kW demand
250 kW installed
100 kWh & 9.25 MWh installed
Included: $27/MWh for privatenetwork and smart grid equipment
Included: $51/MWh for private network, smart gridand islanding equipment
Included: $27/MWh for privatenetwork and smart grid equipment
20 URBAN MICROGRIDS
ENEA ADVISES AND SUPPORTS INDUSTRIAL AND INSTITUTIONAL ACTORS IN THE ENERGY SECTOR
occurrences of main grid outages, are unlikely to pay this premium. Further modelling explains possible cost savings and sustainability drivers, without addressing energy security.
5.2.3 Renewable and storage to decrease the grid demand charge
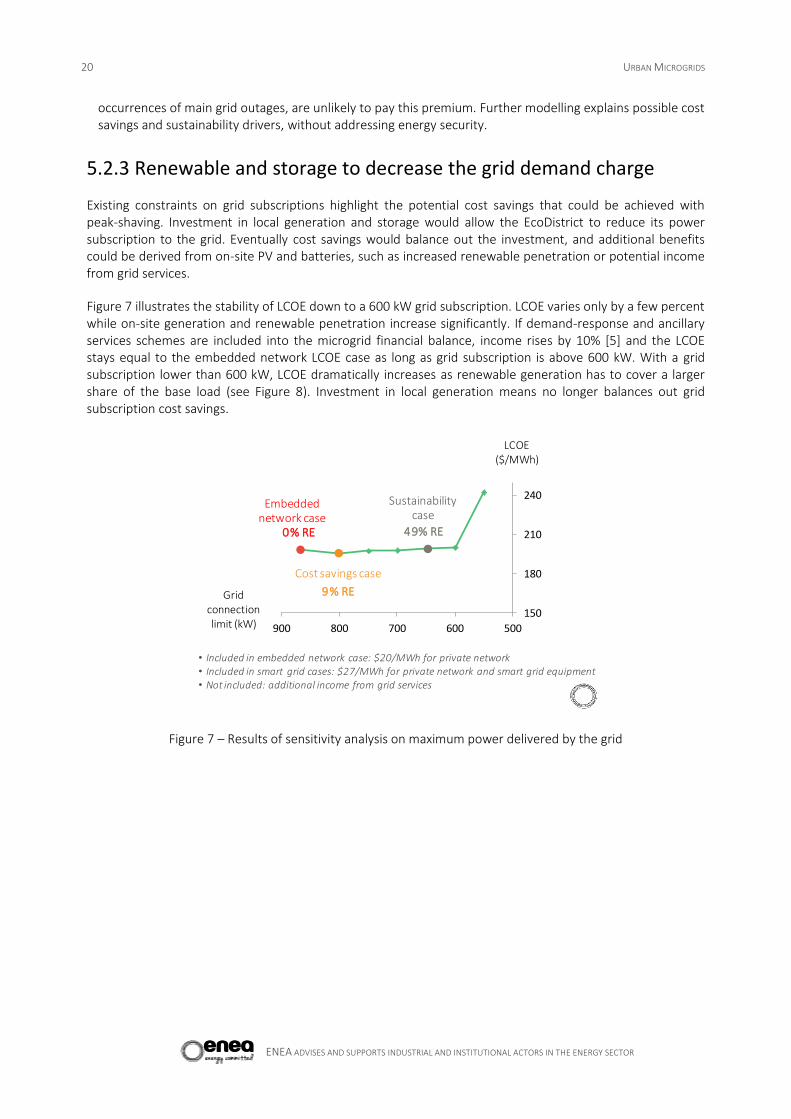
Existing constraints on grid subscriptions highlight the potential cost savings that could be achieved with peak-shaving. Investment in local generation and storage would allow the EcoDistrict to reduce its power subscription to the grid. Eventually cost savings would balance out the investment, and additional benefits could be derived from on-site PV and batteries, such as increased renewable penetration or potential income from grid services.
Figure 7 illustrates the stability of LCOE down to a 600 kW grid subscription. LCOE varies only by a few percent while on-site generation and renewable penetration increase significantly. If demand-response and ancillary services schemes are included into the microgrid financial balance, income rises by 10% [5] and the LCOE stays equal to the embedded network LCOE case as long as grid subscription is above 600 kW. With a grid subscription lower than 600 kW, LCOE dramatically increases as renewable generation has to cover a larger share of the base load (see Figure 8). Investment in local generation means no longer balances out grid subscription cost savings.
Figure 7 – Results of sensitivity analysis on maximum power delivered by the grid
150
180
210
240
500600700800900
LCOE ($/MWh)
Gridconnectionlimit (kW)
Embedded network case
Cost savings case
Sustainabilitycase
• Included in embedded network case: $20/MWh for private network• Included in smart grid cases: $27/MWh for private network and smart grid equipment• Not included: additional income from grid services
0% RE
9% RE
49% RE

Takeaways from 3 urban microgrids case studies 21
ENEA ADVISES AND SUPPORTS INDUSTRIAL AND INSTITUTIONAL ACTORS IN THE ENERGY SECTOR
Figure 8 – Relevant grid subscription choices with respect to non-deferrable load profile
5.3 Airport case
This case was designed to understand the feasibility of a 100% renewable energy airport terminal. It also aimed at better understanding the role vehicle-to-grid (V2G) can play in the optimization of the energy system of such a large facility receiving numerous visitors each day. This case study focuses on a small 100% electric airport located in France with an annual consumption of 4.2 GWhel. This case starts in 2025, when the number of electric vehicles is expected to be significant enough to impact airport demand.
The first interesting result is the very different dynamics with regards to solar as compared to the EcoDistrict. The optimization in the EcoDistrict case resulted from a demand charge optimization through both solar and energy storage. In this French airport case, solar helps optimize the total cost of the electric system on a self-consumed energy base only. This is due to a combination of two factors. Firstly, MW-scale PV plants produce much cheaper energy than do roof-mounted ones: the overhead costs of PV panels are 40% lower than for roof-mounted panels. Secondly, the grid tariff in France is mainly based on the variable energy portion rather than the fixed demand charge. The optimal size of the solar plant thus depends on the load curve to reach a higher self-consumption ratio. However, it only leads to an RE share of 42%.
Next, the effect of V2G is very interesting. With this free battery storage capacity, demand can be optimized on the network and total costs can be decreased. This decrease is all the more significant as the share of clients’ EVs increases.
Lastly, the main target of 100% RE share and islanding capabilities seem still out of economic reach for such a facility.
5.3.1 Case presentation
The case study focuses on a small 100% electric airport located in France with an annual consumption of 4.2 GWhel. This consumption does not include air traffic control which is already powered with a dedicated electric system. This airport is equipped with electric charging points for electric vehicles, can produce its own electricity with solar parking shelters and batteries, and can buy and sell electricity from and to the grid. The study investigates what would be the most relevant cost savings options to optimize renewable penetration by using a vehicle-to-grid system.
0
300
600
900
Jan Mar Apr Jun Aug Oct Dec
Primary load (kW)
Primary load (non-
deferrable)
Minimum grid subscription for sustainability goal
Optimal grid subscription for cost savings goal

22 URBAN MICROGRIDS
ENEA ADVISES AND SUPPORTS INDUSTRIAL AND INSTITUTIONAL ACTORS IN THE ENERGY SECTOR
This case study models an airport in 2025, when the number of electric vehicles is expected to be significant enough to impact airport demand.
The load profile is based on dynamic measurements recorded throughout 2015 at an existing airport [6] representing loads such as lighting, HVAC17, elevators, baggage sorting systems, sanitary, invertors, electric vehicles, etc. The airport can sell produced electricity at a sellback rate equivalent to French SPOT prices18 and buy electricity from the grid at the same price to which network tariffs (TURPE19) and taxes (CSPE20) are added [7][8]. Potential revenue streams from ancillary services and demand response programs are not taken into account in this model.
The airport’s parking lot is equipped with solar PV shelters whose modules must be treated with a specific anti-reflective coating according to the regulations, which implies a higher investment cost[9]. The maximum available area for PV shelters limits PV installed capacity to a maximum of 5.6 MWp[6]. Costs linked to electric vehicles batteries were assumed to be zero21. Each day, an average of 16 vehicles are parked 24/24 which represents an available battery capacity of 656 kWhel that can be used for the vehicle- to-grid simulation22.
Prices forecast for PV and batteries in the simulation take into account potential decreases in the price of technology (modules or cells), Balance of System, and soft costs in 2025.
5.3.2 From grid-only to microgrid
5.3.2.1 Local generation in the airport
The simulation shows that the grid-only scenario offers the lowest LCOE compared to scenarios with 5.6 MWp of PV capacity. The 5.6 MWp solar plant is at the maximum capacity that can be installed in airport parking lots, and over a year it produces more energy than the airport consumes. As shown in Erreur ! Source du renvoi introuvable., the PV production surplus is not entirely sold back to the grid, and is thus significantly curtailed, which degrades the LCOE. The use of free electric vehicle batteries has a very limited impact on the curtailment, and hardly optimizes the cost of the system.
17 HVAC: Heating, Ventilation and Air-Conditioning
18 To be in accordance with load data, grid tariffs are based on 2015 French SPOT prices.
19 The TURPE is the grid fee charged to electricity consumers by French DSOs and TSO to finance electricity
transport and distribution networks. The fee adopted in the present case is for clients with an HTB1 connection and long use times. It includes hourly and seasonal pricing variations.
20 The CSPE tax is a fiscal tax charged to electricity consumers in order to finance electricity public service
obligations, such as renewable energy integration. The tax considered in the model is €30/MWh which corresponds to CRE’s forecasts for 2025.
21 The electric vehicle-to-grid system’s business model was not considered in the simulation. The batteries of
visitors’ electric vehicles parked at the airport are used to optimize the system, but no financial compensation to the vehicles owners has been considered in the model.
22 Electric vehicles are owned by visitors who leave their cars on the parking lot for the duration of their trip.

Takeaways from 3 urban microgrids case studies 23
ENEA ADVISES AND SUPPORTS INDUSTRIAL AND INSTITUTIONAL ACTORS IN THE ENERGY SECTOR
Figure 9 - Comparison of grid-only scenario with local generation scenarios (local generation only, use of vehicle-to-grid system, and use of a grid-scale battery) 23
Given the electricity prices considered (2015 French SPOT prices), the covering of the airport’s entire parking area with PV shelters for local auto-consumption and electricity sale to the main grid is not competitive compared to the main grid electricity. However, local PV capacity enhances airport sustainability, which can be accounted for with two different indicators: the renewable production ratio and renewable penetration (see definition in §5.1).
The renewable production ratio represents the total energy produced by the microgrid over its yearly consumption. Over a year, the airport will produce 133% of renewable electricity in comparison to its annual consumption. This metric should be approached with caution. First, 10% of the energy produced is curtailed as the converter size is limited for cost optimization. Then, more than half of this energy is not self-consumed but fed back into the main grid. Thus, a rate higher than 100% does not mean that the airport is self-sufficient. It rather indicates that energy is lost by curtailment or that the grid has to absorb renewable power peaks that cannot be consumed locally.
Renewable penetration is a more relevant indicator of sustainability: it represents the share of the microgrid energy demand supplied by renewable electricity sources. This rate varies over the year between 0% and 100% depending on the installed renewable capacities and the meteorological conditions: on average, 42.4% of the airport’s total energy demand comes from renewable sources with 5.6 MWp of installed PV capacity.
The installation of PV panels over the entire available surface might not be a competitive option, but a smaller and more adapted sizing of the PV system will provide cost savings and optimize existing assets: clients’ electric vehicles and grid connection.
5.3.2.1 Potential smart embedded networks
Many options can mitigate the overall cost of the smart embedded network:
The optimal NPC is obtained for 1 MWp of installed PV capacity which corresponds to the situation where nearly 100% of the on-site production is consumed on-site: practically no electricity is sold to the grid. If the installed PV capacity increases, sales to the grid increase sharply while purchases from the grid remain steady. Sales to the grid will increase revenues but will not offset the cost of the system, especially the PV parking shelters costs. 1 MWp of PV will present a more competitive NPC than the grid-only scenario.
The use of electric vehicle batteries reduces the cost of energy as EV use increases: for example, for 250 vehicles (almost 10% of available places in the airport’s parking lot) the LCOE decreases by 4.1% for situation with V2G compared with a situation without V2G.
23 Networks costs are excluded
+ 4.2 GWhel purchased
M€ 7.33€134,4/MWh
NPCLCOE
+ 2.4 GWhel purchased- 3.2 GWhel sold
+ 5.6 GWhel produced(5.6 MWp installed)
M€ 10.17€186,2/MWh
NPCLCOE
+ 5.6 GWhel produced(5.6 MWp installed)
656 kWhel EV battery
+ 2.4 GWhel purchased- 3.2 GWhel sold
M€ 10.16€186,1/MWh
NPCLCOE

24 URBAN MICROGRIDS
ENEA ADVISES AND SUPPORTS INDUSTRIAL AND INSTITUTIONAL ACTORS IN THE ENERGY SECTOR
If grid capacity is optimized, which means that the capacity subscribed is limited to local needs, and with the use of clients electric vehicles batteries, the NPC decreases to reach M€6.8 for 1 MWp of PV.
Figure 10 - Costs savings drivers for the airport as a smart embedded network (excluding networks costs)
Another factor that can have an important impact on NPC and LCOE values is the SPOT price level. Electricity prices in 2025 are difficult to predict but they are likely to increase in the coming years. A sensitivity analysis of SPOT price evolution demonstrates that if actual SPOT prices are doubled (+100% increase, on average €76/MWhel), the NPC for a grid-only scenario is higher than for local production of 5.6 MWp or more, which means that it become more beneficial to produce local power with PV and to sell it to the grid than it is to rely only on the grid.
5.3.2.2 Microgrid model
The modeled airport is located in France where grid outages are very rare. The following analysis compares the NPC for different islanding duration times: from a no-islanding situation to an islanding of 12 hours.
134132
123122
6,5
7
7,5
110
120
130
140
Embedded Network 1 MWp PV capacity 1 MWp PV capacity and electric vehicles
batteries use
1 MWp PV capacity, electric vehicles
batteries use and optimisation of grid
connection
LCOE (€/MWh) NPC (M€)
+ 1 MWp PV
+ 656 kWh EV
+ grid optimized capacity
LCOE (€/MWhel)NPC (M€)

Takeaways from 3 urban microgrids case studies 25
ENEA ADVISES AND SUPPORTS INDUSTRIAL AND INSTITUTIONAL ACTORS IN THE ENERGY SECTOR
Figure 11 - Microgrid islanding (excluding networks costs)
The use of an extra battery is necessary to enable the airport to island. This battery adds an extra-cost to the system, which increases with the increase in battery size. Other costs associated with microgrid islanding have to be taken into account (protection, power control, disconnect switch, etc.); these are fixed costs that are independent from battery size. More details are given in section §6.4.
Based on these analyses, islanding capacity connected to the main grid generates a very high cost that is not justified by the value of the increased resiliency delivered by the microgrid. Indeed, the airport is connected to a reliable grid and already has back-up power for its critical loads (air traffic control, etc.); the failure of all energy systems is extremely unlikely and the microgrid would hardly ever operate in islanded mode.
5.3.3 Conclusions of the airport case study
The three drivers were considered in relation to two smart embedded networks situations and one microgrid model:
If maximum cost savings are to be achieved, the ideal mix would be a small solar capacity (up to 1 MWp of installed PV capacity) coupled with the use of electric vehicles and an optimized interconnection with the main grid.
If the airport aims at sustainability at limited expense, the maximum renewable penetration with regard to land constraints that can be reached is 42.4% with 5.6 MWp of installed PV capacity. Without land constraints, the airport can reach 47.5% of renewable penetration with 10 MWp of installed capacity but for a high NPC 12.2 M€.
If the smart embedded network focuses on energy security with a back-up battery, it becomes a microgrid, which increases the NPC of the system to 11.6 M€ (including battery costs and additional costs for a one-hour islanding capability).
Battery size (kWhel) 0 1 150 3 500 7 500
Estimation of extra costs for islanding (€)
0 882 100 882 100 882 100
10 161 300 10 717 028
11 732 549
14 046 232
0h 1h 6h 12h
NPC (€)
Islanding duration

26 URBAN MICROGRIDS
ENEA ADVISES AND SUPPORTS INDUSTRIAL AND INSTITUTIONAL ACTORS IN THE ENERGY SECTOR
Figure 12 - Optimization results for cost savings, sustainability and energy security drivers (excluding network costs)
5.4 Industrial case
This case was designed to investigate microgrid economics in an industrial setting. First it models an industrial environment, with a very flat load curve and a strong heat and cold demand, which contrasts with the more variable demands of EcoDistrict or airports. Then, it compares the economic impact of network reinforcement with the development of a microgrid system. The case focuses on a food processing industrial zone, with growing demand.
For this type of demand on three energy vectors, trigeneration technologies turn out to be a very interesting option. The case will of course highly depend on the arbitrage between gas and electricity prices, which in turn depends on commodity prices and tax schemes for both energy vectors. When there are few arbitrage opportunities (reduced spark spread at consumption level), the optimized system will combine a small trigeneration unit and a solar plant. For significant arbitrage opportunities (high spark spread at consumption level) the optimized system will comprise a larger trigeneration unit, covering the peak demand in the zone. It is not possible to draw a general rule, as electricity and gas prices vary in each country and for each customer, but opportunities for trigeneration plants at an industrial zone level are promising.
Relationships with the main grid are of utmost interest in this case. The cost of network reinforcements, one of the targets of the case, turn out to be of little importance in the economics of the case. Out of the 100 to 200 M€ in NPC necessary for the zone’s energy supply over the project duration (25 years), the few million euros that could be needed to reinforce the grid are not significant compared with long-term gas and electricity price uncertainties. A connection to the grid however brings high value to the microgrids. This connection, with islanding capabilities, is not very expensive for a microgrid with trigeneration (around k€200/year) and, in return, it provides very high reliability value to the zone and, depending on the arbitrage potential, can generate several hundreds of thousands of euros of net income per year. It is nonetheless worth noting that for the same infrastructure, the main grid operator’s received fees are divided by 3, which might jeopardize its financial balance.
The case highlights two diverging dynamics:
It confirms the potential of trigeneration in an industrial zone with strong heat and cold demand. It underscores the limits of current network pricing that mostly relies on the variable portion (on
€/MWh) rather than on demand charges (on €/MW.month) in these cases.
ENERGY SECURITY
COST SAVINGS
Islanding duration depends on battery size: the longer it lasts, the higher the cost of energy. In France, grid outages are very rare and, when they occur, they last for under 1 hour
LCOE = € 212/MWh (5.6 MWp PV)
Costs saving is possible through the installation of a limited PV capacity for auto consumption only, with grid optimization interconnection capacity and the use of electric vehicles batteries for vehicle to grid
LCOE = € 124/MWh (1 MWp PV)
The maximum renewable achievable with land constraint is 42.4% (5,6 MWp PV)
Without land constraint, and for an installed capacity of 10 MW (47.5% of RE)
LCOE = € 186/MWh(5.6 MWp PV)
LCOE = € 223/MWh (10 MWp PV)
SUSTAINABILITY

Takeaways from 3 urban microgrids case studies 27
ENEA ADVISES AND SUPPORTS INDUSTRIAL AND INSTITUTIONAL ACTORS IN THE ENERGY SECTOR
This case was designed to investigate the effects of two aspects of industrial environments on microgrids economics:
The very flat load curves in industrial environments, in contrast with the more variable demands of EcoDistrict or airports
The impact of network reinforcement on such microgrids
5.4.1 Case presentation
The case study focuses on a industrial zone in 2020 in the region of Brittany, France, with growing activity in food processing, leading to an increase in the power load. Because the grid connection capacity is sized based on the former load, the growth in activity leads to an increasing congestion risk. Therefore, the case study focuses on the arbitrage between grid reinforcment and the installation of a trigeneration unit and solar panels onsite, before analyzing the value of the grid connection and the islanding capability.
The input power load profile reflects consumption in an industrial zone, working 24/7, with a fairly constant daily activity and an annual peak load of 11 MWel. The thermal loads used are based on data provided by ENEA based on energy audits carried out for industries in raw material transformation (cheese factory)24. The cost of electricity is based on the sum of 2015 spot prices and the network tariff. For the latter, the fixed and variable part of the French network tariff TURPE 4 for HTB1 connection25 have been integrated in HOMER26.[7] [10]
Trigeneration27, also called combined cooling, heat and Power (CCHP) permits the simultaneous generation of electricity, heat (hot water or steam) and cold water. Because the trigeneration unit size is one of the main output of the analysis, it was therefore important to let this variable vary freely while using HOMER, by permitting the installation of trigeneration units ranging from 1 to 12 MWel.
5.4.2 From grid-only to microgrid
Three cases were considered in HOMER:
The base case: the choice was made to reinforce the grid from 7 MWel to 12MWel so there is no need to install a trigeneration unit.
The case with a trigeneration unit: grid capacity is limited to 7 MWel, a trigeneration unit and solar panels can be installed onsite.
The case with islanding capability: grid capacity is limited to 7 MWel, a trigeneration unit and solar panels can be installed onsite, and the zone has to be able to island for 12 hours.
Figure 13 shows the NPC of the trigeneration case based on limited grid connection with solar panels and a trigeneration unit, for 3 different gas prices. It also shows the NPC resulting from the base case (BC).
24 HOMER does not permit the implementation of cold load. For this reason, it was replaced by a 2nd hot load in
HOMER.
25 The maximum power connection to the HTB1 network is 50 MW [88].
26 HTB1 tariff levels for TURPE 4 include hourly and seasonal pricing variations. The Industrial zone is supposed to be exempt from the renewable levy (CSPE).
27 HOMER arbitrage between local production and grid electricity is based on electricity marginal costs without
considering the overall performance (electric and thermal) of the trigeneration process. This arbitrage has been partially modified by forcing the trigeneration to work full time, with a minimum load ratio of 70%.

28 URBAN MICROGRIDS
ENEA ADVISES AND SUPPORTS INDUSTRIAL AND INSTITUTIONAL ACTORS IN THE ENERGY SECTOR
Figure 13 – Trigeneration case: Evolution of NPC with electricity and gas prices (excluding network costs)
For this simulation, the installed capacity of the trigeneration unit and solar panels are free variables, which are therefore decided by the software. HOMER optimization leads to two different results for these variables, depending on the relative positions of gas and electricity prices:
A trigeneration unit of 4 MWel and 2 MWp of solar panels (optimized solution in 20% of the modeled cases), mostly for cases when the price of gas is €40/MWhPCS and when the cost of electricity is under €65/MWhel.
A trigeneration unit of 12 MWel and no solar panels installed (optimized solution in 80% of the modeled cases), for cases with lower gas prices.
The choice of a 12 MWel trigeneration unit can be seen as surprising given the cost of the technology. However, it can easily be explained by the high thermal loads in the industrial zone, which strongly benefit from the overall process efficiency, leading to a smaller NPC28. Another advantage is the low extra-cost of islanding using this size of generator. However, for higher gas prices or for smaller thermal loads, the benefits of trigeneration decline.
Figure 13 also shows that, even if trigeneration units protect the industrial zone from the impacts of electricity price increases, the choice of installing local production is not always beneficial:
For a gas price of €40/MWhPCS, it is only when the annual average electricity spot price increases by more than 100% that the NPC of the project is under the base case's
For a gas price of €30/MWhPCS, it is only when the annual average electricity spot price increases by more than 50% that the NPC of the project is under the base case's
28 Without forcing the software by fixing a minimal load ratio of 70% for the trigeneration unit, optimization leads
to a low average load ratio for the generator, compensated by an important load ratio for the boiler in order to supply the thermal load
90
100
110
120
130
140
150
160
170
180
190
200
210
45 50 55 60 65 70 75 80
Net
pre
sent
cost
(NPC
)
Annual average electricity price(spot price + variable part of the network tariff)
€20/MWh
€30/MWh
€40/MWh
BC-€20/MWh
BC-€30/MWh
BC-€40/MWh
Evolution of net present cost with trigeneration
BC = Base-Case

Takeaways from 3 urban microgrids case studies 29
ENEA ADVISES AND SUPPORTS INDUSTRIAL AND INSTITUTIONAL ACTORS IN THE ENERGY SECTOR
For a gas price of €20/MWhPCS, installing a trigeneration unit is always more beneficial than using only the grid to supply the power load.
It is interesting to note that the cost of grid reinforcement should only have a limited impact on overall project NPC. The arbitrage between grid reinforcement and trigeneration unit installation is indeed mostly based on the prices of electricity and gas29.
Islanding capability (12h)
In 80% of the optimized cases, the cost of islanding is low as a 12 MWel plant is installed on site, which is enough to allow 12-hour islanding. The cost of islanding-associated extra equipment is assumed to be limited to k€250 for the electrical devices (controller, main switch, sectionalizing switchgear, etc.) and the Energy Management System (EMS). There is no need for extra generation capacity, and the microgrid is easy to operate because there is one single and flexible generation capacity (no DER30s). For cases in which a 4 MWel trigeneration unit is installed, the extra cost of islanding comprises two elements:
The additional NPC of a project using a 12 MWel trigeneration unit instead of a 4 MWel one. This additional cost is however minimized if electricity prices increase. Then the 12 MWel plant entails larger cost savings than the 4 MWel unit.
The cost of electrical devices and EMS (k€250).
Depending on gas and electricity prices, the extra cost of islanding will range from k€250 to M€10. However, in 80% of the cases, the extra-cost of islanding is limited to k€250.
5.4.3 Costs and benefits of grid connection
Results show that, for specific gas and electricity prices, installing a trigeneration unit able to satisfy the entire power load can be beneficial. For such cases, the extra-costs of islanding are very low because they are limited to internal electric devices and the EMS.
Keeping the grid connection in a situation where the microgrid has a generation unit able to satisfy the entire load remains interesting for several reasons:
First, because the network tariff cost is lower than for the base case, even with the same power subscription. Indeed, as the trigeneration unit can provide for most of the energy needs, the energy part of the tariff is almost equal to zero. Considering that grid consumption is divided by 10 in comparison with the base case, the average cost of the grid connection is estimated at k€215, instead of k€665 without trigeneration;
Fixed part: k€165/year Variable part: k€50/year instead of k€500/year in base case
Second, because using a 12 MWel generation unit enables the microgrid to benefit from additional income by selling back electricity into the grid (see Table 2)31.
29 Because of the correlation between gas and electricity prices, some chart areas are unlikely: when gas prices are
higher than €35/MWh without any increase in electricity or when electricity prices increase strongly but gas prices remain low
30 Distributed Energy Resources – small power sources that can be aggregated together to provide sufficient power
31 When prices of electricity increase, the amount of electricity injected into the main grid increases as well. In
contrast, the industrial zone consumes almost no electricity from the main grid and does so only for the smallest lowest prices.

30 URBAN MICROGRIDS
ENEA ADVISES AND SUPPORTS INDUSTRIAL AND INSTITUTIONAL ACTORS IN THE ENERGY SECTOR
Average electricity price (spot + variable part of network
tariff)
Gas price Generator load ratio
(min: 70%)
Electricity sold – average
price
Electricity purchased –
average price
Net benefits/year
€45/MWhel (2015)
€30/MWh PCS 84% 6.38 GWhel – €48/MWhel
3.60 GWHel – €34/Mwhel
M€0.19
€65/MWhel
(+50%) €30/MWh PCS 91.5%
25.5 GWhel – €42/MWhel
0.26 GWhel – €25/MWhel
M€1.06
Table 2 – Benefits from selling electricity to the main grid
Other important benefits of grid connection are:
The corresponding improved quality of supply for the zone The possibility to stop the generation unit for maintenance The profits generated by participating in a demand response mechanism (not considered in this study)
Even with a 12 MW generation unit, the grid connection remains very beneficial because of the different services provided. It is also cheaper, as the variable part of the public network tariff decreases strongly. However, this last point can be seen as problematic because it doesn’t reflect the real cost of the microgrid for the network. This item is more precisely described in §6.

Main challenges and lessons learnt on urban microgrids 31
ENEA ADVISES AND SUPPORTS INDUSTRIAL AND INSTITUTIONAL ACTORS IN THE ENERGY SECTOR
6 MAIN CHALLENGES AND LESSONS LEARNT
ON URBAN MICROGRIDS
6.1 Regulatory challenges
As in most cases with disruptive innovations, microgrid technologies have progressed quicker than the regulatory framework governing them. Microgrids challenge most of the pillars of a liberalized energy system, which might need some adjustment to fit these new project types:
Regulations have been developed over the past decades mostly for actors operating at a global and centralized level – providing electricity to a large amount of customers – whereas microgrids concern mostly local projects. Therefore, the existing framework can be very constraining on specific subjects when applied to the size of microgrids: franchise rights32, administrative obligations, etc.
Unbundling33 for MW scale microgrid is likely to increase transaction costs to a high level. Costs and benefits of the unbundling process should be thoroughly investigated to more precisely assess its economic impact on microgrid development.
Ensuring the rights of final users (free choice of suppliers or transparent tariffs) is often stated as complex for small-scale networks and can therefore lead to disputes.
The network tariff structure (fixed and variable part) is not adapted to users with high self-consumption levels, as is the case for microgrid users. A microgrid requires limited amount of energy from the grid, implying a small variable part. Grid fees no longer represent the actual costs of the network in that case.
Internal energy consumption is usually not taxed by the national schemes supporting renewable, questioning the structure of these levies.
Microgrid connection to and disconnection from the main grid is a crucial and complex operation. It has to be clearly defined (liability, procedure, etc.) by policy makers aiming at developing microgrids.
With respect to these topics, it appears that microgrid development will require the regulatory framework to evolve, either by adapting existing mechanisms (I) or by defining ad hoc alternative regimes (II).
I - Changes need to be made in the grid regulatory framework to allow the operational implementation of microgrids:
Clearly defined disconnection and reconnection procedures, as well as ancillary services to the main grid, are necessary to secure microgrid interactions with the main grid.
Current network tariffs, when applied to microgrids, do not reflect the cost of services provided by the grid to the microgrid (low consumption, same reliability). Its structure should evolve to more adequately reflect the service provided. Similarly, it should also take into account the value delivered
32 “In monopoly electric markets, the local utility often has a franchise right for certain defined geographic areas.
Under this franchise right, the local utility is usually the sole wholesale or retail seller of electric energy within the franchise area. The specific form [...] may vary [...] but the intended purpose is to endow the utility’s activities with both the authorities and restriction associated with providing a public service.” [78]
33 For electricity markets, unbundling refers to the separation of historically vertically integrated structures.
Unbundling means the separation of energy generation and supply from the operation of transmission and distribution networks, in order to avoid the incentive for a vertically integrated structure to limit a competitor’s access to crucial network infrastructures. The main objective of unbundling is therefore to develop fair competition in the market, for generation and supply activities.

32 URBAN MICROGRIDS
ENEA ADVISES AND SUPPORTS INDUSTRIAL AND INSTITUTIONAL ACTORS IN THE ENERGY SECTOR
by the microgrid to the main grid if the grid operator uses the microgrid capacity to decrease the cost of network reinforcement and extension or for black-start after an outage. Value exchanged from one party to another should be carefully evaluated to ensure economic fairness.
Taxes on electricity consumed within the microgrid should support national objectives such as energy transition and national solidarity. Taxes could also possibly consider positive externalities at a societal level, such as increased resiliency or local economic development.
II – The establishment of a microgrid regulatory framework implies alternative approaches offering more flexibility to microgrid stakeholders while protecting final users’ rights:
Microgrid operators should work under an appropriate regulatory regime, especially regarding unbundling requirements for vertically-integrated structures.
The status of microgrid stakeholders (operators, prosumers, etc.) should be adapted to prevent an excessive administrative and financial burden.
Final users’ rights within the microgrid, especially the right to freely choose suppliers, may be more efficiently ensured by a dedicated regulatory framework.
How should regulations and franchise rights take into account microgrid development?
Regulations have been developed over past decades mostly for actors operating at a federal (US), national or regional level, and therefore serving a large number of final users. In contrast, microgrids concern local and diversified projects, involving a smaller number of customers and potentially small independent power producers (IPP) and/or prosumers. Therefore, the existing regulatory framework can be very constraining on specific subjects such as franchise rights or utility status, when applied to the scale of microgrids. Current regulatory statuses imply for instance obligations on rate setting, technical standards or administrative reporting which may seem excessive for actors willing to develop a microgrid. In terms of franchise rights, a problem may also arise if a microgrid project crosses public streets, for instance in an EcoDistrict project with building wires in the public domain. These issues can threaten projects and depend strongly on the degree of flexibility the local regulation provides to actors.
In the US, cases strongly depend on the State regulations in force, with more conservative frameworks34 such as in South Carolina and very flexible ones, such as in Connecticut. It is interesting to note that local authorities also sometimes have the right to own and operate electric assets. They can therefore easily cooperate and allow a third party to operate a microgrid within the territory of the concession [11]. With respect to administrative obligations, the Public Utility Regulatory Policies Act of 1978 (PURPA) implemented the Qualifying facilities status for a specific group of generating facilities. A microgrid must apply to obtain this status to benefit from a simplified “special rate and regulatory treatment”, according to the Federal Energy Regulatory Commission (FERC). These facilities are split into 2 categories:
Qualifying small power production of 80 MWel or less using a renewable energy source as primary energy
Qualifying Combined Heat and Power (CHP) facilities, which have no size limitations [12].
Certification is provided by the FERC under additional specific conditions, but there is a more flexible regulatory framework for small independent producers operating microgrids, especially for a single user operating their own generation assets.
In Europe, where the microgrid market is still in the development phase, the regulations depend on the national market that is structured by national and European policies, and its capacity to allow 3rd party actors
34 These frameworks are often based on a regulated market with one single utility being in charge of the public
service utility

Main challenges and lessons learnt on urban microgrids 33
ENEA ADVISES AND SUPPORTS INDUSTRIAL AND INSTITUTIONAL ACTORS IN THE ENERGY SECTOR
to penetrate it. At the European scale, some possibilities already exist and are worth mentioning. For instance, the European 3rd energy package allows Member States to exempt Closed Distribution Network35 (CDN) operators (Article 28, 2009/72/CE) from:
Installing extra generation capacity to make up for energy losses Providing reserve capacity The prior approvement of tariffs (and methodologies used for their calculation) by the dedicated public
authority36. [13]
The CDN example shows that the European regulatory framework can provide flexibility on specific topics, by allowing Member States to provide exemptions from common energy market rules. It is likely that the development of an ad hoc microgrid regulatory regime will need to consider and reinforce such examples.
Ownership unbundling regulations applied to microgrids
National or regional legislations – particularly the European energy market ones – often involve unbundling requirements for vertically-integrated structures, which can represent a major burden when applied at the microgrid scale. The long-term impact of the unbundling process should be investigated to assess whether these requirements are likely to hinder the development of microgrid initiatives.
This question is particularly significant in Europe, but also in the US states where electricity market deregulation has led to the development of unbundling requirements in order to allow new actors to penetrate the generation and supply activities (California, New York, etc.). European energy market legislation provides a clearly defined framework to develop fair and transparent competition in a deregulated market. Among the different rules, the separation of energy supply and generation from distribution and transport activities was designed for large vertically-integrated structures (often holding a monopoly position on the market). For projects the size of microgrids, the implementation of a legal, managerial and accounting separation can represent a financial and administrative constraint, which could threaten the economic viability of the projects37.
Because it is unlikely that States developing a deregulated market will come back to a regulated one using one single vertically-integrated entity, the solution may involve the development of specific exemptions for microgrid developers. Such possibilities exist in European law but they need to be transposed into national law specifically for the case of microgrids. For instance, article 26 of the European 3rd energy package provides a crucial element which can impact future regulation on microgrids, by stating that Member states may decide not to apply obligations related to the unbundling of distribution system operator to “integrated electricity undertakings serving less than 100,000 connected customers, or serving small isolated systems”. This exemption38 might easily be applied to microgrid owner in Europe, by transposing the directive.
35 A Closed Distribution Network is a system which distributes electricity within a geographically confined industrial,
commercial or shared services site” and does not supply “household customers” except for a “small number of households with employment or similar associations with the owner of the distribution system” (Art. 28, 2009/72/CE)
36 This requirement is mentioned in Article 32 of the European 3
rd energy package.
37 It is worth noting that most existing microgrids include a partially or fully integrated structure.
38 In France, the transposition of article 26 provides to Local Distribution Companies (LDCs) the right to supply and
produce electricity while operating a local distribution network (Art. L. 111-58, Energy code), as long as they separate the accounting of production and generation from the accounting of distribution activity (subject to public tariff network) [87].

34 URBAN MICROGRIDS
ENEA ADVISES AND SUPPORTS INDUSTRIAL AND INSTITUTIONAL ACTORS IN THE ENERGY SECTOR
To conclude, regardless of the form given to the unbundling exemption that could be granted to develop microgrid markets, it should take into account the importance of public service obligations generally attributed to the DSO, customer rights’ protections and potential impacts on energy markets.
Why is the protection of consumers’ rights crucial to microgrid development?
Protecting consumers implies several obligations for stakeholders, such as ensuring the customers’ right to freely choose their supplier and to pay tariffs calculated transparently.
In Europe, such rights are mostly based on the required respect for the four freedoms that are at the basis of the European internal market: free movement of goods, freedom of movement for workers, right of establishment and freedom to provide services, free movement of capital. The 2nd electricity directive (2003/54/EC) introduced the right for customers to freely choose their electricity suppliers, as well as for suppliers to freely deliver electricity to customers [14]. Unlike the large liberalized market in Europe, microgrids are mostly geographically limited and are operating at a smaller scale, which could be an issue regarding 3rd party access. Stakeholders report uncertainties regarding this right for customers to choose their supplier freely, for instance [15]:
Within commercial centers for technical and administrative reasons. In case of a rental agreement covering all costs including energy fees for a multi-dwelling house. If the billing software is not able to deal with final users’ self-consumption and there is a 3rd party
supplier for the additional electricity consumed.
Current national regulations, in Europe or the US, mostly consider that the net metering of energy flows within the microgrid (by calculating the net consumption of every final user) ensures the possibility of 3rd party access. Net metering is likely to be the responsibility of microgrid operators who may use the technical capacities of the local DSO via a service delivery contract. However, it is uncertain to date that net metering will be sufficient to avoid potential disputes on these topics, especially when billing capabilities are lacking. The deployment of smart metering infrastructures capable of calculating the load and production curves of every final user and producer may enable the appropriate allocation of energy flows and reduce the risk of disputes.
Another important microgrids user’s right is the right to pay a tariff calculated transparently and that can be contested before a regulatory agency. Because microgrid projects might lead to private and almost independent networks, operated by private entities, it is crucial to protect the final users from potential abuse. On this topic, it is interesting to note that article 28 of the 3rd energy package states that, when an exemption of prior tariff approval is granted to the CDN operator, “the applicable tariffs of the methodologies underlying their calculation shall be reviewed and approved […] upon request by a user of the closed distribution system.”[16]. If a user does not approve of the microgrid tariffs and wants to change its electricity retailer, a metering system should in place to enable any user to benefit from another offer.
The protection of final users will be a core element for the successful development of microgrids, and it will either be based on general European rules or on a specific and adapted regulation that all projects will have to respect. It is hence important to pay attention to potential future disputes regarding microgrids because they can provide interesting details on the operational implementation of such rights.
How should tariffs be calculated for public network microgrids to reflect the value of the service provided by the grid in the long term?
An important issue for microgrid regulation is the evolution of the methodology underlying the calculation of public network tariffs. Current network tariffs, when applied to microgrids, do not reflect the cost of services provided by the grid to the microgrid (low consumption, same reliability). This issue has already been raised with the development of self-consumption: for such installations, the value provided by the main grid cannot be fully recovered through conventional kWhel charges based on electricity consumed from the main grid.

Main challenges and lessons learnt on urban microgrids 35
ENEA ADVISES AND SUPPORTS INDUSTRIAL AND INSTITUTIONAL ACTORS IN THE ENERGY SECTOR
The importance of this issue depends mostly on the local tariff structure and concerns mostly cases where the variable parts – based on energy consumed and not on power subscribed – represent most of the network connection costs. In France for instance, the public network tariff (TURPE39) is based on a fixed part, calculated according to maximum power demand, and a variable part, based on the quantity of energy consumed. The latter, represents for an average French customer40 between 65% and 85% of the overall cost, according to their annual consumption. For an industrial with no tariff exemptions, the variable part can be estimated between 70 and 80%, as in the case study presented in §5.4. The tariff structure and the fixed and variable part levels depend on local regulations: some countries have given a lower importance to the variable part (Spain, Italia, etc.) while others, such France or the United Kingdom, have tariffs mostly based on the amount of energy consumed [17]. With microgrid projects, the variable part decreases dramatically as the main grid is only used as a backup network. For a customer using self-consumption with a net consumption close to zero, the TURPE paid can therefore be divided by four. Even if self-consumption and microgrids permit the deferment of network investments due to a lesser use of the main grid, this situation no longer reflects the real costs of the microgrid for the network, which still have to provide the same quality of supply. The rate base for the public network can also sharply decrease, leading normal final users to carry a larger charge burden for the same services.
In the short term, the current network tariff benefits microgrid projects: its users benefit from the same reliability while paying almost no charges on electricity consumed. However, in the long term, it seems important that the structure of public tariffs reflect the real value of the service provided. This value is likely to be lower than the one furnished to usual users – because of the low consumption – but higher than one estimated by current tariffs.
In order to be fairer with regards to main grid costs, the structure of network tariffs might be adapted. This question is an important issue for public network operators, who often ask for an increase of the fixed part – based on power demand – in order to represent the growing importance of the back-up function of the public network. In France, the ordinance on self-consumption states that a specific TURPE will be proposed by the regulatory commission for collective self-consumption installations less than 100 KWel. The structure of this new tariff will have to be analyzed very closely when it is published (balance between fixed and variable part, possible injection tariff, etc.).
Should microgrids be exempted from electricity taxes?
Internal energy consumption is usually not taxed by the national schemes supporting renewables, questioning the base of these levies. Although quite similar to the previous one, this issue also concerns the national energy strategy of countries.
Taxes on energy are often based on the energy consumed from the grid. They provide support for the development of renewable energies, but can also support national energy solidarity (by tariff equalization for instance) as does the CSPE41 in France or the EEG42 in Germany. For microgrids (and smart embedded networks) able to self-consume most of the electricity locally produced, the rate base for energy taxes is strongly reduced. This situation can be seen as unfair for several reasons:
Because microgrid users are still concerned by national solidarity through tariff equalization, social tariffs, etc. (as in the French case);
39 Public electricity grid usage tariff
40 Low voltage customer (6/9 kVA), consuming between 3 to 10 MWhel pro year (TURPE 4)
41 Contribution to the electricity public service
42 Erneuerbare Energien Gesetz

36 URBAN MICROGRIDS
ENEA ADVISES AND SUPPORTS INDUSTRIAL AND INSTITUTIONAL ACTORS IN THE ENERGY SECTOR
Because the energy produced onsite is rarely 100% renewable: if the taxes supporting renewables development are not applied to renewable energy self-consumed within the microgrid, they should remain on fossil fuel based generation.
Exempting microgrids can also be seen, in contrast, as a way to support their development in the short term. Exempting or not self-consumed electricity in a microgrid is in any case a matter of national preference regarding the level of incentives engaged to develop the market. One possibility could be to partially exempt self-consumed electricity from taxes before cancelling the exemption once the sector reaches a full maturity. The German case on self-consumption is an interesting example of such public policy:
Between 2009 and 2012, self-consumption was subsidized for new PV installations (€0.03 to €0.06/kWhel)
Between 2012 and 2014, with the achievement of grid parity, the subsidy was abolished for new installations. [18]
The use of a decreasing tax exemption provides an incentive for the development of microgrids until they reach economic maturity. It has to be correctly sized, which is difficult because of the diverse benefits of microgrids that are more complex to measure (investment deferral, increasing of power quality, higher rate of distributed energy resources, etc.).
Why is the notion of islanding a crucial issue for microgrid development?
Clearly defined disconnection and reconnection procedures, as well as ancillary services to the main grid, are necessary to secure microgrid interactions with the main grid43.
Today, the regulatory framework does not take islanding into consideration. However, main grid connection and disconnection has to be precisely defined by regulations in order to allow microgrids to develop to their full potential. One risk raised by stakeholders is the impossibility for a microgrid operator to reconnect its network to the main grid if the local DSO refuses for technical, economic or balancing reasons. Grid reconnection procedures must therefore be precisely defined, such as the question of the DSO’s right to ask for islanding in case of excess power production in the microgrid.
By providing clearly defined rules on islanding, the regulation would decrease the risks associated with these projects, and therefore make them more attractive for potential investors.
6.2 Business model challenges
6.2.1 Microgrid stakeholders and value streams
A microgrid ecosystem comprises several stakeholders as presented in Figure 14. Inside the microgrid, 4 different roles can be distinguished: the owner, the electricity producer, the operator and the final user. These roles can be played by a single actor or many actors. Outside the microgrid, interfaces exist with multiple players: the main grid owner, the main grid operator, regulatory institutions and external electricity retailers. An interface can also be distinguished between the final microgrid users and the external electricity retailer who could supply them even if the electricity sold is generated outside the microgrid.
43 This issue can be seen as less crucial for cases where the DSO is in charge of operating the microgrid, because the
same entity operates the microgrid network and the main grid.

Main challenges and lessons learnt on urban microgrids 37
ENEA ADVISES AND SUPPORTS INDUSTRIAL AND INSTITUTIONAL ACTORS IN THE ENERGY SECTOR
Figure 14 – Stakeholders in a microgrid ecosystem
An immediate source of economic profitability would be the operation of one’s own private network, as the operational costs are usually lower than the grid charges for the same amount of energy. Several value streams listed in Table 3 may bring about additional income for the microgrid stakeholders (see Figure 14) that would contribute to make the microgrid system profitable.
Value streams
Services to the system operator: Frequency and voltage regulation, spin/non-spin reserves, black start, demand-response remunerated by main grid operator
Public subsidies: regional aid as feed-in-tariffs for renewables or subsidies linked to renewable self-consumption, highly dependent on the region and the associated regulatory framework
Energy arbitrage and optimized sales to the energy system: energy injected into and taken from the main grid to make the most of wholesale market prices
Local services to the DSO: investment deferrals in the congested transmission corridors
Quality of supply: Energy security and higher rates of local renewable energy sources remunerated by the end-users through power sale contracts
Table 3 – Microgrid values streams
Services to the system operator: in order to maintain the quality and the reliability of the main grid, microgrids can offer services to the main grid operator, such as ancillary services via frequency and voltage regulation to maintain a good balance. They can also offer spin and non-spin reserves when main grid’s power generators fail through the microgrids’ extra battery capacity or backup generators. Microgrids can also be valuable for helping the main grid to black-start after a power outage as large generators need outside electricity supply to restore operations after shutting down. Finally, microgrids might help the main grid with demand-response to provide fast responding load curtailments to relieve congestion. Microgrids can obtain compensation from the main grid for all of these services.
Public subsidies: microgrids could be eligible for regional aids, such as feed-in-tariffs for renewables or subsidies linked to renewables self-consumption that can help increase local renewables penetration in the energy mix; this is highly dependent on the region and the associated regulatory framework.
MICROGRID OWNER
Microgrid Users
Main grid operator(DSO, TSO)
Incentive and constraints makers
Main grid owner (municipality, ...)
Electricitysuppliers
Microgrid operator
Electricity retailer
3rd party access

38 URBAN MICROGRIDS
ENEA ADVISES AND SUPPORTS INDUSTRIAL AND INSTITUTIONAL ACTORS IN THE ENERGY SECTOR
Energy arbitrage: microgrids could also rely on energy arbitrage in the wholesale market to increase their revenues by buying electricity when market prices are low and selling it when the prices are high. This implies that the microgrid is able to participate in wholesale market.
Local services to the DSO44: another value stream for microgrids could be services to local DSO by helping it to delay or avoid investments in congested networks. Microgrids could delay or eliminate the need for upgrades when implemented in strategic locations downstream of the congestion.
Quality of supply: microgrids could receive compensation for the local electricity produced from the microgrid’s final users through sales contracts that cover electricity production but also services linked to green energy and security of supply.
6.2.2 Business models identification
The diversity of microgrid business models can be explained by an important diversity of local regulatory frameworks, stakeholders and drivers (energy security, costs saving and sustainability). This section presents the most relevant business models for microgrids based on an analysis of existing microgrids and the regulatory frameworks screened in different regions of the world.
6.2.2.1 Methodology
As a first step, the proposed methodology screens all the possible business models with regards to:
Key functions within the microgrid: ownership and operation of production assets and microgrid distribution network assets.
Microgrids owners and operators:
A distribution system operator (DSO): an unbundled entity that performs distribution public services on the main grid
An end-user (or a cluster of end-users): the final consumer of the electricity produced in the microgrid. It can be a public entity, a private entity or an individual, such as a university, a hospital, an industrial site or a residential consumer.
A 3rd party: a private entity or a consortium of entities that owns or operates assets in the microgrid such as a utility, an energy service company, a project developer or an investment fund.
Combinations of these functions and stakeholders are reviewed according to the matrix presented in Figure 15 and excluded from the scope if they are not relevant. This methodology led to the identification of four categories of business models.
44 DSO is the distribution system operator, responsible for operating, maintaining and if necessary developing the
distribution system

Main challenges and lessons learnt on urban microgrids 39
ENEA ADVISES AND SUPPORTS INDUSTRIAL AND INSTITUTIONAL ACTORS IN THE ENERGY SECTOR
Figure 15 – Analysis matrix for business model screening45
6.2.2.2 Business modes identification results
The selected combinations are grouped into four categories of business models illustrated in Figure 16. Each model addresses strategies regarding investment costs and regulations:
Single user model: an electricity consumer owns production and distribution assets46. Operation can be delegated to another entity, such as a contractor or the local DSO. This model is the most simple to implement as local regulations have very limited impact on electricity generation in private areas.
DSO with unbundling exemption model: DSO owns and operates the whole microgrid. One single DSO ensures better coordination with the main grid, but this model might be hindered by strong regulatory constraints depending on local unbundling requirements.
Hybrid model: generation assets are owned by final users (or a third party) while distribution assets are owned and operated by the DSO. This model combines operational expertise of the DSO, easier coordination with main grid and a separated source of capital. This model seems well suited to multiple stakeholders, for example residential microgrids, even though multiple sources of generation and loads might be more challenging to coordinate.
Third-party model: one or several private entities own the assets and fulfill the main grid role from the end-users point of view. Distribution assets operation may be delegated to the local DSO. There would be no upfront costs for microgrid users, but the third-party might need specific exemptions regarding vertically-integrated structures and/or franchise rights and/or distribution monopoly.
45 The term “grid” refers to the distribution network within the microgrid.
46 Most of the time, the single user already owns substantial generation and distribution assets and upgrades the
existing infrastructure into a microgrid.

40 URBAN MICROGRIDS
ENEA ADVISES AND SUPPORTS INDUSTRIAL AND INSTITUTIONAL ACTORS IN THE ENERGY SECTOR
Figure 16 – Relevant business models adopted and possible variations
6.2.2.3 Conclusions
The four models could respond to different drivers: energy security, costs saving, sustainability.
Figure 17 illustrates the distribution of the different business models with regards to the drivers presented in part §4.1.3, which are the main reasons for the implementation of a microgrid project. This analysis is based on existing microgrids projects available in literature and reviewed for this study.
The creation of a single-user microgrid model is often based on securing a critical load: research laboratories, military installations or hospitals need to secure their activities against grid outages and natural disasters. U.S. army bases (Fort Carson, Fort Hunter and Fort Belvoir among others) and the Santa Rita jail are the pioneers of microgrid development in the United States. International research centers, such as the Princeton labs, already relied on back-up generation and are now upgrading to microgrid systems. Variations including actors such as a 3rd private entity or DSO can also lead to potential costs savings based on energy arbitrage and – partially – a higher penetration of renewables.
The DSO model is mostly based on the search for the highest socio-economic benefits to be derived from the microgrid project analyzed as part of a larger network, but the question of energy security also remains important to maintain the balance of the main grid. This model can also help increase of the penetration rate of renewables in the energy mix. Green Mountain Power, the local Vermont DSO is a case in point of these concerns with its 100% solar Stafford Hill microgrid.
The hybrid model is mostly based on the will to develop resilient structures enhancing climate ambitions. It leads to multi-actor partnerships within the microgrid in order to develop DERs and protection from main grid disruption. The Borrego Springs district took a first step toward this model: a few generation assets are owned by the residential consumers of this utility-owned microgrid.
The 3rd party model responds mostly to a private economic approach and is therefore focused on the cost saving driver. At Sendai site, a telecommunications operator provides electricity to the nearby hospital and has replaced grid service for the end-user.
MICROGRID MODELS
SINGLE USER 3rd PARTYDSO with unbundled
exemption
DSO
Third party
Final User
Prod
Own
Oper.
Grid
One final user Multiple final users
HYBRID

Main challenges and lessons learnt on urban microgrids 41
ENEA ADVISES AND SUPPORTS INDUSTRIAL AND INSTITUTIONAL ACTORS IN THE ENERGY SECTOR
Figure 17 – Business models and drivers of urban microgrids
This distribution may evolve in future given the increasing diversity of stakeholders developing microgrids projects as well as the increasing technical ease to develop them.
The four models also present different growth opportunities.
Most urban microgrid projects running today are single-user installations (hospital, campus, etc.), with critical loads to secure [19]. The most common scenario is one in which significant distribution and generation assets, such as Combined Heat and Power (CHP) and/or diesel already exist onsite and facilitate the implementation of a new technology [20]. For these reasons, and because of the regulatory and contractual simplicity permitted by the small number of stakeholders, the single-user model today represents the most mature business model. Partnership with a DSO or a 3rd party can also make the implementation easier for the final user, by permitting access to external operational expertise.
However, innovation offers new possibilities of the development for alternative models, by permitting a more sophisticated integration of technologies within a multi-stakeholder framework. Digital tools adapted to microgrid specificities offer opportunities to simplify and optimize the operation of complex microgrids with multiple consumers and producers. The Internet of Things applied to microgrid assets enables enhanced communication between the system’s various sensors and the microgrid manager’s central platform. Energy transactions, billing and value redistribution can also be handled more easily with digital innovations. For example, the blockchain concept has allowed a pilot smart grid in Brooklyn to create a local market for PV electricity exchanged by a very large pool of households, both consumers and producers. Because of access to private capital, the 3rd party model today has one of the strongest growth potentials but still has to face some challenges, especially regarding the regulatory framework (unbundling requirement, needs to protect final users’ rights, etc.). The hybrid model has also strong growth potential while benefiting from easier implementation (the same entity operates the main grid and the microgrid, the model respects unbundling requirements, etc.). Lastly, the DSO model is less likely to develop because of regulations limiting the development to states where there are no unbundling requirements or where the DSO can be exempted by adequately justifying the socio-economic benefits of the project, with regard to a business-as-usual regulation.
SUSTAINABILITYCOSTS SAVING
ENERGY SECURITY
Single user model
DSO model
Hybrid model
3rd party model
DSO
Third party
Final User
Prod
Own
Oper.
G rid

42 URBAN MICROGRIDS
ENEA ADVISES AND SUPPORTS INDUSTRIAL AND INSTITUTIONAL ACTORS IN THE ENERGY SECTOR
Figure 18 – Microgrid growth potential and ease of implementation
6.3 Technical challenges
SimpleComplex
Low
Strong
Growth potential
Implementation(regulatory , technical and contractual constraints, ...)
Single user model
DSO model
Hybrid model
3rd party model
While they are not grid connected and therefore cannot be strictly called “microgrids,” the first experience with microgrid technology often comes from remote power systems that have been designed to operate completely disconnected from the main grid all the time. Urban microgrids differ from these off-grid microgrids because they must operate both in grid-connected mode as well as in off-grid island mode. The combination of these two functions entails technical issues during the period when disconnection, islanding, and reconnection to the main grid occur. This section discusses the main technical challenges to urban high power-quality and reliability microgrids, and whether they are preventing the development of microgrids.
Microgrids can integrate any kind of distributed generation and loads, so they can be inherently very different from one another. The different technical challenges and solutions listed in this section are highly dependent on the form of microgrid examined. For example, synchronous generators have electric similarities with traditional grid production implying that interactions with main grid as well as islanding are easier to achieve than with renewable sources.
Experts assert that microgrid technical points can all be addressed with relevant topology or adequate equipment [24, 26, 23, 22]. The different solutions are sorted according to maturity, reliability and cost.
Challenges linked to islanding have led to extensive literature on the subject, but the different proofs of concept are rarely followed by real-world deployments. Research topics frequently involve advanced systems based on communications and controls. This sometimes goes against real-world constraints such as cost and reliability. Indeed, advanced engineered systems may present high costs because of over customization. The microgrid would also rely on a diversity of electronic components and a communication network, which increases outage risk following a single component failure. The microgrid designer should keep in mind this trade-off between performance and robustness when it comes to address microgrid technical operation. Real world microgrid configurations are also usually simpler than the ones addressed by research topics and therefore do not require complex controls [23].

Main challenges and lessons learnt on urban microgrids 43
ENEA ADVISES AND SUPPORTS INDUSTRIAL AND INSTITUTIONAL ACTORS IN THE ENERGY SECTOR
Islanding is a complex process that raises technical challenges
The process of islanding should be well controlled in order not to lose the generation-load balance, a key condition for maintaining a healthy microgrid during islanding.
First, the microgrid controller should be able to detect any malfunction on the main grid side and disconnect quickly enough not be impacted by the main grid fault. This is achieved with sensors and simple detection methods. Once disconnection is initiated, generation sources should have enough reserve to replace the energy previously imported from the main grid. Generators at low point of operation, or batteries, must have enough power reserve to fulfill this role, or a suitable load shedding scheme implemented. During AC microgrid islanding, voltage and frequency must be kept within acceptable ranges in order to avoid devices tripping off-line or damage to the assets. In case of distributed generation sources, the challenge is even bigger as the different assets must be synchronized. When the fault is no longer detected on the main grid side, the microgrid should reconnect seamlessly without major impact on the main grid or the microgrid network.
Most of the crucial technical challenges linked to islanding can be overcome with existing technologies
Several challenges that are linked directly or indirectly to islanding have been identified. Selected challenges presented in Figure 19 are the ones with the highest potential to hinder or fast-track the development of microgrids. They have often been highlighted by stakeholders and experts as points of concern [21]. None of these challenges can prevent the smooth technical functioning of a microgrid. Nevertheless, investigating solutions would decrease the cost of current solutions, simplify microgrid implementation or reassure utilities that microgrids have little impact on main grid operation.
Figure 19 - Challenges or opportunities for microgrid technical design and operation
Fast islanding detection
Black-start
Flexibility in design: compatibility of microgrid assets, especially if microgrid evolution in time - new assets or demands…
Security against external threats: terrorist, cyber attacks
Operators safety, when microgrid stays energized during main grid outages
Assets protection: islanded mode requires special protection system
Compatibility: generation, distribution and loads have different specifications (voltage, AC or DC,…)
Protection
Re-synchronization
Out-of-phase reclosing: microgrid must synchronize with the main grid after islanding
Power quality: harmonic distortion, frequency and voltage regulation
Compatibility with main grid protection infrastructure
Direct Current
Technical challenges important to the development of an ideal microgrid, but not crucial for the core functions
Technical challenges that should be overcome by non-technical solutions: procedures, preventive measures, trainings…
Comprehensive control system: how to find an affordable system and able to manage generation, load, frequency and voltage
Controls
2
3
1
4
Selected challenges

44 URBAN MICROGRIDS
ENEA ADVISES AND SUPPORTS INDUSTRIAL AND INSTITUTIONAL ACTORS IN THE ENERGY SECTOR
The four selected challenges were thoroughly investigated to identify issues and solutions ranked according to their level of maturity, reliability and cost. Insights on this analysis are detailed in this section.
Other issues were not analyzed more thoroughly but are worthwhile to consider for further improvement in the microgrid field. Fast islanding detection and black-start capability contribute to further increasing the reliability of a microgrid thanks to very short delays between main grid fault and microgrid islanded operation. Another line of improvement is microgrid flexibility to avoid additional costs whenever a change is needed. These challenges are not crucial to the microgrid core functions.
Finally, some challenges should be solved by procedures and training rather than with technical solutions. Operators’ safety is a key challenge: they should be aware that a microgrid could still be energized even though the main grid is down. General security, especially cyber security, is a shared concern for resilient systems that are based on IT controls. These issues are not detailed in the present report but are of paramount importance to ensure the acceptability of microgrid development.
Controller prices can be reduced by limiting case-by-case customization
The more complex the microgrid, the more engineered the controller, which implies high costs and little flexibility. The commercial offer for controllers seems to be limited to customized design on a case-by-case basis; far from being a mature plug & play product, the logic embedded in these controllers might need to be developed after purchase [22, 23].
Protection of electrical assets might be an issue in specific topologies; it should then be ensured by advanced equipment
Microgrids with power electronics interfaces47 have lower short-circuit currents and lower system inertia in islanded mode than in grid-connected mode: if they are not managed properly, this could lead to general failure of the microgrid [24, 23, 25]. This issue is especially challenging for low voltage networks, a major component in residential microgrids. They are usually protected by multiple low-cost breakers or fuses, which are mechanical equipment that cannot be controlled and adapted to the islanding mode protection requirements. The most immediate solution to the protection issue is to upgrade low voltage network basic protection with advanced protection, which would represent an expensive makeover [24].
Re-synchronization of microgrids to main grid can be completed with very little impact on main grid
Reconnection of a microgrid to the main grid is well controlled with commercially available technology, with costs mainly dependent on end-user requirements, essentially reconnection time and limitation of transient overcurrents [26]. At the reclosing phase, microgrid energy sources transition from independent operation to grid-parallel operation. Unsynchronized paralleling of two generation sources can trigger current and voltage
47 For example PV, batteries or fuel cell inverters.
The CERTS plug-and-play control solution
CERTS, the Consortium for Electric Reliability Technology Solutions, has produced a flexible low-cost controller, already implemented at Santa Rita Jail and at multiple Tecogen’s sites. Generation assets coordinate without any supervisory controls or communication with each other. They follow the pre-set electrical values in grid-connected mode, and they operate in voltage droop mode during islanding1. Little extra cost is required for customization thanks to this plug-and-play technology. This technology also promises a more reliable microgrid: one generation asset can fail and the others can still operate [74, 24]

Main challenges and lessons learnt on urban microgrids 45
ENEA ADVISES AND SUPPORTS INDUSTRIAL AND INSTITUTIONAL ACTORS IN THE ENERGY SECTOR
transients that might damage microgrid and main grid assets. Several technologies are possible to ensure smooth reconnection 48[23, 22, 24, 26, 27, 28].
Direct Current microgrids are an opportunity for cost savings but are not widely known by stakeholders
Private networks with local generation represent a paradigm shift for electricity distribution that makes DC networks a cost saving opportunity. If the microgrid is powered by DC sources such as PV, fuel cells or batteries, a DC microgrid requires less expensive electrical equipment and implies fewer energy losses than an AC microgrid [26, 29, 30]. A DC microgrid does not have to be a complete replacement to the legacy AC network, and may only service a part of the load that is particularly amenable to DC power, such as server racks or lighting. However, AC historical prevalence in existing electric installations limits DC potential for local networks, and general unfamiliarity of end-users and suppliers has yet to be overcome [31].
6.4 Microgrid costs analysis
The technical challenges detailed in section §6.3 might be obstacles to microgrid development because of the technology-induced costs rather than the actual technical know-how. This section aims at specifying the additional costs entailed by the different systems implemented in the case studies (see section §Erreur ! Source du renvoi introuvable.). The implementation of a private network with generation or storage means induces additional investment for the assets that contribute to maintaining a good quality network. Infrastructure requires electrical protection, which grows with the number of assets and the complexity of the microgrid. The islanding feature of a microgrid requires reliant generation means such as a gas engine or storage, as well as some side costs such as the implementation of a controller, of a disconnect switch and power quality equipment. These costs are highly variable and depend on the type of generation assets, whether intermittent or not, and whether distributed or centralized. Figure 20 presents possible costs for a 870 kW microgrid with a 0.5 km2 surface and 330 customers, with distributed PV and battery systems as the only generation and storage means. Additional costs due to the microgrid status (i.e. the capacity to island) are based on conservative assumptions.
48 Open transition is also possible if smooth transition is not needed and power supply can be interrupted for a few
moments. Load is disconnected, microgrid generation is connected to the grid, then load is brought back online [28]. Seamless reconnection is highly important if grid disturbances are frequent and very short, like at Santa Rita Jail. However, if the microgrid is designed to survive one in a lifetime major grid outage, smooth reconnection might not be a priority for the microgrid designer.

46 URBAN MICROGRIDS
ENEA ADVISES AND SUPPORTS INDUSTRIAL AND INSTITUTIONAL ACTORS IN THE ENERGY SECTOR
Figure 20 – CAPEX breakdown of equipment needed in three different private network configurations, apart from generation and storage assets (Enea Consulting analysis based on [32, 33, 19, 34, 35, 36, 37])
Figure 21 focuses on the cost increase due to microgrid islanding. If the microgrid is not required to island, investment (other than generation means) is only needed for private network and smart grid equipment. When the microgrid is designed to be able to island, even for a limited amount of time, microgrid equipment is required. When only a small battery49 is needed, side costs then represent the major part of the extra investment.
49 Batteries are the most straight-forward solution for reliable islanding. Nevertheless, alternatives to batteries such
as load control, thermal storage, scheduling or fast responding thermal generation [26] have the potential to reduce the battery size, and the overall islanding cost.
-
500 000
1 000 000
1 500 000
2 000 000
Private network Smart Grid Microgrid
CAPEX (€)
Extra equipment for microgrid
Extra equipment for smart grid
Private network

Main challenges and lessons learnt on urban microgrids 47
ENEA ADVISES AND SUPPORTS INDUSTRIAL AND INSTITUTIONAL ACTORS IN THE ENERGY SECTOR
Figure 21 – CAPEX of equipment needed for the islanding function50 depending on the required islanding time (Enea Consulting analysis based on [32, 33, 19, 34, 35, 36, 37] for grid equipment and [38, 39, 40, 41, 42] for batteries)
Additional cost of infrastructure, hardware and software highly depends on the type of microgrid considered. It should be carefully estimated along with cost savings and other positive market externalities to arbitrate if a microgrid should be implemented.
50 Battery costs are estimated with 2013 to 2015 data, and do not reflect potential cost reduction forecast. Only the
initial CAPEX is taken into account. No replacement or operational costs are integrated into the total cost calculation.
-
1 000 000
2 000 000
3 000 000
4 000 000
5 000 000
6 000 000
7 000 000
Noislanding
1 2 4 6 12
Duration of islanding (hours)
CAPEX (€)
Battery inverter for a 11 kW/kWh system - maximum price
Battery Management System and Balance of System
Cells
Extra equipment for microgrid
Extra equipment for smart grid
Private network

48 URBAN MICROGRIDS
ENEA ADVISES AND SUPPORTS INDUSTRIAL AND INSTITUTIONAL ACTORS IN THE ENERGY SECTOR
7 LIST OF FIGURES Figure 1 – Classification of electricity consumer and/or producer clustering strategies ................................... 12
Figure 2 - General representation of a grid-connected microgrid ..................................................................... 13
Figure 3 - Drivers of an urban microgrid ............................................................................................................ 14
Figure 4 – Location of urban microgrid projects selected for the overview ...................................................... 15
Figure 5 – Embedded network case results ....................................................................................................... 18
Figure 6 – Optimization results for cost savings, sustainability and energy security drivers .............................. 19
Figure 7 – Results of sensitivity analysis on maximum power delivered by the grid .......................................... 20
Figure 8 – Relevant grid subscription choices with respect to non-deferrable load profile ............................... 21
Figure 9 - Comparison of grid-only scenario with local generation scenarios (local generation only, use of vehicle-to-grid system, and use of a grid-scale battery) ................................................................................... 23
Figure 10 - Costs savings drivers for the airport as a smart embedded network (excluding networks costs) .... 24
Figure 11 - Microgrid islanding (excluding networks costs) ............................................................................... 25
Figure 12 - Optimization results for cost savings, sustainability and energy security drivers (excluding network costs).................................................................................................................................................................. 26
Figure 13 – Trigeneration case: Evolution of NPC with electricity and gas prices (excluding network costs) .... 28
Figure 14 – Stakeholders in a microgrid ecosystem ........................................................................................... 37
Figure 15 – Analysis matrix for business model screening ................................................................................. 39
Figure 16 – Relevant business models adopted and possible variations ........................................................... 40
Figure 17 – Business models and drivers of urban microgrids ........................................................................... 41
Figure 18 – Microgrid growth potential and ease of implementation ............................................................... 42
Figure 19 - Challenges or opportunities for microgrid technical design and operation ..................................... 43
Figure 20 – CAPEX breakdown of equipment needed in three different private network configurations, apart from generation and storage assets (Enea Consulting analysis based on [32, 33, 19, 34, 35, 36, 37]) .............. 46
Figure 21 – CAPEX of equipment needed for the islanding function depending on the required islanding time (Enea Consulting analysis based on [32, 33, 19, 34, 35, 36, 37] for grid equipment and [38, 39, 40, 41, 42] for batteries) ........................................................................................................................................................... 47

<Bibliography 49
ENEA ADVISES AND SUPPORTS INDUSTRIAL AND INSTITUTIONAL ACTORS IN THE ENERGY SECTOR
8 BIBLIOGRAPHY
[1] IRENA, “Renewables-based minigrids: status and challenges,” 2015.
[2] European Commission, “European SmartGrids Technology Platform,” 2006.
[3] U.S. Department of Energy, “DoE Microgrids Program Overview,” 2015.
[4] Mike Munsell, GreenTechMedia, “Cumulative US Microgrid Investments Will Surpass $3.5 Billion From 2015‐2020,” 2016.
[5] Rocky Mountain Institute, "The economics of battery energy storage," 2015.
[6] Confidential, Interviewee, [Interview]. 2016.
[7] J. O. TURPE4.
[8] C. c. d. p. 2014, "Rapport sur la contribution au service public de l'électricité (CSPE) : mécanisme, historique et prospective".
[9] Y. Solar. [Online]. Available: http://www.yinglisolar.com/fr/products/multicrystalline/yge-185/.
[10] EPEX SPOT, [Online]. Available: https://www.epexspot.com/en/market-data.
[11] B. &. M. Public Utilities Forthnightly, "Peaceful Coexistence: Independent microgrids are coming. Will franchised utilities fight them or foster them?," 2013.
[12] F. E. R. commission, "What is a Qualifying Facility?," 2016. [Online]. Available: https://www.ferc.gov/industries/electric/gen-info/qual-fac/what-is.asp.
[13] E. a. Council, "Directive 2009/72/EC concerning common rules for the internal market in electricity and repealing Directive 2003/54/EC," 2009.
[14] European Parliamant and the Council, Directive 2003/54/EC concerning common rules for the internal market in electricity and repealing Directive 96/92/EC, 2003.
[15] C. o. E. E. R. (CEER), “Memo on the transposition of unbundling requirements forTransmission, Distribution and Closed Distribution Systems Operators,” 2014.

50 URBAN MICROGRIDS
ENEA ADVISES AND SUPPORTS INDUSTRIAL AND INSTITUTIONAL ACTORS IN THE ENERGY SECTOR
[16] C. o. E. E. Regulators, "Memo on the transposition of unbundling requirements forTransmission, Distribution and Closed Distribution Systems Operators," 2014.
[17] E-Cube, "Le TURPE sera-t-il un levier pour développer les Smart Grids en France?," 2012.
[18] Office franco-allemand pour les énergies renouvelables, "L’autoconsommation et la livraison directe - Schémas de valorisation photovoltaïque en Allemagne et en France," 2016.
[19] DNV Kema, "Microgrids – Benefits, Models, Barriers and Suggested Policy Initiatives for the Commonwealth of Massachusetts," 2014.
[20] Navigant Research, "Emerging Microgrid Business Models," 2016.
[21] A. Banner, Interviewee, Techncial Director, Omexom. [Interview]. 2016.
[22] C. Moreira, Interviewee, INESC Porto. [Interview]. 2016.
[23] J. Jimeno and J. Oyarzabal, Interviewees, Tecnalia. [Interview].
[24] R. Lasseter, Interviewee, Emertius Professor at University of Wisconsin. [Interview].
[25] G. Buigues, "Microgrid Protection: Technical challenges and existing techniques," Faculty of Engineering of Bilbao, 2013.
[26] C. Marnay, Interviewee, Retired Staff Scientist (China Energy Group). [Interview].
[27] NREL & Encorp, "Micorgrid Switch Technology - DOE Microgrid Workshop Session 1," 2011.
[28] University of Texas, Austin, "Grid-Microgrids Interconnection," 2012.
[29] G. Brock, A. Inês and H. Chris, "How much electricity can we save by using direct current circuits in homes?," Department of Engineering and Public Policy, Carnegie Mellon University.
[30] D. Fregosi, "A Comparative Study of DC and AC Microgrids in Commercial buildings across different climates and operating profiles," 2015.
[31] B. R. Blasi, "DC microgrids: review and applications," 2013.
[32] Walker Industrial, "ABB Emax circuit breakers," Walker Industrial, 2016. [Online]. Available: http://www.walkerindustrial.com/ABB-Emax-Circuit-Breakers-s/9216.htm.

<Bibliography 51
ENEA ADVISES AND SUPPORTS INDUSTRIAL AND INSTITUTIONAL ACTORS IN THE ENERGY SECTOR
[33] ESB Networks, "ESB Networks Designated Activity Company Statement of Charges," 2016.
[34] B. P. B. R. C. S. D. S. J.-P. S. M. Z. T. Droste-Franke, "Balancing Renewable Electricity. Energy Storage, Demand Side Management, and Network Extension from an Interdisciplinary Perspective," 2013.
[35] H. Joshi, "Residential, Commercial and Industrial Electrical Systems: network and installation," 2008.
[36] Electric Power Research Institute, "Estimating the Costs and Benefits of the Smart Grid," 2011.
[37] Metering & Smart Energy International, "Smart meters 101: France’s Linky electricity meters," Metering & Smart Energy International, 2015. [Online]. Available: https://www.metering.com/features/smart-meters-101-frances-linky-electricity-meters/.
[38] S. Vorrath, "Energy Storage Could Reach Big Breakthrough Price Within 5 Years," Clean Technica, 2015. [Online]. Available: https://cleantechnica.com/2015/03/04/energy-storage-could-reach-cost-holy-grail-within-5-years/.
[39] PSE IRP, "Appendix L: Electric Energy Storage," 2015.
[40] S. Wilkinson, Interviewee, IHS Technology senior research manager. [Interview]. 2016.
[41] WholeSale Solar, "Magnum Energy RD3924 Inverter," [Online]. Available: http://www.wholesalesolar.com/2939240/magnum-energy/inverters/magnum-energy-rd3924-inverter.
[42] Element Energy, "Cost and performance of EV batteries - Final report for the Comittee on Climate Change," 2012.
[43] ADEME, “Un mix électrique 100% renouvelable ? Analyses et optimisation.,” 2015.
[44] Artelys, ENEA Consulting, G2Elab, “Etude sur le potentiel de stockage d'énergies,” 2015.
[45] M. Götz et al., “Renewable power-to-gas: a technological and economic review,” Renewable Energy, 2015.
[46] NREL, “Cost and performance data power generation technologies,” 2012.
[47] IEA Greenhouse Gas, “Oxy-Combustion Turbine Power Plants,” 2015.
[48] RTE, “Données de réalisation de production 2015,” 2015.
[49] IEA, “Techno-economic assessment of oxy-combustion turbine power plants with CO2 capture,” in 5th Oxy-combustion Network Meeting, Wuhan, China, 2015.
52 URBAN MICROGRIDS
ENEA ADVISES AND SUPPORTS INDUSTRIAL AND INSTITUTIONAL ACTORS IN THE ENERGY SECTOR
[50] Agence Nationale de la Recherche, “Massive and reversible underground storage of FLUIDS for energy STOrage and recoveRY, Appel à projets générique 2015,” 2016.
[51] Enea, “The potential of power-to-gas,” 2015.
[52] CoRDiS, “Décision du CoRDiS de la CRE en date du 6 mai 2015 sur le différend qui oppose la société Valsophia et la société Électricité Réseau Distribution France (ERDF) relatif aux conditions de raccordement d’un projet immobilier”.
[53] CEER, “Status Review on the Transposition of Unbundling Requirements for DSOs Unbundling Requirements for DSOs Operators,” 2013.
[54] S. E. I. Association, “Solar Power Purchase Agreements (PPAs) - fact sheet,” 2012.
[55] California Energy Commission, ICF, "Combined Heat and Power: 2011-2030 Market Assessment," 2012.
[56] "EnergiePlus," [Online]. Available: http://www.energieplus-lesite.be/index.php?id=19153.
[57] "Connaissance des énergies," 2011. [Online]. Available: http://www.connaissancedesenergies.org/qu-est-ce-que-la-cogeneration.
[58] M. France, "Le changement climatique en Bretagne," 2012. [Online].
[59] San Diego Gas & Electric, "Dynamic load profile," no. http://www.sdge.com/customer-choice/customer-choice/dynamic-load-profiles.
[60] Energy Information Administration, "Household Energy Use in California," 2009.
[61] San Diego Gas & Electric, "Current and effective tariffs - Electric tariff book," 2016. [Online]. Available: http://www.sdge.com/rates-regulations/current-and-effective-tariffs/current-and-effective-tariffs.
[62] RTE, "Consumption Archives - Record of power consumption," 2015. [Online]. Available: http://clients.rte-france.com/lang/an/visiteurs/vie/vie_stats_conso_inst.jsp. [Accessed 2016].
[63] Commission de Régulation de l’Energie, "Analyse du marché de détail de l’électricité - Troisième semestre 2015," 2015.
[64] NASA, Atmospheric Science for Data Center, "Surface meteorology and Solar Energy," 2016. [Online]. Available: https://eosweb.larc.nasa.gov/cgi-bin/sse/[email protected]+s03#s03.
[65] JRC European Commission, CM SAF, "Photovoltaïc Geographical Information System (PVGis) - Interactive Map," 2016. [Online].

<Bibliography 53
ENEA ADVISES AND SUPPORTS INDUSTRIAL AND INSTITUTIONAL ACTORS IN THE ENERGY SECTOR
[66] United States Census Bureau, "Median and Average Square Feet of Floor Area in New Single-Family Houses Completed by Location," 2010.
[67] INSEE, "Les conditions de logement fin 2013," 2015.
[68] W. L.K., N. H. T. and P. J.M., "Quantifying Rooftop Solar Photovoltaic Potential for Regional Renewable Energy Policy," 2010.
[69] Mitsubishi, "MJU Specification Sheet 240W - Mitsubishi Electric," [Online]. Available: http://www.mitsubishielectricsolar.com/images/uploads/documents/specs/MJU_spec_sheet_240W.pdf.
[70] D. Chung, C. Davidson, R. Fu, K. Ardani and R. Margolis, "U.S. Photovoltaic Prices and Cost Breakdowns: Q1 2015 Benchmarks for Residential, Commercial, and Utility-Scale Systems," National Renewable Energy Laboratory, 2015.
[71] GTM Research, "U.S. Solar PV Price Brief H1 2016," 2016.
[72] National Renewable Energy Laboratory, "Distributed Generation Renewable Energy Estimate of Costs," 2016.
[73] Commission de régulation de l'énergie , "Délibération de la Commission de régulation de l’énergie du 3 avril 2013 portant décision relative aux tarifs d’utilisation d’un réseau public d’électricité dans le domaine de tension HTB," 2013.
[74] P. Asmus, "Plug-and-Play Microgrids, Here and Now," Navigant Research, 2016. [Online].
[75] Kansas State University, "Campus Primary Electrical Distribution System," 2013.
[76] Better Buildings, US Department of Energy, "Data Center Metering and Resource Guide," 2016.
[77] European Parliamant and the Council, "Directive 2009/72/EC concerning common rules for the internal market in electricity and repealing Directive 2003/54/EC," 2009.
[78] M. Ilic, F. Galiana and L.Fink, Power Systems Restructuring, 1998.
[79] J. O. 2013.
[80] CRE, "Communiqué de Presse - Rapport sur la contribution au service public de l'électricité (CSPE) : mécanisme, historique et prospective," 2014.
[81] H. Energy.

54 URBAN MICROGRIDS
ENEA ADVISES AND SUPPORTS INDUSTRIAL AND INSTITUTIONAL ACTORS IN THE ENERGY SECTOR
[82] IRENA, "Cost Reduction Potential for Solar and Wind to 2025".
[83] OANDA, 2016. [Online].
[84] J. Officiel, "TURPE 4," [Online].
[85] Renault. [Online]. Available: https://www.renault.fr/vehicules/vehicules-electriques/zoe.html.
[86] E. Spot, "2016," [Online].
[87] French Energy Code, "Article L111-58".
[88] Legifrance, "Arrêté du 23 avril 2008 relatif aux prescriptions techniques de conception et de fonctionnement pour le raccordement au réseau public de transport d'électricité d'une installation de production d'énergie électrique".

<Bibliography 55
ENEA ADVISES AND SUPPORTS INDUSTRIAL AND INSTITUTIONAL ACTORS IN THE ENERGY SECTOR
Strategy ● Innovation and technology ● Project Structuring and Development
ENEA advises and supports industrial and institutional actors in the energy sector
Energy companies | Industrial companies | Start-ups | Investors | Engineering firms | OEMs and Research Centres | Public Authorities
89, rue Réaumur, 75002 Paris +33 (0) 1 82 83 83 83
www.enea-consulting.com