Urban malnutrition: a review of food security and ... Workds... · Urban malnutrition: a review of...
56
Urban malnutrition: a review of food security and nutrition among the urban poor Source: Laura Phelps. Makuru Slums, Nairobi, 2012 Lili Mohiddin, Laura Phelps and Tamsin Walters 8 October 2012 www.nutritionworks.org.uk [email protected]
Transcript of Urban malnutrition: a review of food security and ... Workds... · Urban malnutrition: a review of...
Urban malnutrition: a review of food security and nutrition among the urban poor
Source: Laura Phelps. Makuru Slums, Nairobi, 2012
Lili Mohiddin, Laura Phelps and Tamsin Walters 8 October 2012 www.nutritionworks.org.uk [email protected]
ii
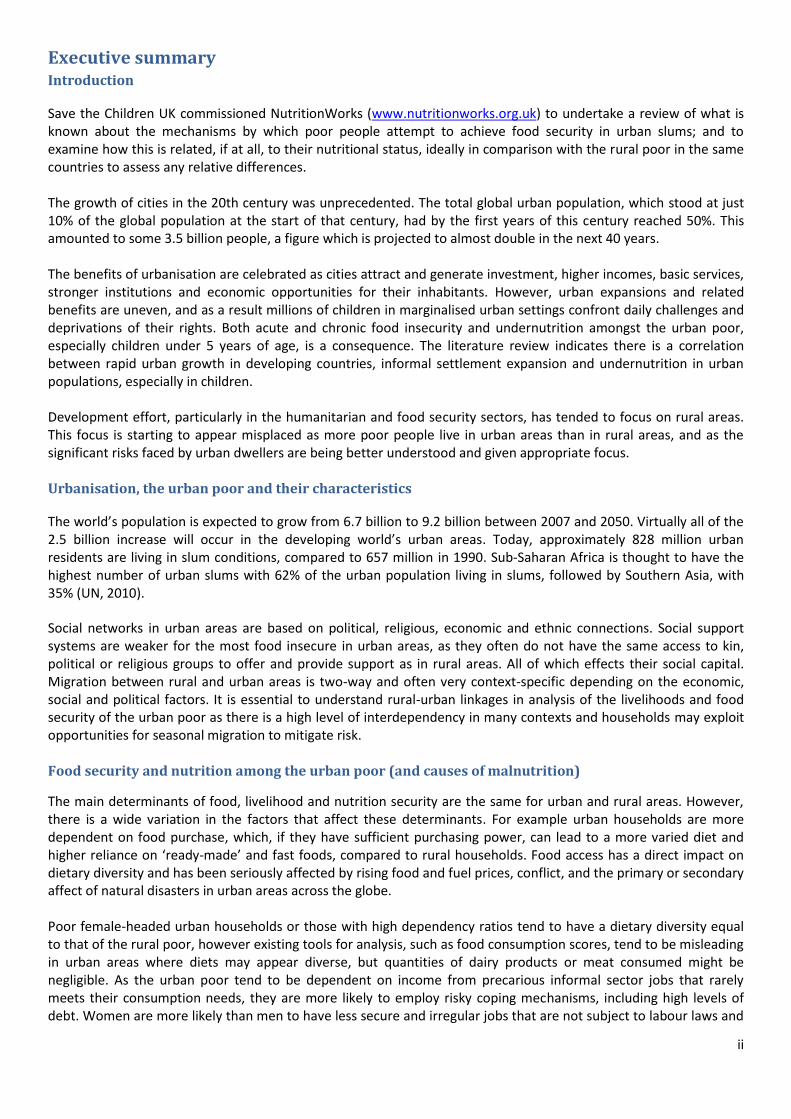
Executive summary Introduction
Save the Children UK commissioned NutritionWorks (www.nutritionworks.org.uk) to undertake a review of what is known about the mechanisms by which poor people attempt to achieve food security in urban slums; and to examine how this is related, if at all, to their nutritional status, ideally in comparison with the rural poor in the same countries to assess any relative differences. The growth of cities in the 20th century was unprecedented. The total global urban population, which stood at just 10% of the global population at the start of that century, had by the first years of this century reached 50%. This amounted to some 3.5 billion people, a figure which is projected to almost double in the next 40 years. The benefits of urbanisation are celebrated as cities attract and generate investment, higher incomes, basic services, stronger institutions and economic opportunities for their inhabitants. However, urban expansions and related benefits are uneven, and as a result millions of children in marginalised urban settings confront daily challenges and deprivations of their rights. Both acute and chronic food insecurity and undernutrition amongst the urban poor, especially children under 5 years of age, is a consequence. The literature review indicates there is a correlation between rapid urban growth in developing countries, informal settlement expansion and undernutrition in urban populations, especially in children. Development effort, particularly in the humanitarian and food security sectors, has tended to focus on rural areas. This focus is starting to appear misplaced as more poor people live in urban areas than in rural areas, and as the significant risks faced by urban dwellers are being better understood and given appropriate focus. Urbanisation, the urban poor and their characteristics
The world’s population is expected to grow from 6.7 billion to 9.2 billion between 2007 and 2050. Virtually all of the 2.5 billion increase will occur in the developing world’s urban areas. Today, approximately 828 million urban residents are living in slum conditions, compared to 657 million in 1990. Sub-Saharan Africa is thought to have the highest number of urban slums with 62% of the urban population living in slums, followed by Southern Asia, with 35% (UN, 2010). Social networks in urban areas are based on political, religious, economic and ethnic connections. Social support systems are weaker for the most food insecure in urban areas, as they often do not have the same access to kin, political or religious groups to offer and provide support as in rural areas. All of which effects their social capital. Migration between rural and urban areas is two-way and often very context-specific depending on the economic, social and political factors. It is essential to understand rural-urban linkages in analysis of the livelihoods and food security of the urban poor as there is a high level of interdependency in many contexts and households may exploit opportunities for seasonal migration to mitigate risk. Food security and nutrition among the urban poor (and causes of malnutrition)
The main determinants of food, livelihood and nutrition security are the same for urban and rural areas. However, there is a wide variation in the factors that affect these determinants. For example urban households are more dependent on food purchase, which, if they have sufficient purchasing power, can lead to a more varied diet and higher reliance on ‘ready-made’ and fast foods, compared to rural households. Food access has a direct impact on dietary diversity and has been seriously affected by rising food and fuel prices, conflict, and the primary or secondary affect of natural disasters in urban areas across the globe. Poor female-headed urban households or those with high dependency ratios tend to have a dietary diversity equal to that of the rural poor, however existing tools for analysis, such as food consumption scores, tend to be misleading in urban areas where diets may appear diverse, but quantities of dairy products or meat consumed might be negligible. As the urban poor tend to be dependent on income from precarious informal sector jobs that rarely meets their consumption needs, they are more likely to employ risky coping mechanisms, including high levels of debt. Women are more likely than men to have less secure and irregular jobs that are not subject to labour laws and
iii
do not offer social or medical benefits. This affects breastfeeding, infant feeding and child care practices, especially for those without family support who must adapt their work patterns or use poor quality childcare. Environmental issues (e.g., over-crowding, poor water and sanitation, pollution, open sewerage and contamination) are most acute in cities and exacerbated in slums. They have a significant impact on child and household health. Where urban data has been disaggregated by wealth group or studies have focused on the urban poor, high rates of undernutrition (both acute and chronic malnutrition) have been recorded for children under-5 years of age, which are comparable with, or higher than, the rates in rural under-5s. Data that exists for urban poor women reveals high rates of undernutrition combined with rising levels of overweight or obesity in some cases, reflecting the ‘double burden of malnutrition’. Case studies from Bangladesh and Kenya are elaborated within this review to illustrate these key points. Urban food security and nutrition programming
Significant challenges are faced in urban food security and nutrition programming (by government, UN and (I)NGOs), beginning with assessment and targeting issues when faced with a highly mobile, densely packed population, where in- and out-migration is a constant feature. Although urban areas have traditionally been considered better served in terms of healthcare, education and sanitation, a closer look at the evidence reveals that proximity does not equate to access. Both cost of services and urban livelihood strategies, including long journeys to places of work and long working hours, limit access by the urban poor to healthcare, community nutrition services or improved water sources. Programmes have struggled to transplant rural approaches into the urban arena and are increasingly learning that there is a need to adapt, work with existing networks, organisations and systems, and conduct a thorough context-specific analysis prior to intervening. Social protection and cash transfer programmes are promising approaches in urban areas, with evidence to suggest that they improve dietary diversity, but as yet there remains a lack of evidence of their impact on the nutritional status of children under 5 years of age. The evidence clearly points to the need for multisectoral, integrated programming and an enhanced role for coordination between actors. Conclusion
The urban poor living in informal settlements and slums face a unique set of challenges compared to their rural counterparts. Almost exclusively dependent on the market for food and other necessary items, slum dwellers are very vulnerable to price increases and other market shocks. The population density of slums, in combination with poor sanitation and limited access to clean water, also translates into high transmission risk for communicable diseases. Despite the urban poor increasing in proportion to the overall population there is little disaggregated data,
available between both rural and urban contexts, and between slums / non-slums. Although this is changing with new research focusing on slum dwellers, the body of knowledge on basic indicators, particularly health, food security and nutrition, is still limited. It is clear that urban-specific skills are needed in a number of areas, including analysis (especially related to gender roles), governance, and programme design within (I)NGOs, Governments, UN, the private sector and donors.
iv
Clear findings of this review include:
1. Analysis of nutrition, food security, governance and gender is needed, along with baseline data collection in both established and emerging slums
2. The socio-economic, nutrition and food security status of poor urban households may vary considerably between and within urban areas and also between countries and continents
3. Urban areas are more complex than rural areas, at every level from governance to nutrition and food security assessments, requiring strong urban platforms and coordination at all levels
4. There is a need to work more closely to improve the capacity of governments and national actors, as well as developing clearer ways of working with the private sector for service delivery and programme scale up
5. Early warning systems and Integrated Phase Classification (IPC) need revisiting to ensure their appropriateness in defining and highlighting urban emergencies especially in protracted crisis and slow onset emergencies
6. More operational research, on urban programmes and policy interventions is required to better understand urban contexts (both megacities and emerging urban slums), and how they differ, as well as evaluating the impact of adapted models applied from rural contexts
7. Resources are needed to support the development of best practice targeting methodologies for urban areas 8. Clear urban strategies are required by governments, UN, and (I)NGOs and these should influence the
emerging thoughts of donors on the development of comprehensive urban funding strategies 9. Dedicated urban-specific skills are needed both sectorally and in terms of analysis and coordination, but also
in typically weaker areas such as good governance and land tenure 10. Cash transfer programming and social protection are effective mechanisms for meeting both immediate and
longer term food security objectives, and promising in terms of meeting nutrition objectives, in urban programme and policy work.
Table of Contents Executive summary ........................................................................................................................................................... ii
List of Figures ................................................................................................................................................................ 2
List of Tables ................................................................................................................................................................. 2
List of Boxes .................................................................................................................................................................. 2
List of Annexes .............................................................................................................................................................. 2
Definitions and Acronyms used ........................................................................................................................................ 3
Introduction ...................................................................................................................................................................... 5
Objective of the study and methodology used ................................................................................................................. 9
Limitations of the review .............................................................................................................................................. 9
Part 1: Urbanisation, the urban poor and their characteristics ...................................................................................... 11
Global growth in urbanisation .................................................................................................................................... 11
Regional growth in urbanisation and slums................................................................................................................ 11
Social networks ........................................................................................................................................................... 12
Rural – Urban Linkages and Migration ........................................................................................................................ 12
Achieving the Millennium Development Goals (MDGs) in urban populations ........................................................... 15
The three Transitions: Demographic, Epidemiological and Nutritional...................................................................... 17
Part 2: Food Security and Nutrition among the urban poor and causes of malnutrition ............................................... 19
Factors affecting urban food security and nutrition ................................................................................................... 19
Food availability, consumption and access ............................................................................................................. 19
Employment and the labour market ....................................................................................................................... 21
Property issues ........................................................................................................................................................ 23
Public health and sanitation ................................................................................................................................... 24
Care practices and infant and young child feeding (IYCF) ...................................................................................... 25
Socioeconomic influences ....................................................................................................................................... 26
Nutritional status of poor urban children under 5 years of age ................................................................................. 29
Part 3: Comparing urban and rural poor nutrition in focus countries ............................................................................ 32
Case study: Bangladesh ............................................................................................................................................... 32
Case Study: Kenya ....................................................................................................................................................... 33
Part 4: Urban food security and nutrition programming ................................................................................................ 35
Should humanitarian programme approaches differ from development ones? Are rural programmes very different
to urban ones? ............................................................................................................................................................ 35
Humanitarian responses in urban areas: is there capacity and what are the next steps? ......................................... 36
Urban food security and nutrition orientated programmes implemented to date ................................................... 37
Slum/ Urban poor programmes funded by The World Bank .................................................................................. 37
Social protection systems ....................................................................................................................................... 38
2
Urban and peri-urban agriculture (UPA) ................................................................................................................. 42
Childcare support programmes .............................................................................................................................. 43
An example from India – what works? ................................................................................................................... 43
Working with existing systems and services in urban areas ....................................................................................... 44
Challenges faced: (1) Targeting ................................................................................................................................... 44
Identifying vulnerable groups in an urban setting .................................................................................................. 45
Challenges faced: (2) Analysis ..................................................................................................................................... 45
Summary and conclusions .............................................................................................................................................. 47
References: ..................................................................................................................................................................... 50
List of Figures Figure 1: The world’s rural versus urban dwellers. ..................................................................................................... 7
Figure 2: Population living in urban slums and proportion of urban population living in slums .................................... 11
Figure 3: Patterns of the nutrition transition, nutrition-related non-communicable disease, and maternal and child
health .............................................................................................................................................................................. 18
Figure 4: Rural and urban consumption expenditure comparisons in Kenya in Kenyan shillings .................................. 20
Figure 5: Comparison of undernutrition in Dhaka slum, total urban and rural areas of Bangladesh in 1999................ 30
List of Tables Table 1: Summary of MDGs from an urban perspective ................................................................................................ 16
List of Boxes Box 1: An example from urban Niger .............................................................................................................................. 15
Box 2: Case-study: Food security impact on nutritional status and associated factors in urban Myanmar .................. 23
Box 3: Infant and Young Child Feeding practices and working mothers in urban Myanmar ......................................... 26
Box 4: HEA analysis of urban poor expenditure in Djibouti ............................................................................................ 27
Box 5: What is an urban disaster and how is it distinctive from the rural? .................................................................... 36
Box 6: Mexico’s Oportunidades program (previously known as Progresa) .................................................................... 40
List of Annexes Annex 1: Deprivations associated with urban poverty and their immediate external causes Annex 2: Tangible differences in programming for different environments Annex 3: Socio-economic differentials in household dietary diversity, comparing differences between the lowest and highest quintiles in urban and rural households Annex 4: Case studies: Bangladesh and Kenya Annex 5: World Bank Urban health and nutrition programme – an example of challenges in urban programming
3
Definitions and Acronyms used
A note on terminology: ‘Areas or settlements with low-quality housing are often termed “slums”, erroneously
implying that they have little worth....the term also conceals the considerable range of shelter construction, land
tenure and ownership arrangements in such settlements’ (Sverdlik, 2011). Alternatively the term “informal
settlement” is used in the literature; however, this term does not capture all low-quality housing (for example,
legally-constructed tenements). In this review, we have used the term “slum” to capture the broadest category.
For the purposes of this report undernutrition is used to denote deficiencies in macronutrients and/or micronutrients and encompasses stunting, wasting and micronutrient deficiencies. A combination of all forms of undernutrition as well as overweight or obesity is referred to using the generic term malnutrition. The terms acute malnutrition and chronic malnutrition are also used to refer to those specific conditions.
Acronym
ACF Action Contre La Faim (Action Against Hunger)
ALNAP Active Learning Network for Accountability and Performance
ANC Ante-natal Clinic
APHRC African Population and Health Research Centre
ARI Acute Respiratory Infection
ARV Anti-retroviral
BMI Body Mass Index
CaLP Cash Learning Partnership
CCT Conditional Cash Transfer
CED Chronic Energy Deficiency
CFS UN Committee on World Food Security
CFSVA Comprehensive Food Security and Vulnerability Analysis
CHF Cooperative Housing Foundation
CMAM Community-based management of acute malnutrition
CNP Community Nutrition Project
COG Core Operational Group
DEC Disaster Emergency Committee
DHS Department of Health Statistics
DFID Department for International Development
EBF Exclusive Breastfeeding
Slums (UNHABITAT) lack one or more of the following:
Access to improved water: Adequate quantities of water that is affordable and available without excessive
physical effort and time
Access to improved sanitation: Access to an excreta disposal system, in the form of a private or public
toilet, shared with a reasonable number of people
Security of tenure: Evidence of documentation that can be used as proof of secure tenure status, or for
protection from forced evictions
Durability of housing: Permanent and adequate structure in a non-hazardous location, protecting its
inhabitants from the extremes of climatic conditions such as rain, heat, cold or humidity
Sufficient living area: Not more than three people sharing the same room.
4
FCS Food Consumption Score
FAO Food and Agriculture Organisation of the United Nations
FEWSNET Famine and Early Warning Network
FS Food Security. Food security exists when, “all people, at all times, have physical, social and economic access to sufficient, safe and nutritious food, which meets their dietary needs and food preferences for an active and healthy life” (FAO, 2003).
GAM Global Acute Malnutrition
GDP Gross Domestic Product
GoK Government of Kenya
HDDS Household Dietary Diversity Score
HEA Household Economy Approach
HKI Helen Keller International
HLTA Hlaingthayar township
IASC Inter-agency Standing Committee
ICDDR’B International Centre for Diarrhoeal Disease Research, Bangladesh
IDP Internally Displaced Person
IFPRI International Food Policy Research Institute
IGA Income Generating Activity
ILO International Labour Organisation
(I)NGO (International)Non Government Organisation
IPC Integrated Phase Classification for food security
IYCF Infant Young Child Feeding
KCEP Kibera Community Empowerment Project
KDHS Kenya Demographic and Health Survey
KFSSG Kenya Food Security Steering Group
LBW Low Birth Weight
MOH&FW Ministry of Health and Family Welfare
MDG Millennium Development Goals
MICS Multi-Indicator Cluster Study
MSF Médecins Sans Frontières (Doctors Without Borders)
NGO Non-governmental organisation
NSP Nutrition Surveillance Project
ODI Overseas Development Institute
OVC Orphans and Vulnerable Children
RUAF Resource Centres on Urban Agriculture and Food Security
SAM Severe Acute Malnutrition
SCiM Save the Children in Myanmar
SHOUHARDO Strengthening Household Ability to Respond to Development Opportunities
SSA Sub-saharan Africa
TBA Traditional Birth Attendant
UNHABITAT UN Agency For Human Settlements Providing Adequate Shelter For All
UNICEF United Nations Children’s Fund
UNSCN United Nations Standing Committee on Nutrition
UHS Urban Health Survey
UPA Urban and Peri-urban Agriculture
USAID United States of America Office for International Development
WASH Water, Sanitation & Hygiene
WFP World Food Programme

5
Introduction
Source: Laura Phelps. ‘Flying Toilet’ Makuru Slums, Nairobi, 2012
Every month, the global urban population grows by 5 million people, and every day more than 100,000 people move
to slums in the developing world – that’s one person every second. Slums are estimated to grow by 25 million people
per year and this is projected to double by 2030.
By 2050 around 70% of the world’s population will live in cities. Sub-Saharan Africa (SSA) is the fastest urbanising
region with the highest proportion of slum dwellers (72% of the urban population of SSA); whereas Asia is the region
which will host the highest quantity of new urban dwellers (from 1.36 billion to 2.64 billion by 2030).
Source: (UNHABITAT, 2009)
The benefits of urbanisation are celebrated as cities attract and generate investment, higher incomes, basic services, stronger institutions and economic opportunities for their inhabitants. However, urban expansions and related benefits are uneven, and as a result millions of children in marginalized urban settings confront daily challenges and deprivations of their rights (UNICEF, 2012), (WB, 2010), (UNHABITAT, 2006). Both acute and chronic food insecurity and malnutrition amongst the urban poor, especially children under 5 years of age, is a consequence. With the majority of the world’s population now living in urban areas, the magnitude of this problem is being realised by NGOs, governments and donors. This is leading to policy development, research and analysis by NGOs and think tanks on the topic (Pantuliano et al., 2012). Online communities of practice and discussion groups focussing on urban issues have grown in number as the urban challenge takes root and attention is being paid to finding realistic and sustainable programme and policy solutions. Urban working groups and committees are being established, research bodies and think tanks such as ODI and ALNAP are bringing governments, policy makers, multi- and bi-lateral donors and NGOs together and dedicating resources to better understand urban environments, share lessons learned and explore ideas. UNHABITAT has launched a number of programmes such as The Urban Observatory1 and the Participatory Slum Upgrading Programme2. The World Bank and its partners are ‘committed to
1 The Observatory is an online database of urban indicators per country http://ww2.unhabitat.org/programmes/guo/
6
promoting sustainable cities and towns that fulfil the promise of development for their inhabitants - in particular, by improving the lives of the poor and promoting equity - while contributing to the progress of the country as a whole’3.
Although around 70% (FAO estimate) of the world’s poor still live in rural areas, this is rapidly changing (see Figure 1) and as it does, the face of poverty is shifting from being rurally orientated to one that is urban (Cohen and Garrett, 2010). It is estimated that by 2020 ‘85% of the poor in Latin America and about 40-45% of the poor in Africa and Asia will be concentrated in towns and cities’ (UNSCN, 2012). In 2002, approximately 33% of people living in urban areas in developing countries were below the poverty line of $2/day, and 13% were living on less than $1/day (UNSCN, 2012). This is likely an underestimation of urban poverty as cut-offs ($1/day or $2/per day) created to describe rural poverty are contested due to the significantly higher living costs incurred and necessity of cash income in urban areas (Mitlin and Satterthwaite, 2012). In conjunction with slum expansion, the past 10 – 15 years have seen a number of interrelated global, regional and local phenomena which have brought urban issues to the forefront of government, agency and donor agendas. These include: (a) the financial, fuel and food prices crisis, (b) climate change and the increase in natural disasters, the numbers of people affected by those disasters4 and the cost of the disasters5 (Brown, 2012), (c), increasingly strong urban migration pull factors and rural push factors, and (d) political complexity and contexts of ‘increasingly restrictive national asylum and migration policies…. chronic underdevelopment… and the increased local, national, and even international security threats originating in many slum areas’ (Pantuliano et al., 2012) that results in displacement and violence.
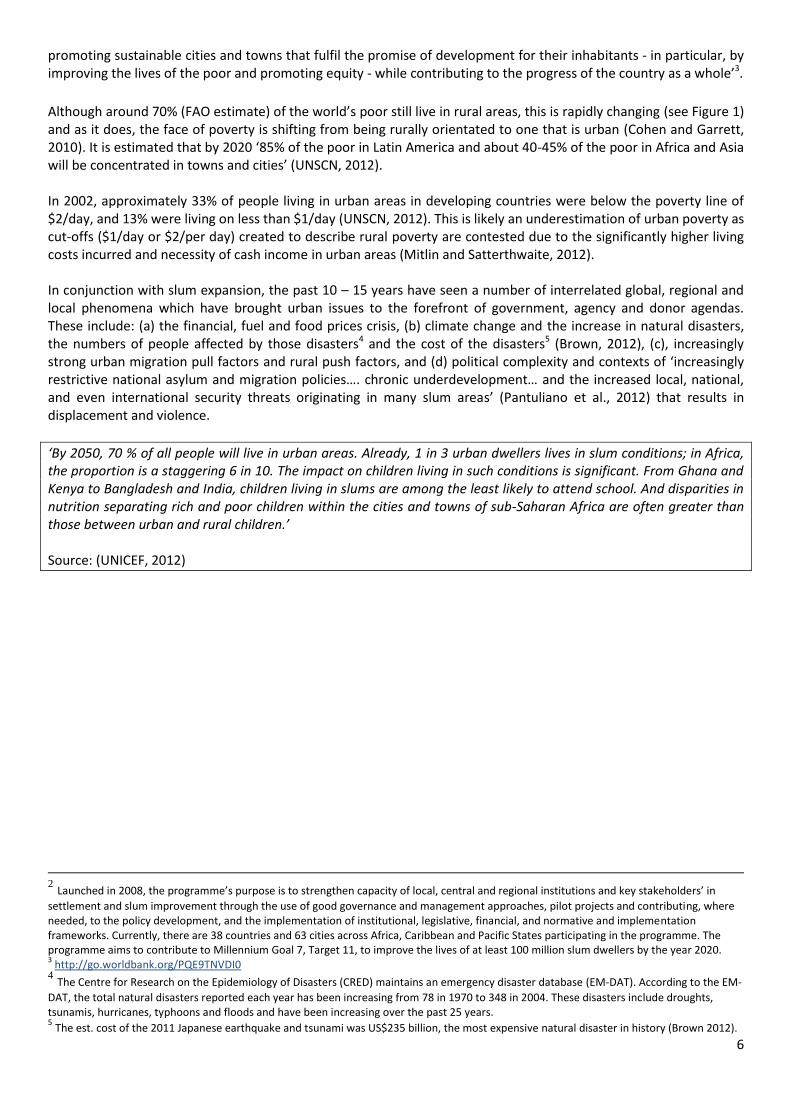
‘By 2050, 70 % of all people will live in urban areas. Already, 1 in 3 urban dwellers lives in slum conditions; in Africa, the proportion is a staggering 6 in 10. The impact on children living in such conditions is significant. From Ghana and Kenya to Bangladesh and India, children living in slums are among the least likely to attend school. And disparities in nutrition separating rich and poor children within the cities and towns of sub-Saharan Africa are often greater than those between urban and rural children.’ Source: (UNICEF, 2012)
2 Launched in 2008, the programme’s purpose is to strengthen capacity of local, central and regional institutions and key stakeholders’ in
settlement and slum improvement through the use of good governance and management approaches, pilot projects and contributing, where needed, to the policy development, and the implementation of institutional, legislative, financial, and normative and implementation frameworks. Currently, there are 38 countries and 63 cities across Africa, Caribbean and Pacific States participating in the programme. The programme aims to contribute to Millennium Goal 7, Target 11, to improve the lives of at least 100 million slum dwellers by the year 2020. 3 http://go.worldbank.org/PQE9TNVDI0
4 The Centre for Research on the Epidemiology of Disasters (CRED) maintains an emergency disaster database (EM-DAT). According to the EM-
DAT, the total natural disasters reported each year has been increasing from 78 in 1970 to 348 in 2004. These disasters include droughts, tsunamis, hurricanes, typhoons and floods and have been increasing over the past 25 years. 5 The est. cost of the 2011 Japanese earthquake and tsunami was US$235 billion, the most expensive natural disaster in history (Brown 2012).
7
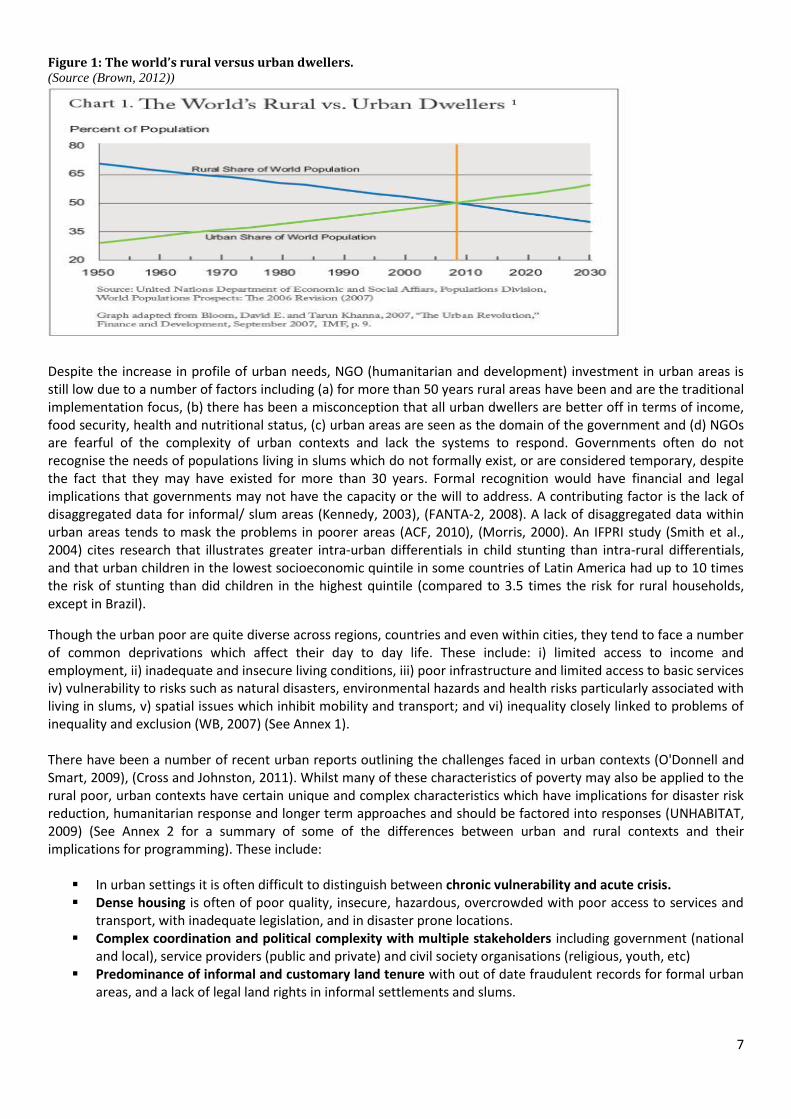
Figure 1: The world’s rural versus urban dwellers. (Source (Brown, 2012))
Despite the increase in profile of urban needs, NGO (humanitarian and development) investment in urban areas is still low due to a number of factors including (a) for more than 50 years rural areas have been and are the traditional implementation focus, (b) there has been a misconception that all urban dwellers are better off in terms of income, food security, health and nutritional status, (c) urban areas are seen as the domain of the government and (d) NGOs are fearful of the complexity of urban contexts and lack the systems to respond. Governments often do not recognise the needs of populations living in slums which do not formally exist, or are considered temporary, despite the fact that they may have existed for more than 30 years. Formal recognition would have financial and legal implications that governments may not have the capacity or the will to address. A contributing factor is the lack of disaggregated data for informal/ slum areas (Kennedy, 2003), (FANTA-2, 2008). A lack of disaggregated data within urban areas tends to mask the problems in poorer areas (ACF, 2010), (Morris, 2000). An IFPRI study (Smith et al., 2004) cites research that illustrates greater intra-urban differentials in child stunting than intra-rural differentials, and that urban children in the lowest socioeconomic quintile in some countries of Latin America had up to 10 times the risk of stunting than did children in the highest quintile (compared to 3.5 times the risk for rural households, except in Brazil).
Though the urban poor are quite diverse across regions, countries and even within cities, they tend to face a number of common deprivations which affect their day to day life. These include: i) limited access to income and employment, ii) inadequate and insecure living conditions, iii) poor infrastructure and limited access to basic services iv) vulnerability to risks such as natural disasters, environmental hazards and health risks particularly associated with living in slums, v) spatial issues which inhibit mobility and transport; and vi) inequality closely linked to problems of inequality and exclusion (WB, 2007) (See Annex 1). There have been a number of recent urban reports outlining the challenges faced in urban contexts (O'Donnell and Smart, 2009), (Cross and Johnston, 2011). Whilst many of these characteristics of poverty may also be applied to the rural poor, urban contexts have certain unique and complex characteristics which have implications for disaster risk reduction, humanitarian response and longer term approaches and should be factored into responses (UNHABITAT, 2009) (See Annex 2 for a summary of some of the differences between urban and rural contexts and their implications for programming). These include:
In urban settings it is often difficult to distinguish between chronic vulnerability and acute crisis. Dense housing is often of poor quality, insecure, hazardous, overcrowded with poor access to services and
transport, with inadequate legislation, and in disaster prone locations. Complex coordination and political complexity with multiple stakeholders including government (national
and local), service providers (public and private) and civil society organisations (religious, youth, etc) Predominance of informal and customary land tenure with out of date fraudulent records for formal urban
areas, and a lack of legal land rights in informal settlements and slums.
8
Violence and insecurity may dominate some urban contexts with poor state control being replaced by informal or criminal authorities.
Increasing migration of Internally Displaced Persons (IDPs), refugees and other undocumented migrants to cities adding additional vulnerabilities to already marginalised communities.
Natural linkages between formal and informal settlements, peri-urban and rural communities in terms of flow of people, goods and services.
Cash economy is vital in urban contexts to meet basic needs, to pay for goods and services including food, water, rent, health care and schooling.
Populations migrating to the cities are generally of low income and have no investment capacity, and tend to invade public areas or buy marginal land with no infrastructure or formal urbanization.
The heterogeneous community consists of a mix of culture which creates lack of understanding and social cohesiveness among the different groups of people in a community.
Economy inequality in urban areas: rich minorities own the majority of the land and properties. People living in slums have limited access to the political arena. While attention is currently turning towards the urban environment, there remains a paucity of knowledge and accumulated experience concerning the food security and nutritional status of the urban poor.
9
Objective of the study and methodology used Save the Children UK commissioned NutritionWorks (www.nutritionworks.org.uk) to undertake a review of what is known about the mechanisms by which poor people attempt to achieve food security in urban slums; and to examine how this is related, if at all, to their nutritional status, ideally in comparison with the rural poor in the same countries, to assess any relative differences.
There are 5 identified aims for this review as set out below and these are reflected in the report layout which contains 4 discreet parts: Part 1: Urban population characteristics
Aim 1: To review the characteristics of the urban poor in terms of livelihoods and lifestyle, estimated numbers
and growth in numbers, by regions of the world
Part 2: Food Security and Nutrition among the urban poor and causes of malnutrition Aim 2: To review current knowledge of food security among the urban poor. Aim 3: To review what is known about the nutritional status of the urban poor, and the likely causes of malnutrition in an urban environment.
Part 3: Comparing urban and rural poor nutrition in focus countries Aim 4: To compare data from the same country between the urban and rural poor, where available, to assess any relative disadvantage.
Part 4: Urban food security and nutrition programming Aim 5: To identify and review past or current programmes that have directly or indirectly addressed food security or undernutrition amongst the urban poor and to assess the factors that contributed to their success or failure.
NutritionWorks employed the following methodology:
1. Initial discussion with Save the Children UK to better understand the scope of the study and to obtain pertinent research and documentation from the agency
2. A desk review of ‘grey’ and published research and literature using Google Scholar and Medline 3. Identification of key contacts within the NGO, UN, donor and research sphere. Key contacts were sent an
introductory email outlining the scope of work and a request to (a) share relevant research findings and documents and (b) discuss the topic by phone/ Skype as and when it was convenient. Emphasis on Kenya, Niger, Bangladesh and Myanmar was made as per the guidance from the commissioning agency.
4. Discussions, interviews and email exchanges with NGO, UN and Donor key contacts and accumulation of additional literature.
5. Launch of discussions on food security, nutrition and livelihoods internet-based discussion groups: en-net (www.en-net.org.uk), Cash Learning Partnership (http://next.dgroups.org/groups/CaLP) and Food-for-cities ([email protected]).
Limitations of the review There were limitations faced by NutritionWorks in undertaking this review as briefly outlined below:
Data on malnutrition and food security is generally not disaggregated for the urban poor, which means that extremely low performing health indicators often get masked by higher performing ones.
There is a lack of anthropometric indicators stratified for different socio-economic groups and indicators of micronutrient malnutrition and nutritional status of adults.
Whilst acknowledging governance as an essential factor in the lives of the urban poor, a detailed review of linkages between governance and the malnutrition of the urban poor was considered beyond the scope of this review.
Programme policy and private sector linkages are two important areas which could not be sufficiently explored due to scope of this review.
There is additional data specific to Tanzania, Southern Africa and India which has not been analysed for this report which focused instead on Bangladesh and Kenya.
10
The limited timeframe of the study (August and September 2012) and its correspondence to the traditional holiday season affected the number of potential contacts and their availability to share programme experiences and documents. In addition, there is an enormous volume of information available on this subject area and related topics. Sifting through and identifying pertinent information was a challenge within the allocated time provided.
Cited limitations by academics and NGOs that are not mentioned above include:
Many slums are excluded from data collection, which makes it difficult to present accurate data on the food security and nutrition status of the urban poor. In addition, due to frequent movement between and within slums, it is nearly impossible for these numbers to remain up to date.
There are large discrepancies between official data, NGO and academic sources. Academics and think-tanks try to use official data so as to provide a basis for common understanding and cooperation between the government and NGOs.
Official data (including National DHS Surveys) is collated at a state or national level. There are very few figures that are corroborated only for cities.
11
Part 1: Urbanisation, the urban poor and their characteristics
The purpose of this section is to review the characteristics of the urban poor in terms of livelihoods and lifestyle, estimated numbers and growth in numbers, by regions of the world
‘Contrary to widespread perceptions, rural-urban migration is not usually the main component of urban population
growth. On average, migration and re-classification of formally rural areas as urban contribute to around 40% of
urban growth and the other 60% due to natural growth. There are, however, significant differences in the rates of
rural-urban migration both between countries and regions over time within the same countries.’
Source: (Martine et al., 2012)
Global growth in urbanisation World population is expected to grow from 6.7 billion to 9.2 billion between 2007 and 2050. Virtually all of the 2.5 billion increase will occur in the developing world’s urban areas (Cohen and Garrett, 2010). Some facts:
The growth of small and medium-sized cities is significant and should not be neglected in urbanisation policies, research and discussion. More than half of the world’s urban population lives in cities of less than five hundred thousand people. Smaller cities are expected to absorb half of urban population growth between 2005 and 2015, yet their capacity to manage this process with services and policies is weak (Garland et al., 2007).
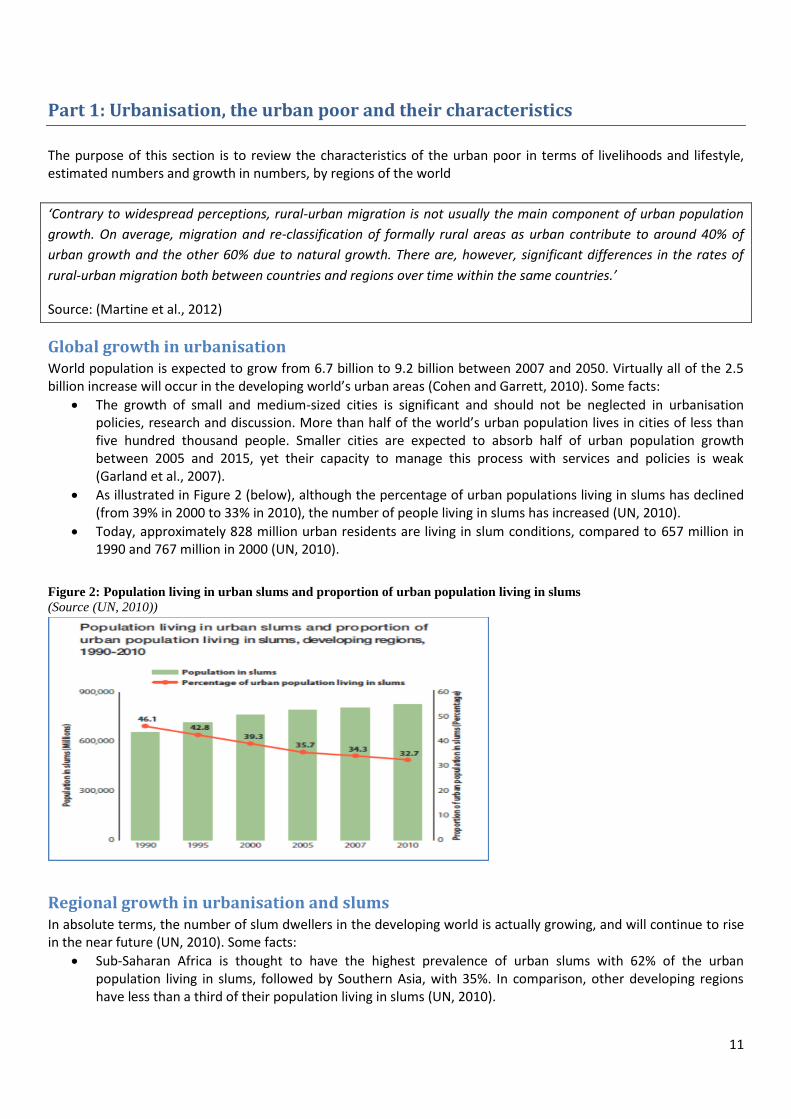
As illustrated in Figure 2 (below), although the percentage of urban populations living in slums has declined (from 39% in 2000 to 33% in 2010), the number of people living in slums has increased (UN, 2010).
Today, approximately 828 million urban residents are living in slum conditions, compared to 657 million in 1990 and 767 million in 2000 (UN, 2010).
Figure 2: Population living in urban slums and proportion of urban population living in slums
(Source (UN, 2010))
Regional growth in urbanisation and slums In absolute terms, the number of slum dwellers in the developing world is actually growing, and will continue to rise in the near future (UN, 2010). Some facts:
Sub-Saharan Africa is thought to have the highest prevalence of urban slums with 62% of the urban population living in slums, followed by Southern Asia, with 35%. In comparison, other developing regions have less than a third of their population living in slums (UN, 2010).
12
Slum prevalence is highest in conflict-affected countries, with 77% of urban populations living in slums. Conflict-affected Iraq has seen slum populations triple from 2.9 million people (17% of urban residents) to 10.7 million (53% of urban residents) in 2010 (UN, 2010).
Despite a low overall rate of urbanization, Africa has a larger urban population than North America or Western Europe (UNICEF, 2012).
Asia is home to half of the world’s urban population and 66 out of the 100 fastest-growing urban areas (UNICEF, 2012).
However, it is important to consider that some countries are experiencing very slow and counter-urbanisation. Recent research (Potts, 2009) illustrates the following:
‘Actual decreases in the level of urbanization are rare, but have been recorded for Zambia, Côte d’Ivoire and Mali.
‘Countries where urbanization levels are stagnating or increasing very slowly, especially when considering large and medium-sized towns, include Benin, Mozambique, Senegal, Zimbabwe, Mauritania, Burkina Faso and Niger.’
‘The East African situation is more mixed, but growth rates in many large centres are around or below the national rate. For many urban centres there is evidence of increased circular migration, which has reduced the contribution of in-migration to urban growth. These trends are largely the result of declining economic opportunities in many urban areas, reflecting crises in urban poverty and livelihood insecurity.’
Potts also mentions that in Kenya and Tanzania, ‘unusual definitions and re-definitions of “urban settlements” at the lower end of their urban hierarchies have rendered the overall urban growth rates and levels reported in their censuses extremely misleading (and exaggerated) in recent decades, so it helps to base assessments of growth trends on individual settlements.’ Caution should be taken with the reliability of urban data which is highly political and rarely disaggregated.
Social networks Social networks in urban areas are based on political, religious and economic and ethnic connections. Social support systems are weaker for the most food insecure in urban areas, who often do not have the same access to kin, political or religious groups to offer and provide support as in rural areas (FANTA-2, 2008) – all of which affects their social capital. In addition, urban populations are more influenced by changes in political leadership than those residing in rural areas (FANTA-2, 2008). ‘Ethnicity is a strong determining factor in residence and settlement in some cities (e.g., Mogadishu, Jakarta), as a general rule groups tied together by these factors are less geographically circumscribed in urban than in rural settings.’ (FANTA-2, 2008). There is a higher number of orphans and vulnerable children (OVC) in urban centres than in rural areas (FANTA-2, 2008); one of the coping mechanisms of vulnerable urban households is to encourage children over 10 years to live independently, thereby reducing the dependency ratios and demands on often single parent households (MacAuslan and Phelps, 2011).
Rural – Urban Linkages and Migration There are ‘multiple and overlapping causes in most migration flows, including economic, social and political factors’ (Tacoli, 2009). Much research is undertaken to understand these factors especially in the context of climate change and adaptation. Migration is seen negatively and as a key policy issue in most governments of low- and middle-income nations. A review of African Poverty Reduction Strategy Papers showed migration referred to as ‘as putting pressure on urban areas, promoting the spread of crime and HIV/AIDS, stimulating land degradation and reinforcing both urban and rural poverty’ (Tacoli, 2009). However, many countries that have the ‘largest contributions of rural to urban migration to urban population growth are the wealthiest or those with rapid economic growth’ (Tacoli, 2009). As mentioned above, rural–urban migration is not solely responsible for urbanisation and urban poverty (Martine et al., 2012), (Tacoli, 2009). In
13
addition, in most countries rural migrants do not automatically become the majority of the urban poor, nor are they the only residents of low-income informal settlements (Tacoli, 2009).
Links (economic and social) with rural areas are often maintained by urban and peri-urban households. Resources are bi-directional, flowing from urban to rural areas and vice versa, and are needs driven (FANTA-2, 2008). A recent study by Action Contre la Faim (ACF) (Vaitla, 2012) in Guinea, Guatemala and Zimbabwe found that both economic and non-economic factors play an important role in why urban households maintain a link with their home areas. ‘All of the urban interviewees in Guinea and Zimbabwe returned to their village in the past year, with half of the respondents in Guinea returning at least four times. The urban migrants often return to help in times of high agricultural labour demand, especially during planting and harvest.’ The author found a ‘dense web of interdependencies’ between urban and rural livelihoods and that the relationships are integral to households’ management of risk: ‘the linkages that result from migration serve as a safety net, cushioning both sides of the household from shocks. Redistribution of income, food, and assets can mean the difference between a ‘merely bad’ year and a catastrophic one that destroys assets and traps families in poverty for years to come.’ In Guinea, for instance, around 10-15% of the food consumed by urban residents was provided by their rural relatives, and a similar proportion of cash obtained by rural families came from urban migrants. In Nairobi’s slums, a majority of the households have often been in residence for at least 20 years, and although they retain some rural linkages this is often in the form of remittances sent back to rural relatives, and children sent for cheaper schooling. Although the average household size is around 5 people, the high rates of HIV / AIDS means that it is not unusual for family members to inherit several children upon the death of their sister or brother, sometimes doubling their dependency ration overnight. Mothers are often financially responsible for the care of the children.
In most cases, a country’s level of urbanisation is reflected in the direction of migration flows and the nature of its ‘economic base’6 (Tacoli, 2009). There are a number of types of migration interplaying in an urban context. These include:
Rural to urban migration:
Prevalent in agriculture-based economies such as many low-income African nations (Tacoli, 2009).
Tends to be high in areas with high levels of economic growth and expanding industry and service sectors (but there are examples of countries (India and Vietnam) in which you would expect high rates or rural-urban migration, that also have high rates of rural-rural migration7 (Tacoli, 2009).
Can be seasonal during seasons when rural employment and on-farm opportunities are lost due to extreme weather conditions. This can result in higher competition for informal wage labour in urban areas (Ruel and Garrett, 2004) (Leighton, 2010). In Niger, ‘problems of food security in urban centres are strongly correlated to cyclical food security patterns in rural villages’ (Leighton, 2010). It is increasingly common for young women to migrate, in part because they have no land rights and few prospects at home, in part because of more employment opportunities elsewhere (Tacoli and Mabala, 2010).
Urban to rural migration;
Both poor and wealthier urban households maintain rural assets as a safety net and investment for future rural ‘retirement’ (Tacoli, 2009).
‘In many countries, households that have moved to the cities for the long term may still keep close ties to their former rural homes as a hedge against bad economic times or political crisis’ (Ruel et al., 2010). An example of this is the 2008 financial and fuel crisis when poor urban residents used retained relationships with rural areas for employment and support.
In many instances urban migration is circular or seasonal during seasons of lower availability of rural employment. ‘In Burkina Faso, circular movement involving returning to home areas within two
6 The companies and industries are crucial to the local economy and are called the economic base.
7 Rural–rural migration tends to be dominated by the poorest groups, who often do not have the skills, financial capital and social networks to
move to the urban centres (Tacoli C 2009).
14
years is especially high among those engaging in cross-border migration but also rural–urban migrants and, to a lesser extent, rural–rural migrants’ (Tacoli, 2009).
Urban to urban migration;
This movement is more important in regions with high levels of urbanisation, such as much of Latin America and the Caribbean (Tacoli, 2009).
Analysis of urban migrant origin indicates that many originate from urban centres. For example, 95% of Kenyan urban refugees have previously resided in cities and have been displaced within the urban environment (Pantuliano et al., 2012). Interestingly, despite there being limited reflections on the implications of urban displacement for host communities, studies indicate that the relationship between displaced and host communities ‘can be highly variable and should be analysed on a case-by-case basis’ (Pantuliano et al., 2012)8.
Migration and climate change
Significant concern exists that climate change will result in a large number of rurally based ‘environmental refugees’ descending on urban areas. However, research in countries such as Burkina Faso suggest that ‘a decrease in rainfall increases rural–rural temporary migration’ and ‘migration to urban centres and abroad, which entails higher costs, is more likely to take place after normal rainfall periods and is influenced by migrants’ education, the existence of social networks and access to transport and road networks’ (Tacoli, 2009). Similar research findings from Nepal have been found whereby ‘land degradation and environmental deterioration lead to mainly local movements, although the better educated tend to move to urban centres further away’ (Tacoli, 2009). Current thinking is that in the face of climate change, what is more likely is that the present ‘trends of high mobility, linked to income diversification, will continue and intensify. Past experiences suggest that short-distance and short-term movements will probably increase, with the very poor and vulnerable in many cases unable to move. Underlying these trends is the growing need for the diversification of income sources, and the spatially unequal distribution of economic opportunities’ (Tacoli, 2009).
8 For more information on urban refugees, please see “Hidden and exposed, urban refugees in Nairobi, Kenya” ODI HPG Working Paper
http://www.odi.org.uk/resources/docs/5858.pdf
15
Box 1: An example from urban Niger Source: (Leighton, 2010)
Achieving the Millennium Development Goals (MDGs) in urban populations Projections by UNHABITAT (UNHABITAT, 2006) indicate that by 2020, the world’s total slum population will reach 1.4 billion. The MDG target 11, goal 7: ‘By 2020, to have achieved a significant improvement in the lives of at least 100 million slum dwellers’ requires revision as progress made on the slum target has not been sufficient to offset the growth of slum/ informal settlements in the developing world (Garland et al., 2007) (UN, 2010). Urban growth rates are high and increasing (Kennedy, 2003) and the financial and economic downturn has also had an impact on economic hardship and rates of urban migration (Pantuliano et al., 2012) and the urban housing crisis. ‘In many cases, public authorities have exacerbated the housing crisis through failures on four major counts: lack of land titles and other forms of secure tenure; cutbacks in funds for subsidized housing for the poor; lack of land reserves earmarked for low-income housing; and an inability to intervene in the market to control land and property speculation. Low incomes in the face of rising land prices virtually rule out the possibility that the working poor can ever own land, contributing to the problem of urban slums’ (UN, 2010).
Rural-urban migration occurs in ‘normal’ years but increases during years of poor harvests and crisis when
migration rates and patterns differ. Save the Children in their report ‘Urban Food Security Assessment,
Emergency Response Niger’ note the following differences:
The duration of migration is longer and the number of migrants is higher.
The level of migrant vulnerability is higher as the migrant demographic profile is different with whole
families migrating as opposed to just males or one or two household members.
Migrants during crisis times tend to remain indefinitely in urban areas and become residents.
The urban vulnerable population, of whom the vast majority are not registered as residents, is categorised into 4
groups:
1. Remaining migrant population – in this instance the households find a better quality of life in the
urban areas; may not have anything to go back to. Migrants prefer to stay in the urban areas due to the
following:
a. Better and easier (in terms of effort) access to potable water and related hygiene.
b. The type of work available is ‘generally less physically intense and thus less draining than
field work back in the village’.
c. Households manage to eat most days from daily labour or begging income (this was stated as a
top priority for households).
2. Vulnerable residents with no land – these populations are structurally food insecure and compete for
poorly paid daily labour with the influx of cheaper migrant labour.
3. Vulnerable residents with access to land – these households tend to live in more peripheral areas of
the city and supplement their food income with some small amounts of own production. However, they
are still reliant on cheap daily labour and vulnerable to price rises, whilst competing for labour with
migrants.
4. Marginalised and disabled populations such as the blind, disabled and leper dominated
communities. These populations tend to congregate into communities that are poorly serviced by the
state, resulting in poor access to water and sanitation services, health centres and education for children.
These populations rely heavily on begging as a primary source of income.
A number of immediate and longer term programme responses (with some modifications for urban residents)
are outlined in the report and include two particularly interesting responses:
Community clean up Cash for Work linked up with the private sector for waste material collection.
Urban contingency planning development for future crises, such as predefined programmes, ‘return
kits’ for migrants and NFI kits for households staying in the urban area.
16
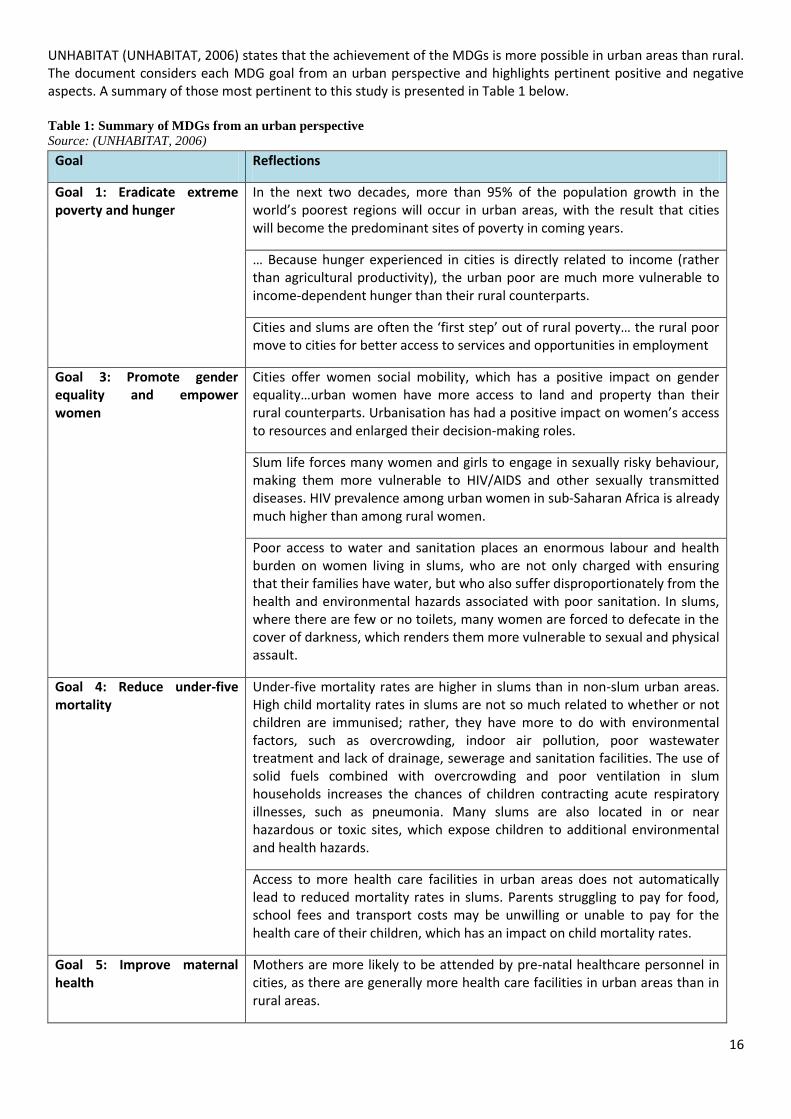
UNHABITAT (UNHABITAT, 2006) states that the achievement of the MDGs is more possible in urban areas than rural. The document considers each MDG goal from an urban perspective and highlights pertinent positive and negative aspects. A summary of those most pertinent to this study is presented in Table 1 below. Table 1: Summary of MDGs from an urban perspective
Source: (UNHABITAT, 2006)
Goal Reflections
Goal 1: Eradicate extreme poverty and hunger
In the next two decades, more than 95% of the population growth in the world’s poorest regions will occur in urban areas, with the result that cities will become the predominant sites of poverty in coming years.
… Because hunger experienced in cities is directly related to income (rather than agricultural productivity), the urban poor are much more vulnerable to income-dependent hunger than their rural counterparts.
Cities and slums are often the ‘first step’ out of rural poverty… the rural poor move to cities for better access to services and opportunities in employment
Goal 3: Promote gender equality and empower women
Cities offer women social mobility, which has a positive impact on gender equality…urban women have more access to land and property than their rural counterparts. Urbanisation has had a positive impact on women’s access to resources and enlarged their decision-making roles.
Slum life forces many women and girls to engage in sexually risky behaviour, making them more vulnerable to HIV/AIDS and other sexually transmitted diseases. HIV prevalence among urban women in sub-Saharan Africa is already much higher than among rural women.
Poor access to water and sanitation places an enormous labour and health burden on women living in slums, who are not only charged with ensuring that their families have water, but who also suffer disproportionately from the health and environmental hazards associated with poor sanitation. In slums, where there are few or no toilets, many women are forced to defecate in the cover of darkness, which renders them more vulnerable to sexual and physical assault.
Goal 4: Reduce under-five mortality
Under-five mortality rates are higher in slums than in non-slum urban areas. High child mortality rates in slums are not so much related to whether or not children are immunised; rather, they have more to do with environmental factors, such as overcrowding, indoor air pollution, poor wastewater treatment and lack of drainage, sewerage and sanitation facilities. The use of solid fuels combined with overcrowding and poor ventilation in slum households increases the chances of children contracting acute respiratory illnesses, such as pneumonia. Many slums are also located in or near hazardous or toxic sites, which expose children to additional environmental and health hazards.
Access to more health care facilities in urban areas does not automatically lead to reduced mortality rates in slums. Parents struggling to pay for food, school fees and transport costs may be unwilling or unable to pay for the health care of their children, which has an impact on child mortality rates.
Goal 5: Improve maternal health
Mothers are more likely to be attended by pre-natal healthcare personnel in cities, as there are generally more health care facilities in urban areas than in rural areas.
17
Many women living in slums cannot afford the relatively more expensive delivery and post-natal health services in urban areas, and are, therefore, less likely to seek these services,.
Slum upgrading and prevention policies that incorporate voluntary testing and counselling facilities have helped reduce HIV prevalence in urban areas.
Goal 6: Combat diseases including HIV/AIDS, malaria and other diseases
Increased awareness about prevention in urban areas has not had the desired effect of reducing HIV prevalence in cities. In fact, trends suggest that HIV prevalence is much greater in urban areas than in rural areas.
Slums are characterised by overcrowding and poor ventilation, the leading contributors to the rise in tuberculosis cases worldwide. Studies have shown that HIV-related tuberculosis is becoming an increasingly urban phenomenon, particularly in slums.
The three Transitions: Demographic, Epidemiological and Nutritional Populations undergo three transitions during the urbanisation process. These are summarised as:
1. Demographic transition: this characteristically exists with 4 stages.
Stage one presents high birth and death rates (providing for slow, stable growth),
Stage two involves declining death rates with continuing high birth rates and accelerated population growth,
Stage three sees continued decline in birth and death rates with continued increasing population growth,
Stage four arrives with low death rates with fluctuating birth rates and a stable population.
Africa is seen as being in the second stage and moving toward stage three. The policy and development implications of this include: increased births by more parents despite a potential decline in fertility (Garland et al., 2007).
2. Epidemiological transition: This is a shift from infectious diseases to chronic, non-communicable diseases as
the major causes of morbidity and mortality. Globally, 60% of all deaths are caused by chronic diseases. Less developed and middle-income countries and their health systems face a future of both infectious and chronic diseases that will cause significant mortality and morbidity over the next twenty-five to fifty years which will overburden unprepared health systems (Garland et al., 2007).
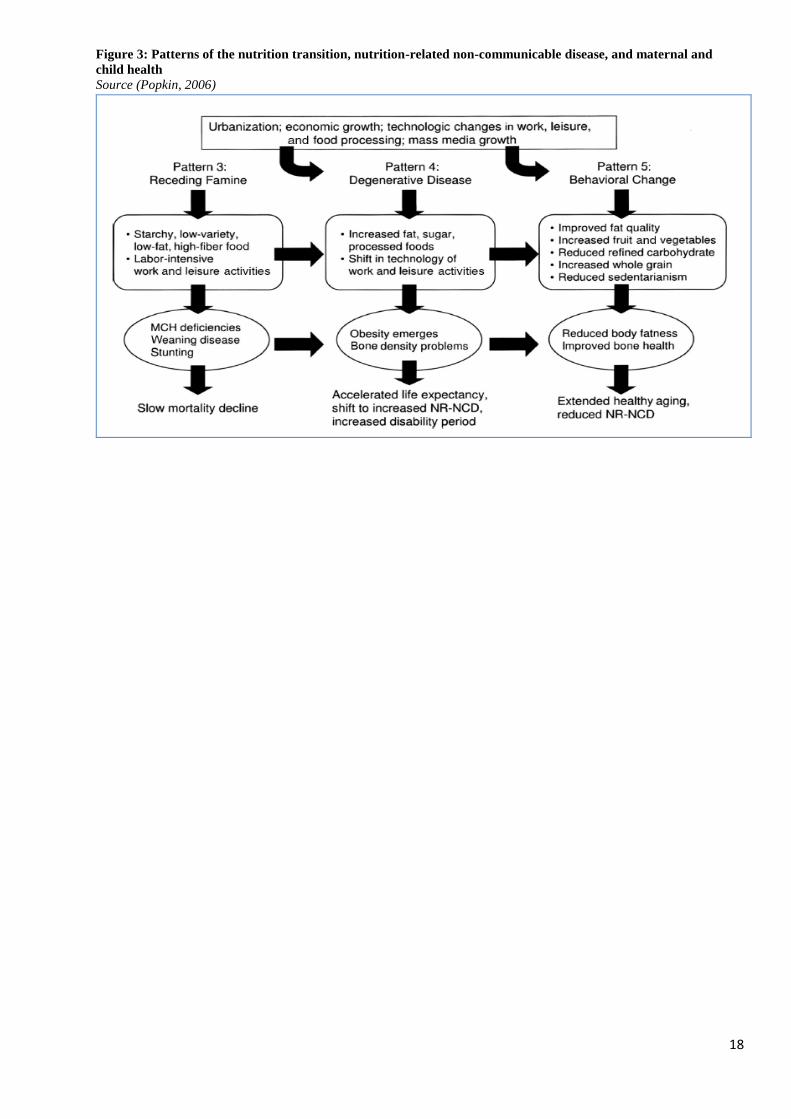
3. Nutritional transition and the double burden of malnutrition: The demographic and epidemiologic transitions (above) are pre- or at least co-factors in the nutrition transition with clear links to urban growth (Garland et al., 2007). Urbanisation is resulting in shifts in dietary behaviour, physical activity, food consumption, the types of foods available and the reliance on imported and processed foods (Kennedy, 2003) (Popkin, 2006). Urban households are consuming distinct diets compared to their rural counterparts and are consuming foods with a higher fat and sugar content (Popkin, 2001) and lower nutritional value (Kennedy, 2003). An outcome of this is the rising prevalence of overweight and obesity (Ruel and Garrett, 2004) and an increase in chronic and non-communicable diseases such as diabetes and coronary heart disease (Popkin, 2001) (Shetty, 2002). Figure 3 taken from Popkin 2006, illustrates this pattern, clearly showing the relationship between the nutritional and epidemiological transitions and health outcomes. A phenomenon on the ascendency especially in poor households is ‘the double burden of malnutrition’, which is the co-existence of overweight and underweight within the same household. The existence of adult obesity precedes child obesity (Popkin, 2006).
18
Figure 3: Patterns of the nutrition transition, nutrition-related non-communicable disease, and maternal and
child health
Source (Popkin, 2006)
19
Part 2: Food Security and Nutrition among the urban poor and causes of
malnutrition
This section provides a review of current knowledge of food security and nutrition among the urban poor. In
addition, a discussion of what is known about the likely causes of malnutrition (including under and
overweight/obesity, micronutrient malnutrition) in an urban environment is continued from Part 1.
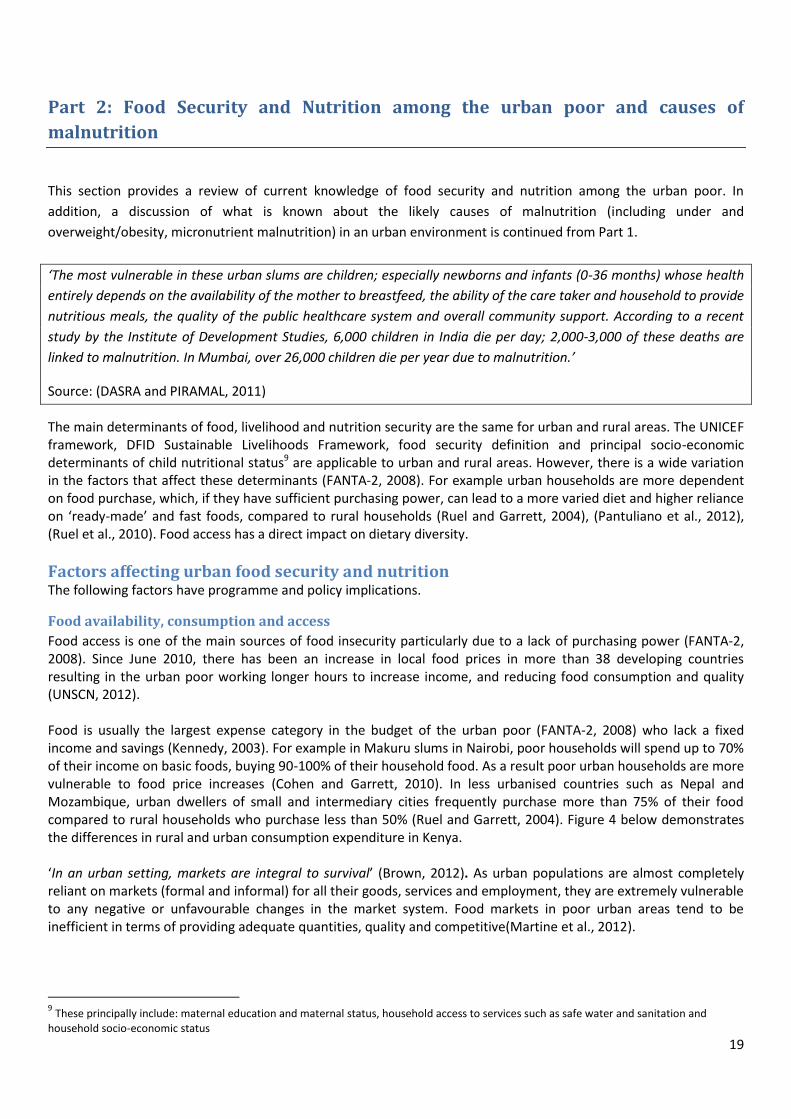
‘The most vulnerable in these urban slums are children; especially newborns and infants (0-36 months) whose health
entirely depends on the availability of the mother to breastfeed, the ability of the care taker and household to provide
nutritious meals, the quality of the public healthcare system and overall community support. According to a recent
study by the Institute of Development Studies, 6,000 children in India die per day; 2,000-3,000 of these deaths are
linked to malnutrition. In Mumbai, over 26,000 children die per year due to malnutrition.’
Source: (DASRA and PIRAMAL, 2011)
The main determinants of food, livelihood and nutrition security are the same for urban and rural areas. The UNICEF framework, DFID Sustainable Livelihoods Framework, food security definition and principal socio-economic determinants of child nutritional status9 are applicable to urban and rural areas. However, there is a wide variation in the factors that affect these determinants (FANTA-2, 2008). For example urban households are more dependent on food purchase, which, if they have sufficient purchasing power, can lead to a more varied diet and higher reliance on ‘ready-made’ and fast foods, compared to rural households (Ruel and Garrett, 2004), (Pantuliano et al., 2012), (Ruel et al., 2010). Food access has a direct impact on dietary diversity.
Factors affecting urban food security and nutrition The following factors have programme and policy implications.
Food availability, consumption and access
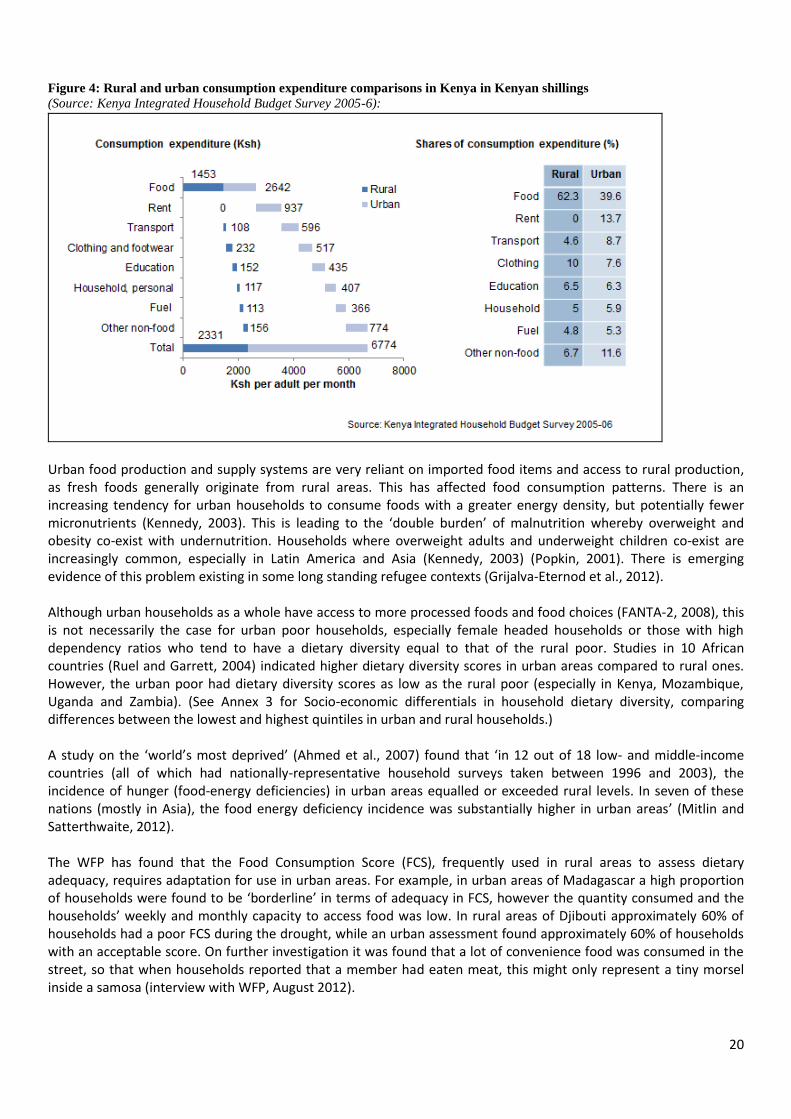
Food access is one of the main sources of food insecurity particularly due to a lack of purchasing power (FANTA-2, 2008). Since June 2010, there has been an increase in local food prices in more than 38 developing countries resulting in the urban poor working longer hours to increase income, and reducing food consumption and quality (UNSCN, 2012). Food is usually the largest expense category in the budget of the urban poor (FANTA-2, 2008) who lack a fixed income and savings (Kennedy, 2003). For example in Makuru slums in Nairobi, poor households will spend up to 70% of their income on basic foods, buying 90-100% of their household food. As a result poor urban households are more vulnerable to food price increases (Cohen and Garrett, 2010). In less urbanised countries such as Nepal and Mozambique, urban dwellers of small and intermediary cities frequently purchase more than 75% of their food compared to rural households who purchase less than 50% (Ruel and Garrett, 2004). Figure 4 below demonstrates the differences in rural and urban consumption expenditure in Kenya. ‘In an urban setting, markets are integral to survival’ (Brown, 2012). As urban populations are almost completely reliant on markets (formal and informal) for all their goods, services and employment, they are extremely vulnerable to any negative or unfavourable changes in the market system. Food markets in poor urban areas tend to be inefficient in terms of providing adequate quantities, quality and competitive(Martine et al., 2012).
9 These principally include: maternal education and maternal status, household access to services such as safe water and sanitation and
household socio-economic status
20
Figure 4: Rural and urban consumption expenditure comparisons in Kenya in Kenyan shillings
(Source: Kenya Integrated Household Budget Survey 2005-6):
Urban food production and supply systems are very reliant on imported food items and access to rural production, as fresh foods generally originate from rural areas. This has affected food consumption patterns. There is an increasing tendency for urban households to consume foods with a greater energy density, but potentially fewer micronutrients (Kennedy, 2003). This is leading to the ‘double burden’ of malnutrition whereby overweight and obesity co-exist with undernutrition. Households where overweight adults and underweight children co-exist are increasingly common, especially in Latin America and Asia (Kennedy, 2003) (Popkin, 2001). There is emerging evidence of this problem existing in some long standing refugee contexts (Grijalva-Eternod et al., 2012). Although urban households as a whole have access to more processed foods and food choices (FANTA-2, 2008), this is not necessarily the case for urban poor households, especially female headed households or those with high dependency ratios who tend to have a dietary diversity equal to that of the rural poor. Studies in 10 African countries (Ruel and Garrett, 2004) indicated higher dietary diversity scores in urban areas compared to rural ones. However, the urban poor had dietary diversity scores as low as the rural poor (especially in Kenya, Mozambique, Uganda and Zambia). (See Annex 3 for Socio-economic differentials in household dietary diversity, comparing differences between the lowest and highest quintiles in urban and rural households.) A study on the ‘world’s most deprived’ (Ahmed et al., 2007) found that ‘in 12 out of 18 low- and middle-income countries (all of which had nationally-representative household surveys taken between 1996 and 2003), the incidence of hunger (food-energy deficiencies) in urban areas equalled or exceeded rural levels. In seven of these nations (mostly in Asia), the food energy deficiency incidence was substantially higher in urban areas’ (Mitlin and Satterthwaite, 2012). The WFP has found that the Food Consumption Score (FCS), frequently used in rural areas to assess dietary adequacy, requires adaptation for use in urban areas. For example, in urban areas of Madagascar a high proportion of households were found to be ‘borderline’ in terms of adequacy in FCS, however the quantity consumed and the households’ weekly and monthly capacity to access food was low. In rural areas of Djibouti approximately 60% of households had a poor FCS during the drought, while an urban assessment found approximately 60% of households with an acceptable score. On further investigation it was found that a lot of convenience food was consumed in the street, so that when households reported that a member had eaten meat, this might only represent a tiny morsel inside a samosa (interview with WFP, August 2012).
21
As cities grow and their boundaries extend, the length of the rural-urban supply chain follows suit resulting in food being transported over great distances. There are food safety and quality issues related to the handling of fresh foods that require consideration. In addition, approximately 65% of micronutrient losses occur at production, post-harvest and processing stages in developing countries (UNSCN, 2012). ‘As a result of this expanding urbanization and food supply chain, urban food ‘deserts’ are becoming apparent. These are areas within city centres with limited access to affordable and nutritious food, causing people to rely on small grocery or convenience stores that are more expensive and lack all foods needed for a healthy diet. This forces them to either spend more time and money on transportation costs to access appropriate supermarkets10, or to go without fresh healthy foods, increasing the risk of chronic disease’ (UNSCN, 2012). Access to free or “wild” food options are more limited in urban areas (FANTA-2, 2008) as is the availability of free or cheap fuel for cooking (Kennedy, 2003). Small living spaces with no/ small kitchens and expensive cooking fuel costs also influence household diets, with the result that households rely heavily on ready-made/ fast food (Kennedy, 2003) (FANTA-2, 2008). A high reliance on street foods has health implications when vendors are poorly regulated in terms of food safety and hygiene (Kennedy, 2003). Additionally, poor water, sanitation and health conditions result in poor food utilisation (FANTA-2, 2008).
Employment and the labour market
The urban poor rely heavily on earning an income from low-paying, unstable jobs (FANTA-2, 2008). These jobs tend to have long hours in often precarious conditions (Ruel and Garrett, 2004). Although the image of urban informal work predominates, in reality many urban residents, even the poor, work in the formal sector. Of course, such employment is more important in some places than others: in Accra, Ghana, 53 % of the workforce earns their living from informal or self-employment; this rises to 60-75% in Guatemala, El Salvador and Honduras (Ruel et al., 2010). In Egypt and Malawi, however, 70% or more of jobs pay wages or salaries (Cohen and Garrett, 2010). Despite being unstable and unregulated, the informal sector is very dynamic and provides employment for many urban poor. Available estimates suggest that the size of informality ranges from 30 to 70% of GDP in developing countries (Baker, 2008).
Both unemployment and underemployment are typically higher for the urban poor than for other urban residents (Baker, 2008). High population density and un/underemployment rates result in a highly competitive labour market which tends to be segregated along gender and education lines (FANTA-2, 2008), often disadvantaging women, requiring them to take safety risks or spend a large proportion of their income on transport and childcare. Youth unemployment is a major problem in many cities, and increasingly linked to growing social problems and urban unrest. Average youth unemployment rates were highest in the Middle East and North Africa Region (25.6%) and Sub-Saharan Africa (21%), and lowest in East Asia (7%) for 2003 (FANTA-2, 2008). Labour availability and stability is not as seasonal as it is in rural areas, but heavily dependent on economic circumstances that can fluctuate easily and quickly (Baker, 2008). However, urban labour is indirectly influenced by rural agricultural activities as employment in transportation, processing and selling agricultural commodities occurs. In some cities, such as Kampala, urban agriculture provides much needed fresh food and employment (Smith and Prain, 2006). Economic inequity is higher in urban centres compared to rural areas and this often leads to security issues (crime, violence) which in turn affect access to services and jobs, especially for women (FANTA-2, 2008). There is a steep increase in gang culture and violence which is often based in ‘lawless’ informal settlements such as parts of Guatemala City and Mexico City. These ‘conflicts’ are not recognised as such but have similar impacts on residents as recognised civil conflict.
10
For an interesting discussion on the role of supermarkets in urban poor areas, see Ruel M and Garrett J 2004

22
Urban women and gender roles
Current urbanisation trends have increased employment opportunities for women at a higher rate than for men. More jobs, greater diversity in work environments and variety in types of jobs are available. Although proportionally fewer women work than men, it is estimated that 50% of women are part of a formal labour force and up to 75% of women are involved in the informal and semi-formal sectors (Ruel and Garrett, 2004). However, there is little information on urban and rural differences and disaggregation allowing analysis for poor urban households. Persisting in this context of greater employment availability are problems that have always faced women in employment, including (Ruel and Garrett, 2004):
Over-representation of women in less secure and irregular jobs that are not subject to labour laws and do not offer social or medical benefits.
Unfavourable payment rates compared to men for the same work despite the fact that the gap between male and female payment rates is decreasing (due to a drop in male wage rates as opposed to a rise in female rates).
Lack of access to capital.
Engagement as unpaid family labour.
Cultural, religious and institutional restrictions in certain cases that restrict female mobility and types of employment women can engage in. For example, in Bangladesh the lack of hostels and housing for females may limit or influence their decisions to migrate to the cities for work.
Lack of alternative, affordable quality child care.
Recent research undertaken by IFPRI indicates that urban women adapt their work patterns to their specific family circumstances and that the well-being of their children is the prevailing force behind their decisions to work and the child care practices they employ (Ruel and Garrett, 2004). The IFPRI comparative study of Accra (Ghana) and Guatemala City (Guatemala) indicated:
The age of the youngest child highly influenced women’s employment and child care choices. Mothers with children under three years of age were less likely to work and, if they did work, they were less likely to use formal child care compared to mothers with older children.
In Guatemala City, the presence of another adult woman (potential caregiver) was an important determining factor of women’s decision to work.
Ghanaian urban women who are predominantly employed in the informal sector, and who have to resume work for income reasons when their infant is young usually take their child to work with them. Although there could be negative environmental aspects (depending on the type of employment), there are positive aspects such as maintaining breastfeeding, which provide important nutritional benefits to the child.
However, the use of these ‘adaptive strategies’ could seriously reduce the mother’s income potential, and consequently reduce household livelihood, food and nutrition security, especially in female-headed households or households in which she is the main or sole income earner (Ruel and Garrett, 2004). This is of concern as rates of female headed households in urban areas tends to be higher than in rural areas (Martine et al., 2012). The findings of a recent study reveal that the implications of waged employment for Bangladeshi women are complex and contradictory. ‘Analysis of women's perceptions as factory workers shows that they are exploited on the factory floor in different ways and experience new forms of patriarchal domination beyond their family. Exploration of their perceptions as household members shows that earnings improve their position within the family. Although they often do not control their wages and frequently bear the double burden of productive and reproductive activities, they enjoy autonomy and freedom from familial patriarchal domination to a certain degree. In addition, women's participation in the labour market and their constant presence in the male dominated spaces are incessantly contesting the traditional notions of gender practices and meanings in Bangladeshi society. This situation also influences women to challenge male authority to an extent. Even though the challenges are not widespread, these may create new possibilities for women in society’ (Rahman, 2010). Another study of women’s employment in the ready-made garment industry concurs that employment continues to be a source of empowerment for women in Bangladesh, not only for the economic benefits to the household and
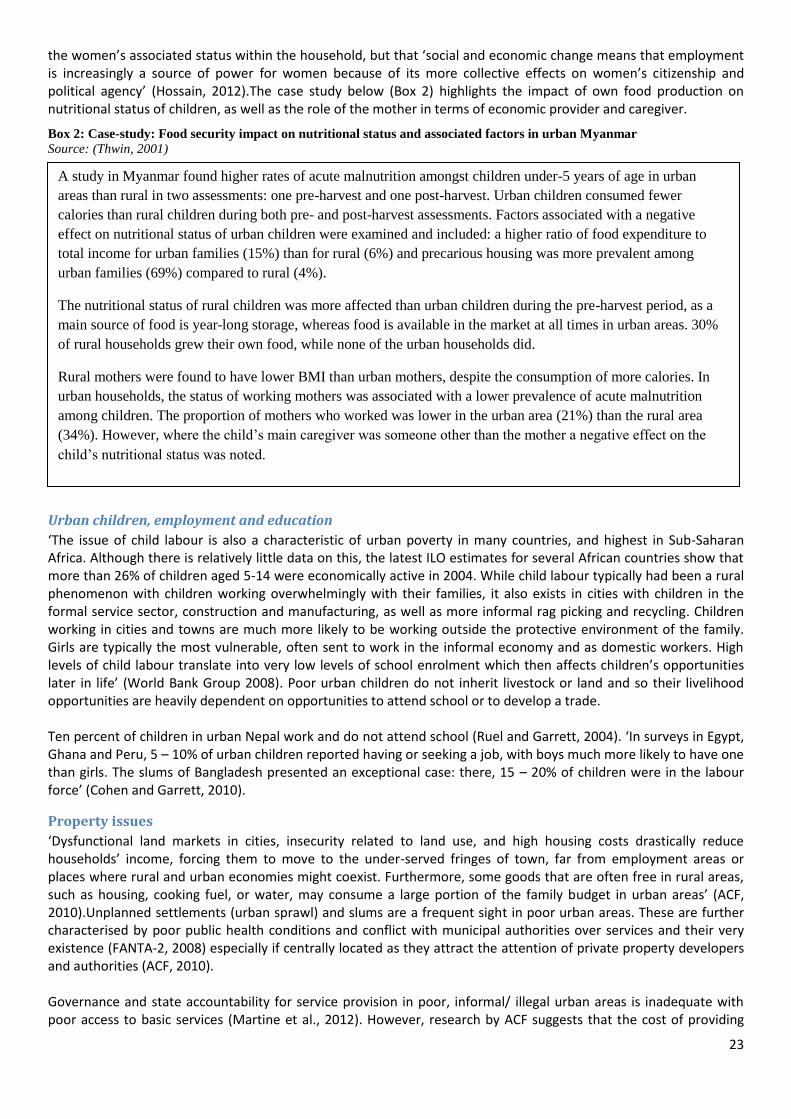
23
the women’s associated status within the household, but that ‘social and economic change means that employment is increasingly a source of power for women because of its more collective effects on women’s citizenship and political agency’ (Hossain, 2012).The case study below (Box 2) highlights the impact of own food production on nutritional status of children, as well as the role of the mother in terms of economic provider and caregiver.
Box 2: Case-study: Food security impact on nutritional status and associated factors in urban Myanmar
Source: (Thwin, 2001)
Urban children, employment and education
‘The issue of child labour is also a characteristic of urban poverty in many countries, and highest in Sub-Saharan Africa. Although there is relatively little data on this, the latest ILO estimates for several African countries show that more than 26% of children aged 5-14 were economically active in 2004. While child labour typically had been a rural phenomenon with children working overwhelmingly with their families, it also exists in cities with children in the formal service sector, construction and manufacturing, as well as more informal rag picking and recycling. Children working in cities and towns are much more likely to be working outside the protective environment of the family. Girls are typically the most vulnerable, often sent to work in the informal economy and as domestic workers. High levels of child labour translate into very low levels of school enrolment which then affects children’s opportunities later in life’ (World Bank Group 2008). Poor urban children do not inherit livestock or land and so their livelihood opportunities are heavily dependent on opportunities to attend school or to develop a trade. Ten percent of children in urban Nepal work and do not attend school (Ruel and Garrett, 2004). ‘In surveys in Egypt, Ghana and Peru, 5 – 10% of urban children reported having or seeking a job, with boys much more likely to have one than girls. The slums of Bangladesh presented an exceptional case: there, 15 – 20% of children were in the labour force’ (Cohen and Garrett, 2010).
Property issues
‘Dysfunctional land markets in cities, insecurity related to land use, and high housing costs drastically reduce households’ income, forcing them to move to the under-served fringes of town, far from employment areas or places where rural and urban economies might coexist. Furthermore, some goods that are often free in rural areas, such as housing, cooking fuel, or water, may consume a large portion of the family budget in urban areas’ (ACF, 2010).Unplanned settlements (urban sprawl) and slums are a frequent sight in poor urban areas. These are further characterised by poor public health conditions and conflict with municipal authorities over services and their very existence (FANTA-2, 2008) especially if centrally located as they attract the attention of private property developers and authorities (ACF, 2010). Governance and state accountability for service provision in poor, informal/ illegal urban areas is inadequate with poor access to basic services (Martine et al., 2012). However, research by ACF suggests that the cost of providing
A study in Myanmar found higher rates of acute malnutrition amongst children under-5 years of age in urban
areas than rural in two assessments: one pre-harvest and one post-harvest. Urban children consumed fewer
calories than rural children during both pre- and post-harvest assessments. Factors associated with a negative
effect on nutritional status of urban children were examined and included: a higher ratio of food expenditure to
total income for urban families (15%) than for rural (6%) and precarious housing was more prevalent among
urban families (69%) compared to rural (4%).
The nutritional status of rural children was more affected than urban children during the pre-harvest period, as a
main source of food is year-long storage, whereas food is available in the market at all times in urban areas. 30%
of rural households grew their own food, while none of the urban households did.
Rural mothers were found to have lower BMI than urban mothers, despite the consumption of more calories. In
urban households, the status of working mothers was associated with a lower prevalence of acute malnutrition
among children. The proportion of mothers who worked was lower in the urban area (21%) than the rural area
(34%). However, where the child’s main caregiver was someone other than the mother a negative effect on the
child’s nutritional status was noted.
24
basic services (water, sewerage, refuse collection, road access etc.) to expanding urban areas is high and financially ‘impossible’ (ACF, 2010).
The urban poor are often prevented from improving infrastructure and service delivery with state removal of houses a common occurrence as they are seen as illegal and not conforming to building regulations and safety standards. This can result (for example in Caracas, Venezuela) where the poor are forced to relocate to more marginalised areas (Martine et al., 2012). Lack of official land tenure even in slums that are 30 years old or more, means that ‘tenants’ of these slums have few rights, and are vulnerable to landlords raising prices, despite poor service provision. Campaigning for improved land tenure is particularly difficult as often politicians are also landlords, and for residents, if land tenure is secured, they fear that there will be a rise in the rental price.
Public health and sanitation
Environmental issues (e.g., over-crowding, poor water and sanitation, pollution, open sewerage, contamination, pestilence) are most acute in cities and have a significant impact on child and household health (Kennedy, 2003), (FANTA-2, 2008). ‘Basic human needs such as clean air, water, food and housing are difficult to access in slums. Furthermore, inadequate clean water supply and access to sanitation mean households are at high risk of water borne disease. Infestations of insects and rodent pests increase the incidence of vector borne diseases (malaria), acute respiratory infections (ARIs) and skin infections. Poor health is compounded by overcrowding and the lack of a suitably built environment’ (DASRA and PIRAMAL, 2011). Indoor air pollution and ARIs contribute to child mortality in slums, accounting for 18% of deaths among children under five (Baker, 2008). Seasonal rains in urban areas can pose a threat to health as waste and sewers can overflow and spread disease. Ill health can lead to a decrease in incomes among casual labourers; for example, this was noted for rickshaw-pullers in Bangladesh due to their own poor health as well as reduced clientele at the time of the rains (Ruel and Garrett, 2004). With between 25-50% of low and middle income country urban populations lacking access to clean drinking water and safe sanitation (Cohen and Garrett, 2010), access for the very poor in slum areas is estimated to be significantly higher. For example, in Korogocho slum in Nairobi the total ratio of toilets to population is 1:79 (including all types of toilets) (Norlén, 2011). In the majority of slums, access to clean drinking water is limited. Korogocho slum dwellers purchase water from kiosks and vendors who source water from illegal connections to the City Council water system using unclean plastic pipes. Some households close to the rivers use the highly contaminated river water (Norlén, 2011). In an Oxfam GB assessment in Makuru slums, Nairobi in 2011, 59% of households claimed that they had problems accessing clean water. ‘An area of particular concern for sanitation is the explosive growth of small towns. It is expected that about 75% of the population growth over the next 15 years will be in cities of less than 5 million inhabitants, with over 50% in cities of less than 1 million. This trend will increase the demand for sanitation infrastructure services in many places where such services are already in short supply and of poor quality, and where the institutional and financial capacity to provide them is weak’ (WSP, 2008). Awareness in preventative practices (washing hands, maintaining sanitary environments in the home etc.) in slum households is needed to ensure that children do not contract multiple diseases which weaken immunity and increase the risk of undernutrition. According to a study of nutrition-based interventions in 36 developing countries, disease control interventions reduced deaths of children between 12 months and 36 months of age by 3% and 2.6% respectively; and a reduction in the percentage of stunting by 3.7% at 12 months of age (DASRA and PIRAMAL, 2011).
‘Upgrades in slum household water and sanitation have not yet been evaluated exhaustively to establish the direct link to improved health outcomes. However, a study in Ahmedabad, India, shows that slum upgrading reduced waterborne illness from 32% to 14% and mosquito related illnesses from 25% to 10% which therefore serves as evidence of how slum upgrading can lead to improved health outcomes resulting in a positive change that can help to achieve the MDGs’ (Norlén, 2011). A study from ‘Pampas de San Juan, a peri-urban community in Lima, Peru,
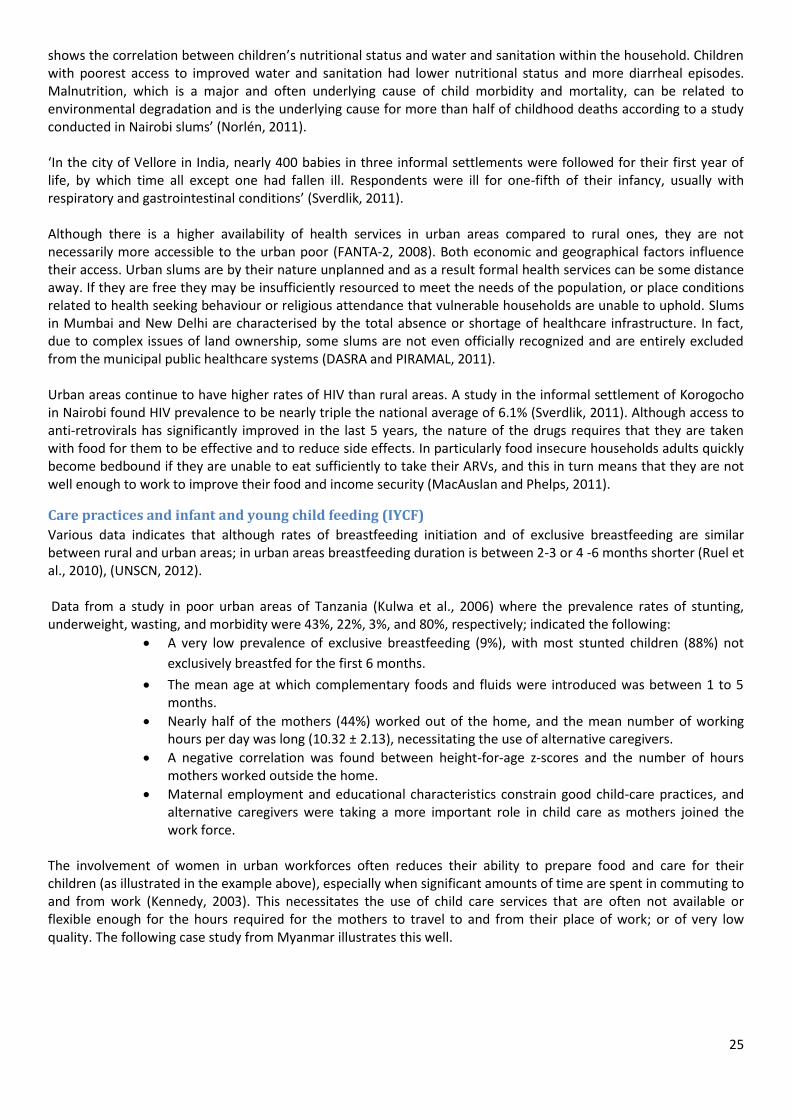
25
shows the correlation between children’s nutritional status and water and sanitation within the household. Children with poorest access to improved water and sanitation had lower nutritional status and more diarrheal episodes. Malnutrition, which is a major and often underlying cause of child morbidity and mortality, can be related to environmental degradation and is the underlying cause for more than half of childhood deaths according to a study conducted in Nairobi slums’ (Norlén, 2011). ‘In the city of Vellore in India, nearly 400 babies in three informal settlements were followed for their first year of life, by which time all except one had fallen ill. Respondents were ill for one-fifth of their infancy, usually with respiratory and gastrointestinal conditions’ (Sverdlik, 2011). Although there is a higher availability of health services in urban areas compared to rural ones, they are not necessarily more accessible to the urban poor (FANTA-2, 2008). Both economic and geographical factors influence their access. Urban slums are by their nature unplanned and as a result formal health services can be some distance away. If they are free they may be insufficiently resourced to meet the needs of the population, or place conditions related to health seeking behaviour or religious attendance that vulnerable households are unable to uphold. Slums in Mumbai and New Delhi are characterised by the total absence or shortage of healthcare infrastructure. In fact, due to complex issues of land ownership, some slums are not even officially recognized and are entirely excluded from the municipal public healthcare systems (DASRA and PIRAMAL, 2011). Urban areas continue to have higher rates of HIV than rural areas. A study in the informal settlement of Korogocho in Nairobi found HIV prevalence to be nearly triple the national average of 6.1% (Sverdlik, 2011). Although access to anti-retrovirals has significantly improved in the last 5 years, the nature of the drugs requires that they are taken with food for them to be effective and to reduce side effects. In particularly food insecure households adults quickly become bedbound if they are unable to eat sufficiently to take their ARVs, and this in turn means that they are not well enough to work to improve their food and income security (MacAuslan and Phelps, 2011).
Care practices and infant and young child feeding (IYCF)
Various data indicates that although rates of breastfeeding initiation and of exclusive breastfeeding are similar between rural and urban areas; in urban areas breastfeeding duration is between 2-3 or 4 -6 months shorter (Ruel et al., 2010), (UNSCN, 2012). Data from a study in poor urban areas of Tanzania (Kulwa et al., 2006) where the prevalence rates of stunting, underweight, wasting, and morbidity were 43%, 22%, 3%, and 80%, respectively; indicated the following:
A very low prevalence of exclusive breastfeeding (9%), with most stunted children (88%) not
exclusively breastfed for the first 6 months.
The mean age at which complementary foods and fluids were introduced was between 1 to 5 months.
Nearly half of the mothers (44%) worked out of the home, and the mean number of working hours per day was long (10.32 ± 2.13), necessitating the use of alternative caregivers.
A negative correlation was found between height-for-age z-scores and the number of hours mothers worked outside the home.
Maternal employment and educational characteristics constrain good child-care practices, and alternative caregivers were taking a more important role in child care as mothers joined the work force.
The involvement of women in urban workforces often reduces their ability to prepare food and care for their children (as illustrated in the example above), especially when significant amounts of time are spent in commuting to and from work (Kennedy, 2003). This necessitates the use of child care services that are often not available or flexible enough for the hours required for the mothers to travel to and from their place of work; or of very low quality. The following case study from Myanmar illustrates this well.
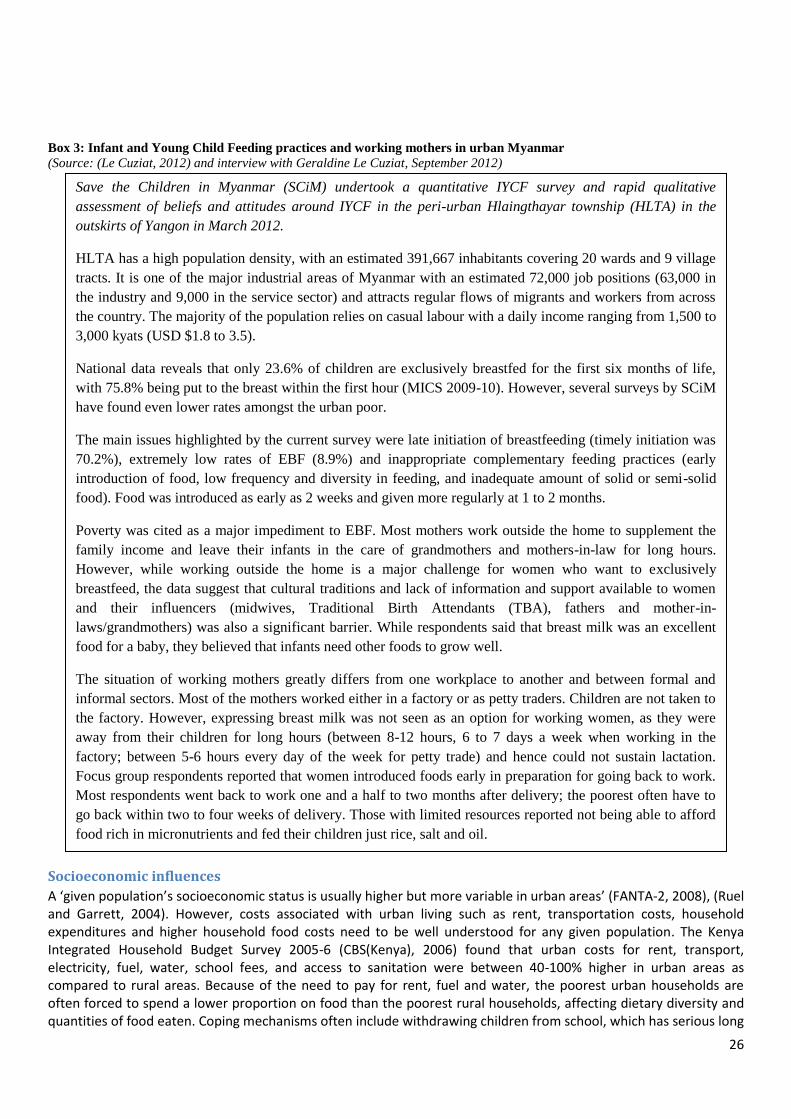
26
Box 3: Infant and Young Child Feeding practices and working mothers in urban Myanmar
(Source: (Le Cuziat, 2012) and interview with Geraldine Le Cuziat, September 2012)
Socioeconomic influences
A ‘given population’s socioeconomic status is usually higher but more variable in urban areas’ (FANTA-2, 2008), (Ruel and Garrett, 2004). However, costs associated with urban living such as rent, transportation costs, household expenditures and higher household food costs need to be well understood for any given population. The Kenya Integrated Household Budget Survey 2005-6 (CBS(Kenya), 2006) found that urban costs for rent, transport, electricity, fuel, water, school fees, and access to sanitation were between 40-100% higher in urban areas as compared to rural areas. Because of the need to pay for rent, fuel and water, the poorest urban households are often forced to spend a lower proportion on food than the poorest rural households, affecting dietary diversity and quantities of food eaten. Coping mechanisms often include withdrawing children from school, which has serious long
Save the Children in Myanmar (SCiM) undertook a quantitative IYCF survey and rapid qualitative
assessment of beliefs and attitudes around IYCF in the peri-urban Hlaingthayar township (HLTA) in the
outskirts of Yangon in March 2012.
HLTA has a high population density, with an estimated 391,667 inhabitants covering 20 wards and 9 village
tracts. It is one of the major industrial areas of Myanmar with an estimated 72,000 job positions (63,000 in
the industry and 9,000 in the service sector) and attracts regular flows of migrants and workers from across
the country. The majority of the population relies on casual labour with a daily income ranging from 1,500 to
3,000 kyats (USD $1.8 to 3.5).
National data reveals that only 23.6% of children are exclusively breastfed for the first six months of life,
with 75.8% being put to the breast within the first hour (MICS 2009-10). However, several surveys by SCiM
have found even lower rates amongst the urban poor.
The main issues highlighted by the current survey were late initiation of breastfeeding (timely initiation was
70.2%), extremely low rates of EBF (8.9%) and inappropriate complementary feeding practices (early
introduction of food, low frequency and diversity in feeding, and inadequate amount of solid or semi-solid
food). Food was introduced as early as 2 weeks and given more regularly at 1 to 2 months.
Poverty was cited as a major impediment to EBF. Most mothers work outside the home to supplement the
family income and leave their infants in the care of grandmothers and mothers-in-law for long hours.
However, while working outside the home is a major challenge for women who want to exclusively
breastfeed, the data suggest that cultural traditions and lack of information and support available to women
and their influencers (midwives, Traditional Birth Attendants (TBA), fathers and mother-in-
laws/grandmothers) was also a significant barrier. While respondents said that breast milk was an excellent
food for a baby, they believed that infants need other foods to grow well.
The situation of working mothers greatly differs from one workplace to another and between formal and
informal sectors. Most of the mothers worked either in a factory or as petty traders. Children are not taken to
the factory. However, expressing breast milk was not seen as an option for working women, as they were
away from their children for long hours (between 8-12 hours, 6 to 7 days a week when working in the
factory; between 5-6 hours every day of the week for petty trade) and hence could not sustain lactation.
Focus group respondents reported that women introduced foods early in preparation for going back to work.
Most respondents went back to work one and a half to two months after delivery; the poorest often have to
go back within two to four weeks of delivery. Those with limited resources reported not being able to afford
food rich in micronutrients and fed their children just rice, salt and oil.

27
term consequences in both rural and urban areas, but it could be argued that the impact is greater in urban households where often the only livelihood opportunity for the uneducated is to look for informal labour. Socio-economic influences on undernutrition are particularly high in urban areas and when investigated by IFPRI using DHS data from 11 countries, intra-urban differentials in child stunting were found to be greater than intra-rural differentials (Ruel and Garrett, 2004). Further analysis indicated that:
‘Results for the 11 countries analysed showed that odds ratios for urban/rural comparisons were relatively small (<3.3), indicating that the risk of being stunted for children living in rural areas of the countries studied is <3.3 times greater than for children living in urban areas.’
Rates of stunting were on average slightly lower in the most disadvantaged urban children compared to the most disadvantaged rural children.
‘The gap between the lowest and highest socio-economic status quintile in urban areas, however, was much larger (ranging from 2.8 to 10.2) than between the lowest and highest SES quintile in rural areas (all <3.3 except Brazil).’
Stunting risk for poor children was up to 10 times higher than that for the wealthiest group in two urban areas of Latin America (Peru and the Dominican Republic).
Inhabitants of slum or urban poor areas can feel marginalised and socially excluded not only due to their poverty and living circumstances but also their lack of rights, ‘voice’, social conflict, individualism and a breakdown of social capital (ACF 2010). However, this can also result in re-organisation of such communities and a level of empowerment such as the Kenya based Kibera Community Empowerment Project (KCEP)11 that has as one of its current initiatives: ‘Empowering slum dwellers with micro entrepreneurial skills with a view to establishing Income Generating Activities (IGAs) thereby making them self-reliant.’ An example where the analysis (using the Household Economy Approach in this example) of poor urban household expenditure led to a change in policy is illustrated in Box 4 below. This underlines the importance and potential role of rigorous analysis and its application in advocacy and policy change.
Box 4: HEA analysis of urban poor expenditure in Djibouti
(Source: Food Economy Group 2004 12
)
11
See: http://orgs.tigweb.org/kibera-community-empowerment-project-k.c.e.p 12
http://www.feg-consulting.com/core_issues/urban
28
Financial and food prices crisis
Urban livelihoods and their unique vulnerabilities to shocks such as price increases are often complex and inter-related because of their very heavy reliance on market forces (Brown, 2012).
Analysis (Ruel et al., 2010) indicates that ‘although the urban poor are clearly one of the population groups most affected by the current (and previous) [global financial and food price] crises, the rural poor, landless, and net buyers are in no better position to confront the crisis without significant suffering. The poorest of the poor are the ones who will be most affected, irrespective of the continent, country, or urban or rural area where they live. The magnitude and severity of suffering depends on the ability to adapt and on the specific nature, extent, and duration of the coping strategies they adopt.’ The authors lament the lack of data available on the impact of the recent (and past) food price rise and financial crisis on household food security and malnutrition and were forced to use simulations for some of their analysis. Acknowledging that some impacts may be staggered and take time to manifest themselves, they conclude their report by encouraging researchers and policy makers to invest in analysis of coping strategies to help design ‘triggers for action’ that would help prevent households from using more severe and irreversible strategies. Global demonstrations, remonstrations and, in places, violence in response to increases in food and fuel prices have been commonplace in the last 3 years. A number of international agencies such as GIEWS have food price data and analysis tools13. Research indicates affected households changing food consumption behaviour, such as purchasing cheaper staple food items (substitution foods) or food of inferior quality and lower quantity. In Nairobi in 2011, Oxfam GB found that as food prices escalated, poor households ate less often and restricted their foods to 3-4 foodstuffs.14. Food security, livelihood and nutrition factors of relevance to the urban poor that result in their being affected by the crisis include (Ruel et al., 2010):
13
http://www.fao.org/giews/pricetool/ 14
Ugali is a staple starch made from Maize (corn) and water and is eaten widely in east Africa. It is a very thick dish, not too
different to polenta and is eaten with meat and vegetable stews.
29
1. As urban households are reliant on cash, price rises have forced poor households to put more members into the job market (including children and pregnant/ lactating women). As women tend to dominate the informal sector, they are potentially one of the main groups affected.
2. Limited access to urban agriculture or to land in rural areas leaves them without any buffer that could provide essential nutrients if consumed and not sold.
3. Greater labour force participation of women outside the home has potential consequences for child care. Compared to rural mothers, urban mothers are less likely to take their children to work.
4. The availability of services but larger inequalities in access means that poor access to basic services such as child immunisation and mother and child clinics can be worsened by increases in fuel costs and the mother’s/ caregiver’s engagement in employment.
Responses to the crisis included young children being introduced to the family diet as quickly as possible to save time and money on purchase and preparation of weaning foods; and a reduction in the utilisation of routine preventive health care in services such as growth monitoring and immunisation. These changes in the use of health care services and feeding practices can quickly precipitate undernutrition in young children who are vulnerable to acute malnutrition and micronutrient malnutrition and to infectious diseases. Evidence of maternal and child nutritional status deterioration during this period was found:
Height-for-age and weight-for-age in children dropped by about 0.20 Z scores, Body mass index (BMI) in mothers decreased by 0.1 kg/m2, and birth weight decreased by ~71 g
In Indonesia, children maintained their average weight-for-age during the crisis but maternal wasting increased from 14 to 17% as they buffered the impact of the crisis by consuming less.
As fuel and food prices rose, street foods became more popular as their prices tend to increase more slowly and as they can be purchased in small quantities. Apart from the sanitary and food safety concerns related to these foods, there are also issues relating to food quality as street foods tend to be energy dense, containing high levels of fat, refined sugars and salt, but low in micronutrients. This is fuelling the ‘double burden’ of malnutrition in many contexts.
Further coping mechanisms used by poor households that have a significant influence on nutritional status included:
Reduction in diversification of diets due to household decline in purchase and consumption of non-staple foods: during the 1997-1998 crisis in Indonesia, per capita energy availability declined from 8323 kJ to 7704 kJ, with greater declines among poorer (9.6% decline) than wealthier (4.2% decline) households. The share of energy from cereals (mainly rice) remained constant, whereas the share from fish, meat, eggs, dairy, and fruit declined. Urban poor and rural landless women were disproportionately affected by the crisis compared with richer women and rural women with access to rice fields.
Use of non-food related coping mechanisms (such as child labour, women’s work, reducing spending on education, childcare, health care and basic needs) that can have dramatic consequences on child and family health, nutrition and well-being. Less is known about the impact of these coping mechanisms.
‘These changes in consumption patterns brought on by higher food prices will mean increased micronutrient deficiency disorders and a higher incidence of disease, child and maternal mortality, poorer school performance and, over time, reduced worker productivity. Because under these circumstances poor households often cut back on non-food necessities (such as health and education) and may also deplete assets and savings, food price increases can have multiple negative long-term impacts on household well-being and future human capital’ (Cohen and Garrett, 2010).
Nutritional status of poor urban children under 5 years of age As children are vulnerable to infection and their rapid growth rate is easily affected by poor health and nutrition, measures of child nutritional status provide a good picture of overall community health. In general both wasting and stunting is higher in urban slums than non-slums. Rates are generally either comparable or lower than in rural areas, but because population densities are so much higher in slum areas often the total number of affected children (and adults) is still very significant in slum areas. However, as most data sets are neither disaggregated for urban slum / non slum, nor compared to rural data, it is very difficult to provide many compelling examples. In the Nairobi slums high levels of stunting in children have been found to reflect household food insecurity, social care and the public health environment (Mohanty, 2010).
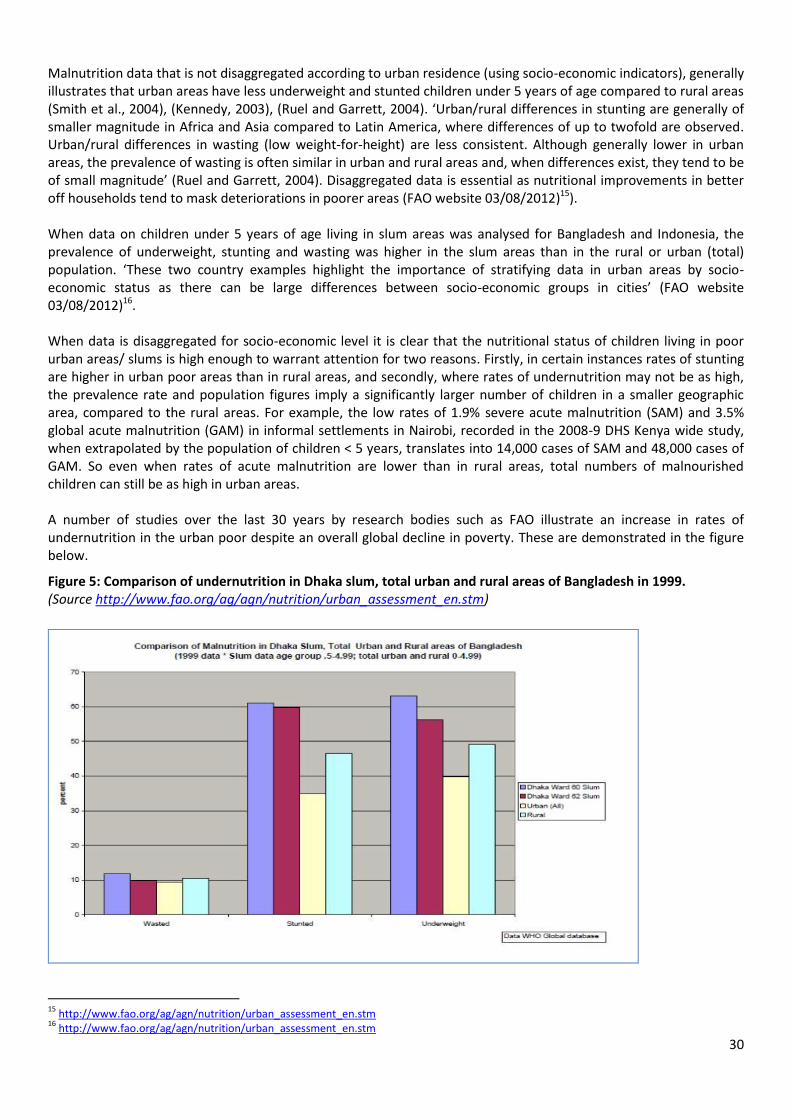
30
Malnutrition data that is not disaggregated according to urban residence (using socio-economic indicators), generally illustrates that urban areas have less underweight and stunted children under 5 years of age compared to rural areas (Smith et al., 2004), (Kennedy, 2003), (Ruel and Garrett, 2004). ‘Urban/rural differences in stunting are generally of smaller magnitude in Africa and Asia compared to Latin America, where differences of up to twofold are observed. Urban/rural differences in wasting (low weight-for-height) are less consistent. Although generally lower in urban areas, the prevalence of wasting is often similar in urban and rural areas and, when differences exist, they tend to be of small magnitude’ (Ruel and Garrett, 2004). Disaggregated data is essential as nutritional improvements in better off households tend to mask deteriorations in poorer areas (FAO website 03/08/2012)15). When data on children under 5 years of age living in slum areas was analysed for Bangladesh and Indonesia, the prevalence of underweight, stunting and wasting was higher in the slum areas than in the rural or urban (total) population. ‘These two country examples highlight the importance of stratifying data in urban areas by socio-economic status as there can be large differences between socio-economic groups in cities’ (FAO website 03/08/2012)16. When data is disaggregated for socio-economic level it is clear that the nutritional status of children living in poor urban areas/ slums is high enough to warrant attention for two reasons. Firstly, in certain instances rates of stunting are higher in urban poor areas than in rural areas, and secondly, where rates of undernutrition may not be as high, the prevalence rate and population figures imply a significantly larger number of children in a smaller geographic area, compared to the rural areas. For example, the low rates of 1.9% severe acute malnutrition (SAM) and 3.5% global acute malnutrition (GAM) in informal settlements in Nairobi, recorded in the 2008-9 DHS Kenya wide study, when extrapolated by the population of children < 5 years, translates into 14,000 cases of SAM and 48,000 cases of GAM. So even when rates of acute malnutrition are lower than in rural areas, total numbers of malnourished children can still be as high in urban areas. A number of studies over the last 30 years by research bodies such as FAO illustrate an increase in rates of undernutrition in the urban poor despite an overall global decline in poverty. These are demonstrated in the figure below.
Figure 5: Comparison of undernutrition in Dhaka slum, total urban and rural areas of Bangladesh in 1999. (Source http://www.fao.org/ag/agn/nutrition/urban_assessment_en.stm)
15
http://www.fao.org/ag/agn/nutrition/urban_assessment_en.stm 16
http://www.fao.org/ag/agn/nutrition/urban_assessment_en.stm

31
Where disaggregated data exists for poor urban slum dwellers, there is evidence that there are higher rates of low adult BMI then in some rural areas (see Bangladesh case study in annex 4). Women with a BMI<18.5 are more likely to give birth to low birth weight (LBW) babies.
32
Part 3: Comparing urban and rural poor nutrition in focus countries In this section, case studies from Bangladesh and Kenya are summarised. The full case studies can be found in Annex 4. The overall aim is to provide in-depth information relating to the food security and nutrition status of the urban poor and where possible, a comparison with the rural poor.
Case study: Bangladesh The case study describes the existing situation for the urban population in Bangladesh. The countries’ six largest
cities contain more than half of the national urban population and Dhaka alone absorbs nearly one-third. One third
of the urban areas are made up of slums, though not all of those living in slums are deemed to be poor. Overall,
urban expansion is explained by the domination of push, rather than pull, factors, such as a lack of job opportunities
or land erosion within rural localities.
Urban areas are described in terms of ‘slum’ and ‘non-slum’ areas. Slum residents live under the constant threat of
eviction, residing on land increasingly owned by the private sector, which is not motivated to spend money on
sanitation infrastructure. A situation illustrated by the fact that Dhaka, despite possessing a conventional sewerage
system, only provides sanitation services to 20% of its population through this means.
The health and nutrition situation is outlined in detail and highlights the issues of poor services, weak care practices
and the consequences on health status, especially for the urban poor.
Drawing upon numerous studies including The 2006 Bangladesh Urban Health Survey (ICDDR'B et al., 2008), the case
study highlights the double burden of malnutrition among adults as well as the scale of both stunting and wasting of
children in urban areas. Adult thinness (BMI < 18.5) is more common in the slums and although the percentage of
adults who are overweight is greater in non-slum areas, there remain a significant proportion of overweight adults in
the slums. A figure that is stated as being higher in woman than it is in men; 15% and 7% respectively.
Focusing on children under five, the case study draws upon Government and NGO studies to observe that stunting,
wasting and underweight rates are all higher in the slums (56%, 17% and 46% respectively in the Urban Health
Survey 2006) than non-slum areas (36%, 10% and 28% respectively). However, data from the Government of
Bangladesh and Helen Keller International’s Nutritional Surveillance Project found rural rates to be very similar to
those of urban poor children, with both tracking the same seasonal pattern.
The links between maternal and health and children’s nutritional status are examined and show that low BMI status
is positively correlated with LBW. One study is cited as stating the prevalence of LBW in Dhaka slums could be as
high as 46.4% (Arifeen et al., 2000). An association is also illustrated between women with low BMI status and the
elevated levels of both stunting and wasting in their children.
“Maternal height and BMI are strong predictors of childhood stunting and wasting and highlight the importance of
investing in the nutritional status of women and the female children. In slums, as expected, maternal education and
household wealth were strongly associated with childhood nutritional status (stunting and wasting)” (ICDDR'B et al.,
2008).
Care practices are inadequate in the slums. Whilst the timely initiation of breastfeeding has improved substantially in
all areas within Bangladesh, the slums remain the exception, which at 39%, is lagging behind the national average.
One evaluation of practices and constraints to improvements highlights the need within urban areas to improve the
social networks between women, especially first time mothers, to promote IYCF practices.

33
Elevated mortality rates are observed in the slums compared to non-slum locations, while UNICEF reports the under-
5 mortality rate to be almost 50% higher in the urban poor areas in comparison with rural areas17. This is likely
related to limited access to health facilities, as poor urban areas are poorly served, combined with the costs
preventing regular health seeking behaviour.
The CARE SHOUHARDO programme (Strengthening Household Ability to Respond to Development Opportunities) is
described. This is a rights-based programme focused on challenging structural imbalances and crucially employs a
multiple sector approach to improve health and nutritional status. The programme components include primary
health care support, nutrition supplementation, promotion of breast feeding and improved weaning practices as
well as a hygiene component, food assistance, community development initiatives and IGAs.
A decline in the prevalence of stunting by 30% was achieved in the targeted population in the 5-6 years between
baseline and endline surveys (2003-2009). Programme successes were considered to be the result of the holistic
approach and an evaluation found that women participating in IGAs within the programme were better able to
contribute to their household’s food security. These activities, combined with the messages of the benefits of
healthy diets and improved IYCF practices were deemed to have the potential to reduce stunting in the population.
For more details, deeper analysis and sourcing of information please see Annex 4.
Case Study: Kenya The case study starts by depicting the urban situation across Kenya then focuses in on Nairobi and Kisumu. Just
under half of the 12 million population is believed to reside in slums or informal settlements which lack basic
services and are not included within mainstream planning.
The main reasons given for elevated pressure within these informal settlements as well as deteriorating nutrition
and food security in recent years are given as the post election violence in 2008 and the rising cost of basic food
items. This in turn leads to the adoption of a greater variety of coping strategies, some of which can be illicit or illegal
in nature.
Within Nairobi, Mombasa and Kisumu, urban poverty and vulnerability affects 60% of the population. The case study
refers to reports examining types of employment and states that the rate of unemployment in slum areas is higher
than the national average at 26%. When gender is disaggregated then the situation for women is worse with
unemployment rates being up to five times higher.
The case study also raises the issue of the growing number of refugees within the urban centres. They will find it
more challenging to access formal employment and there is evidence of elevated fees and costs for refugee
communities. Importantly, they are largely invisible due to their reluctance to come forward and the fear of being
deported; resulting in diminished support and protection.
Health services present financial barriers that reduce access to care for the urban poor in particular. Whilst reports
tend to show that water is readily available in all urban settlements, water quality varies, as many of the sources are
illegal and poorly maintained pipes from the mains, resulting in around half of slum dwellers having no access to safe
and affordable drinking water and a fifth with no access to sanitation. Child health and care practices are outlined
showing that children in informal settlements are less likely to be vaccinated and more likely to be sick. Co-morbidity
is higher in urban areas and impacts negatively on infant and child mortality rates.
17
http://www.unicef.org/bangladesh/media_7455.htm
34
Slum dwellers are highly market dependent for all their basic needs and are therefore more vulnerable to price
increases, particularly food price increases that can have significant negative impacts on household food security and
nutrition of young children.
When looking at income practices the study discusses the most common micro-enterprises found in the informal
settlements; informal trading and jua kali or maintenance and repair are of particular importance. When comparing
income versus expenditures within informal settlements, the plight of the ‘very poor group’ is highlighted due to the
high proportion of their income spent on staple foods leaving this group extremely vulnerable to price increases.
Analysis of the 2008 economic down turn showed that prices had elevated by 63% whilst incomes had fallen by 21%
Stunting is higher in the informal settlements than the national average, and is associated with the predominance of
poverty in these locations, where households purchase 90% of their food. The difference in child malnutrition
between the wealthiest and poorest households is twice as great in urban areas (compared to rural) highlighting the
great inequities in urban areas (UNICEF, 2012).
Baseline data from Nairobi slums show that rates of both moderate and severe acute malnutrition are higher than in
non-slum areas and that the proportional rate of SAM is very high (1-2%) given that the total GAM rate is 3-8%.
Infant feeding practices are presented as weak with only 40% of infants under 6 months exclusively breastfed and
dietary diversity is shown to be inadequate.
Interestingly, only 7.5% of mothers had a mid-upper arm circumference (MUAC) below 23cm, and none had a MUAC
below 19cm, in a recent study (Schofield, 2009), contrasting very different levels of maternal nutritional status with
Bangladesh, where mothers appear to be much thinner.
When considering the response to the 2009 food crisis, the case study states that the government and civil society
actors did not have access to urban dedicated funding, demonstrating the lack of coherence in institutional donors
approaches. Demonstrating urban emergencies is challenging due to the lack of disaggregated data, though it was
seen that prices had elevated and cases of severe acute malnutrition had risen within health centres.
Finally, the case study presents the 3-year Nairobi Urban Cash Transfer Programme which commenced in January
2009, when the Government declared the country’s food crisis a national disaster. Oxfam GB and Concern developed
a joint proposal to help address the urban crisis when other actors were primarily focused on the semi-arid and rural
regions. The programme components included cash transfer, social protection as well as establishing emergency
indicators. Five thousand households received 1,500 Kenyan Shillings per month ($12.5 USD) meeting around 20% of
households’ immediate needs. During the course of the programme there was a graduation from regular cash
transfers to business entrepreneurship, skill building as well as linkages with micro finance institutions. Crucially, this
was seen as a success due to the close working relationship with Government authorities to develop an urban social
protection stream.
For more details, deeper analysis and sourcing of information please see Annex 4.
35
Part 4: Urban food security and nutrition programming This part of the report provides a review of past and current programmes that have directly or indirectly addressed food security or undernutrition amongst the urban poor and to assess the factors that contributed to their success or failure. Challenges faced in urban humanitarian programmes are also briefly discussed.
‘Given that urban settings are the future location for many humanitarian interventions, it is important to continue
nurturing an attitude of reflection, innovation, and flexibility in order to establish the most effective operational
response possible’ (Lucchi, 2012).
‘The fact that such strong socio-economic gradients are consistently found in urban areas of developing countries
implies that reliance on global average statistics to allocate resources between urban and rural areas could be
dangerously misleading, a point originally made in the late 1970s’ (Ruel and Garrett, 2004).
A number of programmatic challenges are faced in urban areas. ACF (ACF, 2010) summarises these well and lists the following:
Providing sustainable support to the most vulnerable urban populations, who have no capital or experience social exclusion
Integrating projects within an institutional and social context of “mass poverty” in low income districts (where the poorest people may not be visible and security must be managed).
Adapting projects to urban rules of governance by deepening institutional and social analyses.
Supporting rural-urban linkages in a post-crisis context, as it is now recognised that cities play a leading role in the development of rural areas.
Promoting micro-macro links, once the influence of policies and institutions on diverse livelihoods has been examined.
Encouraging public-private partnerships.
Should humanitarian programme approaches differ from development ones? Are rural
programmes very different to urban ones? There is widespread agreement that NGOs and the UN should support the response to urban emergencies…. And rather than focus on the ‘why’, address the ‘how’ (Lucchi, 2012). The humanitarian sector is faced with a central question as to ‘whether the humanitarian community is equipped to respond—can it adapt its architecture, strategies, and tools to ensure a more effective response in such contexts?’ (Pantuliano et al., 2012). Pantuliano goes on to say that ‘a lack of commitment remains within the humanitarian sector to move things forward, with many actors failing to invest sufficient time and resources in understanding the dynamics of the urban environment, the complex nature of urban vulnerability and displacement, and how they can respond best.’ A number of agencies (Oxfam GB, ACF, World Vision, IFRC, BRC) have begun to develop lessons learnt, field based evaluations, guidelines and training materials and are moving towards the formation of urban strategies to guide their work. ‘The fact that the determinants of malnutrition do not differ between urban and rural areas implies that the same program and policy frameworks and tools can be used in both areas’ (Smith et al., 2004). A number of programme implementation differences, between urban and rural contexts are outlined in detail in the CaLP ‘Cash Programming in Urban Emergencies’ toolkit18 (Cross and Johnston, 2011). A summarising distinction of urban programming contexts is available in Box 5 below and in more detail in Annex 2. Some of the key challenges that will be covered in more detail below include:
18
http://www.cashlearning.org/resources/library/251-cash-transfer-programming-in-urban-emergencies-a-toolkit-for-practitioners
36
Targeting mechanisms: because urban populations are more mobile, ‘hidden’ in the case of refugees and exhibit complex patterns of displacement and vulnerability. The poor may also be geographically scattered.
Geographical area identification and livelihood analysis (as urban livelihoods are very dependent on a variety of employment types many of which are away from home for both men and women)
Globally recognised triggers for slow onset urban emergencies using tools such as IPC19 (Integrated Phase Classification)20 or early warning systems such as FEWSNET21. (Although in theory IPC could be used in urban contexts, there are concerns over the validity of percentage GAM and mortality rates, which may not rise as sharply in urban contexts despite very high numbers of affected individuals).
Therefore, ‘urban program targeting, implementation, and operations will have to be tailored to take into consideration the specific nature of urban livelihoods and to ensure that interventions complement, rather than interfere with, the livelihood strategies of the urban poor’ (Smith et al., 2004). Lucchi notes ‘It is clear that interventions in urban settings have a different timeline and expected duration than a classic emergency response. Although planning for longer-term interventions, including multi-year plans of action and budgets, should occur, it is rarely the case right now’ (Lucchi, 2012).
Box 5: What is an urban disaster and how is it distinctive from the rural?
Source: (O'Donnell and Smart, 2009)
Humanitarian responses in urban areas: is there capacity and what are the next steps? Following recent urban disasters, the Haiti earthquake in 2010 in particular, much reflection and learning has focussed on humanitarian responses in urban areas. ALNAP has led on this producing ‘Meeting the Urban Challenge, Adapting Humanitarian Efforts to An Urban World’ and co-producing with PROVENTION; ‘Responding to urban disasters, Learning from previous relief and recovery operations’. These documents include a reflection on urban contexts (urban space and populations), influences in disasters, humanitarian responses, the challenges, adaptations and solutions and examples of good practice.
The ALNAP report (ALNAP, 2012) proposes a number of ‘next steps’ for the humanitarian community, such as22: 1. Establishing clear definitions of ‘urban crisis’ by agencies 2. Determining whether current levels of resources are appropriate, or need scaling up 3. ‘Stress-testing’ existing policies and standards to ensure that they are relevant and useful for urban disaster
engagement 4. Filling knowledge and skills gaps by training, recruitment, strategic partnerships or stand-by agreements
19
The Integrated Food Security Phase Classification (IPC) is a standardized tool that aims at providing a “common currency” for classifying food
security. Using a common scale, which is comparable across countries, makes it easier for donors, agencies and governments to identify priorities for intervention before they become catastrophic. (Source: http://www.foodsec.org/web/what-we-do/crises-and-emergencies/integrated-food-security-phase-classification-ipc/en/) 20
http://www.ipcinfo.org 21
http://www.fews.net 22
Citation taken from ALNAP on-line review: http://www.alnap.org/story/124.aspx
An urban disaster is unique in that it occurs in a dense and highly complex (physical and nonphysical) environment
that has adapted, formally and informally, to absorb large populations and a range of economic activities, leading to
distinctive features of:
scale
density
economic systems and livelihood strategies
resource availability
governance and public expectations
large informal settlements
likelihood for compound and complex disasters
potential for secondary impacts on rural or regional producers
37
5. Developing better methods and tools for urban assessment and analysis 6. Establishing a forum for sharing and dissemination of best practice and tools related to urban crises and
ensuring the dissemination of learning 7. Trialling new innovative approaches in ‘small’ urban crises to increase effectiveness when responding to
larger crises in the future.
ALNAP’s latest humanitarian urban lessons learnt paper23 highlights the following lessons: 1. Urban programme design requires clarity around entry and exit strategies and flexibility around
implementation 2. There is a need to work with local authorities and communities, and coordinate effectively 3. Assessment and targeting approaches that suit urban complexity should be applied 4. Cash-based programmes work well in urban areas 5. There is a need to work with local markets and private sector initiatives 6. Urban approaches to camps, shelter and housing are needed 7. Sectoral interventions must be ‘urbanised’ 8. New and existing media should be used for better communication, information gathering and accountability 9. relief and recovery actions need to build future urban resilience to avoid wasted investments
In addition the IASC has developed a strategy; ‘Meeting Humanitarian Challenges in Urban Areas’ (IASC, 2010) that points out the inadequacy of urban expertise and technical skills among first responders. The report states that ‘the inadequacy contributed to the reduced effectiveness of relief assistance’. Gaps in technical knowledge are highlighted with particular reference to land ownership and tenure issues; urban food and nutrition security are identified. The document outlines IASC strategic objectives and action plans. One such strategy: ‘Restore Livelihoods and Economic Opportunities as a Priority, starting in the Emergency Phase for Expedited Early Recovery in Urban Areas’ recommends developing guidance on supporting food and nutrition security in post-crisis urban and peri-urban areas24. The use of humanitarian indicators, such as mortality rates, in urban settings is inappropriate and requires review. An example of its shortfall is demonstrated in this example (Lucchi, 2012): ‘In urban settings… a problem is that mortality can be inadequate as a prime indicator to monitor the magnitude of the crisis and the effectiveness of the assistance. Studies have shown that, in protracted situations, using an emergency threshold to establish a benchmark for the crisis might not be appropriate. These indicators often show only moderate elevation of mortality, but it is protracted and spread out over a large population. In these situations, the excess death tolls might better reflect the magnitude of the crisis while evolution of mortality rates might indicate the trend. It is essential therefore to search for alternative ways to measure and monitor mortality and to identify and use alternative indicators.’ This also applies to use of acute malnutrition rates for defining the severity of a situation: a seemingly ‘low’ rate may disguise a large total number of affected children and adults due to high population density in urban areas (as illustrated in the Nairobi case study in Part 3 and in Annex 4).
Urban food security and nutrition orientated programmes implemented to date
Slum/ Urban poor programmes funded by The World Bank
The World Bank is funding a number of ‘slum upgrading’ programmes, ‘community driven development and urban services for the poor’ and ‘informal settlement improvement’ projects in several countries including Niger, Kenya, Yemen, Bangladesh and Indonesia). These projects (WB, 2004), (Baker, 2008) often include a number of key activities such as
Improving urban infrastructure, waste management and sewerage systems and access to potable water and electricity in urban centres
Improving urban transportation
Capacity building for local government
23
awaiting publication; information from correspondence with author, David Sanderson 24
Action Leads for this recommendations are: FAO and WFP; Support: UNCT/HCTs and NGOs
38
Improvements in housing quality
Improving service delivery and access to social programmes (health and education and child day-care)
Addressing land tenure issues
Generating employment opportunities through vocational training and access to credit,
Implementation of legal and regulatory reform on land policy, regularization programs and inclusive
policies
Organising slum residents to enable their engagement in their community, local planning, decision
making activities and self-governance
The impact of these programmes on the undernutrition rates of the urban poor children is not clear as the reduction of undernutrition in children is not a target of these programmes. In fact there is a lack of rigorous evaluation of these programmes, a fact that the World Bank is aiming to reverse with a meta-evaluation of all slum/ urban poor programmes. In general, however, some of the benefits attributed to slum upgrading from existing evaluations in the Philippines, Indonesia, and Pakistan include:
Improvements in livelihood opportunities through construction and small businesses selling materials
Improvements in environmental, health, and safety conditions
Better access through improved footpaths and roads
A reduction in crime following street lighting installation and the provision of recreational centres and youth training
Providing land tenure security provides an incentive for owners to invest in structural improvements in their homes
In some cases community groups became proactive in identifying other sources of funds for the communities, and became involved in planning and implementation.
A review states that ‘overall, comprehensive upgrading programs have enabled residents to develop and advance themselves, enhance their incomes, hone their leadership skills, and enjoy more of the same personal benefits that ordinary citizens in other communities have’ (Baker, 2008). The World Bank Group report (Baker, 2008) gives a good overview of World Bank funded programmes and their successes… for example those in shelter (which includes low income housing) have been heavily funded (more than half of the total urban lending) and much appreciated with great demand for more investment. However, it is not completely clear whether these programmes reached the poorest households. See Annex 5 for an example of a World Bank Urban health and nutrition programme in the Philippines that met significant challenges. The evaluation of the project indicated that the ‘Coverage of health services for the urban slums did not reach high enough proportions to significantly change health status in these communities’ (WB, 2001). The project was affected by a number of mismanagement and procedural systemic problems that affected its ability to deliver the projected outcomes. As some of these challenges are typical for large scale urban programmes they are listed below and include:
Government and staff turn-over. From 1994 to 2001, there had been 7 Secretaries of Health, 2 national and 2 local elections and 1 national upheaval. Changes in leadership and policies greatly affected the project. Also fast turnover of project staff occurred.
Poor project management was the single most important reason for the lack of project performance (until the mid-term review). The problems identified were:
o Lack of system of accountabilities and lack of consequences for non-performance; o Poor leadership and lack of direction; o Absence of effective management systems; o Poorly defined and developed capabilities to execute job functions.
Procurement bottlenecks resulted in the inability to provide the project with drugs and medicine and equipment in a timely manner. This was attributed to: (1) bottlenecks and delays in DOH internal procurement system; (2) lack of understanding and non-familiarity with procedure between all the stakeholders.
Social protection systems
Safety net programmes are targeted to the poor or those vulnerable to poverty and shocks. They are particularly important in urban areas given the greater reliance on the market economy which makes households more
39
susceptible to macroeconomic shocks. While safety net programmes have been reviewed in great detail, there is limited analysis on issues related to the design and implementation of these programs in urban areas (Baker, 2008). There is enormous momentum around social protection as its role in reducing poverty and inequality is acknowledged25. The concept of the ‘social protection floor’26 is widely recognised and was accepted at various international, regional and national conferences over the course of 2009 and 2010 including the G20 and MDG summits27. In October 2010 the newly reformed UN Committee on World Food Security (CFS) requested its High Level Panel of Experts on Food Security and Nutrition (HLPE) to conduct a study on social protection, in particular to assess: ‘ways to lessen vulnerability through social and productive safety nets programs and policies with respect to food and nutritional security, taking into consideration differing conditions across countries and regions. This should include a review of the impact of existing policies for the improvement of living conditions and resilience of vulnerable populations, especially small scale rural producers, urban and rural poor as well as women and children. It should also take into account benefits for improving local production and livelihoods and promoting better nutrition’. The report includes a number of recommendations and endorsements for social protection including: ‘Within development policies, social protection is therefore gaining attraction as a means to mitigate vulnerability and to tackle food insecurity. Comprising a range of potential measures for managing risk and vulnerability and complementing poverty reduction initiatives, social protection is ideally suited to dealing with volatility and uncertainty.’ Indeed, the potential of SP to tackle food insecurity and malnutrition has been recognised The potential to utilise social protection systems to reach many poor households in scaling up an emergency cash response exists. The potential has been recognised by the World Bank which has ‘recently initiated a project to develop preparedness in existing social safety nets and low income countries which will look at what is required to equip social safety nets in terms of systems, monitoring and evaluation, targeting and payments. The aim is to design a ready-made package with software and decision-trees to ensure that social safety net programmes can scale up and decisions can be made faster in times of disaster. The Bank is already providing technical assistance in this area in Tanzania, Ethiopia and the Caribbean’ (Austin and Frize, 2011). Latin American countries have used Conditional Cash Transfers (CCT) to reduce poverty and malnutrition since the 1990s (first used by Brazil and Mexico). CCT programmes provide a pre-determined value of money (or in-kind item such as food or nutritional supplement) at regular and predictable intervals to the mother/ primary care giver of targeted households (usually based on socio-economic criteria) who has to agree to adherence to a number of requirements, such as school attendance, health visits, and activities to promote child and maternal health. As preschool nutrition investment and improvements lead to reduced risk of infant and child mortality, morbidity, and societal welfare, improving the nutritional status of preschool children is an important policy objective in some CCT programmes. Although the majority of the CCTs have had a positive impact on poverty, education and health outcomes, impact on the nutritional status of pre-school children has been more ‘mixed’ (Hoddinott and Bassett, 2008). CCT success and effectiveness depends on a number of factors including the quality of the design (and targeting mechanisms used), and the ‘synergy between the chosen design and the desired objective’ (Jaramillo, 2011). The World Bank, DFID, the Inter-American Development Bank, AusAid and similar donors have strongly encouraged the adoption of CCTs in many low and middle-income countries and CCTs have received widespread attention from the media. A number of social protection system reviews have taken place in the last years. However, few focus on the impact of social protection on urban poor malnutrition. One such review of Indonesia’s social protection system (Holmes et al., 2010) reflects on the role of social protection in tackling food insecurity and under-nutrition in Indonesia with a gendered approach. The following conclusions relate to food security and nutrition:
25
http://www.social-protection.org/gimi/gess/ShowTheme.do?tid=1321 26
Social protection floors are nationally defined sets of basic social security guarantees that should ensure, as a minimum that, over the life
cycle, all in need have access to essential health care and to basic income security which together secure effective access to goods and services defined as necessary at the national level. 27
http://www.social-protection.org/gimi/gess/ShowTheme.do?tid=1321
40
‘Current social protection provision which does address food security – e.g. Raskin28and CCTs – needs to be more efficient to achieve these goals. It also needs to take a gendered approach, beyond simply targeting women and/or reinforcing traditional gender roles and responsibilities. Enhancing the efficiency of the Raskin programme to better tackle gender and life-cycle risks, for instance, could entail targeting pregnant and nursing women and young children who are particularly at risk of malnutrition, supplementing Raskin rice with additional nutrients, such as vitamin A or fortifying the rice with nutrients. Also urgent are complementary programmes to enhance women’s access to and control over productive assets, to provide equal opportunities and pay in the labour market and to support women’s empowerment at the household and community level.
As malnutrition is a multifaceted problem, and as income growth is not the major determinant of improved nutrition, relevant policies and programmes need to more effectively integrate strategies to tackle other crucial factors. These include parental education (both mothers and fathers) and behavioural change support; awareness-raising activities for schools and communities; improved sanitation and hygiene measures; food fortification; and gender empowerment measures. Particular attention needs to be paid to stunting, given its chronic nature, its lifelong impact and its intergenerational transfer.’
Review of social protection systems in Latin America
A review of four social protection programmes that had a perceived impact on pre-school nutritional status (Hoddinott and Bassett, 2008) included:
1. Brazil’s Bolsa Alimentação (BA),
2. The Programa de Asignación Familiar – Fase II (PRAF-II) in Honduras,
3. Mexico’s Programa de Educación, Salud, y Alimentación (PROGRESA) that became Oportunidades,
4. and Red de Protección Social (RPS) in Nicaragua.
The researchers took into consideration the way in which these programmes, which target both rural and urban areas, address constraints to good nutrition outcomes among children and, where there have been difficulties in implementation. In summary they state: ‘broadly speaking, the RPS in Nicaragua contained the most extensive set of program components that directly affect nutritional status: cash transfers to mothers, micronutrient supplements for children; the transmission of knowledge and growth monitoring and promotion. PROGRESA also contained all four components and while it provided cash transfers, the initial delivery of benefits was somewhat less timely and the coverage somewhat less good (particularly the supplement) than that of RPS. In summary29:
CCTs PROGRESA in Mexico and RPS in Nicaragua have improved child height and the report notes ‘there are ‘sizeable’ economic benefits associated with this as PROGRESA’s impact on increased height increases lifetime earnings by 2.9% via the consequences of this for physical productivity in adulthood’.
‘RPS had a powerful impact in terms of improving pre-schooler height. Compared to children in control localities, stunting in RPS targeted children fell by 5.3 percentage points among children aged 0 to 5 years in treatment communities. The prevalence of children considered underweight also fell. These effects are larger than those observed for PROGRESA, although this may partly reflect the fact that the RPS impact is measured two years after the introduction of the program, as opposed to one year in the case of PROGRESA.’
Box 6: Mexico’s Oportunidades program (previously known as Progresa)
Source: (Baker, 2008)
‘Mexico’s Oportunidades program is one of the better known safety net programs explicitly designed to reach the
urban poor. This is a conditional cash transfer program which originated as Progresa, (which mainly operated in rural
areas). The program provides cash payments to eligible families, conditional on regular school attendance and regular
use of preventive health services. As the program was expanded to urban areas in 2002 it faced a number of challenges
such as targeting and adapting the program to the urban poor. For example, working mothers did not join or dropped
out of the program, because of time conflicts of activities with work hours.
28
Two key social protection programmes include the national Raskin rice subsidy programme and the smaller Family Hope Programme (PKH)
conditional cash transfer (CCT). 29
Hoddinott and Bassett 2008 want the following caveats considered: (a) different evaluation studies were drawn on and each study used a different methodology (b) the interventions in the countries were not the same
41
While the program benefits were the same for urban and rural areas initially, the impacts on households differed. For
urban areas, the impact on school enrolments, graduations and drop out were much smaller than in rural areas. This is
linked to the higher opportunity costs in urban areas, and the high costs of getting to school (which was reported to
absorb about 80% of the school grant). One of the biggest (and unexpected) impacts for the urban beneficiaries was
home improvements such as regularising property, acquiring infrastructure service, and upgrading construction
materials. This is attributed to the fact that the irregular status of a home and its poor quality is perceived as a much
greater source of vulnerability in urban than rural settings.
There are several issues in designing and implementing such programs in urban areas including the challenges of
targeting and the relative vulnerability of youth, aged 15-24. Geographic targeting can be difficult given the
heterogeneity in welfare even in small areas such as slums which can be socio-economically mixed. Means testing is
also difficult as vulnerable households may have assets but fall into poverty more easily than in rural areas. Urban
households also typically lack property rights which may exclude them from eligibility in social programs. Poor urban
youth are a particularly vulnerable group given typically higher rates of unemployment, and exposure to crime and
violence, HIV/AIDS and other sexually transmitted diseases. Programs such as conditional cash transfers and job
training can help to minimize risks for this group, and facilitate their entry into the labour market during these
vulnerable years.’
The impact of ‘Oportunidades’ on malnutrition and health of children
In an evaluation of Mexico’s conditional cash transfer programme, Oportunidades (where targeted families received cash transfers, a fortified food (targeted to pregnant and lactating women, children 6–23 months, and children with low weight aged 2–4 years), and curative health services, among other benefits, on the growth of children, 24 months of age living in urban areas), 2 years after the initiation of the programme, the researchers found the following:
There was no overall association between programme participation and growth in children 6 to 24 months of age.
Children in intervention families younger than 6 months of age at baseline grew 1.5 cm (P<0.05) more than children in comparison families, corresponding to 0.41 height-for-age Z-scores (HAZ) (P<0.05). They also gained an additional 0.76 kg (P<0.01) or 0.47 weight-for-height Z-scores (P<0.05).
Children living in the poorest intervention households tended (P<0.05, P<0.10) to be taller than comparison children (0.9 cm, 0.27 HAZ).
In summary, Oportunidades, with its strong nutrition component, was considered an effective tool to improve the growth of infants in poor urban households (Leroy et al., 2008). From a gender perspective, the following was found (Latapí and González de la Rocha, 2008):
The narrowing of the gender gap in schooling among the young has been promoted.
Poor mothers have been given some modest measure of improvement in their ability to manage their household expenses.
Poor mothers are encouraged to participate in community or collective efforts as more autonomous actors.
Women are now perceived (by men) to have the support of powerful actors (the state, teachers and doctors) to carry out certain actions in their communities and households.
Women participate in the programme because they see a net benefit mainly for their households, but also for themselves (as they find it easier to have monetary resources and access to health care), but not because they are forced to do so.
The authors continue to say that although there was no impact in reducing gender disparity in job attainment (at the time of the analysis), this could be attained via the improvement in schooling and the narrowing in the gender schooling gap specifically. Some key challenges identified included the fact the majority of beneficiaries were mothers. In addition, female-headed households were at a disadvantage in both joining and remaining in the programme. It was concluded that
42
the programme works best among bi-parental nuclear households where the mother does not perform full-time extra-household work (Latapí and González de la Rocha, 2008).
Conclusion: Social protection and CCT impact on poverty and malnutrition
Available evaluations agree that CCTs as part of social protection systems can have a positive impact on poverty and nutrition. However, the focus of these programmes tends to be on poverty reduction as opposed to a specific intent to improve nutrition. In another paper (Garrett et al., 2009) it is suggested that programmes could increase their impact on nutrition through modifications in design and operation. The author reemphasises the fact that the causes of malnutrition are multi-sectoral therefore a nutrition focused CCT requires a ‘holistic perspective to place a CCT firmly within an overall strategy for social protection or reducing malnutrition. Such a perspective would identify needs but also comparative advantages of the different agencies and actors that need to be involved’ (Garrett et al., 2009). Reflections (Hoddinott and Bassett, 2008) indicate that CCT programmes could be better designed by considering the following:
To address stunting, ‘improved counselling sessions with age-specific messages highlighting simple, but critical actions parents can take to promote healthy child growth’ and use of take-home materials to reinforce these messages.
The importance of hygiene and sanitation being emphasised for example: hand-washing messages so that soap is used at critical moments; hygienic food preparation; safe disposal of child faeces.
To remedy micronutrient deficiencies, the provision of supplements such as iron and zinc for young children, iron-folate and multiple micronutrient supplements for pregnant women.
To address both stunting and micronutrient deficiencies, explore the use of nutritional supplements for children and pregnant women with low BMI and dispersible micronutrient supplements for children 6-24 months because these supplements can both increase micronutrient intake and promote the timely introduction of complementary feeding.
Some suggested programme improvements include:
The rationale and use of supplements/ actions has to be clearly explained to mothers/ caregivers. In Nicaragua mothers were hesitant to give their children iron supplements, not having understood the reason to do so
CCT conditions should be tied to interventions that have a proven record in overcoming the major nutritional problems manifested in the programme area, which in Latin America and the Caribbean are stunting and iron-deficiency anaemia.
These recommendations highlight the importance of good management and interagency collaboration, often a challenge in urban poor programmes (see World Bank example from Indonesia in Annex 5) and Government complicity and ‘buy in’, thus enabling supply-side obligations with quality services. This in turn facilitates beneficiary fulfilment of programme conditions. To be sure of the impact of cash transfers on acute malnutrition in emergencies, there needs to be multi country research in both urban and rural contexts (Bailey and Hedlund, 2002).
Urban and peri-urban agriculture (UPA)
Urban agriculture can be an important income source, especially in secondary cities and peri-urban areas; micro-gardening can thrive in situations where households have little more than a terrace for placing a container garden (FANTA-2, 2008). An increasing amount of exposure and interest in urban UPA has occurred in recent years. Websites such as the Resource Centres on Urban Agriculture and Food Security (RUAF)30 and the FAO’s Food for the Cities31 are playing a key role in disseminating research, providing technical support, good practice and lessons learned to a wide number of stakeholders. However, there appears to be a lack of data on the impact of UPA on the undernutrition rates of poor urban slum children (apart from Kampala; see below).
30
http://www.ruaf.org/node/512 31
http://www.fao.org/fcit/upa/en/
43
UPA is a significant livelihood strategy and food source in Sub-Saharan Africa. For example, in East Africa, on average around a third of urban dwellers are engaged in agriculture, whereas in West Africa, reported figures vary from more than 50% in Dakar, Senegal, to 14% in Accra, Ghana. As much as 90% of leafy vegetables and 60% of milk sold in Dar es Salaam, Tanzania, is produced in and around the city. Similarly high levels of urban and peri-urban milk production are cited for Nairobi, Kenya, and Addis Ababa, Ethiopia (Smith and Prain, 2006). ‘Urban and peri-urban agriculture is a source of employment and income, has the potential to improve nutrition and food security in disadvantaged urban residents, and significantly contributes to the urban fresh food supply chain. Furthermore, UPA allows for saving on energy at various levels of the food chain including packaging, transport, storage and distribution that will affect the final retail price of the food commodities. UPA is still an informal sector that has yet to be integrated into urban planning, but should become a key component within national food security programmes, agricultural policy and development strategies’ (UNSCN, 2012).
Although it is widely understood that UPA’s main benefit is nutrition, there are a number of concerns, including bacteriological and toxic contamination of soils and crops, air pollution also affecting crops, and the transmission of disease from livestock to humans. Evaluations of UPA programmes have shown the following (Smith and Prain, 2006):
Nutrition and employment benefits: studies in Kampala, Uganda, and Kigali, Rwanda, have shown positive correlations between food production and improved nutrition, owing to higher and more stable access to food virtually throughout the year. Poor consumers in Yaoundé, Cameroon, depend on indigenous leafy vegetables, produced almost exclusively in the urban inland valleys for their micro-nutrients
Women are able to care better for their children when engaged in urban agriculture. Albeit dated, research undertaken by IFPRI (Maxwell, 1998) provides evidence of the positive linkages (especially with regards to child stunting (height-for-age)) between urban agriculture and nutrition in children under 5 from studies in Kampala, Uganda. The report outlines a number of necessary policy implications including:
No more social safety net cuts (that had taken place as part of the Structural Adjustment Policies)
Support informal safety nets (such as agricultural production that emerged due to the above cuts)
Support with land tenure issues Although an important practice, UPA is not available to all urban slum dwellers, especially in inner city slums which lack space, security and access to sufficient affordable water.
Childcare support programmes
Due to the influence of childcare practices on child wellbeing and nutrition, programmes that support urban poor working mothers are required. ‘Effective programmes and policies are urgently needed in developing countries to support working women, especially women with young children who have limited or no access to extended family networks or other affordable, yet reliable substitute child care options.’ (Ruel and Garrett, 2004). Childcare practice is often overlooked in emergency and development responses with the reflection, ‘what is the impact of the proposed programme on childcare practice?’ rarely asked.
An example from India – what works?
‘Over the past decade, national and local non-profits have generated a deeper understanding of the current gaps within the community and in the public healthcare system that impact malnutrition. For these non-profits, the key challenge is to educate, empower and mobilize communities in urban slums with best practices in early childcare and build strong linkages between communities and the public healthcare system’ (DASRA and PIRAMAL, 2011). DASRA evaluated over 100 programmes in urban maternal and child health and identified six common interventions that are both scalable and significantly improve child health and nutrition. These were:
To create sustainable ways of ensuring that communities are more educated about home-based care practices as well as more proactive in their health seeking behaviour.
To ensure a systemic shift in prioritising child health and nutrition within the public system.
To create a policy environment that is in tune with the realities of urban slums, and thereby enable effective implementation of policy.
44
To link communities with the appropriate points in the public healthcare system and thereby better leverage the existing system without overburdening hospitals.
To inform policy, create successful pilots and be the basis for roll out and scaling up of government schemes.
To provide child health and nutrition services in marginalised slum communities where the public healthcare infrastructure is inadequate or ineffective.
Working with existing systems and services in urban areas MSF has identified a number of key operational challenges in responding efficiently to the needs of the urban poor. These include: ‘appropriate assessments; measurable indicators of vulnerability and impact; pertinent operational approaches and medical strategies; adapted security management; and responsible closure of activities’ (Lucchi, 2012). Questions over the level of engagement that MSF should have with existing health systems have been paramount. ‘In all of the urban areas where MSF has chosen to intervene, there is some level of health care provision available to the general population, and often this is a developed multi-level system—from primary to tertiary level care—involving public and private services. In most of these settings, there are existing specialised Ministry of Health (MoH) structures that offer possibilities for patient referral. Their strengthened presence in many urban settings underscores the importance and the opportunity for humanitarian organisations to work in partnership with them rather than in isolation.....in order to address existing gaps in the provision of health care, while ensuring ownership, avoiding duplication’. However, ‘the very same health system also can create intentional or unintentional barriers to care, such as certain patient groups not being granted access to free health care, or a lack of good quality care in referral structures. These are potential areas of concern that necessitate in-depth analysis when trying to develop an appropriate intervention strategy’ (Lucchi, 2012).
Challenges faced: (1) Targeting Targeting in urban areas is ‘especially challenging for humanitarian agencies because of the high population density and overwhelming number of people in need of assistance and scarce humanitarian resources, such as funding, necessitate additional levels of selection and prioritisation’ (Cross and Johnston, 2011). The ALNAP and PROVENTION paper (O'Donnell and Smart, 2009) reviews various targeting methods and lists ‘Advantages and disadvantages of various targeting approaches in urban emergencies’ based on the experiences of various agencies.
High population densities, lack of homogeneity and a general lack of communities based on residence, create significant difficulties for the targeting and distribution of emergency support and longer-term governance-related service provision. A number of targeting methodologies have been tried in urban contexts, from community based targeting, to score card systems to proxy means test (the latter is best suited to larger slow onset or development programmes). None of these approaches is infallible, and in order to avoid a higher than acceptable level of exclusion error greater resources are required in terms of people, coordination, preparedness and time to ensure the best possible targeting using the method selected for that context. CALP’s Cash Transfer Programming in Urban Emergencies Toolkit (Cross and Johnston, 2011) highlights the key issues related to different methodologies. A review of urban programming by humanitarian agencies (Lucchi, 2012) points to issues of NGOs getting it wrong when it comes to urban livelihood programmes that target displaced populations and refugees. This is for various reasons including:
a) Programmes are poorly designed (shelter programmes that put the refugees far from sources of work for example).
b) Inadequate reflections on refugee assimilation and host family integration.
45
Identifying vulnerable groups in an urban setting
‘Although urban settings allow for potentially easier physical access to certain locations, actual access to specific vulnerable groups and identification of victims of violence or neglect within the larger general population remain challenging. For example, communities may be less structured and less organised than in rural settings (for instance, a lack of key traditional leaders or community-level organisational structures), and community members may be less accustomed to interacting with community workers’ (Lucchi, 2012).
Lucchi continues to recommend that agencies should: a) Be mindful of the limitations of existing and available data and should work towards obtaining more focused,
detailed information on specific populations or neighbourhoods, to avoid simplistic assumptions about the population’s needs.
b) Review traditional vulnerability categories used (e.g. disabled, elderly, women and children) and not assume that these are appropriate in urban settings as these groups (and others) are exposed to additional variables, such as economic difficulties, physical space, and social cohesion.
c) Be aware that acquiring such data will require additional analysis and potentially collaboration with academic institutions or others that have the ability, experience, and skills to analyse the many demographic characteristics of an urban setting
The ALNAP and PROVENTION paper (O'Donnell and Smart, 2009) gives ‘Tips for addressing needs of vulnerable groups (including street children) during disaster response’ based on the experiences and lessons learned of various agencies. In addition, ACF’s ‘Identification of vulnerable people in urban environments’ (ACF, 2010) includes programming challenges and advice.
Challenges faced: (2) Analysis
‘Needs analysis must be accompanied by a comprehensive analysis of the political economy of the slums and
informal settlements because they are essential to identifying and addressing the drivers of vulnerability, even
though such analysis will be resource-intensive and costly, and will face logistical and political challenges’
Source: (Pantuliano et al., 2012)
Undertaking quality analysis of the urban context has proven a challenge to agencies, especially those that are new to the context or in the midst of planning a humanitarian response when the timeframe to undertake detailed analysis is very short. Traditional assessment approaches rely on some form of geographical homogeneity in livelihoods and socio-economic status, such as the existence of community representation where families have known each other for generations. This is often not possible in urban poor areas that are commonly characterised by high tenancy turnover rates and fragmented communities. Furthermore, the population defined as vulnerable may be, dispersed and may or may not want to be identified and assisted (Lucchi, 2012). ‘Employing the classic measurement of magnitude of humanitarian consequences as a basis for decision-making in urban contexts may not be the most appropriate strategy; more nuanced approaches, using new and adapted tools, appear to be necessary’ (Lucchi, 2012). Knowing where to focus in a city of several million slum dwellers is a daunting proposition. OCHA and UNHABITAT are employing GIS mapping analysis which could be informed by text messages from the slums about rates of crime, disease outbreaks, incidence of fires etc, to help focus resources to areas that need assistance, and also to build up a map of slum vulnerability. Equally DRR risk mapping within communities quickly identifies vulnerable areas within slums, and ways in which the community can be assisted in building resilience against further shocks. In response to such difficulties a number of agencies have undertaken reviews of existing urban analysis tools (Creti, 2010) and developed assessment guidelines and approaches (ACF, 2010) (Cross and Johnston, 2011). Examples of challenges and potential solutions to understanding nutrition in an urban context that Creti highlights include:
Sampling is more difficult in urban areas due to the large size of samples, lack of information on the actual population and complex arrangements of households that differ from rural villages (based on a roughly circular group of dwellings).
46
Specific guidance on urban sampling for nutrition surveys is available on the web32, but is complex and remains a topic of discussion amongst practitioners.
It is recommended to focus nutrition analysis on the most vulnerable areas of the city in order to avoid average numbers masking specific nutritional problems amongst the poorest. The choice of the vulnerable areas can follow criteria and indicators as in the urban mapping.
In food security assessments, secondary information from health clinics and local doctors can help to highlight specific nutritional problems.
Understanding access to services and basic needs such as potable water also requires attention. In an urban context there is a lot of integration and interconnectedness between households and these may be around services and employment more than social networks. In most poor urban areas, households do not own or have access to individual water points and sanitation services (Lucchi, 2012).
When undertaking analysis, attention must be paid to land tenure and informal access arrangements for example: ‘Unless carefully planned, interventions designed to build or improve infrastructure can also have undesired effects, such as speculation over property values that end up expelling current residents’ (FANTA-2, 2008).
Additionally, understanding rural-urban linkages is important. A recent study by ACF (Vaitla, 2012) found that ‘In areas of high internal migration, the wellbeing of rural household members and that of their urban relatives are strongly interdependent, and should be analysed as part of a single, unified livelihoods system.’ Remittances, debt, access to savings and micro-insurance are all very important to understand in analysing urban slums. In case studies of Guinea, Guatemala and Zimbabwe, ACF found that rural-urban linkages often follow a strongly seasonal pattern and that designing programmes with seasonality in mind ‘can amplify the impact of development interventions’ and that, ‘where migration is important, livelihoods analysis should attempt to ascertain to what extent households are redistributing their cash, food, and assets in an effort to support their rural or urban relatives’. The recommendations from the study are to analyse rural and urban livelihoods as interdependent worlds; use linkages to better understand household priorities and capacities; and design projects to amplify the impact of linkages. Lucchi concludes that adapting existing tools to urban settings ‘points towards a mixed methodology assessment that uses both quantitative (such as health statistics, medical consultation data, and population surveys) and qualitative (such as focus group data, health-seeking behaviour analysis, and informant interviews) information....Urban settings also demand more diverse assessment teams, including, potentially, anthropological, medical, and political expertise’.
32
http://www.brixtonhealth.com/urbanSampling.pdf

47
Summary and conclusions
‘For most urban centres, there are no data on infant …child and maternal mortality rates … hunger or indicators of malnutrition such as stunting and wasting, or provision for water and sanitation by district – or for the informal settlements where these rates are likely to be highest.’
‘Proximity does not mean access – to schools, hospitals, clinics, water mains and sewers.’
Source: (Mitlin and Satterthwaite, 2012)
Rapid urbanisation is a trend seen across the developing world, with the fastest rates of growth seen in Sub-Saharan Africa. This is due to both rural and urban migration into slum and informal settlement areas within major urban centres, and natural population growth. The urban poor living in these settlements face a unique set of challenges compared to their rural counterparts. Almost exclusively dependent on the market for food and other necessary items, slum dwellers are very vulnerable to price increases and other market shocks. The population density of slums, in combination with poor sanitation and limited access to clean water, also translates into high transmission risk for communicable diseases. Despite their increasing as a proportion of the overall population little disaggregated data is available on the communities living in the slums. Although this is slowly changing with new research focusing on slum dwellers, the body of knowledge on basic indicators, particularly health, food security and nutrition, is still very limited. Whilst the socioeconomic, health and sanitation characteristics of urban slums vary within the same city, within the same country (e.g. peri-urban areas) and between countries, they also vary hugely between continents. Latin America, Asia and Africa face very different challenges in relation to governance, private sector engagement, and the nature of slum environments. The most significant issue for Africa (especially Sub Saharan Africa) is that there is a much lower level of industrialisation than in Latin America and Asia, which could make a fundamental difference to slum dwellers ability to graduate from extreme poverty. Urban development is a long-term process, and time is an extremely important factor in assessing the impact of policy and assistance. Urban areas are more complex than rural areas, at every level from governance to nutrition and food security. Assessments and analysis in urban informal areas/slums poses a challenge, as does accurate targeting and effective programme design and implementation. Big questions remain as to whether even the most experienced of INGOs can significantly scale up programmes in urban areas as they do in rural areas. Experience suggests that the complexity, additional negotiation and coordination, as well as the sheer number of potential beneficiaries, will be self-limiting, and international actors will need to work more closely to improve the capacity of Governments and national actors, as well as developing clearer ways of working with the private sector for service delivery and programme scale up. While this review has identified examples of surveys and reports on nutrition and food security from different locations, the face of urban poverty and food security varies from one poor area to another and there is no simple commonality of context or appropriate standard response. Disaggregated data that is available suggests that rates of undernutrition for children in urban slums are often no better than those of their rural counterparts, and sometimes worse. In-depth analysis of nutrition, food security, governance (including a power-analysis) and baseline data collection in both established and emerging slums is urgently needed. A thorough understanding of the particular location, community and circumstances (political, socioeconomic) needs to be gained prior to tailoring interventions, taking into account the significant urban-rural linkages that may exist and need to be understood. Megacities present a different set of issues to large towns and small emerging cities. It is clear that the socio-economic, nutrition and food security of poor urban households may vary considerably between and within urban areas.
48
However, the use of cut-offs derived for rural areas for GAM and mortality rates is questionable in urban areas as a relatively low percentage of GAM in an urban area can still translate to thousands of children, and proportional increases may indicate an urban crisis without reaching rural thresholds. The absolute numbers of children are important and are often far greater when dealing with urban slums. In consistency with the increasing call to revise and reconsider thresholds for intervention in rural areas, attention needs to be paid as to whether appropriate indicators can also be determined for urban contexts or whether different indicators are more relevant, e.g. crime rates, food / fuel prices, IDP influx, in-migration rates, sanitation and health data. The humanitarian community recognises that it still has much to improve on in relation to responding to slow onset emergencies in rural areas. An even bigger challenge will be identifying and responding to slow onset crisis in urban slums. It is essential that effective early warning systems and triggers to indicate urban crisis are identified (especially for slow onset or protracted crisis) so that there is clear international agreement and buy-in from Donors, the UN, (I)NGOs and governments. Without this it is likely that there will be regular urban crises in the coming years (especially in drought-affected areas such as Sub Saharan Africa) that will be ignored by duty bearers and the international community alike. Without clear delineation and triggers the differentiation between acute and chronic urban needs will remain a continued cause for debate and justification for continued stasis from the humanitarian community while donors fear that exiting urban slum programmes will be impossible. It is clear that there needs to be more operational research, on urban programmes and policy interventions to better understand urban contexts, and how they differ, as well as evaluating the impact of adapted models applied from rural contexts. A number of agencies are beginning to do this, but there has been a lack of an effective urban coordination body or platform that promotes and shares this learning across sectors. A new humanitarian urban portal33 has just been opened with the aim of improving knowledge sharing in disaster preparedness, relief and early recovery in urban crises. Continued support and funding in this area is essential to ensure that current forums and d-groups do not develop silos in the different technical areas; and input from implementing agencies and governments is essential to ensure that the UNHABITAT IASC coordination mechanism does not function at a level which is too removed from the field. While more recent NGO, think-tank, and academic literature has explored challenges pertaining to urban-based natural disaster preparedness and response, there has been far less discussion on how to respond to urban-based complex emergencies. This adaptation of programme response models has started, but more focus and resources are needed to support the development of best practice assessment, targeting and response methodologies for urban areas; with targeting in particular identified as a recurring gap in a number of urban evaluations. WFP has an existing Urban Food Insecurity strategy and a number of INGOs are currently defining their urban strategies. For Oxfam GB, a Governance Framework will provide opportunities to strengthen the capacity of local government, to respond to emergencies through improved DRR, policy change, whilst partnering with the private sector to support improved access to service provision. It is vital that (I)NGOs, governments, UN, the private sector and donors are clear on their added value and strategic approaches if there are to be coordinated approaches that address the many urban emergency and development complexities. It is clear that INGOs and the UN will need to develop urban-specific skills to face the task of effectively working in urban contexts for emergency, transition or development programming. Amongst others, governance, land tenure, protection, disaster risk reduction, food security, livelihoods, WASH, nutrition, and agriculture will need to adapt and ‘urbanise’ their approaches. More importantly they should do this within a one programme approach framework to link humanitarian, transition and development and ensure a multidisciplinary approach that builds resilience. Particular issues to consider include childcare and infant and young child feeding practices, as women are unable to take children to work with them, and often do not have extended family support; as well as a clear understanding of community power dynamics and access to services. There are serious challenges to food security and nutrition programme and policy work in urban slums. It is clear from evaluations and programme experience to date, that regular cash transfers can provide a safety net to meet immediate needs, as well as act as a social protection (SP) mechanism to protect the poorest households from
33 http://www.urban-response.org/
49
becoming destitute during the hunger gap. Evaluations of SP show a clear impact on food security and livelihoods, and there is some data on the impact on stunting, but there is a distinct gap in knowledge on the impact of both safety net and social protection programmes on acute malnutrition. Depending upon the design, SP can include conditional or unconditional shelter improvement, access to clean water and sanitation, debt management or micro-insurance (e.g. against medical costs), amongst others. Cash can be transferred through electronic transfer mechanisms, which can confer both protection and confidentiality to the beneficiary. These social protection pilots can act as examples to governments and duty bearers of the impact, whilst change at a national policy level is advocated. Acute and chronic malnutrition affects many thousands of children and women in the slums. Direct programme intervention and policy change, aimed at improving access to health service provision, water and sanitation, access to community-based management of acute malnutrition (CMAM), vaccinations and IYCF, are all appropriate interventions. However the challenge of scaling up and replicating programmes means that direct intervention is only possible with a small proportion of populations that may constitute millions of people. Instead the focus needs to be on policy and legislation change at a national level, and building the capacity of civil society and local NGOs to support the needs of urban slum dwellers.
50
References: ACF 2010. Identification of vulnerable people in urban environments; Assessment of sustainable livelihoods and
urban vulnerabilities. ACF International. AHMED, A. U., HILL, R. V., SMITH, L. C., WIESMANN, D. M. & FRANKENBERGER, T. 2007. The world’s most deprived:
characteristics and causes of extreme poverty and hunger 2020 Vision for Food, Agriculture and the Environment Discussion Paper No 43, . International Food Policy Research Institute (IFPRI), Washington DC.
ALNAP 2012. Meeting the urban challenge; adapting humanitarian efforts to an urban world. London: ODI. ARIFEEN, S. E., BLACK, R. E., CAULFIELD, L. E., ANTELMAN, G., BAQUI, A. H., NAHAR, Q., ALAMGIR, S. & MAHMUD, H.
2000. Infant growth patterns in the slums of Dhaka in relation to birth weight, intrauterine growth retardation, and prematurity. Am J Clin Nutr, 72, 1010-7.
AUSTIN, L. & FRIZE, J. 2011. Ready or not? Emergency cash transfers at scale - A report for the cash learning partnership (CaLP). Valid International.
BAILEY, S. & HEDLUND, K. 2002. The impact of cash transfers on nutrition in emergency and transitional contexts. A review of evidence. Humanitarian Policy Group, ODI
BAKER, L. 2008. Urban poverty : a global view. . Urban Papers, Washington D.C. - The Worldbank, no. UP-5. BROWN, C. 2012. The 21st Century Urban Disaster. CHF International. CBS(KENYA) 2006. Kenya Integrated Household Budget Survey 2005-2006. Central Bureau of Statistics, Kenya, UK
Department for International Development (DFID), United States Agency for International Development (USAID), European Union (EU), Danish International Development Agency (DANIDA), World Bank (WB), United Nations Development Programme (UNDP).
COHEN, M. J. & GARRETT, J. L. 2010. The food price crisis and urban food (in)security. Environment and Urbanization, 22, 467-482.
CRETI, P. 2010. Review of existing approaches, methods and tools used by humanitarian agencies to measure livelihoods, food insecurity and vulnerability in urban contexts. Oxfam GB and WFP.
CROSS, T. & JOHNSTON, A. 2011. Cash transfer programming in urban emergencies: a toolkit for practitioners. Cash Learning Partnership (CaLP).
DASRA & PIRAMAL 2011. Nourishing our future, tackling child malnutrition in urban slums. DASRA, PIRAMAL. FANTA-2 2008. Emergencies in urban settings: A technical review of food-based program options. Washington, DC:
FANTA-2, Academy for Educational Development, 2008.: Food and Nutrition Technical Assistance II Project GARLAND, A. M., MASSOUMI, M. & RUBLE, B. A. E. 2007. Global urban poverty: setting the agenda. Comparative
urban studies project. Woodrow wilson International centre for scholars GARRETT, J., BASSETT, L. & MARINI, A. 2009. Designing CCT Programs to Improve Nutrition Impact: Principles,
Evidence, and Examples. IFPRI, CGIAR, World Bank. GRIJALVA-ETERNOD, C. S., WELLS, J. C. K., CORTINA-BORJA, M., SALSE-UBACH, N., TONDEUR, M. C., DOLAN, C.,
MEZIANI, C., WILKINSON, C., SPIEGEL, P. & SEAL, A. J. 2012. The Double Burden of Obesity and Malnutrition in a Protracted Emergency Setting: A Cross-Sectional Study of Western Sahara Refugees. PLoS Med, 9, e1001320.
HODDINOTT, J. & BASSETT, L. 2008. Conditional Cash Transfer Programs and Nutrition in Latin America: Assessment of Impacts and Strategies for Improvement. IFPRI.
HOLMES, R., FEBRIANY, V., YUMNA, A. & M, S. 2010. The Role of Social Protection in Tackling Food Insecurity and under-nutrition in Indonesia. A Gendered Approach. ODI/SMERU.
HOSSAIN, N. 2012. Women's Empowerment Revisited: From Individual to Collective Power among the Export Sector Workers of Bangladesh. IDS Working Papers, 2012, 1-40.
IASC 2010. IASC Strategy: Meeting humanitarian challenges in urban areas. Interagency Standing Committee. ICDDR'B, NIPORT, MEASURE EVALUATION & ACPR 2008. 2006 Bangladesh Urban Health Survey (UHS), Volume II. JARAMILLO, M. 2011. ELLA Policy Brief: Designing an Effective CCT. Lima, Peru: Practical Action Consulting. KENNEDY, G. 2003. Food Security in the context of urban sub-Saharan Africa. FoodAfrica, Internet Forum 31 March –
11 April. Internet Paper for Food Security Theme. KULWA, K. B., KINABO, J. L. & MODEST, B. 2006. Constraints on good child-care practices and nutritional status in
urban Dar-es-Salaam, Tanzania. Food Nutr Bull, 27, 236-44.
51
LATAPÍ, A. E. & GONZÁLEZ DE LA ROCHA, M. 2008. Girls, Mothers, and Poverty Reduction in Mexico: Evaluating Progresa-Oportunidades. In: RAZAVI, S. (ed.) The Gendered Impacts of Liberalization: Towards Embedded Liberalism? . New York: Routledge/UNRISD.
LE CUZIAT, G. 2012. Infant and Young Child Feeding (IYCF) practices survey in peri-‐urban township of Hlaingthayar – Myanmar. Save the Children.
LEIGHTON, J. 2010. Urban Food Security Assessment, Emergency Response Niger (Internal Document). Save the children UK.
LEROY, J. L., GARCIA-GUERRA, A., GARCIA, R., DOMINGUEZ, C., RIVERA, J. & NEUFELD, L. M. 2008. The Oportunidades program increases the linear growth of children enrolled at young ages in urban Mexico. J Nutr, 138, 793-8.
LUCCHI, E. 2012. Moving from the 'why' to the 'how': reflections on humanitarian response in urban settings. Disasters, 36 Suppl 1, S87-104.
MACAUSLAN, I. & PHELPS, L. 2011. Emergency Food Security and Livelihoods Urban Evaluation. Oxfam. MARTINE, G., MCGRANAHAN, G., MONTGOMERY, M. & FERNANDEZ-CASTILLA, R. 2012. The New Global Frontier:
Urbanization, Poverty and Environment in the 21st Century, Taylor & Francis. MAXWELL, D., LEVIN, C. AND CSETE, J. 1998. Does urban agriculture help prevent malnutrition? Evidence from
kampala. FCND Discussion Paper No. 45. IFPRI. MITLIN, D. & SATTERTHWAITE, D. 2012. Urban Poverty in the Global South; Scale and Nature. Routledge, Abingdon. MOHANTY, S. 2010. Nairobi Urban Social Protection Programme. Oxfam. MORRIS, S. S. 2000. Targeting urban malnutrition: A multicity analysis of the spatial distribution of childhood
nutritional status. FCND Discussion Paper No. 94. IFPRI NORLÉN, S. 2011. In the world of flying toilets - Perceived health benefits of improved physical environment. A case
study of Nairobi slums. O'DONNELL, I. & SMART, K. W. B. R. 2009. Responding to urban disasters, Learning from previous relief and recovery
operations. ALNAP and PROVENTION. PANTULIANO, S., METCALFE, V., HAYSOM, S. & DAVEY, E. 2012. Urban vulnerability and displacement: a review of
current issues. Disasters, 36 Suppl 1, S1-22. POPKIN, B. M. 2001. The nutrition transition and obesity in the developing world. J Nutr, 131, 871S-873S. POPKIN, B. M. 2006. Global nutrition dynamics: the world is shifting rapidly toward a diet linked with
noncommunicable diseases. Am J Clin Nutr, 84, 289-98. POTTS, D. 2009. The slowing of sub-Saharan Africa's urbanization: evidence and implications for urban livelihoods.
Environment and Urbanization, 21, 253-259. RAHMAN, M. A. 2010. Women's employment in garment factories in Bangladesh : emancipation or exploitation? .
The University of Hull. RUEL, M. T. & GARRETT, J. L. 2004. Features of Urban Food and Nutrition Security and Considerations for Successful
Urban Programming. electronic Journal of Agricultural and Development Economics, Vol. 1, , 242-271. RUEL, M. T., GARRETT, J. L., HAWKES, C. & COHEN, M. J. 2010. The food, fuel, and financial crises affect the urban
and rural poor disproportionately: a review of the evidence. J Nutr, 140, 170S-6S. SCHOFIELD, L. 2009. Report of Baseline Urban Nutrition Assessment in the Slums of Nairobi East and North Districts,
Nairobi Kenya. Concern Worldwide SHETTY, P. S. 2002. Nutrition transition in India. Public Health Nutr, 5, 175-82. SMITH, D. L. & PRAIN, G. 2006. Understanding the links between agriculture and health for food, agriculture, and the
environment Urban Agriculture and Health Focus 13, 2020 vision for Food Agriculture and the Environment IFPRI.
SMITH, L. C., RUEL, M. T. & NDIAYE, A. 2004. Why Is Child Malnutrition Lower in Urban than Rural Areas? Evidence from 36 Developing Countries. IFPRI Discussion Paper Briefs.
SVERDLIK, A. 2011. Ill-health and poverty: a literature review on health in informal settlements. Environment and Urbanization, 23, 123-155.
TACOLI, C. 2009. Crisis or adaptation? Migration and climate change in a context of high mobility. Environment and Urbanization, 21, 513-525.
TACOLI, C. & MABALA, R. 2010. Exploring mobility and migration in the context of rural—urban linkages: why gender and generation matter. Environment and Urbanization, 22, 389-395.
THWIN, A. 2001. Promoting household food and nutrition security in Myanmar. Asia Pac J Clin Nutr, 10 Suppl, S34-9. UN 2010. The MDGs Report 2010. UNHABITAT 2006. Cities, Slums and the Millennium Development Goals. UNHABITAT 2009. Innovative cities, Why learning is the key to urban development. Urban World, 1.

52
UNICEF 2012. State of the World's Children: children in an urban world. . UNSCN 2012. Statement by the UNSCN. 9th Session of the UN Human Rights Council Advisory Committee. VAITLA, B. 2012. Rural-urban linkages, household food security and child nutrition. Action Contre la Faim. WB 2001. Philippines health and nutrition project, Implementation completion report No. 23262 World Bank. WB 2004. Community driven development in urban upgrading. Social Development Notes; Community driven
Development No.85. World Bank WB 2007. Bangladesh, Dhaka: improving living conditions for the urban poor. Report No. 35824-BD World Bank;
Sustainable Development Unit, South Asia Region. WB 2010. Kenya slum upgrading programme. Project Information Document (PID). World Bank Concept stage report
No. AB4547. WSP 2008. The Water and Sanitation Program Medium-Term Strategic Framework on Sanitation. Global sanitation
crisis; What are you doing about it? : The Water and Sanitation Program.