Urban Landscape Structure of a Fast-Growing African City ...
15
Article Urban Landscape Structure of a Fast-Growing African City: The Case of Niamey (Niger) Jean-Pierre Rossi 1, * and Gauthier Dobigny 2,3 1 Centre de Biologie pour la Gestion des Populations (CBGP), INRA, 34988 Montpellier, France 2 Centre de Biologie pour la Gestion des Populations (CBGP), IRD, 34988 Montpellier, France; [email protected] 3 Ecole Polytechnique d’Abomey-Calavi, Université d’Abomey-Calavi, Cotonou 01BP2009, Benin * Correspondence: [email protected] Received: 25 May 2019; Accepted: 11 June 2019; Published: 14 June 2019 Abstract: Combining multivariable statistics and geostatistics with landscape metrics, we attempted to quantify the spatial pattern of urbanization in the city of Niamey, Niger. Landscape metrics provided local quantification of both landscape composition and physiognomy while the Principal Component Analysis (PCA) yielded a multivariable summary of the main source of landscape metrics variation across the city. We used the variogram (geostatistics) to analyze the spatial pattern of the PCA outcomes and to characterize the associated spatial scales of variation. In Niamey, the main urban structure corresponded to a gradient ranging from highly diversified, fragmented, and both wooded and built-up areas in the city center and along the Niger River, to less green zones gathering steel-roofed houses whose density diminished towards the periphery. This concentric structure centered on the Niger River clearly reflected the history of Niamey. PCA and geostatistics provided appealing quantitative estimates of spatial patterns, scales, anisotropy and intensity of urban structures. Although these different tools are known in landscape ecology, they are rarely used together. The present paper illustrates how they allow characterizing the marked spatial variation of the urban landscape of the fast-growing African city of Niamey (Niger). Such a quantification of the urban landscapes may be extremely useful for future correlative investigations in various fields of research and planning. Keywords: urban landscape; landscape metrics; spatial statistics; variogram; multivariate statistics 1. Introduction While 54% of the world’s population was urban in 2014, this figure is expected to reach more than 66% by 2050. It is recognized that urban areas are currently expending faster than urban populations and this raises acute environmental concerns. Land-cover change associated with urbanization is a dramatic form of land transformation that strongly impacts various facets of biological systems and the evolution of living organisms. Among these features, urban ecosystems are characterized by altered local and regional climates through the urban heat island effect [1] or drastically modified water run-off and floods patterns. This sometimes leads to uncomfortable or unhealthy conditions for city dwellers. Growing cities have increasing demands for natural resources (e.g., water, food and energy demands [2,3]) and greatly contribute to pollution (e.g., increased vehicles use, concentration of industries, solid and liquid waste accumulation and treatment, non-electric domestic sources of energy and indoor contamination, etc.) [4], thereby raising the issue of urban sustainability that has recently attracted considerable attention. The environmental impact of cities is largely dependent on population density and repartition (e.g., formal vs. informal settlements in the cities of many developing countries) and the citywide Urban Sci. 2019, 3, 63; doi:10.3390/urbansci3020063 www.mdpi.com/journal/urbansci
Transcript of Urban Landscape Structure of a Fast-Growing African City ...

Article
Urban Landscape Structure of a Fast-Growing AfricanCity The Case of Niamey (Niger)
Jean-Pierre Rossi 1 and Gauthier Dobigny 23
1 Centre de Biologie pour la Gestion des Populations (CBGP) INRA 34988 Montpellier France2 Centre de Biologie pour la Gestion des Populations (CBGP) IRD 34988 Montpellier France
gauthierdobignyirdfr3 Ecole Polytechnique drsquoAbomey-Calavi Universiteacute drsquoAbomey-Calavi Cotonou 01BP2009 Benin Correspondence jean-pierrerossiinrafr
Received 25 May 2019 Accepted 11 June 2019 Published 14 June 2019
Abstract Combining multivariable statistics and geostatistics with landscape metrics we attemptedto quantify the spatial pattern of urbanization in the city of Niamey Niger Landscape metricsprovided local quantification of both landscape composition and physiognomy while the PrincipalComponent Analysis (PCA) yielded a multivariable summary of the main source of landscapemetrics variation across the city We used the variogram (geostatistics) to analyze the spatial patternof the PCA outcomes and to characterize the associated spatial scales of variation In Niameythe main urban structure corresponded to a gradient ranging from highly diversified fragmentedand both wooded and built-up areas in the city center and along the Niger River to less green zonesgathering steel-roofed houses whose density diminished towards the periphery This concentricstructure centered on the Niger River clearly reflected the history of Niamey PCA and geostatisticsprovided appealing quantitative estimates of spatial patterns scales anisotropy and intensity ofurban structures Although these different tools are known in landscape ecology they are rarely usedtogether The present paper illustrates how they allow characterizing the marked spatial variation ofthe urban landscape of the fast-growing African city of Niamey (Niger) Such a quantification of theurban landscapes may be extremely useful for future correlative investigations in various fields ofresearch and planning
Keywords urban landscape landscape metrics spatial statistics variogram multivariate statistics
1 Introduction
While 54 of the worldrsquos population was urban in 2014 this figure is expected to reach more than66 by 2050 It is recognized that urban areas are currently expending faster than urban populationsand this raises acute environmental concerns Land-cover change associated with urbanization isa dramatic form of land transformation that strongly impacts various facets of biological systemsand the evolution of living organisms Among these features urban ecosystems are characterizedby altered local and regional climates through the urban heat island effect [1] or drastically modifiedwater run-off and floods patterns This sometimes leads to uncomfortable or unhealthy conditions forcity dwellers Growing cities have increasing demands for natural resources (eg water food andenergy demands [23]) and greatly contribute to pollution (eg increased vehicles use concentrationof industries solid and liquid waste accumulation and treatment non-electric domestic sources ofenergy and indoor contamination etc) [4] thereby raising the issue of urban sustainability that hasrecently attracted considerable attention
The environmental impact of cities is largely dependent on population density and repartition(eg formal vs informal settlements in the cities of many developing countries) and the citywide
Urban Sci 2019 3 63 doi103390urbansci3020063 wwwmdpicomjournalurbansci
Urban Sci 2019 3 63 2 of 15
distribution of infrastructures basic services medical facilities or public amenities as well as connectedareas (eg transports and transport networks) It is also modulated by the urban form per se ie urbanmorphology [5] and ecological context (eg rivers relief sea front flooding areas etc) As a result thespatial pattern of cities strongly affects ecological and socio-economic processes within and beyondcity limits One of the goals of urban ecology is to understand how city structure and dynamics impactecological processes and sustainability Another facet of urban ecology is related to human populationhealth and its citywide spatial variability This point is of particular concern in fast-growing cities oftencharacterized by unplanned areas of dense and impoverished slums with inadequate infrastructuresIn this context urban landscape pattern have been recognized as a pertinent factor to human spatialepidemiology and health inequalities The ldquoone healthrdquo concept is based on the idea that humanhealth should be understood and addressed as the result of multiple interactions between variousactors such as clinicians researchers local authorities andor citizens Obviously the pattern of urbanand peri-urban landscapes is one of the factors that should be considered in such a multidisciplinaryapproach to the human and animal health issues
Linking urban forms to ecological or epidemiological processes requires a quantification of thespatial patterns at hand Landscape metrics of multi-class land cover or land use originally developedin the field of landscape ecology offer an efficient way to depict the complexity of cities in terms oflandscape composition and physiognomy In that context the spatial variation of the landscape metricsacross a city or along a transition between urban and rural environments [67] provide insights into howand at which scale(s) the pattern of urbanization changes in space Characterizing the spatial variationof urban landscape composition and structure has useful operational consequences as it offers aconvenient way to arrange study plots in function of the gradient or patches [8] or to optimize citywidesampling design Converting multi-class land cover maps into quantitative indices (ie landscapemetrics) [9] also provides potentially meaningful covariates that can be used to feed correlative modelsto explore the links between urban patterns and ecological processes or epidemiological variables
Africa displays the highest urban growth rate in the world (34 per year) [10] and it is expectedto reach up to 5 in the next fifteen years while the world average should be 2 [11] The present studywas carried out in Niamey the capital city of Niger the poorest country in the world (IDH 2017 of 0354rank 221221) Niamey was created ex nihilo by French colonizers at the very end of the nineteenthcentury The city is a typical example of the rapid urban population growth of colonial African citieswith a population increasing from lt20000 in the early 1950s to more than 1300000 inhabitantstoday This recent explosive increase of the number of urban dwellers in Niamey was largely drivenby a massive rural exodus following successive droughts (eg from 90000 to 500000 inhabitantsfrom 1960 to 1980) Niamey currently displays one of the largest average annual growths of WestAfrican cities (2010ndash2020 786 3rd rank after Ouagadougou and Yamoussoukro) Such a rapidpopulation expansion translated into a marked urban sprawl associated with the development ofinformal settlements and poverty
The purpose of our study was to explore how landscape metrics combined with multivariableand ad hoc spatial statistics can be used to characterize the urban form of an African urban arearepresentative of the fastest growing cities of the continent More specifically we aimed to (i) explorehow the analysis of landscape metrics by principal component analysis emphasizes the main urbanfeatures (ii) map the corresponding patterns (iii) examine how geostatistics allow to identify the mainscales of the spatial variation and the presence of spatial anisotropy in the urban context and (iv) discussthe value of the former approaches to set up sampling plans and experimental designs and derivesynthetic urban landscape descriptors that can serve as explanatory variables in correlative models
Urban Sci 2019 3 63 3 of 15
2 Materials and Methods
21 Study City Niamey
The city of Niamey (capital of Niger) lies on both sides of the Niger River The climate is typicalof a semi-arid Sahelian region with low rainfalls (ca 540 mm per year) and high temperatures(monthly average temperatures range between 22 C and 36 C) A single rainy season usually occursbetween May and September Niamey was created ca 120 years ago and has experienced a continuousdemographic growth that recently accelerated This population growth has been accompanied bya spectacular spatial expansion associated with the development of many informal settlements anda marked variation of the socio-economic status across the city In the present survey we used aGeographic Information System (GIS) of Niamey implemented from a SPOT satellite image (scenereference number 506 132 308 121 010 151 32 T CNES 2008 resolution of 2 m) Eight land-covercategories have been distinguished Niger river ponds bare soils tarred areas concrete areas treesother greenings and sheet steel-made roofs (Figure 1) The analyses were carried out on the basis of araster map of 2 m by 2 m resolution derived from the satellite image The projected coordinate system isWGS 84 UTM zone 31N (EPSG 32631 httpspatialreferenceorg) In Niamey people sometimes useunfired ground as a building material (referred to as ldquobancordquo) This traditional material is associatedwith a spectral signature very close to that of bare soil thus some settlements were mistaken for baresoil Today the ldquobancordquo-made roofs are increasingly replaced by sheet steels and mostly occur in twoold and underprivileged districts named Gamkalleacute and Karadjeacute (Figure S1 Supplementary Material)
Urban Sci 2019 3 x FOR PEER REVIEW 3 of 15
(monthly average temperatures range between 22 degC and 36 degC) A single rainy season usually occurs between May and September Niamey was created ca 120 years ago and has experienced a continuous demographic growth that recently accelerated This population growth has been accompanied by a spectacular spatial expansion associated with the development of many informal settlements and a marked variation of the socio-economic status across the city In the present survey we used a Geographic Information System (GIS) of Niamey implemented from a SPOT satellite image (scene reference number 506 132 308 121 010 151 32 T CNES 2008 resolution of 2 m) Eight land-cover categories have been distinguished Niger river ponds bare soils tarred areas concrete areas trees other greenings and sheet steel-made roofs (Figure 1) The analyses were carried out on the basis of a raster map of 2 m by 2 m resolution derived from the satellite image The projected coordinate system is WGS 84 UTM zone 31N (EPSG 32631 httpspatialreferenceorg) In Niamey people sometimes use unfired ground as a building material (referred to as ldquobancordquo) This traditional material is associated with a spectral signature very close to that of bare soil thus some settlements were mistaken for bare soil Today the ldquobancordquo-made roofs are increasingly replaced by sheet steels and mostly occur in two old and underprivileged districts named Gamkalleacute and Karadjeacute (Figure S1 supplementary material)
Figure 1 Map of the city of Niamey (Niger) showing the 8 land-cover classes used in the study The projected coordinate system is WGS 84 UTM zone 31N (EPSG 32631 httpspatialreferenceorgrefepsg32631)
22 Landscape Metrics
Landscape metrics are mathematical indices developed to quantify various aspects of a landscape from the categorical map describing that landscape The aim is to capture some of the synoptic features of landscapes such as composition and physiognomy A number of landscape metrics have been proposed [9] for that purpose Class metrics focus on one land-cover class (eg bare soil trees etc) while landscape metrics consider all classes simultaneously to provide synthetic indices of diversity and complexity among other features (Table 1) The percentage of landscape
Figure 1 Map of the city of Niamey (Niger) showing the 8 land-cover classes used in the study Theprojected coordinate system is WGS 84UTM zone 31N (EPSG 32631 httpspatialreferenceorgrefepsg32631)
22 Landscape Metrics
Landscape metrics are mathematical indices developed to quantify various aspects of a landscapefrom the categorical map describing that landscape The aim is to capture some of the synoptic features
Urban Sci 2019 3 63 4 of 15
of landscapes such as composition and physiognomy A number of landscape metrics have beenproposed [9] for that purpose Class metrics focus on one land-cover class (eg bare soil trees etc)while landscape metrics consider all classes simultaneously to provide synthetic indices of diversityand complexity among other features (Table 1) The percentage of landscape (PLAND) metric quantifiesthe proportion of the landscape covered by a given land-cover Largest patch index (LPI) reflectsthe proportion of the landscape covered by the largest patch of a given land-cover Both reflect thecomposition of the landscape In the present study we also computed the patch density and theedge density (PD and ED) which correspond to the number of patches and the amount of edgeassociated with them Edge effects are recognized as having a key role in many ecological processesThis is the reason why we also considered at the scale of the whole landscape the ED metric whichquantifies the total edge length (ie for all land-covers) In addition we used 3 measures of richnessor diversity patch richness density (PRD) measures the richness in a landscape as the number ofdifferent land-covers the modified Simpsonrsquos diversity index (MSIDI) measures landscape diversityand the modified Simpsonrsquos evenness index (MSIEI) quantifies how close the proportion of the surfaceoccupied by the different land-covers is
Table 1 Landscape metrics used to describe the urban landscape in the city of Niamey (adapted fromMcGarigal et al 2012)
Name Acronym Description Unit
Class metrics
Edge density ED ED quantifies the edge length on aper unit area basis Meters per hectare
Largest patchindex LPI
LPI is a measure of dominance thatquantifies the proportion of totallandscape area occupied by the
largest patch
Percent
Patch density PD PD expresses the number of patcheson a per unit area basis
Number per100 hectares
Percentage oflandscape PLAND
PLAND is a measure of landscapecomposition how much of the
landscape is comprised of aparticular land-cover
Percent
Landscape metrics
Edge density EDED is a measure of the total edge
length in the landscape on a per unitarea basis
Meters per hectare
ModifiedSimpsonrsquosdiversity index
MSIDI
MSIDI quantifies landscapediversity It increases as the number
of different patch types increasesand the coverage of each patch type
becomes equitable
None
ModifiedSimpsonrsquosevenness index
MSIEIMSIEI measures how close the
coverage area is distributed amongthe different land-covers
None
Patch richnessdensity PRD
PRD measures richness as thenumber of different land-covers in a
landscape in a per area basis
Number per100 hectares
The landscape metrics were computed from a local urban landscape corresponding to circularbuffers positioned on 53239 points located on a square grid of 50 m mesh size and covering the wholeregion under study (Figure 1) Each buffer led to a ldquolocal landscaperdquo for which we computed allmetrics The computations were done for different values of buffer diameter (20 m 40 m 60 m 80 m
Urban Sci 2019 3 63 5 of 15
and 100 m) in order to capture landscape features at different spatial scales All landscape metrics werecomputed using the software FRAGSTATS [12]
23 Multivariate Analysis Using the Principal Component Analysis (PCA)
Landscape metrics computation yielded a dataset with 53239 rows (the sampling points)for 4 times 8 = 32 class metrics and 4 landscape metrics Multivariate analyses such as the PrincipalComponent Analysis (PCA) are well suited to extract the main multivariate patterns from suchbig datasets and to provide a typology of the sampling points in the form of their scores upon theprincipal components
The PCA consists in the eigenanalysis of a dispersion matrix (here the correlation matrix) andyields a set of principal axes that are a linear combination of the variables Since they are orthogonal theprincipal components reflect independent facets of the dataset The PCA gives very good results whenit is used to analyze highly correlated variables [13] which is precisely the case of landscape metrics Italso provides information about the relationship between landscape metrics and the contribution ofeach of them to the construction of the principal axes (correlation circle) As such it is very helpful tohierarchize the sources of landscape variability The scores of the sampling points can be analyzedusing different methods such as geostatistics (see below) to explore the spatial continuity and thescales at which multivariate landscape features vary across the city
24 Variograms
The spatial variability of the principal components was analyzed using the variogram an importanttool in geostatistics a branch of spatial statistics originally developed in earth sciences [14] and nowwidely used in life sciences
The semi-variance γ(h) quantifies the dissimilarity between the values of a variable z (here thescore of sampling points upon the principal axes of the PCA) measured at points a distance h apart It is
γ(h) =12
var[z(i) minus z(i + h)] (1)
where i denotes the sampling points and h the separating distance The variogram is the plot of γ(h)against h and represents the average rate of change of z with h It provides clues to the pattern of spatialvariation in terms of its general form scales and magnitude If a spatial structure is present γ(h)increases with h and often reaches a plateau for a distance referred to as the range Points separated bya distance larger than the range are considered statistically independent and below that range pointsare more similar than expected by chance Flat variograms reveal the absence of spatial dependenceThe spatial structure at hand can be conveniently characterized by fitting a mathematical functionto the empirical variogram Typically model parameters characterize the range (the distance belowwhich a spatial dependence is present) the sill (the semi-variance corresponding to the plateau) andthe nugget variance ie the semi-variance for h = 0 which accounts for measurement errors andvariation occurring at a distance shorter than the minimum inter-sample distance Complex spatialstructures can be modeled using nested models
The spatial variability may be directionally dependent in other words the variogram may revealchanges in the range or the sill when computed in different directions [1415] The first step of theanalysis of directional anisotropies consists in finding the main anisotropy axes This process can beconveniently undertaken by computing the variogram map (also referred to as the variogram surface)The semi-variance is computed at different lag distances (h) and represented as grid cells along multipleazimuths originating from a common point A grid cell in the variogram map shows the semi-variancecalculated for a group of paired data points that are aligned along a given azimuth and separated bygiven distance (Figure 5) The resulting map shows the semi-variance in all directions and for all lagdistances A transect in any single direction thus corresponds to the variogram computed for that
Urban Sci 2019 3 63 6 of 15
direction We computed the variogram map the points coordinates upon the first two PCA axes (PC1and PC2) using a lag distance of 200 m
All analyzes were performed using the R language [16] The PCA was computed using the Rpackage ade4 [17] Variograms were computed and analyzed using the R package gstat [18]
3 Results
The 53239 sampling points will be hereafter referred to as the pixels The first and second axes ofthe PCA will be hereafter referred to as PC1 and PC2 respectively
31 PCA Eigenvalues According to Buffer Sizes
We performed PCA to analyze the landscape metrics computed at each investigated buffer sizeThe inertia associated with each of the first five eigenvalues is shown in Figure 2 Interestingly smallerbuffer sizes corresponded to a lower amount of inertia associated with the first two axes while thatamount became larger for axes of a rank gt3 Larger buffer sizes led to a better concentration ofthe information along the first PCA components In other words larger ldquolocal landscapesrdquo led tometric values that better segregated the pixels along the two first PCA axes For that reason wefocused on the results of the PCA obtained for the largest resolution explored in the present study (ie100 m resolution)
Urban Sci 2019 3 x FOR PEER REVIEW 6 of 15
Figure 2 First five eigenvalues of the principal component analysis (PCA) of the landscape metrics computed in Niamey for different buffer sizes ie at different spatial resolutions Eigenvalues are expressed as a proportion () of the total inertia of the dataset
32 Citywide Variation of Landscape Features
Figure 3A shows the correlation circle obtained with the PCA of the landscape data derived from a buffer size of 100 m The first axis segregates pixels associated with high values of the diversity and equitability indices (MSIDI and MSIEI) patch richness density (PRD) as well as edge density (ED) (right-hand side of the PC1 axis) from pixels associated with high values of the metrics PLAND and LPI for bare soil (left-hand side of the PC1 axis) The tree and other greenings also contribute to the first component and higher vegetation cover is associated with areas of higher diversity and lower amount of bare soil (right-hand side of the PC1 axis ie positive scores) Mapping the pixel scores upon PC1 (Figure 3B) reveals that positive scores are spatially aggregated along the Niger River and in the city center Conversely lower scores are associated with pixels located in the periphery of Niamey leading to a gradient from city center and Niger River (in red in Figure 3B) to city outskirts (in blue in Figure 3B)
The PC2 axis (Figure 3A) segregates pixels characterized by high coverage of a sheet-steel-made roof (SR) and concrete (C) (top of vertical axis) to pixels with high coverage of ponds (P) greenings (GR) trees (T) and Niger River (NR) (bottom of vertical axis) The map of the pixel scores (Figure 3C) shows that PC2 depicts a gradient from areas located close to the Niger River or characterized by high tree or greening coverage of highly urbanized areas with very low (if any) greenings Intermediate scores (yellow in Figure 3C) also reflect streets where pixel coverage of tarred areas (TR) is higher Some very localized spots in red correspond to very high scores and materialize larger tarred areas (road circles industrial sites etc)
Figure 2 First five eigenvalues of the principal component analysis (PCA) of the landscape metricscomputed in Niamey for different buffer sizes ie at different spatial resolutions Eigenvalues areexpressed as a proportion () of the total inertia of the dataset
32 Citywide Variation of Landscape Features
Figure 3A shows the correlation circle obtained with the PCA of the landscape data derived froma buffer size of 100 m The first axis segregates pixels associated with high values of the diversity andequitability indices (MSIDI and MSIEI) patch richness density (PRD) as well as edge density (ED)(right-hand side of the PC1 axis) from pixels associated with high values of the metrics PLAND andLPI for bare soil (left-hand side of the PC1 axis) The tree and other greenings also contribute to the firstcomponent and higher vegetation cover is associated with areas of higher diversity and lower amount
Urban Sci 2019 3 63 7 of 15
of bare soil (right-hand side of the PC1 axis ie positive scores) Mapping the pixel scores upon PC1(Figure 3B) reveals that positive scores are spatially aggregated along the Niger River and in the citycenter Conversely lower scores are associated with pixels located in the periphery of Niamey leading toa gradient from city center and Niger River (in red in Figure 3B) to city outskirts (in blue in Figure 3B)
Urban Sci 2019 3 x FOR PEER REVIEW 7 of 15
Figure 3 PCA of landscape metrics describing the urban landscape of the city of Niamey (Niger) (A)correlation circle (B) map of the first PCA axis (C) map of the second PCA axis
Urban Sci 2019 3 63 8 of 15
The PC2 axis (Figure 3A) segregates pixels characterized by high coverage of a sheet-steel-maderoof (SR) and concrete (C) (top of vertical axis) to pixels with high coverage of ponds (P) greenings(GR) trees (T) and Niger River (NR) (bottom of vertical axis) The map of the pixel scores (Figure 3C)shows that PC2 depicts a gradient from areas located close to the Niger River or characterized by hightree or greening coverage of highly urbanized areas with very low (if any) greenings Intermediatescores (yellow in Figure 3C) also reflect streets where pixel coverage of tarred areas (TR) is higherSome very localized spots in red correspond to very high scores and materialize larger tarred areas(road circles industrial sites etc)
33 Variography of PCA First Components
The scores of the 53239 pixels upon PC1 and PC2 were used to compute omni-directionalvariograms Data couples were grouped into 25 distance classes ranging from 0 to 5000 m Thespatial lag was 200 m and the average distance separating data points in the first distance class was134 m The number of data pairs in semi-variance estimation ranged from 1257853 to 33759596 Bothvariograms exhibited a very clear spatial structure (Figure 4A) The variogram of PC1 exhibited anested structure with one component corresponding to short-scale spatial dependence (lt 500m) anda long-range structure Variogram modeling offers the advantage of allowing one to separate suchsuperimposed sources of spatial autocorrelation Figure 4A shows the empirical variogram for PC1(points) and a nested model fitted from the observed semi-variance values (solid line) [19] The nestedmodel comprises two spherical models with very different ranges (477 m and 9440 m) that quantify thespatial scales at which PC1 varies The variogram model of PC2 (Figure 4A) is exponential with arange of 1356 m Thus contrary to PC1 that resembles a gradient PC2 depicts a bounded structure
We examined the possible presence of directional spatial dependences using the variogram mapsshown in Figure 5 For PC1 the semi-variance increased regularly with separating distance irrespectiveof the direction examined which indicated an omnidirectional spatial structure On the contrary thevariogram map for PC2 exhibited a clear anisotropy along the direction of 135 (Figure 5B) The mapshows that the semi-variance increases more slowly along the 135 direction than it does in otherdirections and that it reaches lower values Having identified a direction of anisotropic variationusing the variogram map we computed the directional variograms in four different directions (045 90 125 and 135 Figure 4AB) The directional variograms for 125 and 135 clearly indicatedthat PC2 varied differently in these directions The semi-variance is lower (the pixels are more similar)and reached a plateau for a smaller range than that of other directions The specific pattern along thedirection of 135 may be explained by the spatial position of the Niger River and the associated pondsthat strongly impact the construction of PC2
Urban Sci 2019 3 63 9 of 15Urban Sci 2019 3 x FOR PEER REVIEW 9 of 15
Figure 4 Structural analysis of the first two axes of the PCA of landscape metrics describing the urban structure of the city of Niamey A) omni-directional variograms of the PCA axes 1 and 2 and directional variogram for the direction of 125deg of axis 2 B) directional (0deg 45deg 90deg and 135deg) and omni-directional variograms for the axis 2 of the PCA
1
4
6
8
10
0 1000 2000 3000 4000 5000distance (m)
sem
iminusva
rianc
e
PC1PC2PC2 125deg
A
2
4
6
8
0 1000 2000 3000 4000 5000distance (m)
sem
iminusva
rianc
e
directions0deg45deg90deg135degomnidirectional
B
Figure 4 Structural analysis of the first two axes of the PCA of landscape metrics describing theurban structure of the city of Niamey (A) omni-directional variograms of the PCA axes 1 and 2 anddirectional variogram for the direction of 125 of axis 2 (B) directional (0 45 90 and 135) andomni-directional variograms for the axis 2 of the PCA
Urban Sci 2019 3 63 10 of 15Urban Sci 2019 3 x FOR PEER REVIEW 10 of 15
Figure 5 Variogram maps for the first two axes of the PCA of landscape metrics describing the urban structure of the city of Niamey A) variogram map for axis 1 revealing an isotropic variation B) variogram map for axis 2 showing the presence of anisotropy in the direction of 135deg
4Discussion
41 Niamey
In this study we showed how landscape metrics computed from urban land-covers could capture and characterize the spatial structure of the city of Niamey an emblematic example of fast-growing West African cities Since the seminal work of Herold et al [20] and Luck and Wu [6] the value of landscape metrics to depict urban landscape composition and physiognomy has been largely recognized although surveys of cities from low and middle income countries are still too scarce Interestingly landscape metrics provided a clear picture of the city structure on the basis of very simple information consisting in only eight land-cover classes Other data such as land-uses would have probably yielded different and complementary pictures of the city structure but eight basic land-covers combined with landscape metrics proved to be sufficient to depict the trend of urbanization that globally radiates from the historical city center to the outskirts
The main urban structure identified through the PCA corresponded to a gradient ranging from highly diversified fragmented and both wooded and built-up areas in the city center and along the
minus5000
minus2500
0
2500
5000
minus5000 minus2500 0 2500 5000EminusW separation distance(m)
NminusS
sep
arat
ion
dist
ance
(m)
25
50
75
100
125
semiminusvariance
A
minus5000
minus2500
0
2500
5000
minus5000 minus2500 0 2500 5000EminusW separation distance(m)
NminusS
sep
arat
ion
dist
ance
(m)
25
50
75
semiminusvariance
B
Figure 5 Variogram maps for the first two axes of the PCA of landscape metrics describing theurban structure of the city of Niamey (A) variogram map for axis 1 revealing an isotropic variation(B) variogram map for axis 2 showing the presence of anisotropy in the direction of 135
4 Discussion
41 Niamey
In this study we showed how landscape metrics computed from urban land-covers could captureand characterize the spatial structure of the city of Niamey an emblematic example of fast-growingWest African cities Since the seminal work of Herold et al [20] and Luck and Wu [6] the valueof landscape metrics to depict urban landscape composition and physiognomy has been largelyrecognized although surveys of cities from low and middle income countries are still too scarceInterestingly landscape metrics provided a clear picture of the city structure on the basis of very simpleinformation consisting in only eight land-cover classes Other data such as land-uses would haveprobably yielded different and complementary pictures of the city structure but eight basic land-coverscombined with landscape metrics proved to be sufficient to depict the trend of urbanization thatglobally radiates from the historical city center to the outskirts
The main urban structure identified through the PCA corresponded to a gradient ranging fromhighly diversified fragmented and both wooded and built-up areas in the city center and along the
Urban Sci 2019 3 63 11 of 15
Niger River to less green zones gathering steel-roofed houses whose density diminishes towards theperiphery The most external belt is made of bare soil that characterizes the non-urban peripheral areasSuch a concentric pattern is particularly marked on the northern half of the city (Figure 3) This rathersimple concentric structure appears to be centered on the Niger River and clearly reflects the history ofNiamey Indeed the first colonial settlement lied on the Niger River bank in an area that is now verycentral to the town and still shelters many political and public infrastructures This administrativeand residential center was close to a commercial area (eg the ldquoPetit Marcheacuterdquo that was first created in1936) that rapidly became saturated thus driving the development of other markets that stood slightlyfurther away (eg ldquoGrand Marcheacuterdquo built in the early 1960s) From the 1980s the increase of density inthis part of Niamey led to a rapid and constant centripetal expansion of the city [21] with the explosiveand still ongoing development of the northern belt of the town South of the Niger River the cityhas developed only since the mid-1970s after the construction of the first bridge and the UniversityThere too settlements have been growing fast but spaces are still dedicated to urban agriculture [21]as clearly depicted by our GIS-based analysis (Figure 3)
The main source of land cover variation identified in our analysis opposes the city center on theoutskirts The quantification of this pattern allows ones to compare it to various other features ina clearly formalized analytical context For instance as part as the One Health concept it could beinteresting to investigate the relationship between the urban gradient retrieved here and the spatialheterogeneity of population health access to health cares etc It is expected that the spatial patterningof urban land-cover covaries with demographic social and economic factors on one hand and awide spectrum of environmental factors on the other For example urban landscape most probablydirectly impacts the vector reservoir and pathogen distributions and lifecycles Accordingly varioussurveys have recently been conducted in Niamey to characterize the spatial variation of several smallmammal-borne zoonotic agents As such a clear association between urban market gardening andleptospiral risk was retrieved while highly built-up areas of the city appeared at very low risk despitethe abundance of potential rodent reservoirs of the pathogen [19] In the same manner a relationshipbetween rodent-borne Trypanosoma lewisi and T lewisi-like prevalence and land cover was recentlyidentified [22] These two cases studies illustrate how the approach detailed in the present work couldgreatly help in deciphering health drivers in the context of the urban landscape in African cities Webelieve that this would be particularly useful with social uses (and not only land-uses) included in theanalytical framework something that is allowed by the methods used in our survey
42 Multivariate Analysis
Landscape metrics are one of the most common tools used to quantify landscape structuresboth in natural ecosystems and in urbanized areas Landscape metrics provide targeted quantitativeinformation on specific aspects of urban landscape composition and structure [612] that can be directlyinterpreted or analyzed using different statistics Overall landscape metrics are known to be partiallyredundant and often highly correlated or collinear Since redundancy may constitute a problem incertain statistical analyses [23] the use of multivariate analyses to summarize the datasets and extractthe main sources of variation is an appealing strategy for analyzing urban landscapes
The present study exemplifies how the PCA can pick up the main multivariate patterns of Niameycity through the principal components As a linear combination of the initial landscape metrics theseprincipal factors could themselves be treated as a random variable leading to the straightforwardmaps shown in Figure 3BC Such graphical displays allow a quick and easy interpretation of citystructures as well as subsequent statistical analyses (discussed below) One interest of PCA and othermultivariable analyses is that factors (or principal axes) are independent and can be ranked in terms ofthe amount of inertia they account for This property allows one to hierarchize the sources of variabilitythat drive the spatial variability of the landscape under study In the case of Niamey the patterns wererather simple and could be encapsulated in the first two principal axes Beyond our study case the
Urban Sci 2019 3 63 12 of 15
PCA could efficiently decipher more complex correlation structures and situations where very largegeospatial datasets are to be analyzed
The PCA and more generally multivariate analyses provide an assessment of the relationshipsbetween landscape metrics (correlation circle Figure 3B) as well as a direct measure of the contributionof each metric to the principal axes Identifying landscape metrics of importance could be the goal ofan exploratory survey as well as a prerequisite in correlative studies where one or several metricsreflecting important landscape features are involved in statistical analysis or modeling to identify arelationship with other variables
Landscape metrics are sensitive to both spatial and thematic map resolutions that directly affect theamount of detail available to compute landscape metrics This has been shown in urban systems [2425]as well as in less anthropized environments In the case of Niamey we explored various buffersizes with which we computed the landscape metrics The PCA showed that the outputs differed interms of inertia associated with PCA axes the geospatial information being more concentrated onthe first principal axes when larger buffers were used Such effects may depend on the landscape athand and could change according to the statistical analysis employed In certain cases the effect ofbuffer resolution was shown to be idiosyncratic [23] which suggests that such effects are complexcase-specific and as such difficult to generalize
In the present study we analyzed one landscape at a specific date but there is a wealth of literaturedealing with spacendashtime data eg focused on land-useland-cover change in order to characterizelandscape dynamics If a city is described using landscape metrics computed at different dates theanalysis of the resulting time series could be achieved using a variant of the PCA called Partial TriadicAnalysis (PTA) PTA belongs to the STATIS group of methods Put simply the PTA allows one to isolatethe spatial structure common to different dates and to understand how the urban pattern quantifiedat each date differs from the common model This approach combined with the characterization ofurban patterns by landscape metrics deserves to be further explored in the context of urban ecologyand planning
43 Structural Analysis
In a spatially explicit approach the scores of the sampling sites upon the principal axes caneasily be visualized and analyzed to examine spatial dependence (or autocorrelation see [26]) Variousmethods can be used to do so In the present study we employed the geostatistics as a convenient wayto determine whether a spatial structure is present or not and to infer the scales at which it occurs Thevariogram has proven to be a valuable tool to reveal not only the presence of spatial structures but alsotheir range For example the variogram of the first PCA axis revealed a spatial structure made of twosuperimposed structures one rather local (lt500 m) and one rather large (up to 9000m) Such featuresare very well known and currently used in various fields of life sciences [27] and their usefulness inlandscape pattern analysis has been emphasized [2829] but their dissemination in urban landscapeanalysis is yet to occur
Again these approaches could also be used to process spacendashtime data thus allowing a properassessment of spatio-temporal dynamics in situations where diachronic data are available In thecase of Niamey it is very likely that the range of the second model of the nested variogram for PC1will increase in the future as the city will expand (sprawl) However not much is known about thepresence of nested structures in urban environments
Another input of geostatistics is the search for and the characterization of anisotropic variationsof urban landscapes In the case of Niamey anisotropy was observed for the second component of thePCA (Figure 5) It was not a very marked feature of the Niamey landscape but the situation couldbe very different in other cities where growth is not so obviously concentric We showed how thevariogram map could be used to search for the directions of the main anisotropic variation and howthe directional variograms could then finely quantify both direction and magnitude Again the abilityof geostatistics (amongst other spatial statistics) has been emphasized by different authors [142730]
Urban Sci 2019 3 63 13 of 15
although its effective use in urban pattern analysis remains scarce The variogram map in particular isnot very popular even in the fields of soil science and ecology where geostatistics are widely usedOur study case illustrates the efficiency of the method and its power when used to analyze the outputsof a PCA
44 Feeding Models Refining Sampling Strategies and Setting Up Experimental Designs
Landscape metrics are frequently used in inferential statistics in order to test and identifyrelationships between environment and biological datasets such as species abundance or distributionor epidemiological data As linear combinations of landscape metrics the PCA axes are good candidatesto include in correlative analyses and statistical models One obvious advantage is that axes areindependent from each other and have stronger explanatory power than any of the landscape metricstaken individually Using PCA axes is therefore a potentially elegant way to tackle the problemof landscape metric redundancy Landscape metrics PCA and geostatistics offer a powerful tool tocharacterize the spatial pattern of the multivariate variability of urban environments As shown inthis study PCA axes reveal different levels of spatial variation of geostatistics provide a quantitativeassessment of scales and directions of variation Such information could be utilized to improvesampling strategies either for ecological or socio-economical sciences de Gruijter [31] emphasizedhow the a priori knowledge of spatial autocorrelation (dependence) could help in designing efficientsampling schemes for model-based inferences Using Niamey as an example the PC1 could be used todesign a sampling scheme accounting for the city growth pattern and choose sampling points as afunction of the values of the PC1 The sampling strategy could also be optimized to properly accountfor anisotropic variation Conversely a priori knowledge of major sources of spatial heterogeneitiescould be used to design experimental settings andor analyze their output data For example maps ofPCA components could be useful to identify the position of experimental sites while ensuring they meetsimilar urban conditions Another option would be to use this a priori knowledge to design samplingalong fine-scale urban gradients or along tracks of known isotropic or anisotropic variation gradient
Supplementary Materials The following are available online at httpwwwmdpicom2413-88513263s1 FigureS1 Map of the city of Niamey showing the surveyed districts The map was created using the R package Leaflet(Cheng et al 2017) (data copyright OpenStreetMap contributors) Reference Joe Cheng Bhaskar Karambelkarand Yihui Xie (2017) leaflet Create Interactive Web Maps with the JavaScript Leaflet Library R package version110 httpsCRANR-projectorgpackage=leaflet
Author Contributions Conceptualization J-PR and GD methodology J-PR formal analysis J-PRwritingmdashoriginal draft preparation J-PR and GD
Funding This research received no external funding
Acknowledgments We thank Ibrahima Kadaoureacute (Centre Reacutegional Agrhymet USAidFews-Net Niamey Niger)for helping in the implementation of Niamey GIS in the framework of earlier studies on rodent-borne pathogensconducted by G Dobigny and M Garba (Direction Geacuteneacuterale de la Protection des Veacutegeacutetaux) The satellite imageof Niamey is part of a Spot Image (CNES 2008 scene number 506 132 308 121 010 151 32 T) that was obtainedunder license through the ISIS program (file number 553) Our researches were conducted in the framework of thescientific partnership agreement (number 30102700) between IRD and the Republic of Niger The experimentspresented in the manuscript comply with the current laws of the Niger We are indebted to two anonymousreferees for their comments and suggestions for this manuscript
Conflicts of Interest The authors declare no conflict of interest
References
1 Mohajerani A Bakaric J Jeffrey-Bailey T The urban heat island effect its causes and mitigation withreference to the thermal properties of asphalt concrete J Environ Manag 2017 197 522ndash538 [CrossRef][PubMed]
2 Hu M-C Fan C Huang T Wang C-F Chen Y-H Urban Metabolic Analysis of a Food-Water-EnergySystem for Sustainable Resources Management Int J Enviorn Res Public Health 2019 16 90 [CrossRef][PubMed]
Urban Sci 2019 3 63 14 of 15
3 Keairns DL Darton RC Irabien A The energy-water-food nexus Annu Rev Chem Biomol Eng 2016 7239ndash262 [CrossRef] [PubMed]
4 Naidja L Ali-Khodja H Khardi S Sources and levels of particulate matter in North African andSub-Saharan cities A literature review Environ Sci Pollut Res 2018 25 12303ndash12328 [CrossRef] [PubMed]
5 Pauleit S Breuste JH Land use and surface cover as urban ecological indicators In Urban Ecology PatternProcesses and Applications Niemelauml J Ed Oxford University Press Oxford UK 2011 pp 19ndash30
6 Luck M Wu J A gradient analysis of urban landscape pattern A case study from the Phoenix metropolitanregion Arizona USA Landsc Ecol 2002 17 327ndash339 [CrossRef]
7 Seto KC Fragkias M Quantifying Spatiotemporal Patterns of Urban Land-use Change in Four Cities ofChina with Time Series Landscape Metrics Landsc Ecol 2005 20 871ndash888 [CrossRef]
8 McDonnell MJ Hahs AK The use of gradient analysis studies in advancing our understanding of theecology of urbanizing landscapes Current status and future directions Landsc Ecol 2008 23 1143ndash1155[CrossRef]
9 Turner MG Gardner RH OrsquoNeill RV Landscape Ecology in Theory and Practice Springer New York NYUSA 2001
10 Anderson PML Okereke C Rudd A Parnell S Regional Assessment of Africa In UrbanizationBiodiversity and Ecosystem Services Challenges and Opportunities Elmqvist T Fragkias M Goodness JGuumlneralp B Marcotullio PJ McDonald RI Parnell S Schewenius M Sendstad M Seto KC et alEds Springer Dordrecht The Netherlands 2013 pp 453ndash459
11 United Nations World Urbanization Prospects The 2014 Revision Highlights United Nations New York NYUSA 2014
12 McGarigal K Cushman SA Ene E FRAGSTATS v4 Spatial Pattern Analysis Program for Categorical andContinuous Maps Computer Software Program Produced by the Authors at the University of MassachusettsAmherst 2012 Available online httpwwwumassedulandecoresearchfragstatsfragstatshtml (accessedon 12 June 2019)
13 Manly BFJ Alberto JAN Multivariate Statistical Methods A Primer Chapman and HallCRC Boca RatonFL USA 2017
14 Goovaerts P Geostatistics for Natural Resources Evaluation Oxford University Press Oxford UK 199715 Isaaks EH Srivastava RM Applied Geostatistics Oxford University Press Oxford UK 198916 R Core Team R A Language and Environment for Statistical Computing R Foundation for Statistical Computing
Vienna Austria 2016 Available online httpswwwR-projectorg (accessed on 12 June 2019)17 Dray S Dufour A-B The ade4 Package Implementing the Duality Diagram for Ecologists J Stat Softw
2007 22 1ndash20 [CrossRef]18 Pebesma E Heuvelink G Spatio-temporal interpolation using gstat RFID J 2016 8 204ndash21819 Dobigny G Garba M Tatard C Loiseau A Galan M Kadaoureacute I Rossi J-P Picardeau M Bertherat E
Urban Market Gardening and Rodent-Borne Pathogenic Leptospira in Arid Zones A Case Study in NiameyNiger PLoS Negl Trop Dis 2015 9 e0004097 [CrossRef] [PubMed]
20 Herold M Scepan J Clarke KC The use of remote sensing and landscape metrics to describe structuresand changes in urban land uses Environ Plan A 2002 34 1443ndash1458 [CrossRef]
21 Mahamane M Croissance urbaine et politique de peuplement au Niger In Proceedings of the Colloque delrsquoAIDELF Rabat Morroco 15ndash17 May 1990 pp 379ndash388
22 Rossi J-P Kadaoureacute I Godefroid M Dobigny G Landscape epidemiology in urban environments Theexample of rodent-borne Trypanosoma in Niamey Niger Infect Genet Evol 2018 63 307ndash315 [CrossRef][PubMed]
23 Rossi JP van Halder I Towards indicators of butterfly biodiversity based on a multiscale landscapedescription Ecol Indic 2010 10 452ndash458 [CrossRef]
24 Buyantuyev A Wu J Effects of thematic resolution on landscape pattern analysis Landsc Ecol 2007 227ndash13 [CrossRef]
25 Buyantuyev A Wu J Gries C Multiscale analysis of the urbanization pattern of the Phoenix metropolitanlandscape of USA Time space and thematic resolution Landsc Urban Plan 2010 94 206ndash217 [CrossRef]
26 Goovaerts P Sonnet P Navarre A Factorial kriging analysis of springwater contents in the Dyle riverbasin Belgium Water Resour Res 1993 29 2115ndash2125 [CrossRef]
27 Legendre P Legendre L Numerical Ecology Elsevier Amsterdam The Netherlands 2012
Urban Sci 2019 3 63 15 of 15
28 Li H Reynolds JF On definition and quantification of heterogeneity Oikos 1995 73 280ndash284 [CrossRef]29 Li H Wu J Landscape pattern analysis Key issues and challenges In Key Topics in Landscape Ecology
Cambridge University Press Cambridge UK 200730 Wu J Buyantuyev A Jenerette GD Litteral J Neil K Shen W Quantifying spatiotemporal patterns
and ecological effects of urbanization A multiscale landscape approach In Applied Urban Ecology A GlobalFramework Wiley Online Library Hoboken NJ USA 2011 pp 33ndash53
31 De Gruijter J Brus DJ Bierkens MFP Knotters M Sampling for Natural Resource Monitoring SpringerBerlinHeidelberg Germany 2006
copy 2019 by the authors Licensee MDPI Basel Switzerland This article is an open accessarticle distributed under the terms and conditions of the Creative Commons Attribution(CC BY) license (httpcreativecommonsorglicensesby40)
- Introduction
- Materials and Methods
-
- Study City Niamey
- Landscape Metrics
- Multivariate Analysis Using the Principal Component Analysis (PCA)
- Variograms
-
- Results
-
- PCA Eigenvalues According to Buffer Sizes
- Citywide Variation of Landscape Features
- Variography of PCA First Components
-
- Discussion
-
- Niamey
- Multivariate Analysis
- Structural Analysis
- Feeding Models Refining Sampling Strategies and Setting Up Experimental Designs
-
- References
-
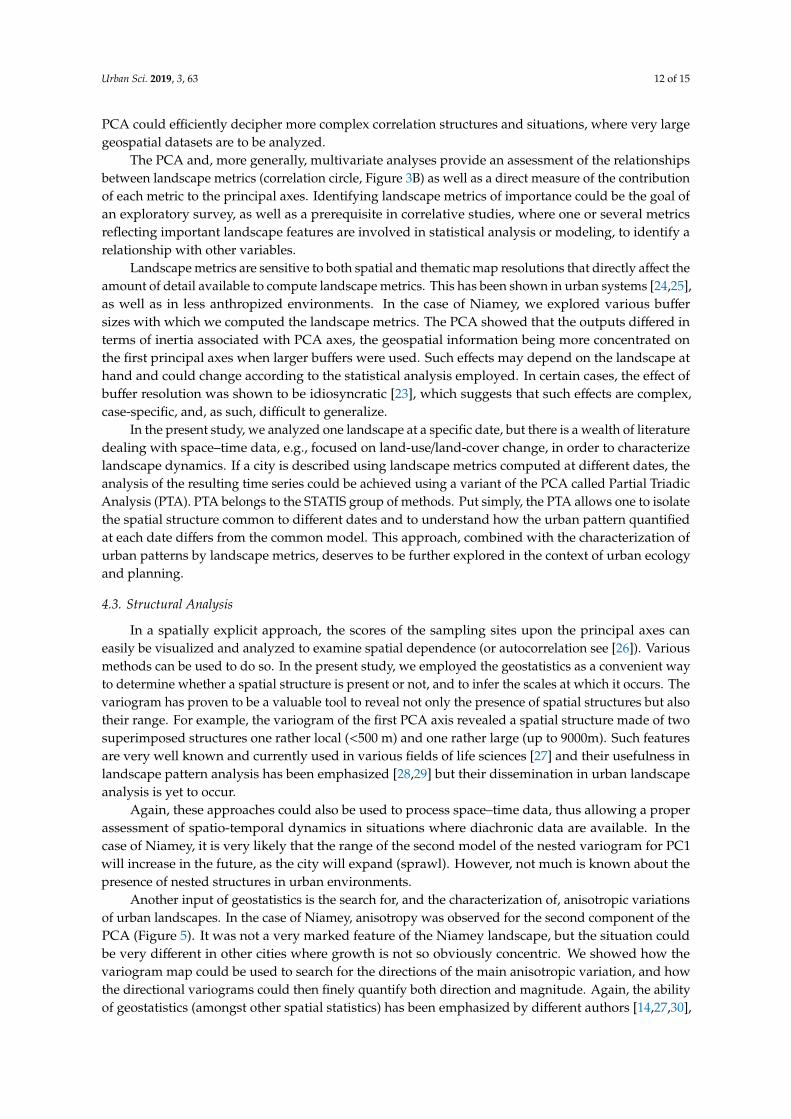