Urban Indian Health Institute A Division of the Seattle ...€¦ · Urban Indian Health Institute A...
3
Urban Indian Health Institute A Division of the Seattle Indian Health Board www.uihi.org October 2013 Noise PollutioN iN the urbaN eNviroNmeNt a pilot study of the seattle indian health board neighborhood background Noise pollution has been linked to a variety of health conditions in both occupational and community studies. Excess noise levels are a well-recognized cause of hearing loss. 1 Additionally, noise pollution has been linked to cognitive deficits, 2 sleep disturbance, 3,4 hypertension, 5 heart disease, 6 and diabetes. 7 The health impacts of excess noise in the environment may be especially deleterious for children. 8,9 While the mechanism linking noise to health is not fully understood, the association may, in part, be explained by stress responses. 10,11 Noise is not uniformly distributed in urban settings. Excess noise pollution commonly occurs in predictable settings (e.g., near traffic, industry or transportation systems) and disproportionately impacts individuals living in these areas. We chose noise pollution as a focus for this pilot study because we believe that low income populations, like the one served by the Seattle Indian Health Board, often must accept less desirable housing conditions, including living in areas with excess noise. While this pilot did not attempt to link noise pollution with residential areas of interest, it was designed as a proof of concept for the feasibility of future studies. Noise pollution is also an indicator that is easy to measure and collect with mobile devices. Purpose The Urban Indian Health Institute (UIHI) set out to conduct a pilot study evaluating the relationship between neighborhood noise levels and other socioeconomic factors. In addition and primarily, the UIHI wanted to evaluate community-based data collection efforts and tools in order to make a recommendation for use in other Urban Indian Health Organizations (UIHOs). methods There were five stages in this project: preparation, recruitment, training, data collection and analysis. During the preparation stage, project staff finalized the training method and manual as well as the procedures for the next four stages. When these preparations were complete, we began recruitment. There were seven total participants including staff from the SIHB administration and clinic as well as the UIHI. The participants were selected to be representative of staff from other UIHOs who would likely have limited experience with data collection and geographic information systems (GIS). We scheduled training sessions around the participants’ schedules during working hours. We conducted a mix of one-on-one and two-on-one trainings. During each session, the trainer introduced the project, demonstrated the data collection workflow on an iPad and then supervised participants’ efforts with their own trial data collection. The workflow consisted of using an iPad to collect and export noise data, take a site picture, and collect and export location data. Project brieF
Transcript of Urban Indian Health Institute A Division of the Seattle ...€¦ · Urban Indian Health Institute A...

Urban Indian Health InstituteA Division of the Seattle Indian Health Board
www.uihi.orgOctober 2013
Noise PollutioN iN the urbaN eNviroNmeNta pilot study of the seattle indian health board neighborhood
backgroundNoise pollution has been linked to a variety of health conditions in both occupational and community studies. Excess noise levels are a well-recognized cause of hearing loss.1
Additionally, noise pollution has been linked to cognitive deficits,2 sleep disturbance,3,4 hypertension,5 heart disease,6 and diabetes.7 The health impacts of excess noise in the environment may be especially deleterious for children.8,9 While the mechanism linking noise to health is not fully understood, the association may, in part, be explained by stress responses.10,11 Noise is not uniformly distributed in urban settings. Excess noise pollution commonly occurs in predictable settings (e.g., near traffic, industry or transportation systems) and disproportionately impacts individuals living in these areas. We chose noise pollution as a focus for this pilot study because we believe that low income populations, like the one served by the Seattle Indian Health Board, often must accept less desirable housing conditions, including living in areas with excess noise. While this pilot did not attempt to link noise pollution with residential areas of interest, it was designed as a proof of concept for the feasibility of future studies. Noise pollution is also an indicator that is easy to measure and collect with mobile devices.
PurposeThe Urban Indian Health Institute (UIHI) set out to conduct a pilot study evaluating the relationship between neighborhood noise levels and other socioeconomic factors. In addition and primarily, the UIHI wanted to evaluate community-based data collection efforts and tools in order to make a recommendation for use in other Urban Indian Health Organizations (UIHOs).
methods There were five stages in this project: preparation, recruitment, training, data collection and analysis. During the preparation stage, project staff finalized the training method and manual as well as the procedures for the next four stages. When these preparations were complete, we began recruitment. There were seven total participants including staff from the SIHB administration and clinic as well as the UIHI. The participants were selected to be representative of staff from other UIHOs who would likely have limited experience with data collection and geographic information systems (GIS). We scheduled training sessions around the participants’ schedules during working hours. We conducted a mix of one-on-one and two-on-one trainings. During each session, the trainer introduced the project, demonstrated the data collection workflow on an iPad and then supervised participants’ efforts with their own trial data collection. The workflow consisted of using an iPad to collect and export noise data, take a site picture, and collect and export location data. Pr
oje
ct b
rieF

2
Decibel 10th is a free app that we used for collecting noise data and GISPro is a paid app we used for geographic data collection. Data collections were scheduled around participants’ work schedules. Project staff chose 11 sites that were within walking distance of the UIHI and SIHB offices. We assigned these sites to the participants and allowed them to choose an additional site. Participants completed surveys after they completed data collection. During the analysis phase, decibel data were averaged for each site and exported from the iPad to be analyzed with QGIS, free desktop geographic analysis and mapping software. In QGIS, the relationship between economic data and noise data was shown geographically. Site data points were color-coded to show different noise levels, and zip codes were color-coded to match income levels. We used Stata 13 for basic statistical analysis of other socioeconomic indicators.
resultsFor the purposes of this pilot project, we considered the process evaluation our primary outcome of interest because we were most interested in producing a recommendation about these products for UIHOs. Given the proximity of the sites to each other and the pilot
nature of this work, we did not conduct extensive analysis of the collected data. We collected 17 total geospatial data points spanning three zip codes (Figure 1). The average decibel reading was 65 decibels. In general, there was little variation in average noise levels by site, though there was some correlation between high-traffic sites and high decibel readings (Table 1). Six participants completed the survey following data collection. The surveys revealed that overall, participants were comfortable with the experience and enjoyed it. All participants that completed a survey strongly agreed that the training session prepared them for data collection in the field (Table 2). About half of the participants expressed that
they did not feel completely confident in their abilities to collect data before heading out, but repetition seemed to alleviate many of these concerns. Other favorable aspects of the work noted by participants included enjoying the work-related outdoor time, traveling to sites and seeing the noise levels for some of the places they visit frequently.
conclusionWe recommend these products and tools to UIHOs interested in completing a study that involves collecting geographic data. Participants found the iPad apps were easy to use and enjoyed participating in the data collection process. Program staff found the data easy to analyze and the QGIS software straightforward and powerful. It is important to recognize that QGIS is not completely free in that use requires a knowledge of GIS and how to use complex mapping features. UIHOs would either have to make an investment in a GIS professional or the education of a current staff member to manage a project with these tools.
Figure 1. average decibel reading at each data collection site and per capita income of zip codes; yellow star indicates location of the seattle indian health board; seattle, Wa; 2013
3
Future DirectionsAs a follow-up to this pilot, we propose five projects we consider to be appropriate with our easily customizable workflow:
1. Mapping of Medicaid enrollment sites to compare with distribution of target enrollment population2. Expanding on previous food source mapping project completed by the UIHI (http://www.uihi.org/wp-content/uploads/2012/03/NLM-SFR-Final-Report_2012-03-23.pdf) to include more neighborhoods and public physical activity spaces3. Mapping community health centers and their services in proximity to the urban AI/AN population4. Expanding noise mapping to a wider region with more scientific data collection methodology (revise and expand this pilot project)
acknowledgementsWe would like to thank John Scott, the Center for Public Service Communications and the National Library of Medicine for their support of this pilot. We would also like to thank Kurt Menke for his expertise and guidance throughout this project.
references1. Rabinowitz PM. Noise-induced hearing loss. Am Fam
Physician. May 1 2000;61(9):2749-2756, 2759-2760.2. van Kempen E, van Kamp I, Nilsson M, et al. The role of
annoyance in the relation between transportation noise and children’s health and cognition. J Acoust Soc Am. Nov 2010;128(5):2817-2828.
3. Fyhri A, Aasvang GM. Noise, sleep and poor health: Modeling the relationship between road traffic noise and cardiovascular problems. Sci Total Environ. Oct 1 2010;408(21):4935-4942.
4. Zaharna M, Guilleminault C. Sleep, noise and health: review. Noise Health. Apr-Jun 2010;12(47):64-69.
5. Bodin T, Albin M, Ardo J, Stroh E, Ostergren PO, Bjork J. Road traffic noise and hypertension: results from a cross-sectional public health survey in southern Sweden. Environ Health. 2009;8:38.
6. Gan WQ, Davies HW, Koehoorn M, Brauer M. Association of long-term exposure to community noise and traffic-related air pollution with coronary heart disease mortality. Am J Epidemiol. May 1 2012;175(9):898-906.
7. Nicole W. Road traffic noise and diabetes: long-term exposure may increase disease risk. Environ Health Perspect. Feb 1 2013;121(2):a60.
8. Brookhouser PE, Worthington DW, Kelly WJ. Noise-induced hearing loss in children. Laryngoscope. Jun 1992;102(6):645-655.
9. Brookhouser PE. Prevention of noise-induced hearing loss. Prev Med. Sep 1994;23(5):665-669.
10. Babisch W. The Noise/Stress Concept, Risk Assessment and Research Needs. Noise Health. 2002;4(16):1-11.
11. Babisch W. Stress hormones in the research on cardiovascular effects of noise. Noise Health. Jan-Mar 2003;5(18):1-11.
contact usPlease contact the Urban Indian Health Institute with your comments: [email protected] or 206-812-3030.
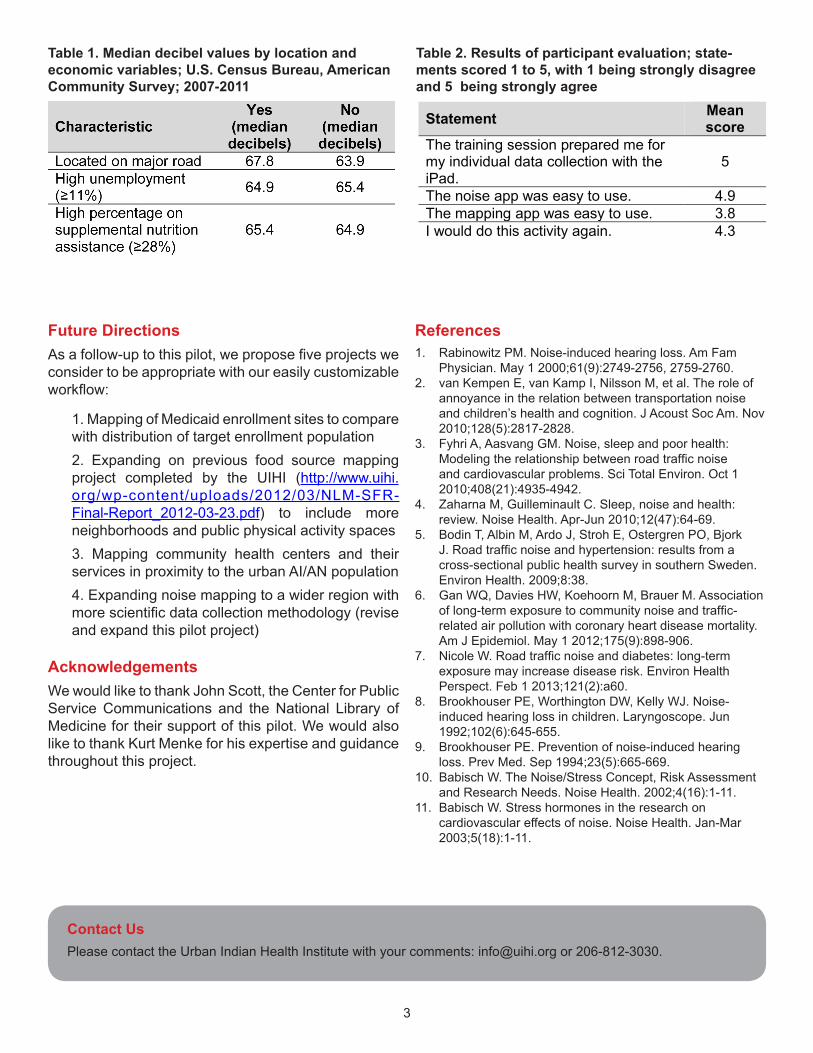
table 1. median decibel values by location and economic variables; u.s. census bureau, american community survey; 2007-2011
table 2. results of participant evaluation; state-ments scored 1 to 5, with 1 being strongly disagree and 5 being strongly agree
Statement Mean score
The training session prepared me for my individual data collection with the iPad.
5
The noise app was easy to use. 4.9 The mapping app was easy to use. 3.8 I would do this activity again. 4.3