URBAN GROWTH MODELING USING FUZZY LOGIC · ASPRS 2012 Annual Conference Sacramento, California ♦...
10
ASPRS 2012 Annual Conference Sacramento, California ♦ March 19-23, 2012 URBAN GROWTH MODELING USING FUZZY LOGIC Ehsan Foroutan, MSc. Student GIS Division, Dept. of Surveying and Geomatics Eng., College of Eng. University of Tehran, North Kargar St, 11155-4563, Tehran, Iran [email protected] Mahmoud Reza Delavar Center of Excellence in Geomatics Eng. and Disaster Management Dept. of Surveying and Geomatics Eng., College of Eng. University of Tehran, North Kargar St, 11155-4563, Tehran, Iran [email protected] ABSTRACT This study presents a GIS-based fuzzy logic approach to model urban growth in Isfahan metropolitan area in the center of Iran. Urban growth models can be used to simulate and predict urbanization process and demonstrate the complex spatial and temporal interaction of the growth variables. Fuzzy logic preserves the continuity of urban dynamics spatially by selecting fuzzy membership functions, fuzzy rules, and the fuzzification-defuzzification process. Vagueness in some descriptive or uncertain knowledge of the process can be better represented with fuzzy logic rules, since it utilizes the descriptive power of fuzzy logic as a powerful intelligence technique to map the effects of various parameters to the urban growth phenomenon and expresses it in sensible terms. Historical land use/cover data of Isfahan metropolitan area were extracted from the 1990 and 2001 Landsat ETM + images and employed in order to simulate urban growth. In this study the effect of urban growth preferences is determined by the expert and restated in a rule-based form which is applied into the model. A map of urban growth suitability is produced and used to select the best threshold value that coincide the simulated map into the real land use map. Three quantified parameters have been employed to validate the proposed model including: Area under the relative operating characteristic (ROC), overall map accuracy (OMA) and kappa statistic. ROC value of 0.80 indicates that the suitability map is valid. Also the overall map accuracy (OMA) and Kappa Statistic (KS) values are 0.78 and 0.55 respectively, prove the validity of the model. KEYWORDS: Urban Growth Modeling, Fuzzy Logic, Validation, ROC, Kappa, OMA INTRODUCTION The term urbanization refers to the process of a population changing from rural to urban (Mantelas et al., 2008). Complexity of urban systems necessitates the consideration of interdependency among various factors for urban expansion modeling (Pijanowski et al., 2009). Developing methods of assessing different urban growth planning scenarios regarding the future consequences of land use and the progress of current spatial plans and policies is critically important for urban and regional planners (Al-Ahmadi et al., 2009). In recent years, a number of modeling techniques have been developed to better understand and predict urban growth (Hu and Lo, 2007; Li and Yeh, 2002; Silva and Clarke, 2002; Yeh and Li, 2002). Modeling is essential for the analysis, and especially for the prediction, of the dynamics of urban growth (Foroutan and Delavar, 2012). In recent years, artificial intelligence techniques have attracted considerable attention in urban modeling for many reasons. Intelligence techniques such as artificial neural networks (ANNs), fuzzy logic, and genetic algorithms (GAs) have been popular tools, since they can deal with complex engineering problems which are difficult to solve by classical methods. These techniques are used in many spatial fields such as urban modeling. Urban growth phenomenon as a spatio-temporal continuous process is subject to uncertainty and ambiguity. This inherent vagueness cannot be addressed by the conventional methods based on the Boolean algebra. A fuzzy logic model is a rule-based and therefore open to interpretation. As urban dynamics are the product of both physical constraints and human decision-making behavior (both of which are characterized by ambiguity and uncertainty), the use of fuzzy logic is highly suitable for defining the rules controlling urban development (Al-Ahmadi, et al., 2009). Proponents of this approach contend that for handling uncertainties and complexity in decision-making,
Transcript of URBAN GROWTH MODELING USING FUZZY LOGIC · ASPRS 2012 Annual Conference Sacramento, California ♦...

ASPRS 2012 Annual Conference
Sacramento, California ♦ March 19-23, 2012
URBAN GROWTH MODELING USING FUZZY LOGIC
Ehsan Foroutan, MSc. Student
GIS Division, Dept. of Surveying and Geomatics Eng., College of Eng.
University of Tehran, North Kargar St, 11155-4563, Tehran, Iran
Mahmoud Reza Delavar
Center of Excellence in Geomatics Eng. and Disaster Management
Dept. of Surveying and Geomatics Eng., College of Eng.
University of Tehran, North Kargar St, 11155-4563, Tehran, Iran
ABSTRACT
This study presents a GIS-based fuzzy logic approach to model urban growth in Isfahan metropolitan area in the
center of Iran. Urban growth models can be used to simulate and predict urbanization process and demonstrate the
complex spatial and temporal interaction of the growth variables. Fuzzy logic preserves the continuity of urban
dynamics spatially by selecting fuzzy membership functions, fuzzy rules, and the fuzzification-defuzzification
process. Vagueness in some descriptive or uncertain knowledge of the process can be better represented with fuzzy
logic rules, since it utilizes the descriptive power of fuzzy logic as a powerful intelligence technique to map the
effects of various parameters to the urban growth phenomenon and expresses it in sensible terms. Historical land
use/cover data of Isfahan metropolitan area were extracted from the 1990 and 2001 Landsat ETM+ images and
employed in order to simulate urban growth. In this study the effect of urban growth preferences is determined by
the expert and restated in a rule-based form which is applied into the model. A map of urban growth suitability is
produced and used to select the best threshold value that coincide the simulated map into the real land use map.
Three quantified parameters have been employed to validate the proposed model including: Area under the relative
operating characteristic (ROC), overall map accuracy (OMA) and kappa statistic. ROC value of 0.80 indicates that
the suitability map is valid. Also the overall map accuracy (OMA) and Kappa Statistic (KS) values are 0.78 and 0.55
respectively, prove the validity of the model.
KEYWORDS: Urban Growth Modeling, Fuzzy Logic, Validation, ROC, Kappa, OMA
INTRODUCTION
The term urbanization refers to the process of a population changing from rural to urban (Mantelas et al., 2008).
Complexity of urban systems necessitates the consideration of interdependency among various factors for urban
expansion modeling (Pijanowski et al., 2009). Developing methods of assessing different urban growth planning
scenarios regarding the future consequences of land use and the progress of current spatial plans and policies is
critically important for urban and regional planners (Al-Ahmadi et al., 2009). In recent years, a number of modeling
techniques have been developed to better understand and predict urban growth (Hu and Lo, 2007; Li and Yeh, 2002;
Silva and Clarke, 2002; Yeh and Li, 2002). Modeling is essential for the analysis, and especially for the prediction,
of the dynamics of urban growth (Foroutan and Delavar, 2012). In recent years, artificial intelligence techniques
have attracted considerable attention in urban modeling for many reasons. Intelligence techniques such as artificial
neural networks (ANNs), fuzzy logic, and genetic algorithms (GAs) have been popular tools, since they can deal
with complex engineering problems which are difficult to solve by classical methods. These techniques are used in
many spatial fields such as urban modeling.
Urban growth phenomenon as a spatio-temporal continuous process is subject to uncertainty and ambiguity.
This inherent vagueness cannot be addressed by the conventional methods based on the Boolean algebra. A fuzzy
logic model is a rule-based and therefore open to interpretation. As urban dynamics are the product of both physical
constraints and human decision-making behavior (both of which are characterized by ambiguity and uncertainty),
the use of fuzzy logic is highly suitable for defining the rules controlling urban development (Al-Ahmadi, et al.,
2009). Proponents of this approach contend that for handling uncertainties and complexity in decision-making,
ASPRS 2012 Annual Conference
Sacramento, California ♦ March 19-23, 2012
fuzzy sets and fuzzy logic are ideally suited. Fuzzy logic preserves the continuity of urban dynamics spatially by
choosing fuzzy membership functions, fuzzy rules, and the fuzzification-defuzzification process (Al-Kheder, 2007).
Fuzzy logic theory has been introduced by Zadeh (1965) as an extension to the binary crisp set theory which deals
with classification of elements or phenomena that have continuous values. Classification of phenomena with
continuous values is accomplished by providing a gradual transition between different classes, representing different
degrees of effect. Fuzzy logic provides a way to express the degree of membership to a particular class or set
(Dragicevic, 2004). This unique nature of fuzzy logic theory makes it suitable to represent geographic processes that
contain geospatial elements belonging to multiple classes with different degrees of memberships. Fuzzy logic theory
fits the nature of geospatial problems where it is difficult to identify the boundary and the content of an entity
through a crisp threshold and is an attractive technique. Mimicking the continuous nature of most complex
processes, including urban growth, fuzzy logic theory fits the urban growth problem as a representation of inherited
semantic knowledge to represent its gradual effect (Liu and Phinn, 2003). For example, fuzzy logic theory can be
used to characterize urban growth potential as low, medium, or high according to terrain elevation, which is
impossible with crisp theory (Al-Kheder, 2007).
This paper presents a new method for generating an urban growth suitability map which applies fuzzy logic
theory as an artificial intelligence and a rule-based method that employs semantic knowledge of expert to represent
urban growth preferences. The produced suitability map has been validated using relative operating characteristic
(ROC) parameter. In addition, using overall map accuracy and kappa statistic index the best threshold values for
simulating ground truth have been extracted.
STUDY AREA
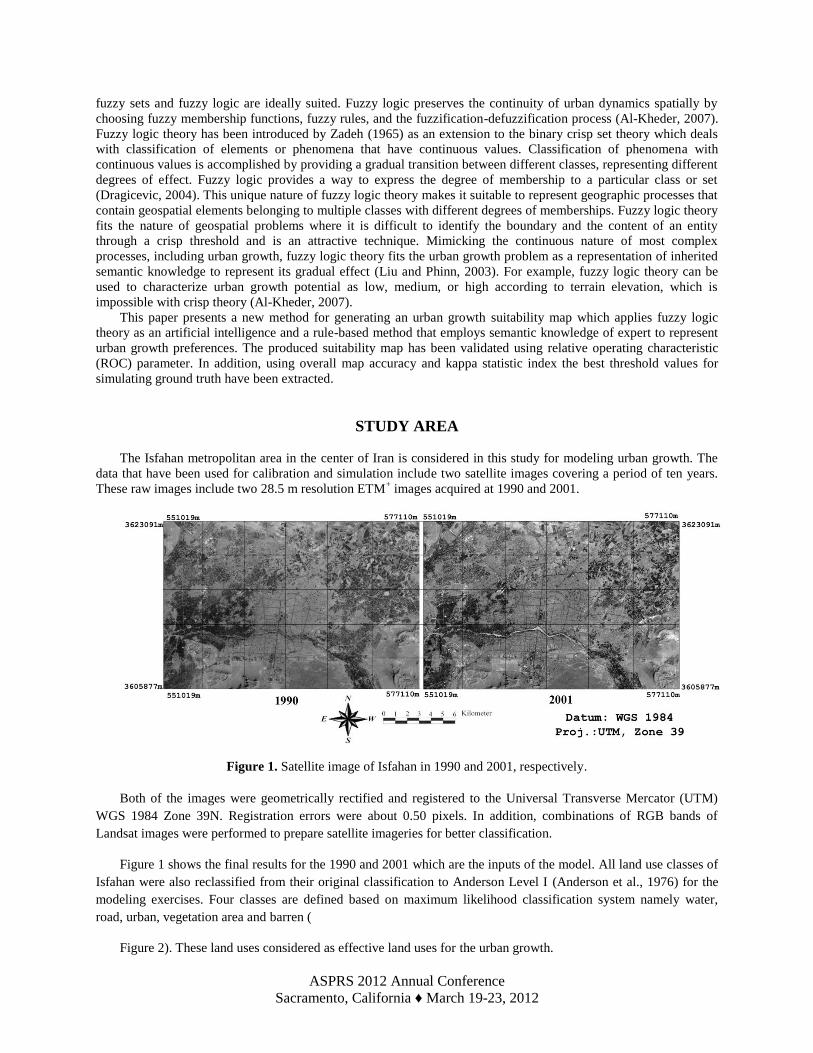
The Isfahan metropolitan area in the center of Iran is considered in this study for modeling urban growth. The
data that have been used for calibration and simulation include two satellite images covering a period of ten years.
These raw images include two 28.5 m resolution ETM+ images acquired at 1990 and 2001.
Figure 1. Satellite image of Isfahan in 1990 and 2001, respectively.
Both of the images were geometrically rectified and registered to the Universal Transverse Mercator (UTM)
WGS 1984 Zone 39N. Registration errors were about 0.50 pixels. In addition, combinations of RGB bands of
Landsat images were performed to prepare satellite imageries for better classification.
Figure 1 shows the final results for the 1990 and 2001 which are the inputs of the model. All land use classes of
Isfahan were also reclassified from their original classification to Anderson Level I (Anderson et al., 1976) for the
modeling exercises. Four classes are defined based on maximum likelihood classification system namely water,
road, urban, vegetation area and barren (
Figure 2). These land uses considered as effective land uses for the urban growth.

ASPRS 2012 Annual Conference
Sacramento, California ♦ March 19-23, 2012
Figure 2. Isfahan land use map in 1990 and 2001, respectively.
METHODOLOGY
The development suitability or growth potential of a cell ij is a function of four drivers that potentially
contribute and affect the spatial patterns of the urban growth. This relation can be written as (1):
),D,D,D=f(Dij
GPijijijij GrnRvrStrUrb
(1)
whereij
GP is growth potential of cell ij and ijUrbD ,
ijStrD ,ijRvrD ,
ijGrnD are the Euclidian distances between
non-urban cell ij and the nearest urban, street, river, and green area, respectively. f is fuzzy inference
system that is composed of a set of rules and membership functions. Fuzzy inference system is composed of
the three components presented in
Figure 3.
Figure 3. Fuzzy Inference System (Cordón et al., 2001).
Fuzzification Fuzzification of input variables is the first step in a fuzzy inference system that takes the inputs and determines
the degree to which they belong to each of the appropriate fuzzy sets using membership functions. In the proposed
fuzzy inference system, input variables are Euclidian distances between non-urban areas and effective factors of the
urban growth. In order to apply the maximum effect of urban growth drivers, the minimum distance must be

ASPRS 2012 Annual Conference
Sacramento, California ♦ March 19-23, 2012
considered and be used in fuzzy membership function design. In case of distance as linguistic variable, there are
three linguistic labels including: near, medium and far. Figure 4 shows the membership function plots of input
variable following distance to street which is designed based on minimum and maximum distances between non-
urban and street pixels. For example, we rated the distance as 4000m, which, gives our graphical definition of
medium, corresponding to μ = 0.7 for the “Medium” membership function.
Figure 4. Membership function plots of distance to street input variables.
Inference System
The inference system is the component that derives the fuzzy outputs from the input fuzzy sets according to the
relation defined through fuzzy rules. Linguistic fuzzy rules describing the fuzzy systems consist of two parts; an
antecedent block (between the IF and THEN) and a consequent block (following THEN). In this research the
antecedent blocks are consist of linguistic values for distances, contain near, medium and far that indicate distance
between each non-urban pixels to the four urban growth drivers including: urban, street, green area and river. The
consequent blocks indicate linguistic value for growth potential including very low, low, medium, high and very
high valus. Examples of the fuzzy rules are shown in Table 1.
Table 1. Example of the fuzzy rules applied to the fuzzy inference system
R# Dist. to
Urban
Dist. to
Street
Dist. to
Vegetation
Dist. to
River
Growth
Potential
1 Near Near Near Near High
2 Medium Medium Medium Medium Medium
3 Far Far Medium Far Low
…
N … … … … …
Defuzzification
Defuzzification is the process of transforming a fuzzy output of a fuzzy inference system into a crisp output;
however, before defuzzification, aggregation is necessary. Aggregation is the combination of the consequents of
each rule in a fuzzy inference system in preparation for defuzzification. Mamdani fuzzy inference system has been
employed in this research. The fuzzy outputs for all rules are finally aggregated to one fuzzy set. To obtain a crisp
decision from this fuzzy output, we have to defuzzify the fuzzy set, or the set of singletons. Therefore, one
representative value has to be selected as the final output. Perhaps the most popular defuzzification method is the
centroid calculation, which returns the center of area under the curve. The consequence of each rule refers to one
output membership function such as very low. Membership function plots of output variable are shown in Figure 5.
Regarding the consequences of all the rules, using center of gravity (COG) defuzzification method, a crisp value
between zero and one is obtained which refers to the suitability of urban growth of each cell. For obtaining more
logical results, it is better and more appropriate for all original data to be normalized i.e. converted into a range
between 0 and 1.
minGP-maxGP
minGP -ijGP=ijPG ′ (2)
where
ijPG ′ is the normalized growth potential and
ijGP is the original growth potential of cell ij.

ASPRS 2012 Annual Conference
Sacramento, California ♦ March 19-23, 2012
Figure 5 shows the four fuzzy maps for urban growth variables at 1990, which are compiled in Arc/Info Grid
format.
Figure 5. Model input variables: The normailized maps of the four variable as fuzzy logic inputs.
RESULTS AND DISCUSSION
Based on the proposed model, a suitability map can be created through fuzzy logic inference system. This
suitability map composed of values between 0 and 1 that indicates the suitability for being urban. Using different
threshold values, different simulated map can be generated. If the suitability map were perfect, the order of the
suitability values would match the order in which urban growth occurs. In order to select the most appropriate
threshold value which can generate the closest land use map into the real on, validation parameters must be used. In
this study the overall map accuracy (OMA), Kappa Statistic (KS) and relative operating characteristic (ROC) are
applied. The OMA is parameter which calculates through confusion matrix. This matrix is also be earned by
overlaying the simulated land use map which generated using a threshold value and the land use map of reality.
Applying ten threshold values from zero to one, into suitability map, ten simulated maps and hence ten OMA is
calculated. The confusion matrix is shown in Table 2 (Pontius and Schneider, 2001).
Table 2. Confusion Matrix
Model Reality
Change Non-change Total
Change A B A+B
Non-change C D C+D
Total A+C B+D A+B+C+D
Based on Table 2, the overall map accuracy (OMA) could be calculated from (1) (Pontius and Schneider, 2001):

ASPRS 2012 Annual Conference
Sacramento, California ♦ March 19-23, 2012
DCBA
DAOMA
+++
+= (3)
Practically this parameter assesses the following parameters: (1) the urban growth is occurred in real world and
the model illustrates it, (2) the urban growth is not occurred in real world while the model has shown the growth.
Figure 6 shows the diagram of OMA versus the threshold values.
Figure 6. OMA Vs. Threshold value.
Based on the
Figure 6, the threshold value of 0.8 generates the greatest OMA value and therefore the best match with the
ground truth in 2001.
On the other hand, the OMA only uses the main diagonal elements of confusion matrix which are molded
correctly. Therefore, there is a need to have a parameter which uses all elements of confusion matrix. The kappa
statistic (KS) is a parameter to express the level of agreement between the two maps in a single number. This
parameter is calculated from Table 3 (Monserud and Leemans, 1992).
Table 3. The contingency table
Reality Model
1 0 Total
1 P11 P12 P1T
0 P21 P22 P2T
Total PT1 PT2 1
On the basis of the contingency table, many statistics can be derived as follows (Sousa et al., 2002):
c
iTiPiTPEP
c
iiiPAP
1
.)(
1
)(
(4)
And finally Kappa statistics could be calculated from (5) (Sousa, et al., 2002):

ASPRS 2012 Annual Conference
Sacramento, California ♦ March 19-23, 2012
)(1
)()(
EP
EPAPKS
(5)
It is generally considered that Kappa values for map agreement are: >0.8 is excellent; 0.6-0.8 is very good; 0.4-0.6 is
good; 0.2-0.4 is poor and <0.2 very poor (Pijanowski et al., 2005).
Figure 7 shows the diagram of KS values against threshold values.
Figure 7. KS vs. Threshold value.
Based on Figure 7 the threshold value of 0.8 generates the maximum KS value and therefore provides the best
match with the ground truth of 2001.
The ROC analysis also was used to validate the results obtained from the fuzzy logic model. This quantitative
parameter determines the ability of model to predict future changes. Relative operating characteristic (ROC) is a
parameter which is used to validate the suitability map of the urban growth. In this method there is no need to define
threshold value for generating simulated land use map and therefore this method is known as threshold-independent
method (Beguería, 2006). Using ROC, the validation of the model is not based on one pre-determined threshold.
ROC method was brought to the field of land use/cover change modeling to measure the relationship between
simulated change and real change (Pontius and Schneider, 2001). ROC method is an excellent method to evaluate
the validity of a model that predicts the occurrence of an event by comparing a probability image depicting the
probability of that event occurring and a binary image showing where that class actually exists (Hu and Lo, 2007).
ROC curve plots the rate of true positive to positive classifications against the rate of false positive to negative
classifications as threshold value is varied between 0 and 1. A ROC value of 1 indicates that there is a perfect spatial
agreement between the actual urban growth map and the predicted probability map. The series of threshold values
are specified at an equal interval 10%. Using cumulative threshold values would yield 10 threshold intervals 0-10%,
0-20%, … and 0-100%. Applying each threshold value and generating land use map and comparing with ground
truth 2001, a confusion matrix (Table 2) is created. From each confusion matrix produced from each threshold
value, a set of true positive and false positive can be calculated using Equation 6 and 7 (Hu and Lo, 2007):
CA
A%PositiveTrue
(6)
DB
B%PositiveFalse
(7)
For plotting ROC curve, false positives (FP) as X and true positives (TP) as Y are connecting as shown as in
Figure 8.

ASPRS 2012 Annual Conference
Sacramento, California ♦ March 19-23, 2012
Figure 8. ROC curve.
ROC statistic is the area under the curve that connects the plotted points and can be calculated from trapezoidal
rule (8) (Pontius and Schneider, 2001):
[ ] [ ]2/TPTPTPFPFPAUC i1ii
n
1i
i1i += +
=
+∑
(8)
ROC curve is shown in
Figure 8. The ROC value is 0.80.
Figure 9 shows the produced simulated land use map of 2001 based on threshold value of 0.8.
Figure 9. Simulated land use map of 2001 based on the selected threshold value.

ASPRS 2012 Annual Conference
Sacramento, California ♦ March 19-23, 2012
CONCLUSIONS
This paper presents a model which has been employed fuzzy logic, GIS and remote sensing in order to model
urban growth in Isfahan metropolitan area. The implementation of fuzzy logic is providing a framework for
addressing the vague and uncertain nature of urban growth phenomenon using linguistic variables and labels. Rule-
based models such as fuzzy logic are most suitable for incorporating spatial interaction effects and handling
temporal dynamics. Using different threshold values and two quantitative parameters (OMA and KS) reveals that
threshold value of 0.80 is most appropriate one and can generate the best simulated land use map. Also the
suitability map has been validated using ROC. ROC value of 0.80 indicates that the suitability map is valid and can
be used for predicting future spatial patterns. Nevertheless, it seems that selection of the fuzzy membership function
and fuzzy rules is rather subjective. However, certain optimization is needed to improve the accuracy of the model
for predicting more accurate outcomes.
REFERENCES
Al-Ahmadi, K., See, L., Heppenstall, A., and Hogg, J. (2009). Calibration of a fuzzy cellular automata model of
urban dynamics in Saudi Arabia. Ecological Complexity, 6(2), 80-101.
Al-Kheder, S. A. (2007). Urban Growth Modeling with Artificial Intelligence Techniques. PhD Thesis, Purdue
University.
Anderson, J. R., Hardy, E. E., Roach, J. T., and Witmer, R. E. (1976). A land use and land cover classification
system for use with remote sensor data. Geological Survey Professional Paper 964. US Geological Survey
Circular, 671, 7-33.
Beguería, S. (2006). Validation and evaluation of predictive models in hazard assessment and risk management.
Natural Hazards, 37(3), 315-329.
Cordón, O., Herrera, F., Hoffmann, F., and Magdalena, L. (2001). Genetic fuzzy systems: evolutionary tuning and
learning of fuzzy knowledge bases.: World Scientific Pub Co Inc.
Dragicevic, S. (2004). Coupling fuzzy sets theory and GIS-based cellular automata for land-use change modeling.
Proc. Fuzzy Information. Processing NAFIPS '04. IEEE Annual Meeting of the Processing NAFIPS'04,
Banff, Canada.
Foroutan, E., and Delavar, M. R. (2012). Urban Growth Modeling Using Genetic Algorithms And Cellular
Automata; A Case Study of Isfahan Metropolitan Area, Iran. Accpted to be published in Proc. GIS Ostrava
2012, Ostrava, Czech Republic.
Hu, Z., and Lo, C. (2007). Modeling urban growth in Atlanta using logistic regression. Computers, Environment and
Urban Systems, 31(6), 667-688.
Li, X., and Yeh, A. G. O. (2002). Urban simulation using principal components analysis and cellular automata for
land-use planning. Photogrammetric Engineering and Remote Sensing, 68(4), 341-352.
Liu, Y., and Phinn, S. R. (2003). Modelling urban development with cellular automata incorporating fuzzy-set
approaches. Computers, Environment and Urban Systems, 27(6), 637-658.
Mantelas, L., Hatzichristos, T., and Prastacos, P. (2008). Modeling urban growth using fuzzy cellular automata.
Proc. 11th AGILE International Conference on Geographic Information Science, University of Girona,
Spain.
Monserud, R. A., and Leemans, R. (1992). Comparing global vegetation maps with the Kappa statistic. Ecological
Modelling, 62(4), 275-293.
Pijanowski, B. C., Pithadia, S., Shellito, B. A., and Alexandridis, K. (2005). Calibrating a neural network‐based
urban change model for two metropolitan areas of the Upper Midwest of the United States. International
Journal of Geographical Information Science, 19(2), 197-215.
Pijanowski, B. C., Tayyebi, A., Delavar, M., and Yazdanpanah, M. (2009). Urban expansion simulation using
geospatial information system and srtificial neural networks. International Journal of Environmental
Research, 3(4), 493-502.
Pontius, R. G., and Schneider, L. C. (2001). Land-cover change model validation by an ROC method for the Ipswich
watershed, Massachusetts, USA. Agriculture, Ecosystems & Environment, 85(1-3), 239-248.
Silva, E. A., and Clarke, K. C. (2002). Calibration of the SLEUTH urban growth model for Lisbon and Porto,
Portugal. Computers, Environment and Urban Systems, 26(6), 525-552.

ASPRS 2012 Annual Conference
Sacramento, California ♦ March 19-23, 2012
Sousa, S., Caeiro, S., and Painho, M. (2002). Assessment of map similarity of categorical maps using Kappa
statistics. ISEGI, Lisbon.
Yeh, A. G. O., and Li, X. (2002). Urban simulation using neural networks and cellular automata for land use
planning. Proc. The Symposium on Geospatial Theory, Processing and Applications, Ottawa, Canada.
Zadeh, L. A. (1965). Fuzzy sets. Information and Control, 8(3), 338-353.