Urban Growth in China: Challenges and Prospects · PDF fileUrban Growth in China: Challenges...
35
Urban Growth in China: Challenges and Prospects Karen C. Seto Department of Geological and Environmental Sciences and Freeman Spogli Institute for International Studies Stanford University
Transcript of Urban Growth in China: Challenges and Prospects · PDF fileUrban Growth in China: Challenges...

Urban Growth in China:Challenges and Prospects
Karen C. SetoDepartment of Geological and Environmental Sciences
andFreeman Spogli Institute for International Studies
Stanford University

Urbanization in a global contextUrbanization in a global context
• >50% of world population
• 30% urban in 1950, estimated 60% urban in 2030
• 19 megacities > 10 million
• 22 cities with 5 with 10 million
• 370 cities with 1 to 5 million
• 440 cities with 0.5 to 1 million
• Highest growth rates in medium-sized cities (1-5 million)
0
10
20
30
40
50
60
70
80
90
100
Africa Asia Centra America Europe North America South America
Perc
ent 1970
20002025
Urban Population as Percentage of Total Population
Source: United Nations, 2004. World Population Prospects

Forecasted Megacities, 2015
Sources: Kraas, Univ. of Cologne and United Nations, 2004

Crisis or Opportunity?Crisis or Opportunity?
• Driving forces in economic growth• Efficient use of infrastructure• Delivery of health services• Sanitation• Education• “Saving land for nature”• Efficient natural resource use• Creative social capital
• Environmental degradation• Loss of agricultural land• Pressure on natural resources (energy, water, land) • Inadequate housing• Consumption patterns• Urban sprawl• Social alienation
Cities as solutionsCities as problems

Urbanization trends in ChinaUrbanization trends in China
• One quarter of world’s 500 largest urban areas in China
• 2050: China’s urban population increase by 300-700 mil.
• 2002 urbanization rate: 36%
• 2050 urbanization rate: 70%
• US (2000): 77%
• Japan (2000): 79%
• Germany (2000): 88%

Comparative Urbanization TrendsComparative Urbanization Trends
51159200,000-500,000
1644500,000-1 mill
934> 1 million
03> 10 million
USChinaPopulation, 2000
Sources: China Population Yearbook and US Census

Comparative Urbanization TrendsComparative Urbanization Trends
Sources: China Population Yearbook and US Census
2000 EMR 2000 EMR Shanghai 10,840,000 18,420,000 New York 8,008,000 22,000,000Beijing 12,780,000 15,200,000 Los Angeles 3,694,000 18,080,000Tianjin 5,096,000 9,848,000 Chicago 2,896,000 9,312,000Wuhan 4,488,000 7,182,000 Houston 1,954,000 4,407,000Guangzhou 4,154,000 10,156,000 Philadelphia 1,517,000 5,952,000Shenyang 3,981,000 6,730,000 Phoenix 1,321,000 3,072,000Chongqing 3,934,000 7,577,000 San Diego 1,223,000 2,780,000Nanjing 2,822,000 6,238,000 Dallas 1,188,000 4,802,000Harbin 2,672,000 9,630,000 San Antonio 1,144,000 1,538,000Xian 2,589,000 5,860,000 Detroit 951,000 5,467,000Chengdu 2,341,000 9,901,000 San Jose 911,000 6,816,000
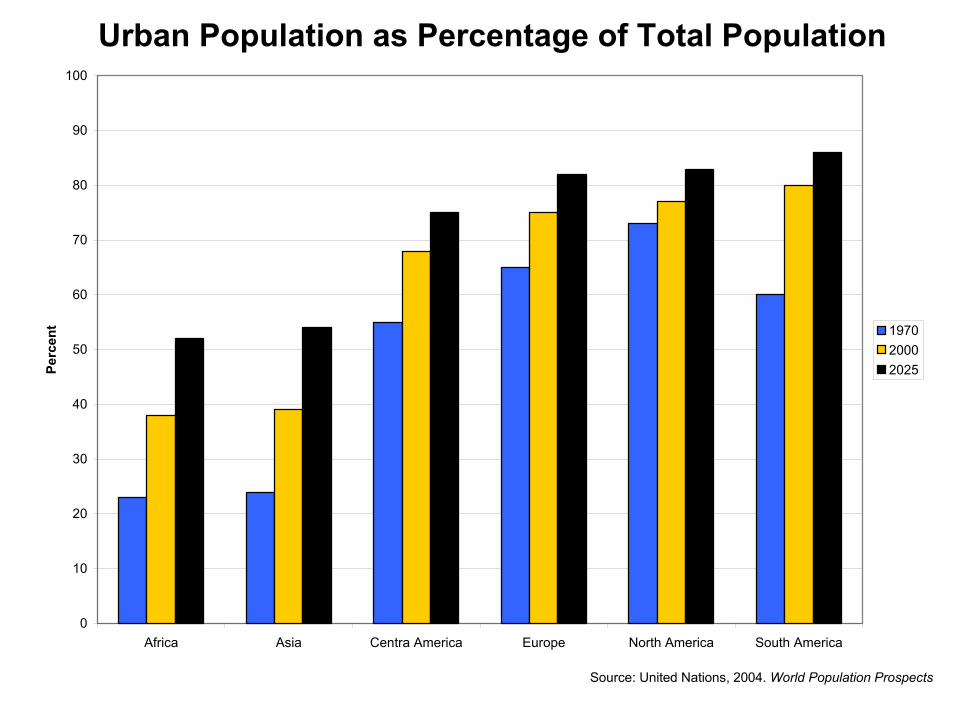
Policy Reforms and Urban Growth in China
• Rural-urban migration
• Rapid urban growth
• Agricultural expansion & intensification
• GDP, 1978-2002: 8-14%
• Increase in income- vehicles- housing- changes in diet
• Began in 1978
• Decentralization
• Open-door, FDI
• Agricultural reforms
• Land-use rights
• Household registrationsystem (hukou)
• Work unit (danwei)
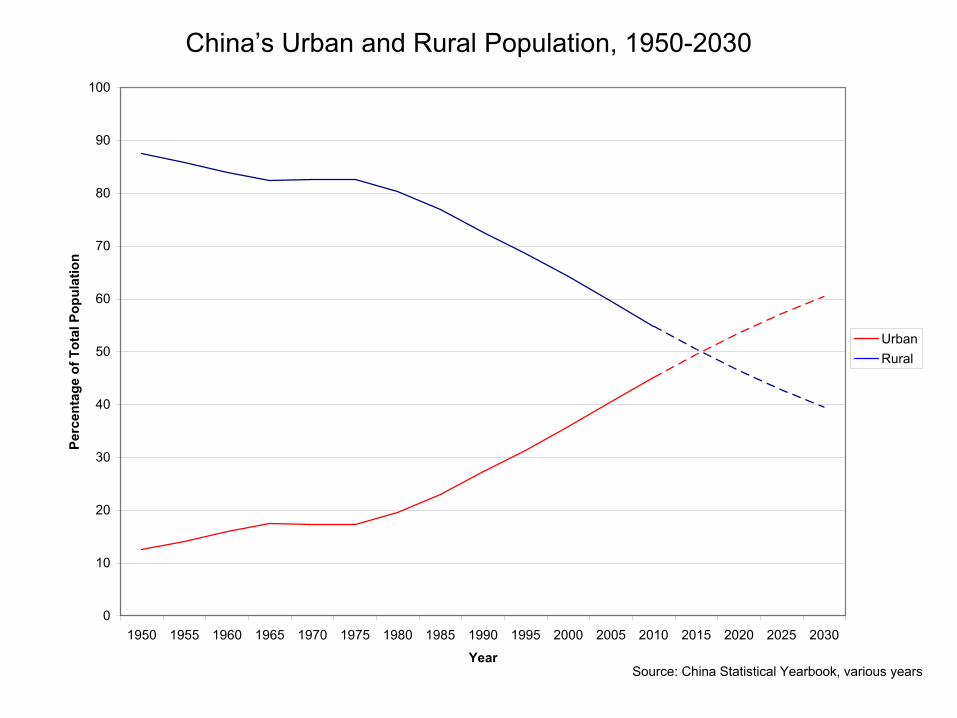
0
10
20
30
40
50
60
70
80
90
100
1950 1955 1960 1965 1970 1975 1980 1985 1990 1995 2000 2005 2010 2015 2020 2025 2030
Year
Perc
enta
ge o
f Tot
al P
opul
atio
n
UrbanRural
Source: China Statistical Yearbook, various years
China’s Urban and Rural Population, 1950-2030
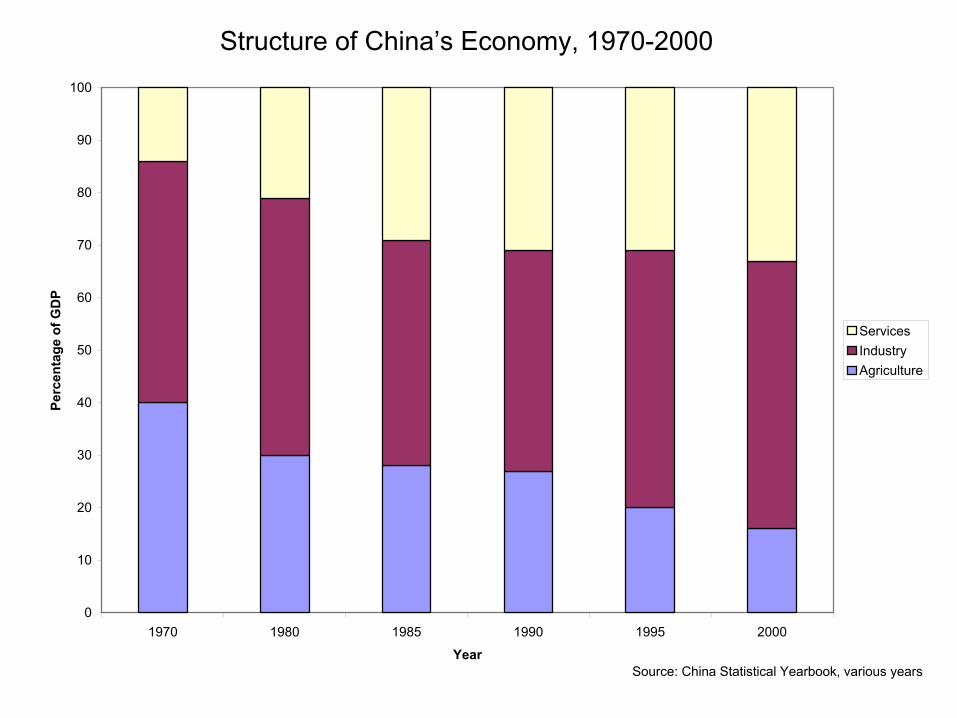
0
10
20
30
40
50
60
70
80
90
100
1970 1980 1985 1990 1995 2000
Year
Perc
enta
ge o
f GD
P
ServicesIndustryAgriculture
Source: China Statistical Yearbook, various years
Structure of China’s Economy, 1970-2000
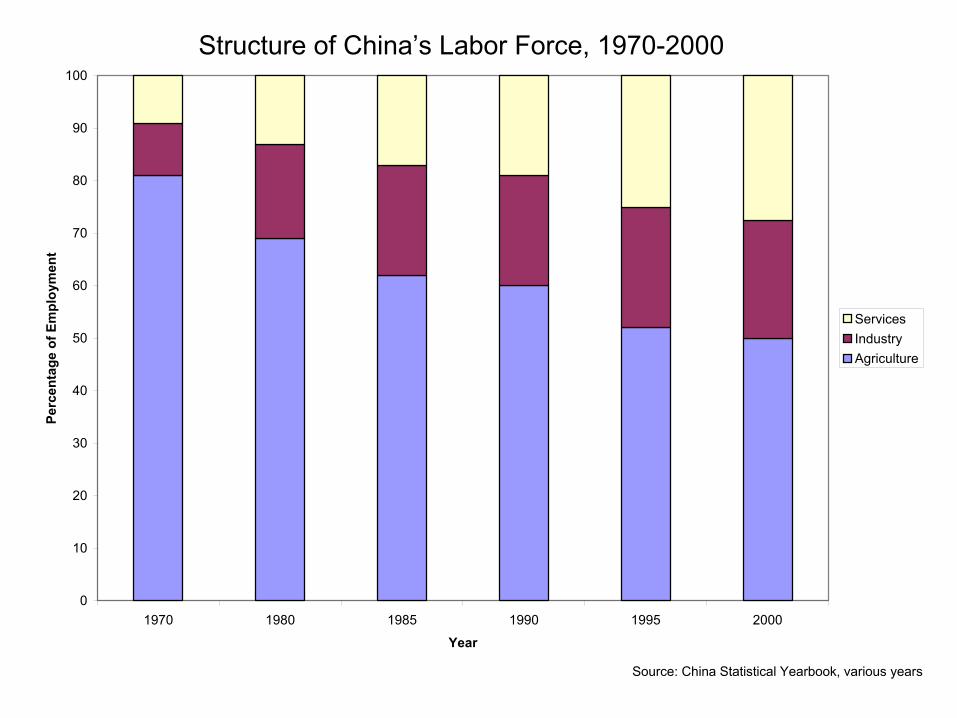
0
10
20
30
40
50
60
70
80
90
100
1970 1980 1985 1990 1995 2000
Year
Perc
enta
ge o
f Em
ploy
men
t
ServicesIndustryAgriculture
Source: China Statistical Yearbook, various years
Structure of China’s Labor Force, 1970-2000
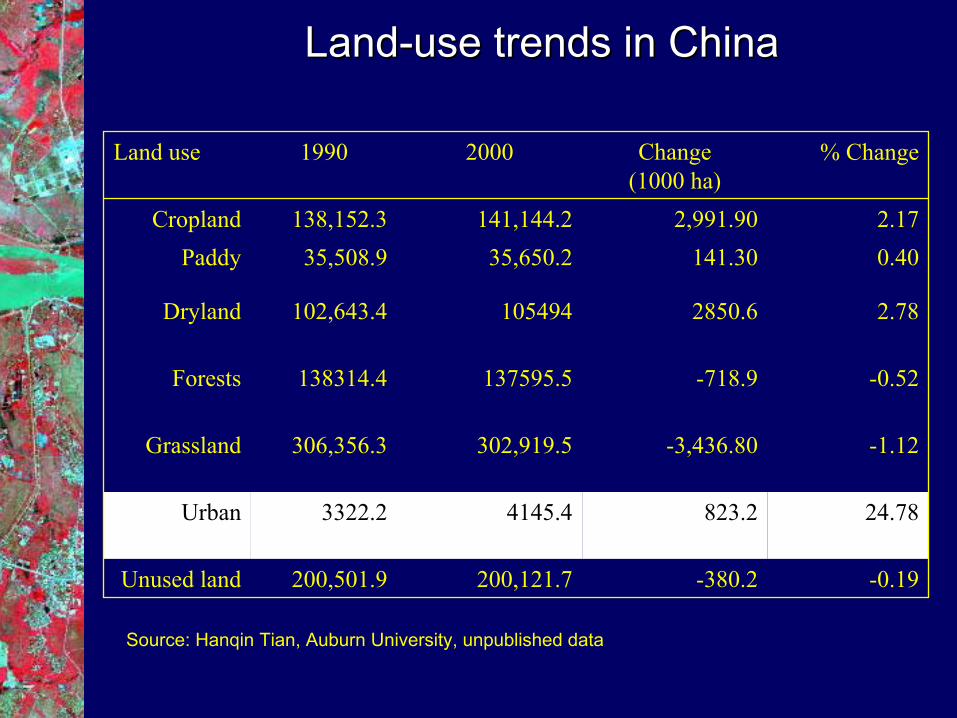
LandLand--use trends in Chinause trends in China
-0.19 -380.2200,121.7200,501.9Unused land
24.78823.24145.43322.2Urban
-1.12-3,436.80302,919.5306,356.3Grassland
-0.52-718.9137595.5138314.4Forests
2.782850.6105494102,643.4Dryland
0.40 141.3035,650.235,508.9Paddy2.17 2,991.90141,144.2138,152.3Cropland
% ChangeChange(1000 ha)
20001990Land use
Source: Hanqin Tian, Auburn University, unpublished data
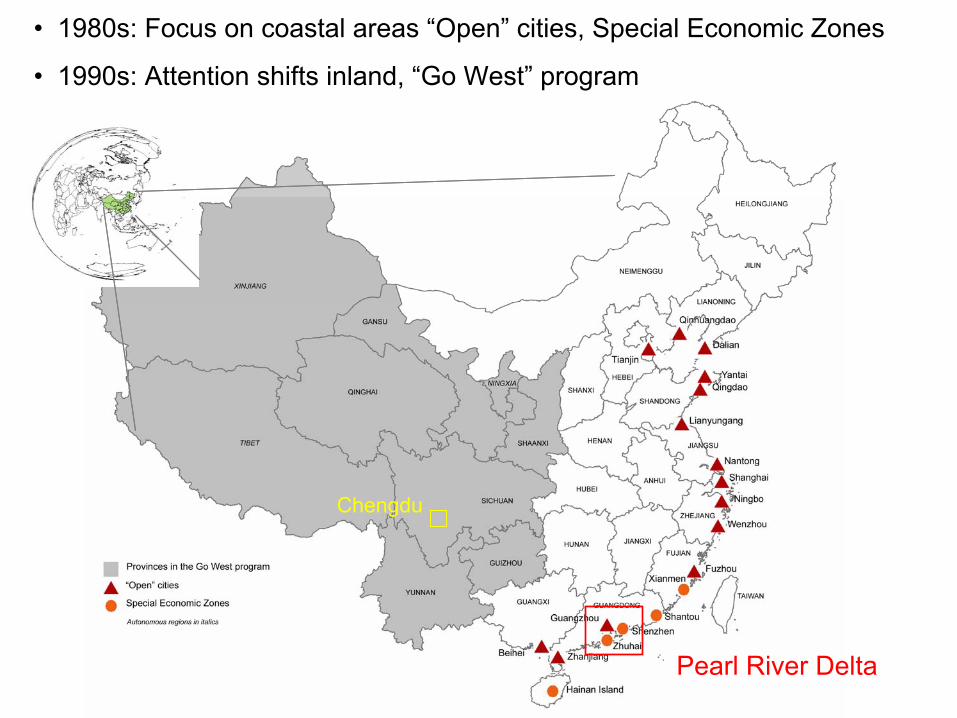
Chengdu
• 1980s: Focus on coastal areas “Open” cities, Special Economic Zones
• 1990s: Attention shifts inland, “Go West” program
Pearl River Delta
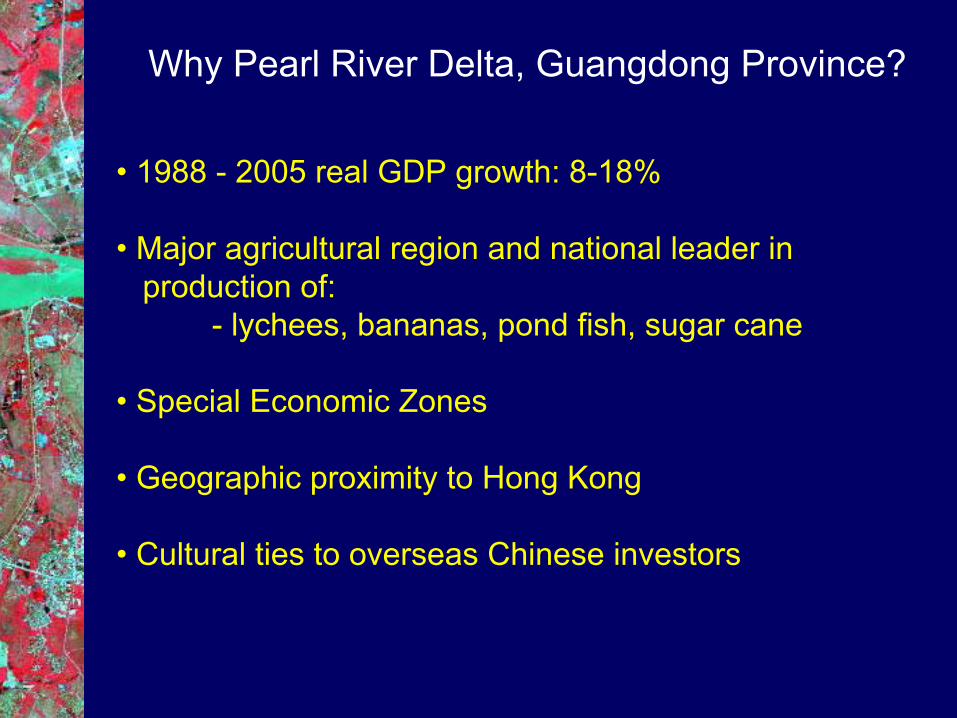
Why Pearl River Delta, Guangdong Province?
• 1988 - 2005 real GDP growth: 8-18%
• Major agricultural region and national leader in production of:
- lychees, bananas, pond fish, sugar cane
• Special Economic Zones
• Geographic proximity to Hong Kong
• Cultural ties to overseas Chinese investors


Urban Land, Pearl River Delta (km2)
0500
1000150020002500300035004000
1973
1974
1980
1985
1989
1990
1991
1992
1993
1994
1995
1996
1999
2000
2001
2002
Seto et al., in prep
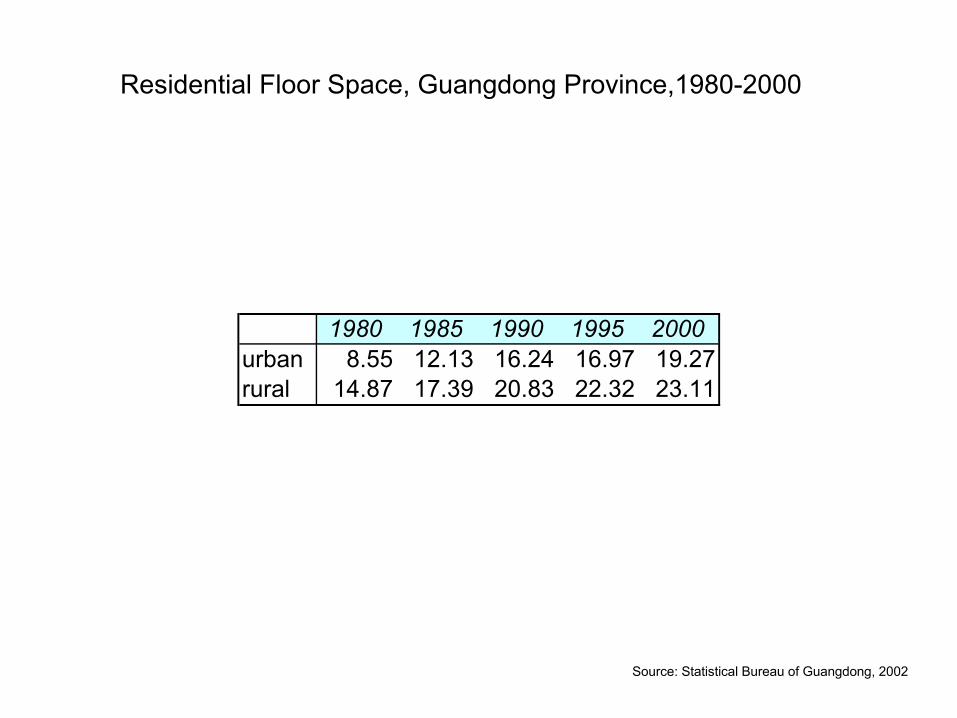
Source: Statistical Bureau of Guangdong, 2002
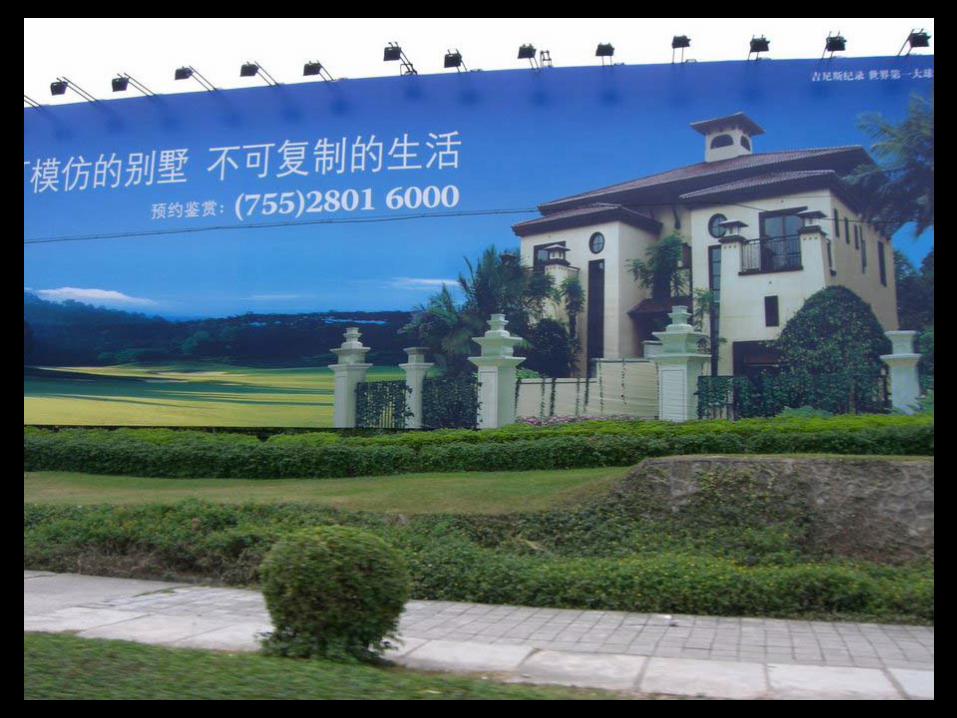
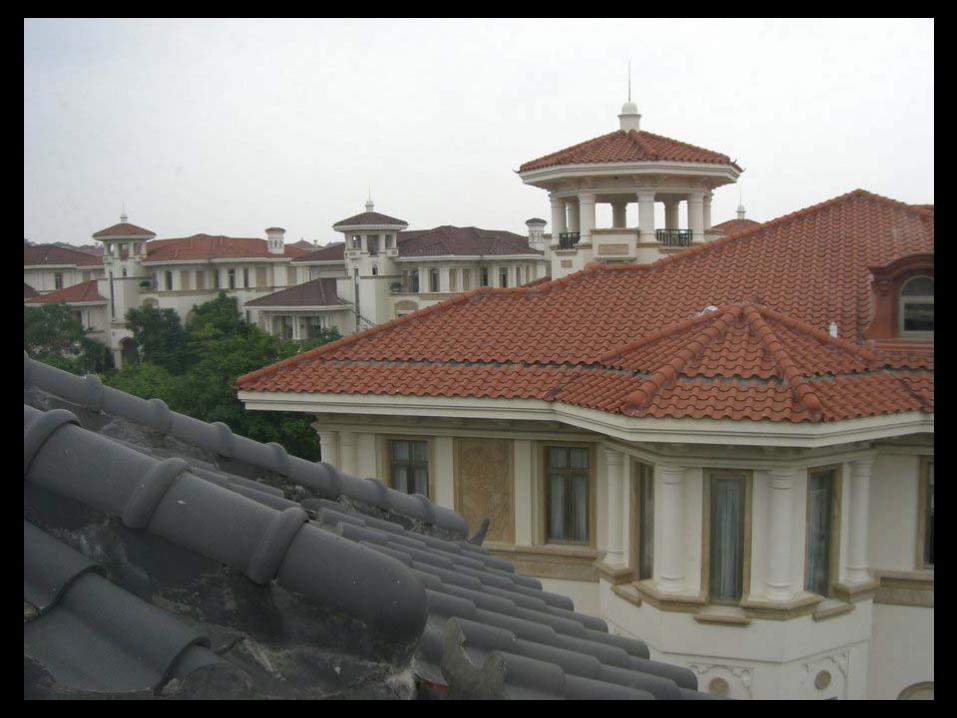
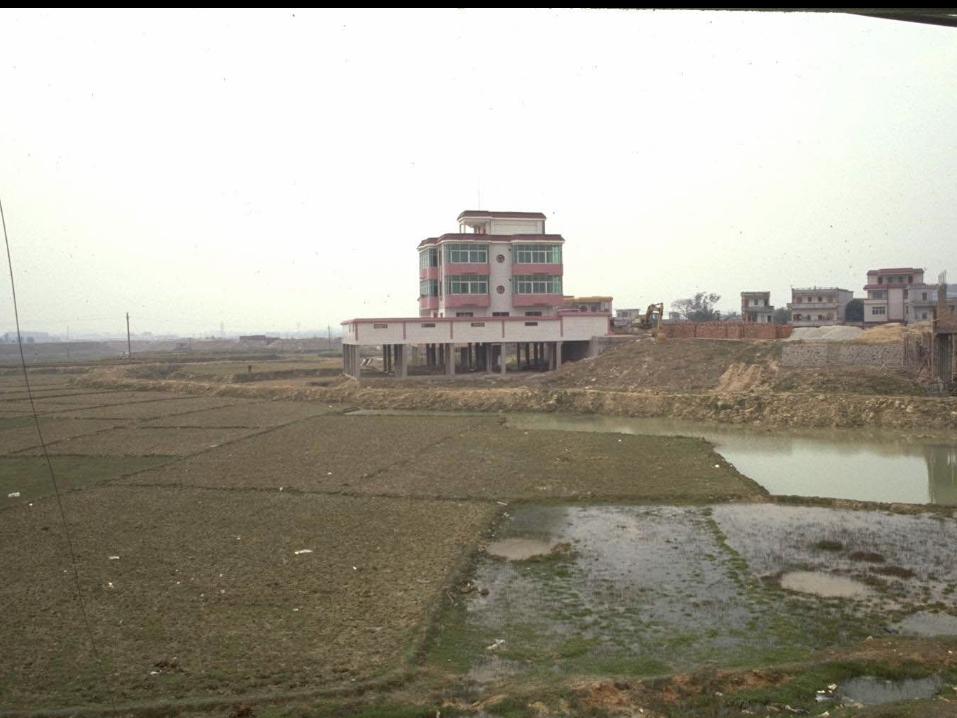
Residential Floor Space, Guangdong Province,1980-2000
1980 1985 1990 1995 2000urban 8.55 12.13 16.24 16.97 19.27rural 14.87 17.39 20.83 22.32 23.11
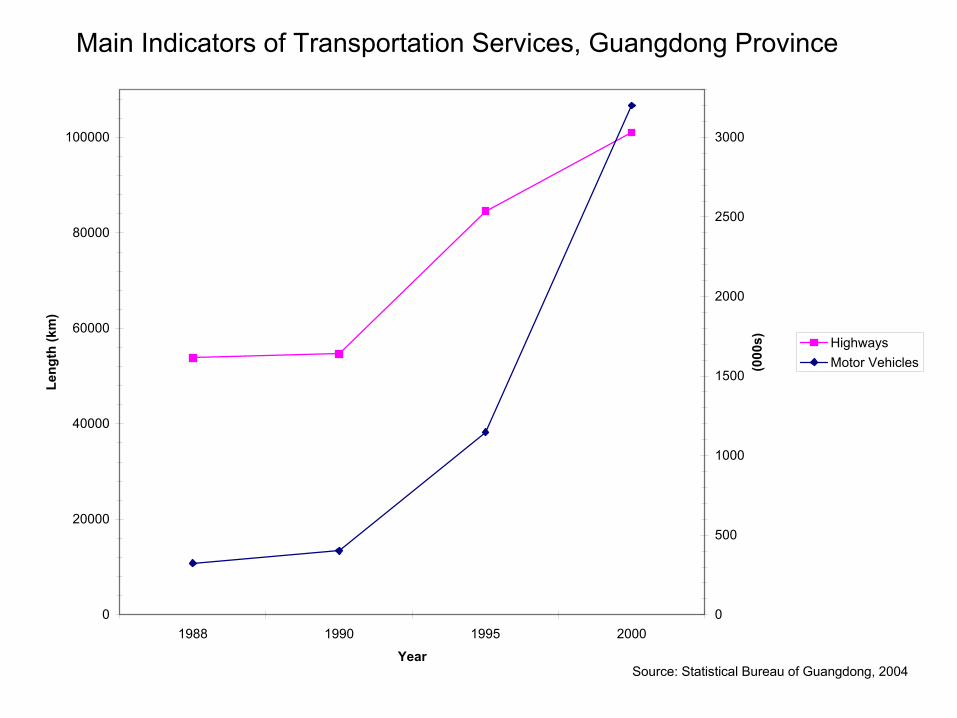
0
20000
40000
60000
80000
100000
1988 1990 1995 2000
Year
Leng
th (k
m)
0
500
1000
1500
2000
2500
3000
(000
s) HighwaysMotor Vehicles
Source: Statistical Bureau of Guangdong, 2004
Main Indicators of Transportation Services, Guangdong Province
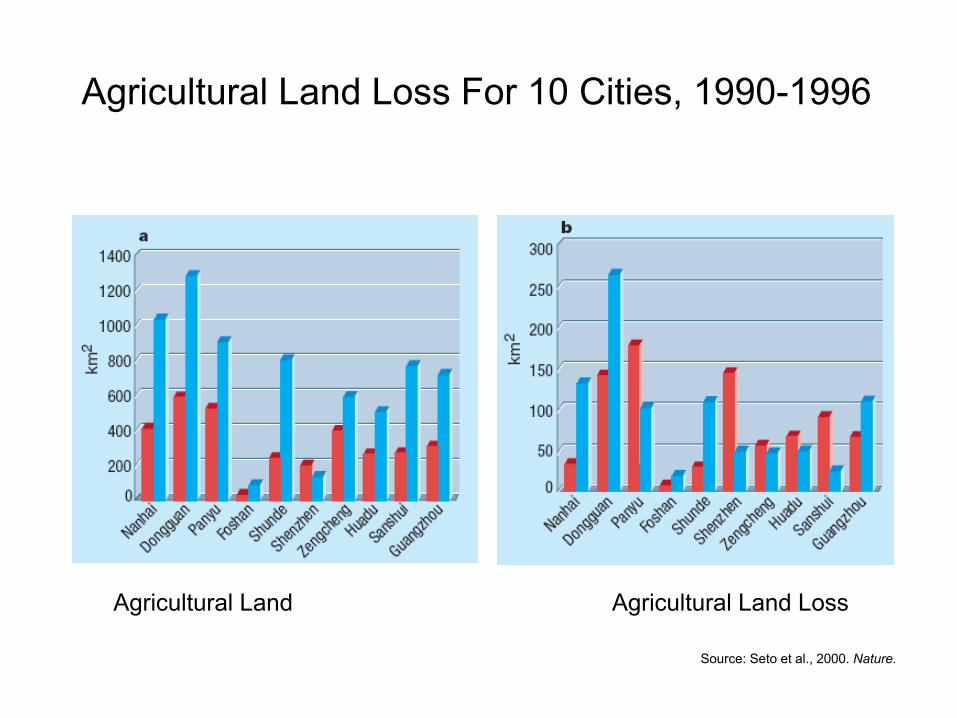
Urbanization and agricultural land loss
Agricultural Land Agricultural Land Loss
Source: Seto et al., 2000. Nature.
Agricultural Land Loss For 10 Cities, 1990-1996
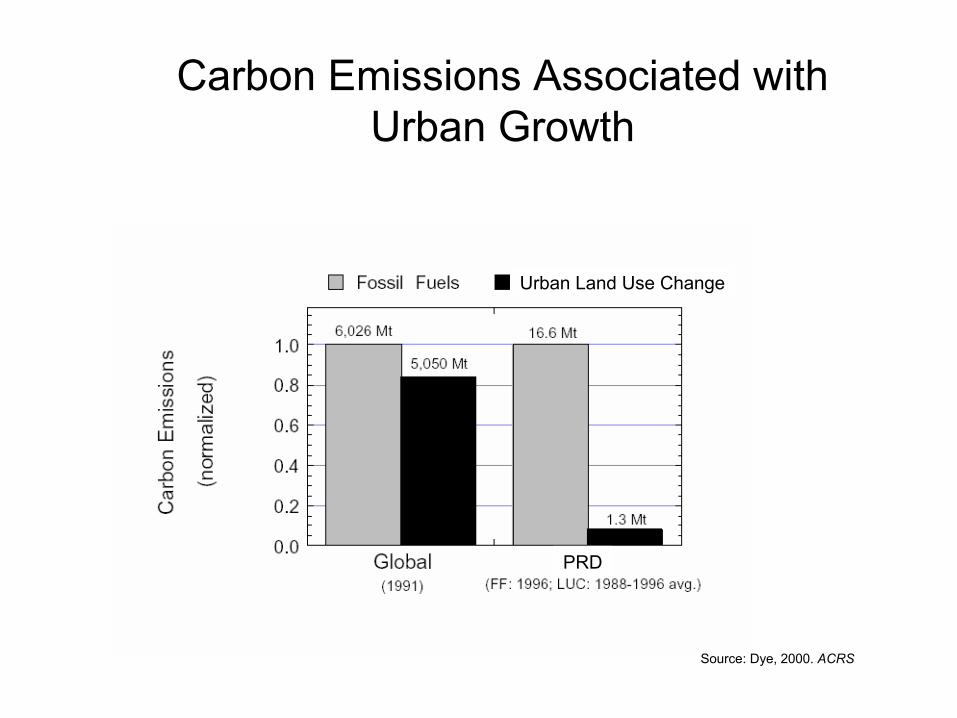
Carbon Emissions Associated withUrban Growth
Urban Land Use Change
PRD
Source: Dye, 2000. ACRS
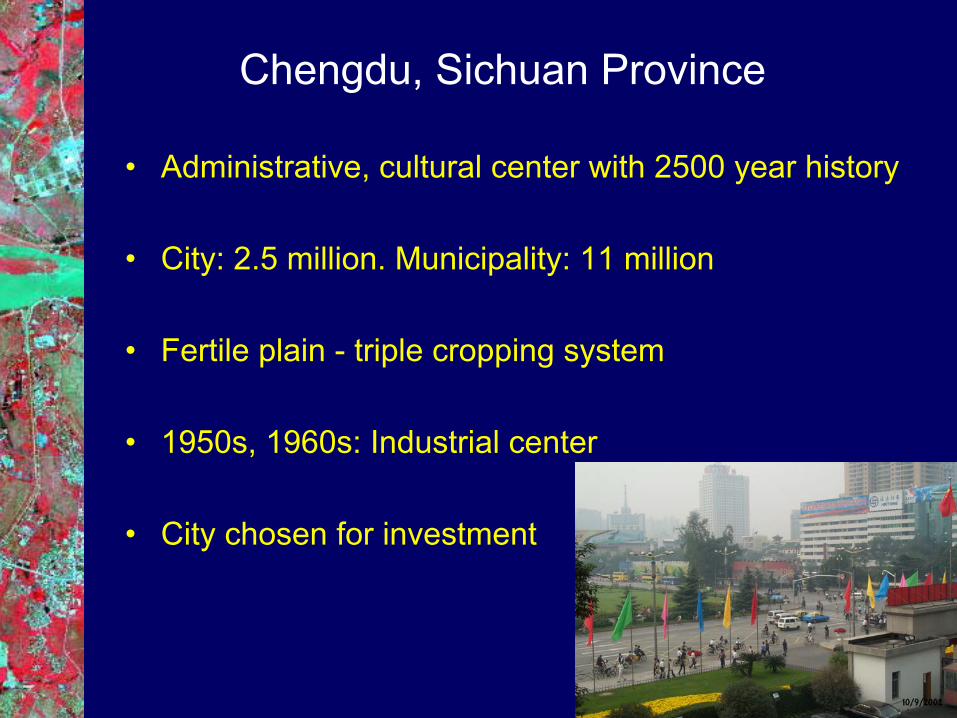
Chengdu, Sichuan Province
• Administrative, cultural center with 2500 year history
• City: 2.5 million. Municipality: 11 million
• Fertile plain - triple cropping system
• 1950s, 1960s: Industrial center
• City chosen for investment
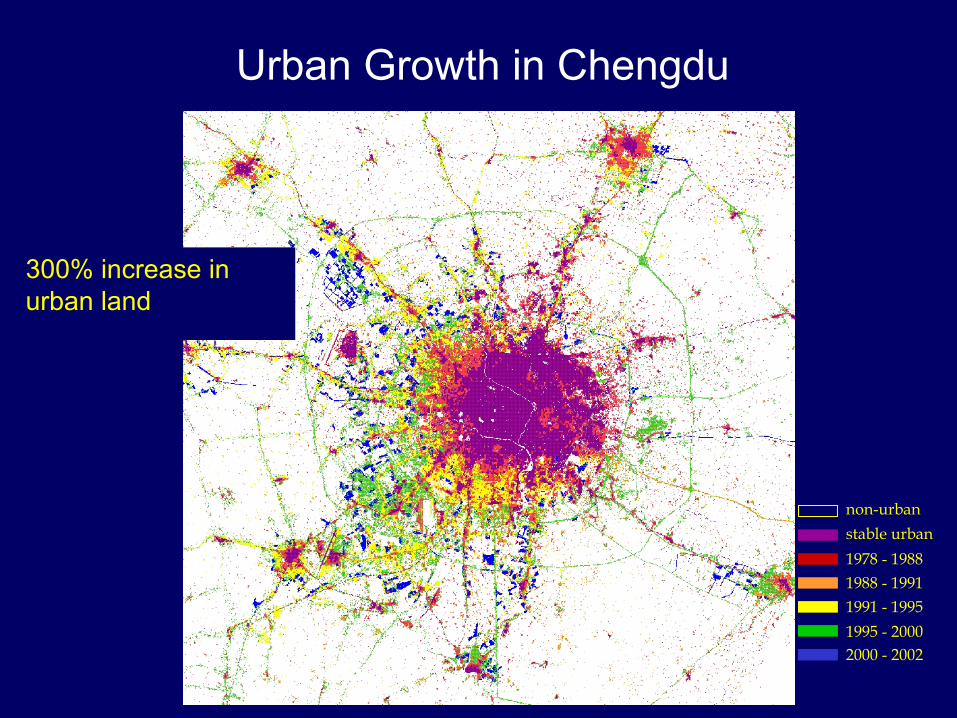
Urban Growth in Chengdu
197819881991199520002002
300% increase in urban land
stable urban1978 - 19881988 - 19911991 - 19951995 - 20002000 - 2002
non-urban

Socioeconomic ChangesForeign and domestic investment
Policy incentives
Economic opportunities and migration
Increases in disposable income
Drivers of Urban Growth
Conclusions: Chengdu
• Energy demand and composition
• Dietary patterns: from grain- to meat-based diet
• Traditional familial relations and housing arrangements
• Disparity between urban and rural; coast and interior
• Increase in disposable incomes
• Agricultural land loss
• Water and air pollution
• Greenhouse gas emissions
Implications of Urbanization

Challenges for sustainable urban growth
• Requires Chinese, not Western, model
• Integrated, hierarchical, multi-user public transportation
• Increase density and land-use efficiency
• Intra- and intercity economic disparities
• Loss of most productive agricultural land
• Changes in urban lifestyles: diet, energy demand
Prospects for sustainable urban growth
• Post-hoc analyses of regional plans
• Increased public transportation
• Increased density and land-use efficiency
• Leap-frog technology: energy efficiency
• Multi-unit housing and multi-use zoning