
Urban Fragmentation - WordPress.com
10
39.1 Proceedings . 3rd International Space Syntax Symposium Atlanta 2001 39 Abstract The geometry of nine squatter settlements in the northeastern coast of Brazil is examined; in particular, the fragmented structures of the islands of habitations in these settlements, and the void area (regions unoccupied by habitations) are studied. We find that a robust statistical distribution with the scaling property gives the frequency of the islands of habitations as a function of their sizes. Such scaling properties, when applied to planning purposes, can be useful on describing and predicting spatial and social parameters of such squatter settle- ments. Several scaling functions and other mathematical expressions, which are of interest in planning purposes, are also derived and discussed. 1 Introduction There are two major issues that have ever been present on discussions about urban planning: scale and regularity. Along history, the whole city has usually been modeled as the result of a linear aggregation of islands (groups of connected buildings) that are regular and have the same pattern (Barcelona, Manhattan, Brasilia). However, the history of urbanization has shown that the control of the city evolution is not a simple task. Consequently, several parts of the cities escape from the patterns and rules desired by the planners of the formal city, and evolve in a decentralized dynamic. Some examples of such kinds of structures are the squatter settlements (urban structures evolved without neither general urban restrictions nor public urban intervention). Differently to the planned ones, these structures are the result of an irregular distribution of different islands. Because this, they have usually been considered disordered and non-logical structures. In this work it is shown that such settlements are not merely disordered. Otherwise, they can be defined as complex structures, and such complexity can be quantified considering patterns of irregularity on the configuration. Particularly, it is made by analyzing the frequency of units (built and voids spaces) according to their sizes, i.e., by using scaling-laws. In recent years a great deal of effort in pure and applied science has been devoted to the study of nontrivial spatial and temporal scaling laws which are robust, i.e. independent of the details of particular systems [1]. These studies at present involve a multitude of complex systems formed by a large number of small units communicating via short-range interac- tions and submitted to both deterministic rules and random influences. As examples of particular interest to this Symposium on Space Syntax we can cite the study of the geometry of railway networks [2], as well as the study of the dynamics of traffic jams [3], and the modeling of urban growth patterns [4], among many others, all them exhibiting several Urban Fragmentation Spatial scaling laws in squatter settlements Keywords; Settlement patterns, scaling properties, statistical distribu- tion of fragmentation patterns. Fabiano J. A. Sobreira , Centre for Advanced Spatial Analysis - University College London - 1-19 Torrington Place - Gower Street - London - WC1E 6BT, UK. [email protected] Marcelo A.F. Gomes Laboratorio de Fisica Teorica e Computacional, Departamento de Fisica, Universidade Federal de Pernambuco, 50670- 901, Recife, PE, Brasil [email protected] Fabiano J. A. Sobreira University College London, UK & Universidade Federal de Pernambuco, Brazil Marcelo A. F. Gomes Universidade Federal de Pernambuco, Brazil
Transcript of Urban Fragmentation - WordPress.com

39.1
Proceedings . 3rd International Space Syntax Symposium Atlanta 2001
39
AbstractThe geometry of nine squatter settlements in the northeastern coast of Brazil is examined; inparticular, the fragmented structures of the islands of habitations in these settlements, andthe void area (regions unoccupied by habitations) are studied. We find that a robust statisticaldistribution with the scaling property gives the frequency of the islands of habitations as afunction of their sizes. Such scaling properties, when applied to planning purposes, can beuseful on describing and predicting spatial and social parameters of such squatter settle-ments. Several scaling functions and other mathematical expressions, which are of interest inplanning purposes, are also derived and discussed.
1 Introduction
There are two major issues that have ever been present on discussions about urban planning:
scale and regularity. Along history, the whole city has usually been modeled as the result of a
linear aggregation of islands (groups of connected buildings) that are regular and have the
same pattern (Barcelona, Manhattan, Brasilia�). However, the history of urbanization has
shown that the control of the city evolution is not a simple task. Consequently, several parts
of the cities escape from the patterns and rules desired by the planners of the formal city, and
evolve in a decentralized dynamic. Some examples of such kinds of structures are the squatter
settlements (urban structures evolved without neither general urban restrictions nor public
urban intervention). Differently to the planned ones, these structures are the result of an
irregular distribution of different islands. Because this, they have usually been considered
disordered and non-logical structures.
In this work it is shown that such settlements are not merely disordered. Otherwise, they
can be defined as complex structures, and such complexity can be quantified considering
patterns of irregularity on the configuration. Particularly, it is made by analyzing the frequency
of units (built and voids spaces) according to their sizes, i.e., by using scaling-laws.
In recent years a great deal of effort in pure and applied science has been devoted to the
study of nontrivial spatial and temporal scaling laws which are robust, i.e. independent of
the details of particular systems [1]. These studies at present involve a multitude of complex
systems formed by a large number of small units communicating via short-range interac-
tions and submitted to both deterministic rules and random influences. As examples of
particular interest to this Symposium on Space Syntax we can cite the study of the geometry
of railway networks [2], as well as the study of the dynamics of traffic jams [3], and the
modeling of urban growth patterns [4], among many others, all them exhibiting several
Urban FragmentationSpatial scaling laws in squatter settlements
Keywords;
Settlement patterns,
scaling properties,
statistical distribu-
tion of fragmentation
patterns.
Fabiano J. A.
Sobreira ,
Centre for Advanced
Spatial Analysis -
University College
London - 1-19
Torrington Place -
Gower Street -
London - WC1E 6BT,
UK.
Marcelo A.F. Gomes
Laboratorio de Fisica
Teorica e
Computacional,
Departamento de
Fisica, Universidade
Federal de
Pernambuco, 50670-
901, Recife, PE,
Brasil
Fabiano J. A. SobreiraUniversity College London, UK &Universidade Federal de Pernambuco, Brazil
Marcelo A. F. GomesUniversidade Federal de Pernambuco, Brazil

Sobreira and Gomes: Urban Fragmentation
39.2
types of scaling laws or power-law behavior. On the other hand, in the last few decades, the
idea of disorder associated to the spatiotemporal configurations of cities has been replaced
by the concept of complexity [5].
In the next section we report some results of this study on the geometry of squatter
settlements. Our analysis focuses and quantifies in particular the fragmentation occurring in
both the void and the built space of these urban structures. The data used in the present
work came from an ensemble of nine squatter settlements or �favelas� distributed in differ-
ent areas of the metropolitan region of Recife, on the northeastern coast of Brazil.
2. Results and Discussion
In order to give a general view of the kind of urban structure we are dealing, we show in
Figure 1 an image of the nine settlements examined in the present study. Each small cell of
irregular shape in this figure represents an actual single habitation, and more precisely the
space limited by roofs. As can be seen from these images, the settlements exhibit a seemingly
disordered or spontaneous fragmented structure, characterized by the diversity of size of
islands and the irregularity of their distribution and shape. These islands present a variable
number s of habitations (s=1 means an isolated habitation, s=2 means a pair of contiguous
habitations, and so on). A careful examination of the Figure 1 reveals that s varies in the
interval from 1 to 19. We can observe that there is a great number of small islands in each
settlement, and as well a small number of big ones, a typical feature of complex systems.
Another important characteristic of the settlements studied is that all them are embedded in
urban networks and most of them submitted to very rigid boundary conditions. The devel-
opment of these settlements occurs not as a spreading, but as a kind of packing process.
Consequently, as the spatial limit of the settlement is previously defined, the diversity of size
of its islands seems to be the response of the system to optimize the occupation.
Figure 1 � The nine
spontaneous
settlements studied
in the present work.
See text, section 2
for details.

39.3
Proceedings . 3rd International Space Syntax Symposium Atlanta 2001
A. Geometry and Functions
To make clear to the general reader non-familiarized with the mathematical language, we in
the following present a geometrical example for the statistical method suggested in this
work. As example, it is shown a comparison between two hypothetical geometrical structures
representing, respectively, the regular and irregular settlements (see figure 2).
Figure 2a shows a regular grid, composed by a group of identical islands, distributed in
a square area. It is really very simple to obtain global parameters from the local units of this
regular structure. For example: As we can observe, each island contains four cells (habitation)
and all the islands are identical to each other. Each cell of habitation has area (ah) of 10m2. We
can easily conclude that the area of each island (Ai) is 40 m2 (Ai = 4.ah), and the total built area
(A) is 640 m2 (A = 16 . 4 . ah). Dividing the total area by the area of each habitation (A/ah),
we get the number of habitations (64 units). If the average population per habitation is 3,
one can easily calculate the total population of the settlement (P=3.4.16=192). Another way
to calculate general parameters is via graphs, as the one inserted on figure 2a. The graph in
figure 2a plots the number of islands (N) according their sizes (s), and the shaded area
represent the total number of habitations (Nh = N.s = 16 . 4 = 64). It is a simple procedure,
as the linear function generates a regular shape. So, it is not a hard task to understand why
planners have preferred the regular shape when designing urban structures. This kind of
geometrical scheme, despite the great range of social constraints that it cause, has been very
common through the history of urban planning not just due to the esthetical approach, but
mainly because it can be easily reproduced, controlled, analyzed, measured and planned.
When analyzing figure 2b, which refers to the irregular settlement, one can note that the
overall structure is not limited by a regular square and the local units (islands) are different in
size to each other. So, it seems impossible to obtain global parameters from just knowing
information about a simple local unit, as it was showed in the first example. Apparently, the
only way to obtain global properties is by describing each one of the units on the system. For
example: to calculate the total built area (A) for the irregular settlement in figure 2b, we
multiply the size (s) of each class of fragment (island) by the total number of fragments in
that class, n(s), and by the average area (ah) of an habitation and sum over all classes of size.
Figure 2 � Two
hypothetical
geometrical
structures, repre-
senting a regular
settlement (2a) and a
irregular one (2b).
Each one is
represented by the
map of islands, the
grid of void spaces
and the graph
representing the
number of islands (N)
according their sizes
(s). See text, section
2-A for details
Sobreira and Gomes: Urban Fragmentation
39.4
But, as we have argued, there is a difference between disordered systems and complex
ones. When they are complex, they follow rules that can be measured by non-linear functions,
and we suggest that such irregular structures (as the one presented on figure 2b, representing
the squatter settlements of figure 1) have statistical properties of complex systems. For
example: we can see in the graph of figure 2b - number of islands (N) according to their sizes
(s) � that the sum of area of rectangles (shaded areas) defined by the coordinates (x,y) on the
graph (groups of islands according to their sizes) represents the total number of habitations
(Nh). But the peculiarity of this new graph is that the coordinates (x,y) follow a curve that
defines the power law (because there is a logical distribution between the great number of
small islands and the small number of big ones). So, to calculate the total hatched area
(equivalent to the total number of habitations of the respective structure) we just need to
know the curve of the function, i.e., the exponent T. And in this work we have found that all
the settlement studied present a similar distribution of sizes, i.e., they follow non-linear
functions with similar exponent T, whether to built or to void spaces.
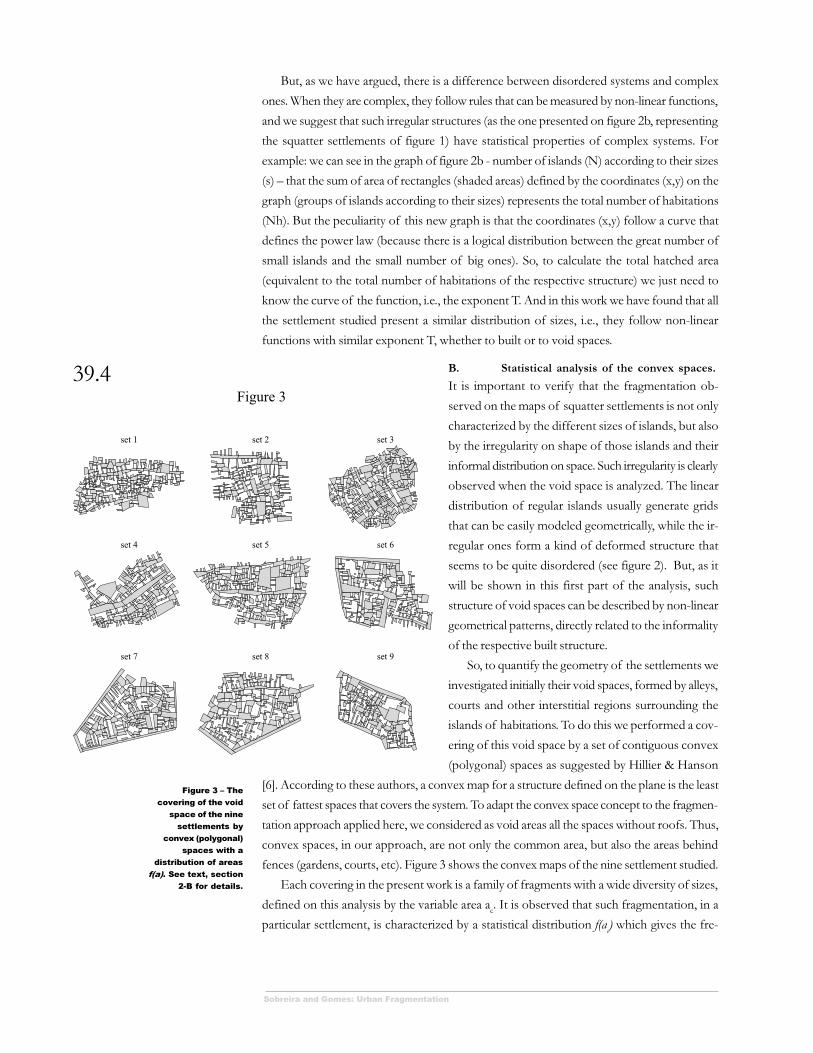
B. Statistical analysis of the convex spaces.
It is important to verify that the fragmentation ob-
served on the maps of squatter settlements is not only
characterized by the different sizes of islands, but also
by the irregularity on shape of those islands and their
informal distribution on space. Such irregularity is clearly
observed when the void space is analyzed. The linear
distribution of regular islands usually generate grids
that can be easily modeled geometrically, while the ir-
regular ones form a kind of deformed structure that
seems to be quite disordered (see figure 2). But, as it
will be shown in this first part of the analysis, such
structure of void spaces can be described by non-linear
geometrical patterns, directly related to the informality
of the respective built structure.
So, to quantify the geometry of the settlements we
investigated initially their void spaces, formed by alleys,
courts and other interstitial regions surrounding the
islands of habitations. To do this we performed a cov-
ering of this void space by a set of contiguous convex
(polygonal) spaces as suggested by Hillier & Hanson
[6]. According to these authors, a convex map for a structure defined on the plane is the least
set of fattest spaces that covers the system. To adapt the convex space concept to the fragmen-
tation approach applied here, we considered as void areas all the spaces without roofs. Thus,
convex spaces, in our approach, are not only the common area, but also the areas behind
fences (gardens, courts, etc). Figure 3 shows the convex maps of the nine settlement studied.
Each covering in the present work is a family of fragments with a wide diversity of sizes,
defined on this analysis by the variable area ac. It is observed that such fragmentation, in a
particular settlement, is characterized by a statistical distribution f(ac) which gives the fre-
Figure 3 � The
covering of the void
space of the nine
settlements by
convex (polygonal)
spaces with a
distribution of areas
f(a). See text, section
2-B for details.
39.5
Proceedings . 3rd International Space Syntax Symposium Atlanta 2001
quency1 of convex spaces within each interval2 of area ac. In spite of the nonuniqueness
property of these coverings, we have observed that the distribution f(ac) is robust. Moreover,
f(ac) has the scaling property and satisfies
f(ac) ~ a
c -b, b =1.6 ± 0.2 , (1)
with the exponent beta independent of the settlement within the indicated statistical fluctua-
tions. This scaling property suggest that the diversity of sizes of the resulting convex spaces
follow a robust distribution of areas and indicates a great number of small convex spaces,
and a small number of big ones.
Scaling or power-law behavior with nontrivial exponents is a characteristic of complex
systems and means that the systems exhibiting such distributions have no characteristic scale
or size [7]. The explanation of these scaling laws with nontrivial exponents is one of the great
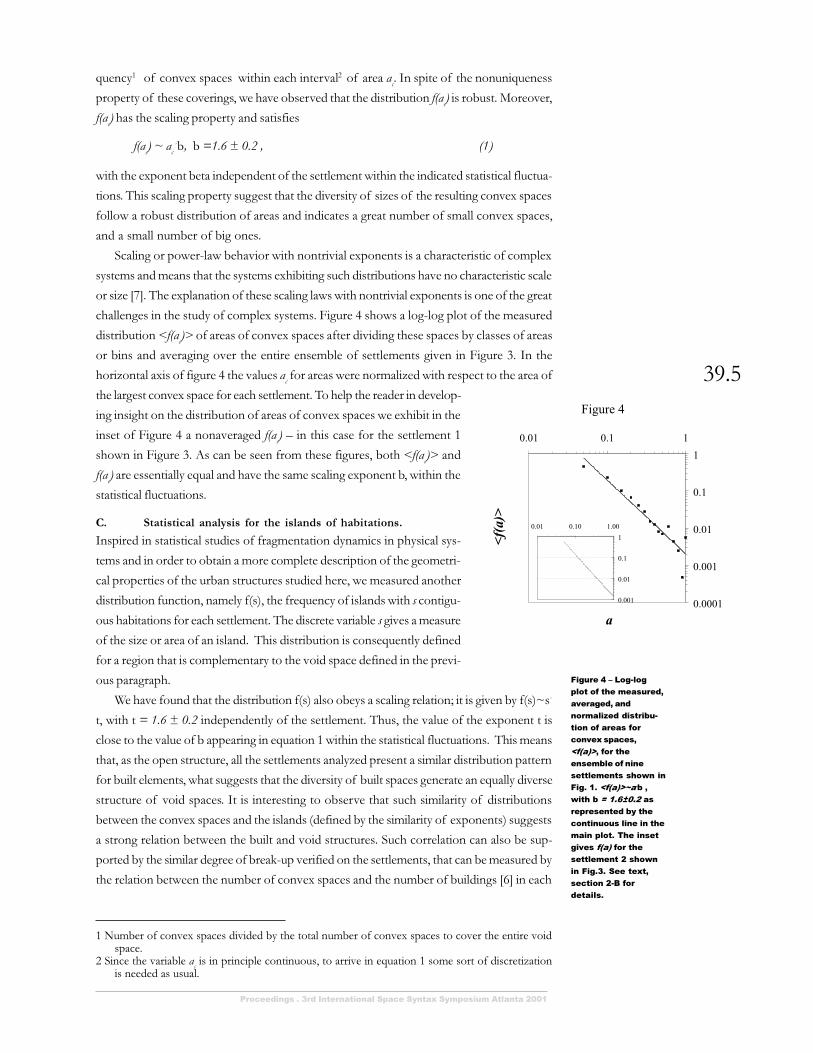
challenges in the study of complex systems. Figure 4 shows a log-log plot of the measured
distribution <f(ac)> of areas of convex spaces after dividing these spaces by classes of areas
or bins and averaging over the entire ensemble of settlements given in Figure 3. In the
horizontal axis of figure 4 the values ac for areas were normalized with respect to the area of
the largest convex space for each settlement. To help the reader in develop-
ing insight on the distribution of areas of convex spaces we exhibit in the
inset of Figure 4 a nonaveraged f(ac) � in this case for the settlement 1
shown in Figure 3. As can be seen from these figures, both <f(ac)> and
f(ac) are essentially equal and have the same scaling exponent b, within the
statistical fluctuations.
C. Statistical analysis for the islands of habitations.
Inspired in statistical studies of fragmentation dynamics in physical sys-
tems and in order to obtain a more complete description of the geometri-
cal properties of the urban structures studied here, we measured another
distribution function, namely f(s), the frequency of islands with s contigu-
ous habitations for each settlement. The discrete variable s gives a measure
of the size or area of an island. This distribution is consequently defined
for a region that is complementary to the void space defined in the previ-
ous paragraph.
We have found that the distribution f(s) also obeys a scaling relation; it is given by f(s)~s-
t, with t = 1.6 ± 0.2 independently of the settlement. Thus, the value of the exponent t is
close to the value of b appearing in equation 1 within the statistical fluctuations. This means
that, as the open structure, all the settlements analyzed present a similar distribution pattern
for built elements, what suggests that the diversity of built spaces generate an equally diverse
structure of void spaces. It is interesting to observe that such similarity of distributions
between the convex spaces and the islands (defined by the similarity of exponents) suggests
a strong relation between the built and void structures. Such correlation can also be sup-
ported by the similar degree of break-up verified on the settlements, that can be measured by
the relation between the number of convex spaces and the number of buildings [6] in each
1 Number of convex spaces divided by the total number of convex spaces to cover the entire voidspace.
2 Since the variable ac is in principle continuous, to arrive in equation 1 some sort of discretization
is needed as usual.
Figure 4 � Log-log
plot of the measured,
averaged, and
normalized distribu-
tion of areas for
convex spaces,
<f(a)>, for the
ensemble of nine
settlements shown in
Fig. 1. <f(a)>~a-b ,
with b = 1.6±0.2 as
represented by the
continuous line in the
main plot. The inset
gives f(a) for the
settlement 2 shown
in Fig.3. See text,
section 2-B for
details.

Sobreira and Gomes: Urban Fragmentation
39.6
settlement. We noted that practically all settlement studied present a
high and similar level of breakup, i.e., the number of cells (houses) is
close to the number of convex spaces. In a regular grid, the number of
convex spaces is considerably reduced when compared to the number
of cells of the system.
Scaling distributions of fragments with an exponent similar to
this are commonly found in statistical models and in experiments of
fragmentation dynamics of physical, chemical and ecological interest
[8]. As an illustration we can cite that the distribution of size of frag-
ments for different types of collapse of two-dimensional brittle solids
as cement plates also presents a hyperbolic dependence with the size or
area of the fragments with an exponent t varying in the interval 1.5 to
1.8 [9]. The origin of this numerical value however is not yet clear.
Another important illustration is the distribution of areas of the ur-
ban settlements around Berlin and London recently discussed by Makse
et alli, when it is presented an exponent near to 1.9 [4]. However, reference 4 deals with a
scaling distribution in a very large scale, when compared with the �microscopic� scale of
lengths within the settlements examined in the present work, whose peculiarities are com-
mented ahead.
The distribution of islands of habitations averaged on the ensemble of settlements
shown in Figure 1 and normalized to the total number N of islands in each settlement,
<f(s)>, is depicted in Figure 5. The continuous line in figure 4 represents the best fit
<f(s)> = <f(1)> . s-t , <f(1)> = 0.49 ± 0.08 , t = 1.6 ± 0.2 ; 1<s<smax
(2)
where <f(1)> is the average number of islands with a single habitation, divided by the
total number N of islands (<n(1)/N>). smax = 19 is the largest size of islands of habita-
tions present in the settlements studied. The largest size, smax, can be a measure of the
diversity of size of the islands, D (i.e. D can represent the number of different classes of size
for the islands). In particular, smax converges to D when the level of complexity increases.
From now on we will identify smax with D in all equations.
The non-normalized distribution, <n(s)>, satisfies in general the constraint <n(s=D)>=1,
that is, there is on the average a single island with the maximum size s=D in the scaling. This
result leads to 1=<n(1)>.D-t, or
<n(1)> = Dt , (3)
i.e., there is a simple relationship connecting the number of smallest islands (s=1), n(1),
with the observed diversity of size of islands, D. When the first quantity increases (de-
creases), the second also increases (decreases), and the degree of coupling between n(1) and D
is controlled by the nontrivial exponent t of the distribution. We can say, as a consequence,
that n(1) and D are two sides of a same coin. To increase the diversity of size of islands in a
spontaneous settlement we need to increase the total number of islands, and this last
quantity is mainly controlled by the number of isolated habitations n(1). The dependence of
n(1) with D given in (3) allows equation 2 to be written as
<n(s)> = <n(1)> s-t = (s/D) -t, t =1.6± 0.2, (4)
Figure 5 � Log-log
plot of the measured,
averaged, and
normalized distribu-
tion of sizes of
islands with s
habitations <f(s)> for
the ensemble of
Fig.1. The continuous
line represents the
best adjust given by
the power-law <f(s)>
= <f(1)>.s-t , with
<f(1)> = 0.49, and t =
1.6. See text, section
2-C for details.

39.7
Proceedings . 3rd International Space Syntax Symposium Atlanta 2001
what means that if one knows the diversity (generally equivalent to the size of its biggest
island) of a squatter settlement, it is possible to estimate the number of islands with any size
s, and vice versa.
3. Obtaining parameters of interest
We have suggested that irregular settlements within the spatial constraints and statistical
fluctuations described here, present the same pattern of fragmentation. These pattern occur
on both the built and void spaces, and define their size distribution. We argue, as well, that
it is possible to estimate global properties from general or local information of these settle-
ments. Consequently, we can estimate global parameters as total area, number of houses and
population. Obviously, the more developed the settlement (high level of diversity, great
number of habitations, and consequently more data), the more precise will be the simula-
tion.
The reader can observe that the distribution (4) is extremely economical: it depends only
on a single parameter, namely D (the diversity of size of the settlement), or <n(1)> (the
number of islands with just one habitation), since all settlements have a common exponent
t. With equation 4 valid on the average for all settlements studied, we can calculate several
statistical parameters of interest after a simple integration, as we will show in the following.
The total area A occupied by the islands in a certain settlement is given by
(5)
(6)
where ah is the average area per habitation. Since a
h can be easily guessed, equations 5 and 6
show that the total built area of a settlement is controlled by a single parameter, the diversity
of size of island, D, or n(1). Moreover, the total number of habitations in a settlement,
Nh=A/a
h, takes the simple forms
(7)
(8)
If the average population per habitation, p, is estimated by any mean, the total population, P,
can be expressed in terms of the diversity D (or, equivalently, <n(1)>):
(9)
(10)
Thus, the total population P is known if D (or <n(1)>) is given and vice-versa. Another
quantity of interest is the total number of islands in a given settlement, Ni, which is ex-
pressed as

Sobreira and Gomes: Urban Fragmentation
39.8
(11)
(12)
An interesting result concerning the density of islands of size s=1 comes from equation 12:
in leading order, this equation reads Ni = <n(1)> / t - 1 (since 1/t = 0.625, and the term
<n(1)>1/t can be neglected in respect to the linear term <n(1)>, that is
(13)
The density n(1)/Ni varies in the nine settlements studied from 0.46 to 0.66 with an average
of 0.57 in agreement with equation 13. Furthermore, if we substitute (13) in (8), we obtain
the total number of habitations, Nh, as a function of the total number of islands Ni:
(14)
From equation 14, with t = 1.6, we get e.g. Nh = 305 for settlement 6 (N = 110), and N
h
= 245 for settlement 8 (N = 94). The actual values of Nh for settlements 6 and 8 are respec-
tively 323 and 215, i.e. equation 14 gives Nh-values with a typical uncertainty of 6-10%.
In summary, if the distribution of islands or fragments for a particular fragmented
system is known, all the statistical quantities of interest can be obtained. Hyperbolic distribu-
tions of the type given in (2) or (4) are specially robust and universal when they appear in a
certain class of problems [1]. We conjecture that all spontaneous settlements that present the
same kind of spatial constraints, are described by a single hyperbolic distribution of the type
given in equation 4 with the scaling exponent t assuming the robust value t = 1.6 ± 0.2. We
urge that additional studies of this aspect be performed in other regions to test the robust-
ness of the scaling distribution given in 4.
4. Diversity and occupation
The diversity of sizes as represented by the variable D here (see definition in the second
paragraph of section 2-B) has been identified in studies of fragmentation dynamics with the
overall complexity of the process or structure [7]. It is of interest to study how this diversity
of size increases with the total number of islands, Ni. To examine this relationship we define
for each settlement represented in Figure 1 a family of arbitrary balls with irregular contours
in a such way that the family of balls contains successively Ni=1, 5, 10, 15, 20, 25..., 100
islands. The dependence of D with Ni is shown in Figure 6 in a log-log plot for all settle-
ments; the diamond marks in this figure refer to the ensemble averages. The continuous line
in Figure 6 represents the best fit D = 1.1Ni0.49, for 1<Ni<80. This relation says that the
diversity of size of islands in a spontaneous settlement increase as the square root of the
total number of islands. This last scaling law is in agreement with several recent experiments
[9] and computer simulations [8] that have studied the evolution of the diversity in a
fragmented system when its global size (e.g. the number of fragments) increases.

39.9
Proceedings . 3rd International Space Syntax Symposium Atlanta 2001
It is important to remember that the evolving process of
the settlements analyzed in this work is not related to spread-
ing, as the boundaries around the settlements limit the growth.
Actually, it is a process of packing within a limited space for
development. So, when the number of islands increase, the
general size of the settlement remains the same and the den-
sity of the system raises, as each new building added to the
system is submitted to the constraints of spatial availability.
If a settlement were composed only by islands of size 1
(isolated habitations), the resulting density would be consid-
erably low, due to the large amount of void spaces, and we
could conclude that in this case the occupation would be not
optimized. On the other hand, if a structure were composed
by a few amounts of really big islands, the rate of density
would be really high. However, the resulting occupation would not be appropriate, due to
some problems of access, privacy and salubrity caused by the lack of void spaces connecting
houses. This would be, as well, a kind of non-optimized occupation. So, we can conclude
that the best response to optimize the occupation of a decentralized system is through the
diversity of size of its islands.
5. Conclusions
The fragmentation in nine spontaneous settlements in northeastern Brazil is investigated,
and several nontrivial scaling functions describing these urban structures are found. The
statistical analysis used here for these settlements is inspired on recent studies of fragmenta-
tion dynamics mainly in physical systems.
We have shown that there are robust (possibly universal) distribution functions associ-
ated to the fragmented structures of these spontaneous settlements. Using these distribu-
tion functions, many statistical quantities of interest can be obtained. In particular, we have
stressed the importance of the variable diversity of size in obtaining these quantities of
interest. We conjecture that the hyperbolic distribution functions given in equations 1 and 4
are robust and universal, that is, they control the statistical aspects discussed here in all
spontaneous settlements irrespective cultural, economical, and localization particularities.
An important characteristic of the settlement studied is that all them are embedded in
urban networks and most of them submitted to very rigid boundary conditions. The devel-
opment of these settlements occurs not as a spreading, but as a kind of packing process.
Consequently, as the spatial limit of the settlement is previously defined, the diversity of size
is the response of the system to optimize the occupation. If there is not rigid boundaries, the
response is trivial: houses distributed by a disordered way, isolated in islands of size 1.
Anyway, a detailed analysis of other spontaneous settlements in many different regions is
needed for corroboration or disproof of the present conjecture.
Note
Work supported in part by CAPES, CNPq, FINEP, and PRONEX (Brazilian agencies).
References[1] Bak P, HOW NATURE WORKS: The science of self-organized criticality, Oxford
Universirty Press, Oxford, 1997.Gomes M, Garcia J, Jyh T, Rent T, and Sales T, �Diversity and Complexity: Two sides of the
Figure 6 � The
diversity of sizes of
islands of habita-
tions, D, as a
function of the
number of islands,
Ni. The continuous
line represents the
best fit D = 1.1Ni0.49.
See text, section 4
for details.

Sobreira and Gomes: Urban Fragmentation
39.10
same coin?�, in �THE EVOLUTION OF COMPLEXITY�, Vol 8, pp 117 - 123, KluwerAcademic, Dordrecht, 1999.Mandelbrot B, THE FRACTAL GEOMETRY OF NATURE, Freeman, New York, 1983.Shiode N, and Batty M, �Power Law Distributions in Real and Virtual Worlds�, (http://www.casa.ucl.ac.uk/powerlaw.pdf) unpublished working paper, University College London� Centre for Advanced Spatial Analysis -Working Paper Series, Paper 19, London, 2000.
[2] Benguigui L, J. Phys. I France 2, pp 385 - 388 (1992); Physica A 191, pp 75 - 78 (1992); 219,pp 13 - 26 (1995).
[3] Nagel K, and M.Schreckenberg, J.Phys. I, 2, 2221 (1992).[4] Makse H, Andrade J, Batty M, Havlin S, and Stanley E, Physical Review 58, , pp 7054 - 7062
(1998).[5] Alexander C, ENSAYO SOBRE LA SINTESIS DE LA FORMA (NOTES ON THE
SYNTHESIS OF FORM), 2 ed., Ediciones Infinito, Buenos Aires, 1971.Batty M, and P. Longley, FRACTAL CITIES - A GEOMETRY FORM AND FUNCION, 1st
ed., Academic Press, London,1994.Hiller B, SPACE IS THE MACHINE, 1ed., Cambridge University Press, London, 1996.Jacobs J, THE DEATH AND LIFE OF GREAT AMERICAN CITIES, Vintage Books, NewYork, 1996.
[6] Hillier B, and J. Hanson, THE SOCIAL LOGIC OF SPACE, Cambridge Universe Press,London, 1997.
[7] Gomes M; Souza F e Adhikari S, Journal of Physics A: Mathematical and General 28 (1995)L613.
[8] Stosik B, Gomes M,and Adhikari S, Phys.Rev.E , 61, 6111(2000), and references therein.[9] Brito V, Gomes M, Souza F, and Adhikari S, Physica A, 259, 227 (1998).
Meibom A and Balslev I, Phys. Rev. Lett., (14), 2492 (1996).