URBAN DRAINAGE AND FLOOD CONTROL … DRAINAGE AND FLOOD CONTROL DISTRICT ALERT GAGE METEOROLOGICAL...
12
URBAN DRAINAGE AND FLOOD CONTROL DISTRICT ALERT GAGE METEOROLOGICAL SURVEY AND RATING Prepared for: Urban Drainage and Flood Control District 2480 West 26th Avenue Suite 156B Denver, Colorado 80211 PO # 7207 Prepared by: HDR Engineering Inc. Hydro-Meteorological Services 303 East 17th Avenue, Suite 700 Denver, Colorado 80203-1256 Phone: 303-764-1559 Fax: 303-860-7139 January 2003
-
Upload
nguyenlien -
Category
Documents
-
view
220 -
download
1
Transcript of URBAN DRAINAGE AND FLOOD CONTROL … DRAINAGE AND FLOOD CONTROL DISTRICT ALERT GAGE METEOROLOGICAL...

URBAN DRAINAGE AND FLOOD CONTROL DISTRICT ALERT GAGE METEOROLOGICAL SURVEY AND RATING
Prepared for:
Urban Drainage and Flood Control District 2480 West 26th Avenue Suite 156B
Denver, Colorado 80211
PO # 7207
Prepared by:
HDR Engineering Inc. Hydro-Meteorological Services 303 East 17th Avenue, Suite 700
Denver, Colorado 80203-1256 Phone: 303-764-1559
Fax: 303-860-7139
January 2003

i
TABLE OF CONTENTS
Section Page 1.0 Introduction ........................................................................................................................................ 1 2.0 UDFCD flood detection network .....................................................................................................1-2 3.0 Project description .........................................................................................................................2-4 4.0 Weather station rating criteria .........................................................................................................4-5 5.0 Rain gage rating criteria..................................................................................................................5-6 6.0 ALERT gage rating results..............................................................................................................7-8
6.1 Weather station rating results ............................................................................................. 7
6.2 Rain gage rating results ...................................................................................................7-8 7.0 Summary ........................................................................................................................................8-9
Bibliography .................................................................................................................................... 10 Appendix
LIST OF FIGURES
Figure 1: UDFCD ALERT gage network ...................................................................................... 2 Figure 2: Oklahoma Mesonet………………………………………………………………………… 4 Figure 3: Variation of gage catch with height............................................................................... 6 Figure 4: Gage catch variation due to obstruction by objects ..................................................... 6
LIST OF TABLES
Table 1: Surveyed UDFCD gages ……………………………………………………………………...3 Table 2: Rating values and their associated description ………………………………………...….5 Table 3: Weather station objective rating results ………………………………………….….……...7 Table 4: Rain gage rating results ………………………………………………………………………8

1
1.0 Introduction HDR Hydro-Meteorological Services has been contracted by the Urban Drainage and Flood Control District (UDFCD) to survey and objectively rate select ALERT (Automated Local Evaluation in Real Time) gages within its flood detection network (FDN). The survey and rating was completed for sixteen ALERT atmospheric variable observing gages, and for fifteen ALERT rain observing gages, located within the FDN. Although other ALERT gages located within the FDN were surveyed, they were not rated. The gages that were surveyed, but not rated included stream/river observing gages and radio repeater gages. These gages were not rated due to the fact that it was not identified in the scope of work for the project to perform ratings on these gage types. Throughout the remainder of the report atmospheric variable observing gages will be referred to as weather stations and precipitation observing gages will be referred to as rain gages. Three locations proposed by the UDFCD for possible ALERT weather stations were surveyed and photographed. These three locations included Marston Lake in Denver, Colorado, Aurora Reservoir in Aurora, Colorado and 1531 Skyway Drive in Longmont, Colorado. In October 2002 an ALERT weather station was installed on the north side of Marston Reservoir. This gage is functioning and is now part of the UDFCD FDN. Digital photographs were taken of all the gages that were visited and surveyed, as well as the three proposed weather station locations that were visited, resulting in a total of 197 digital photographs. The photographs can be found on the compact disk that accompanies this report. 2.0 UDFCD Flood Detection Network The UDFCD FDN (Figure 1) contains 149 ALERT gages that provide 135 real-time rain measurements, 68 real-time stream and/or reservoir water levels measurements, and 17 real-time weather stations that measure atmospheric variables. Precipitation is measured using standard 1mm ALERT tipping buckets. The precipitation is observed in a standpipe tower by a 12 inch diameter funnel. All weather stations measure precipitation, air temperature, relative humidity and wind speed/direction and some stations measure barometric (station) pressure. Stream flow and water height are observed by submersible pressure transducers and digital shaft encoders.
2
Figure 1. UDFCD ALERT gage network
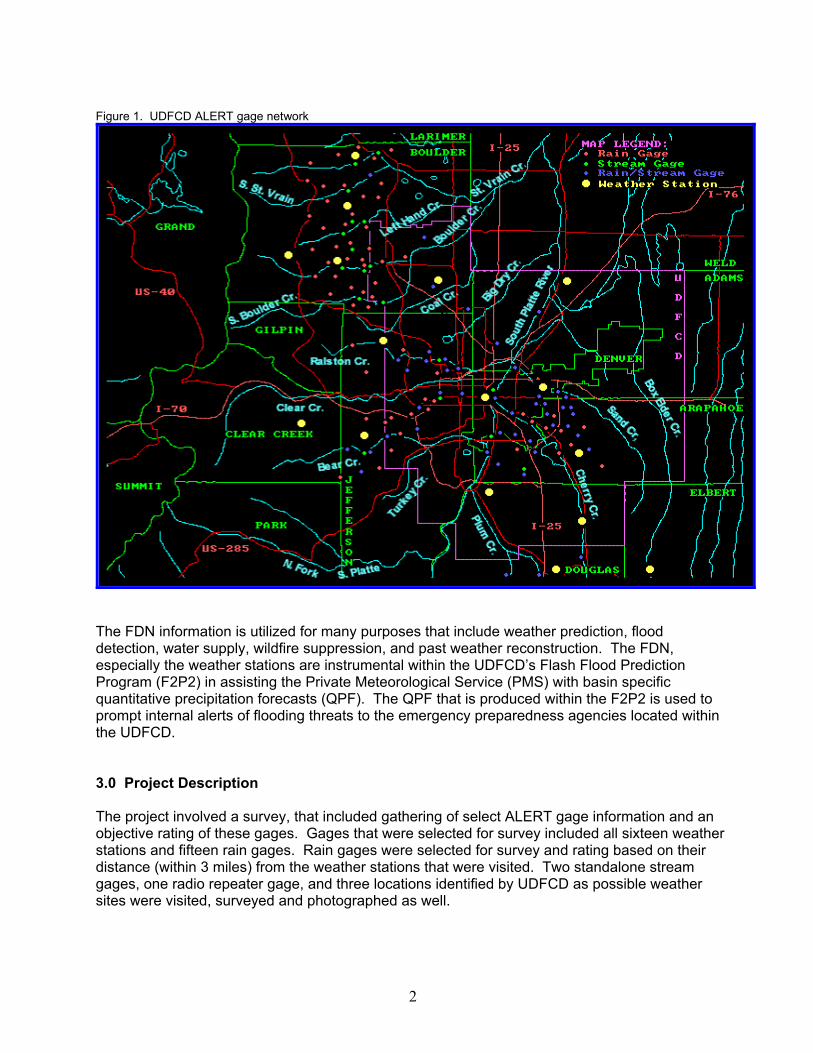
The FDN information is utilized for many purposes that include weather prediction, flood detection, water supply, wildfire suppression, and past weather reconstruction. The FDN, especially the weather stations are instrumental within the UDFCD’s Flash Flood Prediction Program (F2P2) in assisting the Private Meteorological Service (PMS) with basin specific quantitative precipitation forecasts (QPF). The QPF that is produced within the F2P2 is used to prompt internal alerts of flooding threats to the emergency preparedness agencies located within the UDFCD. 3.0 Project Description The project involved a survey, that included gathering of select ALERT gage information and an objective rating of these gages. Gages that were selected for survey included all sixteen weather stations and fifteen rain gages. Rain gages were selected for survey and rating based on their distance (within 3 miles) from the weather stations that were visited. Two standalone stream gages, one radio repeater gage, and three locations identified by UDFCD as possible weather sites were visited, surveyed and photographed as well.
3
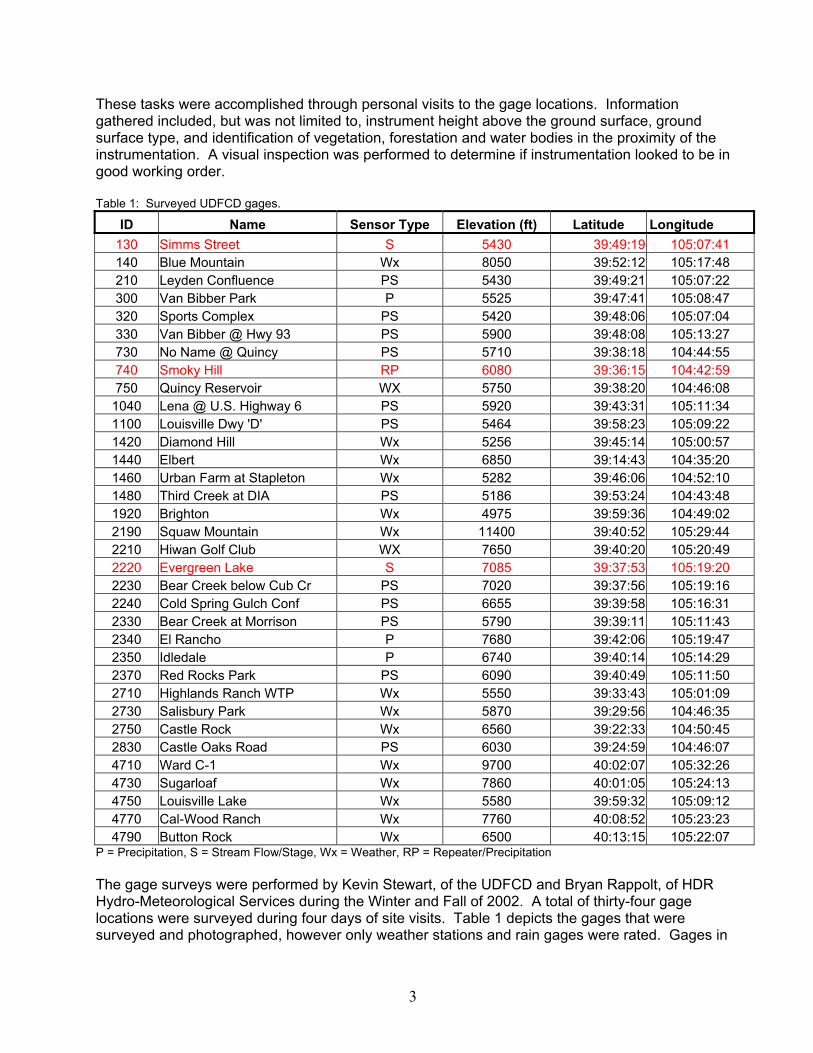
These tasks were accomplished through personal visits to the gage locations. Information gathered included, but was not limited to, instrument height above the ground surface, ground surface type, and identification of vegetation, forestation and water bodies in the proximity of the instrumentation. A visual inspection was performed to determine if instrumentation looked to be in good working order. Table 1: Surveyed UDFCD gages.
ID Name Sensor Type Elevation (ft) Latitude Longitude 130 Simms Street S 5430 39:49:19 105:07:41 140 Blue Mountain Wx 8050 39:52:12 105:17:48 210 Leyden Confluence PS 5430 39:49:21 105:07:22 300 Van Bibber Park P 5525 39:47:41 105:08:47 320 Sports Complex PS 5420 39:48:06 105:07:04 330 Van Bibber @ Hwy 93 PS 5900 39:48:08 105:13:27 730 No Name @ Quincy PS 5710 39:38:18 104:44:55 740 Smoky Hill RP 6080 39:36:15 104:42:59 750 Quincy Reservoir WX 5750 39:38:20 104:46:08
1040 Lena @ U.S. Highway 6 PS 5920 39:43:31 105:11:34 1100 Louisville Dwy 'D' PS 5464 39:58:23 105:09:22 1420 Diamond Hill Wx 5256 39:45:14 105:00:57 1440 Elbert Wx 6850 39:14:43 104:35:20 1460 Urban Farm at Stapleton Wx 5282 39:46:06 104:52:10 1480 Third Creek at DIA PS 5186 39:53:24 104:43:48 1920 Brighton Wx 4975 39:59:36 104:49:02 2190 Squaw Mountain Wx 11400 39:40:52 105:29:44 2210 Hiwan Golf Club WX 7650 39:40:20 105:20:49 2220 Evergreen Lake S 7085 39:37:53 105:19:20 2230 Bear Creek below Cub Cr PS 7020 39:37:56 105:19:16 2240 Cold Spring Gulch Conf PS 6655 39:39:58 105:16:31 2330 Bear Creek at Morrison PS 5790 39:39:11 105:11:43 2340 El Rancho P 7680 39:42:06 105:19:47 2350 Idledale P 6740 39:40:14 105:14:29 2370 Red Rocks Park PS 6090 39:40:49 105:11:50 2710 Highlands Ranch WTP Wx 5550 39:33:43 105:01:09 2730 Salisbury Park Wx 5870 39:29:56 104:46:35 2750 Castle Rock Wx 6560 39:22:33 104:50:45 2830 Castle Oaks Road PS 6030 39:24:59 104:46:07 4710 Ward C-1 Wx 9700 40:02:07 105:32:26 4730 Sugarloaf Wx 7860 40:01:05 105:24:13 4750 Louisville Lake Wx 5580 39:59:32 105:09:12 4770 Cal-Wood Ranch Wx 7760 40:08:52 105:23:23 4790 Button Rock Wx 6500 40:13:15 105:22:07
P = Precipitation, S = Stream Flow/Stage, Wx = Weather, RP = Repeater/Precipitation The gage surveys were performed by Kevin Stewart, of the UDFCD and Bryan Rappolt, of HDR Hydro-Meteorological Services during the Winter and Fall of 2002. A total of thirty-four gage locations were surveyed during four days of site visits. Table 1 depicts the gages that were surveyed and photographed, however only weather stations and rain gages were rated. Gages in

4
red, which include standalone stream gages and a radio repeater, were surveyed and photographed but were not rated. 4.0 Weather Station Rating Criteria Weather stations were surveyed and rated based on criteria (criteria A, D and E) that were developed by the Oklahoma Climatological Survey, to site gages within the Oklahoma atmospheric variable and precipitation observing network, (Oklahoma Mesonet). The Oklahoma Mesonet consists of 158 automated stations throughout the state of Oklahoma. Figure 2 depicts the location of the gages that comprise the Oklahoma Mesonet. Criteria (criteria B and C) established by the U.S. Department of Commerce, National Oceanic and Atmospheric Administration, were also used in the rating process. These criteria were established to assist in the siting of official first and second order weather observing stations across the United States. Figure 2. Oklahoma Mesonet
Weather stations that were rated for this project are defined as any gage that observes at a minimum, the following variables: temperature, relative humidity, wind direction and wind speed. The criteria used to rate the weather stations are as follows:
A. A site should be as far away as possible from irrigated areas, lakes and forests to minimize their influence on observation variables.
B. A site should be relatively level. Small gradual slopes are acceptable but avoid ravines,
bluffs, ridges, etc., which cause eddy currents and can have an effect of wind catchment.
C. There should be a minimum of obstructions that impede wind flow at the gage site. (A rule of thumb is that the distance between an obstruction to the wind and the top of the gage

5
should be at least 20 times the height of the obstruction. For example, a 30-foot tree should be no closer than 600 feet from the top of the gage.)
D. Gage sites should have uniform low-cover vegetation. Bare soil should not be visible
except over the bare soil temperature measurements.
E. Accessibility by vehicles for maintenance. Each gage was objectively rated by Bryan Rappolt of HDR, based on each of the five established critiea (A-E) described above and was given a numerical value of 1 through 4. A description associated with each value can be found in Table 2. Table 2. Rating values and their associated description Value Description
4 Excellent 3 Good 2 Fair 1 Poor 5.0 Rain Gage Rating Criteria Rain gages were rated based on criteria developed by the Oklahoma Climatological Survey (criteria C) and the U.S. Department of Commerce, National Oceanic and Atmospheric Administration (criteria B). Research performed by Howard H. Frisinger and G. Symons on the relationship between precipitation catchment and rain gage height was used for the establishment of criteria A. Rain gages that were rated for this project, are defined as any gage that observes rainfall depth. Note: All sixteen weather stations that were rated based on their atmospheric variable observations also observe rainfall depth. Because of this all the weather stations were rated based on their observation of precipitation depth as well. The criteria used to rate the rain gages are as follows:
A. Rain gage catchment funnel height. Research has shown that there is a direct correlation between the height of the rain gage and the observed precipitation catchment. It has been shown that precipitation catchment decreases with increased height of the rain gage (Figure 3) due to increased turbulent airflow around the top of the gage with height. For this rating rain gages that were observed to be higher than 5 feet above the ground (standard rain gage height as established by the U.S. Department of Commerce, National Oceanic and Atmospheric Administration) were assessed a lower value. For example gage heights of zero to eight feet above the ground were assessed a 4; greater than eight feet but less than eleven feet a 3; eleven feet to fourteen feet a 2, and grater than fourteen feet a 1.
B. There should be a minimum of obstructions that impede precipitation catchment (Figure 4)
in the catchment funnel. (The height of any obstruction relative to the catchment funnel height should not exceed twice the distance between the gage and the obstruction. For example, a 20-foot tree should be no closer than 10 feet from the gage).
C. Accessibility by vehicles for maintenance.

6
Each gage was objectively rated, on each of the three criteria (A-C) described above and was given a numerical value of 1-4. A description associated with each value can be found in Table 2.
Figure 3: Variation of gage catch with height for a given set of wind conditions as reported by Symons (1881).
Figure 4. Gage located near tree line with average canopy height of 60 feet. If gage is 30 feet from trees, trees should be no more than 60 feet high.

7
6.0 ALERT Gage Rating Results
6.1 Weather Station Rating Results Table 3 depicts the results of the weather station objective ratings, based on the established criteria. Based on the results the Quincy Reservoir weather station had the highest rating. The high rating is due to the fact that the gage was assessed high rating points on all the rating criteria and received 4’s (highest value possible) on 4 of the 5 rating criteria. The lowest rated weather station, scoring ten rating points out of a possible twenty points, was the Calwood Ranch weather station. The low rating was due to its close proximity to an open water source and forestation, wind obstruction from trees to the north and west, and poor accessibility by vehicles for maintanace. Table 3: Weather station objective rating results.
ID Name
Sensor Type Rating A B C D E Total
750 Quincy Reservoir Wx 3 4 4 4 4 19 2730 Salisbury Park Wx 2 4 4 3 4 17 1440 Elbert Wx 4 3 4 3 3 17 1420 Diamond Hill Wx 3 4 2 4 4 17 2710 Highlands Ranch WTP Wx 3 4 2 4 3 16 2750 Castle Rock Wx 3 3 4 3 2 15 1460 Urban Farm at Stapleton Wx 2 4 2 3 4 15 140 Blue Mountain Wx 3 4 3 3 2 15 4750 Louisville Lake Wx 2 2 2 4 4 14 4730 Sugarloaf Wx 2 4 2 3 3 14 2190 Squaw Mountain Wx 3 4 2 3 2 14 4710 Ward C-1 Wx 3 3 2 3 2 13 1920 Brighton Wx 3 3 2 2 3 13 4790 Button Rock Wx 2 3 2 3 2 12 2210 Hiwan Golf Club Wx 2 3 2 2 3 12 4770 Cal-Wood Ranch Wx 2 2 2 2 2 10
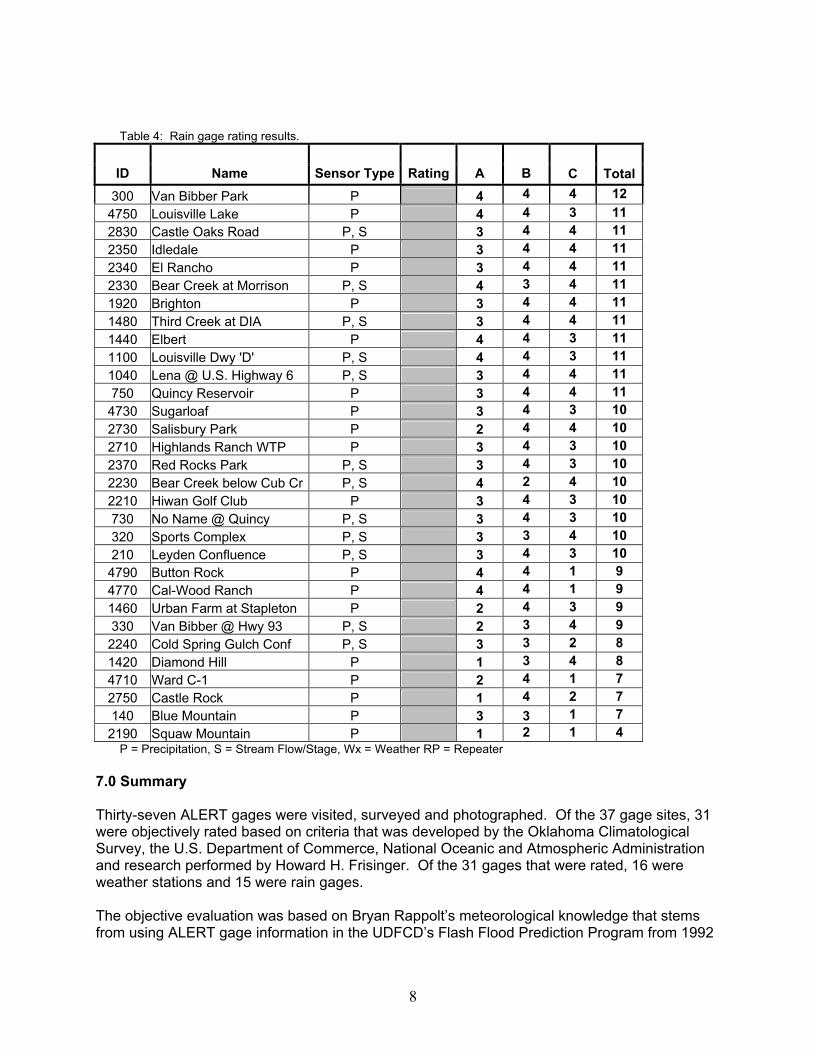
P = Precipitation, S = Stream Flow/Stage, Wx = Weather RP = Repeater/Precipitation 6.2 Rain Gage Rating Results Table 4 depicts the results of the rain gage objective ratings, based on the established criteria. Based on the results of the rating it can be shown that the Van Bibber Park rain gage had the highest rating; 12 out of a possible 12 rating points. The high rating is due to the fact that it was assessed the highest values possible for all three of the rating criteria. The rain gage that was rated lowest, scoring 4 out of a possible 12 ratings points, was Squaw Peak. The low score is due to the fact that the gage is located in a remote location that is poorly accessible by vehicles for maintaince, has a large obstruction (large rock) to the west of the gage, and that the rain gage is located so high off of the ground (~33 feet) that both have an affect on rain catchment.
8
Table 4: Rain gage rating results.
ID Name Sensor Type Rating A B C Total 300 Van Bibber Park P 4 4 4 12 4750 Louisville Lake P 4 4 3 11 2830 Castle Oaks Road P, S 3 4 4 11 2350 Idledale P 3 4 4 11 2340 El Rancho P 3 4 4 11 2330 Bear Creek at Morrison P, S 4 3 4 11 1920 Brighton P 3 4 4 11 1480 Third Creek at DIA P, S 3 4 4 11 1440 Elbert P 4 4 3 11 1100 Louisville Dwy 'D' P, S 4 4 3 11 1040 Lena @ U.S. Highway 6 P, S 3 4 4 11 750 Quincy Reservoir P 3 4 4 11 4730 Sugarloaf P 3 4 3 10 2730 Salisbury Park P 2 4 4 10 2710 Highlands Ranch WTP P 3 4 3 10 2370 Red Rocks Park P, S 3 4 3 10 2230 Bear Creek below Cub Cr P, S 4 2 4 10 2210 Hiwan Golf Club P 3 4 3 10 730 No Name @ Quincy P, S 3 4 3 10 320 Sports Complex P, S 3 3 4 10 210 Leyden Confluence P, S 3 4 3 10 4790 Button Rock P 4 4 1 9 4770 Cal-Wood Ranch P 4 4 1 9 1460 Urban Farm at Stapleton P 2 4 3 9 330 Van Bibber @ Hwy 93 P, S 2 3 4 9 2240 Cold Spring Gulch Conf P, S 3 3 2 8 1420 Diamond Hill P 1 3 4 8 4710 Ward C-1 P 2 4 1 7 2750 Castle Rock P 1 4 2 7 140 Blue Mountain P 3 3 1 7 2190 Squaw Mountain P 1 2 1 4
P = Precipitation, S = Stream Flow/Stage, Wx = Weather RP = Repeater 7.0 Summary Thirty-seven ALERT gages were visited, surveyed and photographed. Of the 37 gage sites, 31 were objectively rated based on criteria that was developed by the Oklahoma Climatological Survey, the U.S. Department of Commerce, National Oceanic and Atmospheric Administration and research performed by Howard H. Frisinger. Of the 31 gages that were rated, 16 were weather stations and 15 were rain gages. The objective evaluation was based on Bryan Rappolt’s meteorological knowledge that stems from using ALERT gage information in the UDFCD’s Flash Flood Prediction Program from 1992

9
through 2002 and the Flood Control District of Maricopa County Meteorological Services Pilot Program in 1996 and 1997. The ratings show that Quincy Reservoir recived the highest score and Calwood Ranch the lowest score in the weather station rating. The rain gage ratings show that Van Bibber Park rain gage received the highest score and Squaw Peak rain gage the lowest score. It is recommended that the Quincy Reservoir weather station and the Van Bibber Park rain gage be used as models for future weather station and rain gage siting within the UDFCD’s FDN.

10
Bibliography
Morris, D.A., K.C. Crawford, K.A. Kloesel, and J.M. Wolfinbarger. 2001. OK-FIRST: A Meteorological Information System for Public Safety. Bulletin of the American Meteorological Society 82(9): 1911-1923. Morris, D.A. and C. Duvall. 1999. An Evaluation of the Use of Real-Time Weather Data by Public-Safety Agencies. Preprints, 15th International Conference on Interactive Information and Processing Systems for Meteorology, Oceanography and Hydrology; American Meteorological Society, Dallas, Texas, January 10-15. Maintenance and Calibration Manual for the Automated Weather Data Network. Karl Biauvelt Calibration Facility, Automated Weather Data Network, High Plains Climate Center, University of Nebraska-Lincoln. Stewart K. 1999. Revelations From 21 Years Of Providing Flash Flood Warning Support In Denver, Colorado. Paper presented at NATO Advanced Study Institute: Coping with Flash Floods Ravello, Italy, 8-17 November, 1999. Stewart K. 1995. Flood Warning Systems & Early Notification Procedures In Denver, Colorado. Paper presented at "Current Issues in Total Flood Warning System Design," an international invitational workshop held at the Flood Hazard Research Centre, Middlesex University, London, England, UK, September 10-12, 1995. Horel J., M. Splitt, B. White and L. Dunn. 2000. Mesowest: Cooperative Mesonets in the Western United States. Paper presented at the Meso-West Mountain Meteorology Conference. August 2000. Frisinger, H. Howard, The History of Meteorology: to 1800, Science History Publications, AMS, 1977, pp 88-91. Symons, G. J. On the Rainfall Observations Made Upon Yorkminster by Professor John Phillips, F.R.S, British Rainfall, pp 41-45, 1881 National Atmospheric Service, Operations Manual -Standards And Procedures For Surface Observing Program. Chapter 11, part B, 1982. Curtis, C. David and R. Burnash, Inadvertent Rain Gauge Inconsistencies and Their Effect of Hydrologic Analysis. Paper presented at the California-Nevada ALERT Users Conference, Ventura, California May, 1996. University Of Oklahoma, Norman, Oklahoma, 2002. Oklahoma Mesonet Website. http://www.mesonet.ou.edu/. Juniata College, Huntingdon, Pennsylvania, 2002. Precipitation Data Factors Influencing MAP Calculations Website. http://faculty.juniata.edu/johnson/projects/hydromet_module/content/topic2_evaluating/map_1.htm Station Name (Type) Installed Elevation Latitude Longitude