Urban Development Prediction Software
18
Urban Development Prediction: Examining Spatial Networks from Graph-Based Analysis Software Ryan Lawber ARCH 509.001 Fall semester December 10, 2007 Prof. Timothy Brown Abstract Several technologies have been developed to analyze and predict the most efficient developed product of a given site through the analysis of site parameters. These programs examine the visual access of a site to create development models and pedestrian analyses of specific locations, areas, or indoor spaces. This paper will examine the fundamental characteristics of some of these programs and look at the output from a sample software of several sites where this technology has aided in development. Also, a speculation on what this product could evolve into and future applications of this technology will be discussed. Keywords urban prediction, Depthmap, Space Syntax, visibility graph analysis, spatial networks.
-
Upload
ryan-lawber -
Category
Documents
-
view
212 -
download
0
description
Examining Spatial Networks from Graph-Based Analysis Software. Several technologies have been developed to analyze and predict the most efficient developed product of a given site through the analysis of site parameters. These programs examine the visual access of a site to create development models and pedestrian analyses of specific locations, areas, or indoor spaces. This paper will examine the fundamental characteristics of some of these programs and look at the output from a sample software of several sites where this technology has aided in development. Also, a speculation on what this product could evolve into and future applications of this technology will be discussed.
Transcript of Urban Development Prediction Software
Urban Development Prediction: Examining Spatial Networks from Graph-Based Analysis Software
Ryan LawberARCH 509.001Fall semester December 10, 2007Prof. Timothy Brown
AbstractSeveral technologies have been developed to analyze and predict the most efficient developed product of a givensite through the analysis of site parameters. These programs examine the visual access of a site to createdevelopment models and pedestrian analyses of specific locations, areas, or indoor spaces. This paper willexamine the fundamental characteristics of some of these programs and look at the output from a sample softwareof several sites where this technology has aided in development. Also, a speculation on what this product couldevolve into and future applications of this technology will be discussed.
Keywordsurban prediction, Depthmap, Space Syntax, visibility graph analysis, spatial networks.
I. Spatial Network Analysis SoftwareA. Spatial Network Analysis and Visibility Graph Analysis program parameters
1. Theory2. Precedents3. Criticisms4. Urban applications
B. Programs1. Axman2. Depthmap software
a. Visibility Graph Analysisb. Axial Line Analysis
II. TheoryA. Terminology
1. Cellular Automata2. Visibility Graph analysis3. Axial map analysis4. Isovist5. Autopoiesis
B. Local and indoor modelingC. Space Syntax
1. Space Syntax2. Intelligent Space
III. PrecedentsA. Thornhill Square, Islington, Greater London, UK
1. Analysis2. Development
B. Washington DC, USA1. Analysis2. Development
C. Duisburg, Germany1. Analysis2. Development
C. Chicago, Illinois, USA1. Analysis
IV. CriticismsA. Natural phenomena
1. Wind, terrain, etc.2. Paths of impedance
B. Psychological parameters1. Emotion2. Knowledge3. Substandard area development
V. Urban ApplicationsA. Current uses
1. Radio tower placement2. Automated robotics
B. Possible applicationsVI. Conclusion
I. Spatial Network Analysis Software
Spatial network analysis software is a relatively modern invention created in an attempt to predict development inurban areas. This software has many different names, going by labels such as spatial network analysis software,urban development prediction software, space syntax software, and meta-cognitive mapping among others. Thetheory behind this software is to take the guesswork out of which locations of an area will be the most heavilytrafficked by pedestrians, bicycles, or vehicles (dependent on the input) allowing designers and developers to planaccordingly. This software is applied to form graph based analyses of spatial systems, examining lines of sight andpredicting paths most traveled by pedestrians on the site. Granted, this type of programming is still quite abstract,but can be used to examine specific locations in an urban location, a university campus, a transit system, a city,and many other developments including interior spaces in some circumstances. Urban applications tend to workbest, as most of the software is based around a high density pedestrian transportation for short distances, nothigh-speed vehicle travel.
The University College London has been credited as being the first to develop this type of software. In the late1980s, a team lead by Nick Dalton of the UCL created one of the initial spatial analysis programs, Axman, whichperforms axial line examinations of input information.1 Axial analysis processes input information and develops anapproximated accessibility of an area by displaying an axial lines overlay on the initial plan as the output.2 Furtherdetail on axial analysis will be covered later in this paper. Axman can be used to interpret urban locations orinterior spaces such as indoor malls or office buildings. This software is still currently used and is available foracademic use on the Space Syntax website to run on Macintosh operating systems.3 Dalton has also developed aweb-based analysis software, meant to be used from an internet browser and analyze DXF files input.4 As of thetime of this writing this software was not operable. However, a downloadable Javascript version is available to thepublic. This Javascript version is designed to create an axial analysis of information and coexist with the Axmansoftware output.
Another program designed for this type of analysis is Depthmap, designed by Alasdair Turner, also of theUniversity College London. This software produces axial analysis of information similar to Axman, as well asgenerating isovist and outputting visibility graph analyses. Isovists are simply defined as the area visible from alocation.5 This program and defining isovists will be discussed in further detail later on in this paper. Other softwarehas been generated that each has its own positives and negatives, some incorporating Geographic InformationSystem (GIS) data or AutoCAD content. However, this paper will focus primarily on Depthmap software.
These types of programs have been used to analyze several urban areas around the globe. For example, thearchitect Norman Foster used this software in the development of Swiss Re Headquarters at 30 St Mary Axe inLondon, known to many Londoners as “The Gherkin.” The analysis of pedestrian use in the area determined thedevelopment and placement of ground level sections of the building. The users of the software found that thevisibility graph analysis of the existing urban plan was able to predict approximately 64% of the site pedestrianmovement (see illustration 1). Other locations of analysis include Thornhill Square, Islington in Greater London,UK, applications in Germany, and areas of Washington DC to name a few. The utilization and analyses of thesespecific sites will be examined in further detail later on in this paper.

II. Theory
Where pedestrian movement occurs is where urban areas develop.The most successful areas of a city are typically those where thereis a high amount of foot traffic, this correlating to the unrestrictedpatterns of pedestrian movement. The pedestrian analysis of theseprograms is based around the visibility analysis of a site, and thesoftware has been designed to perform visibility graph analyses ofsites that in turn predict how a site will develop.
The Axman software developed in the late 1980s at the UniversityCollege London was one of the first of these spatial analysisprograms. Spatial network analysis software has been developed tobe applied to form graph based analyses of spatial systems. Similarbut more advanced than Axman, programs like Depthmap havebeen expanded and developed to produce usable visibility analysisgraphs from the examination.
Utilization of these types of programs respond to the use of cellularautomata models. These models examine the local interaction ofcells to develop usable information.6 For these cellular automata, agrid is applied over the given plan and the relations to each of thecells according to its location on the plan is analyzed.
Spatial analysis defines the inquiry and interpretation of specific parameters of a given model.7 Visibility analysissoftware is a branch of spatial analysis that primarily examines a graph of “intervisible locations on a model” ofvisible connections between all points within the spatial field on a given model.8 Similarly, an axial map analysisdevelops axial lines connecting areas on a given plan. The more connected the area, the denser, thicker, ordifferent colored the line output, depending on which software is being used to process the information.
The visibility analysis of Depthmap, originally written in 1998, “takes input in the form of a plan of the system, andis able to construct a map of visually integrated locations within it.”9 The software is a visibility analysis softwarethat, in its programming, develops isovists, defined as “either the area visible from a location in a plan in twodimensions, or the visible polyhedron surrounding a location in three dimensions.”10 In simpler terms, isovists arevantage points relating to your complete circular visual field if you were standing in the given plan; areas that youcan see without moving are marked as being more visible than those requiring you to move. The paper Tools forSpatial Analysis gives a good summary of several of the original software programs developed. The Space Syntaxidea developed by Hillier and Hanson is described as the drawing of “space bubbles” between wall partitions withaxial lines drawn to connect the static spaces. An “integration value” determined from the amount of intersectionsfor each line is given as the analysis of the information.11
The theory behind this software is that it will better be able to predict where and what developments will occur andthe reaction to the defined spaces. This software is structured around the notion of autopoiesis, a term usuallyregarded for the characterization of biological systems, but here refers to the ability of the program to self producecoherent data based on a minimal amount of initial data.12 The behavior of the software's programmed “people”,
Illustration 1: Analysis of the 30 St. Mary Axesite. The red areas in the output have beenanalyzed to be more visible than the othercolors down the spectrum, blue being the leastvisible. (source: UCL, 1999)

known as “agents,” relies on this computer script to mimic human behavior. Generally, these programs refer tospecific locations on a plan and the connections between it and everywhere else. Isovists again, as described byBenedikt, refer to the analyzed specific location in a given plan and analyze its visual connectedness with all otherplaces 360 degrees from that position.13 The higher the degree means the more connected a location is in a givenplan, and maintains a greater possibility for growth and development.
Agent-based analysis performed by many of these programs relies on computer code to define human behavior.This emulation allows for an analysis of site locations revealing dead zones in plans and an overall populationmapping. These agents attempt to follow the path any human would take when modeled in an indoor analysis oroutdoor site. These modeled agents have been developed since the initial release of a spatial analysis software,and criticisms of their effectiveness are constantly being scrutinized. More on the criticisms of the agents isdiscussed toward the end of this paper.
Currently, there are two groups at the forefront of development and use of this software. Space Syntax Limited, aninternational consulting company based in London, UK, has ties with the University College London and releasessoftware jointly. This company uses this software to create predictions of sites for developers, movement surveysfor pedestrian, bicycle, and vehicle transport, and land use analyses. Space Syntax Limited is the company thatarchitect Norman Foster collaborates with for development on many of his projects, as well as analysis of theunderground transit for London and other city examinations.14
Another company involved in this software is Intelligent Space, also based in London (Intelligent Space recentlymerged into the Atkins group). This establishment also develops transportation analyses and visibility graphs, butuses a program called Fathom, a software they developed around the year 2000 to perform these examinations.15
This software was adapted to create a walking map of the city of London, expanding from the nodes of the subwaysystem for the congestion charging zone, a fee based incentive to reduce vehicular traffic in downtown London.16
Intelligent Space has also developed a Transport Accessibility Model which examines “how accessible everytransport facility is from each part of the street network.”17
III. Precedents
Spatial Analysis software has been used do develop a number of recent projects. For example, new designs forTrafalgar Square and the Whitehall area in London were recently created, utilizing the visibility graph analysis andaxial analysis of movement.18 Additionally, this software has developed analyses for several cities. This paper willexamine this output in comparison to what has been developed within the site. Three examined sites include anarea in London known as Thornhill Square, Washington DC, USA, and an area in Duisburg, Germany. Also to beexamined is another less prominent US location in an area of Chicago, Illinois.
The location of Thornhill Square in Greater London seems like an odd location for analysis, but this is the area ofanalysis is the site contained in the tutorials of the Depthmap program. The following image uses the line drawingsfrom the tutorial pages of the Depthmap program. A grid of 10 units was applied and all lines were noted to beanalyzed (see illustration 3)
The visibility analysis works fairly well in this instance. Since the residential neighborhood has a primarily flat,uninterrupted facade with no storefront entrances and continuous building heights, the visibility analysis does notrun into any issues. As far as a development standpoint, the areas with a higher visibility on the analysis should be
built up more commercially. In this example, the red and yellow areas in illustration 3 have been developed withrestaurants, cafes, and small shops in illustration 4. It is difficult, if not impossible to see if this is a successfuldesign from an aerial photograph, but a former resident of the Thornhill Square area says “it is back again to avery much desired residence.”19
A similar analysis was performed on the downtown area of Washington, DC in the United States. This analysiswas performed by Intelligent Space Partnership of London for the Hines real estate company.20 The model wasbuilt to provide information on pedestrian movement analysis for the site previously occupied by a largeconvention center in the Capitol district of Washington DC. The analysis covers many of the tourist areas of thecity, including the White House, Washington Monument, Jefferson Memorial and others including rail transit stops.What can be seen in the image (analysis in illustration 5) seems accurate, as pedestrians tend to flock radiallyaround the White House and monuments (these being tourists on foot). The axial urban design of the city allowsfor the connecting arteries to be filled with pedestrians. However, again, it is difficult to see if this plan works on apedestrian standpoint by examining an aerial image (illustration 6).
For another example of the analysis of this software, the city council of Duisburg, Germany hired Intelligent SpacePartnership to develop a pedestrian flow study to develop a master plan of the downtown area (see the analysis inillustration 7). Similar to the other analyses, the red areas are the most highly trafficked and as the traffic lessens,the colors move down the spectrum. This plan appears to have developed the area quite appropriately. Pedestrianfeatures such as fountains and shade trees− to which Palladio defines as a place where “travelers may bedefended from the scorching heats of the sun, and their eyes receive some recreation”21− along the most highlyviewed areas can be seen from the aerial image (illustration 8). Also, the incorporation of public transit has beendeveloped into the plan, as seen on both the analysis and the image. Intelligent Space went about “using on sitesurveys, enabling the council to target strategies such as pedway widening and signage to maximum effect”andpaired this with computer information.22 The main arteries of this analysis are closed to vehicular traffic, so realityimitates the analysis working without the impedance of multi-lane streets.
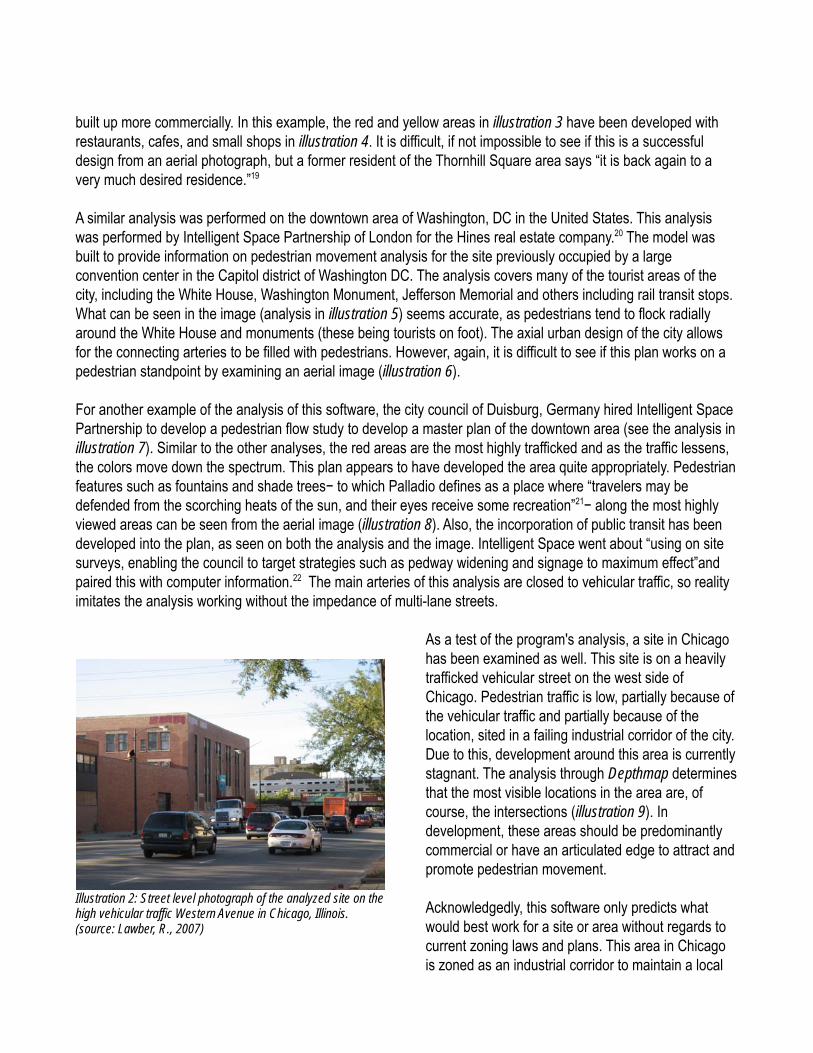
As a test of the program's analysis, a site in Chicagohas been examined as well. This site is on a heavilytrafficked vehicular street on the west side ofChicago. Pedestrian traffic is low, partially because ofthe vehicular traffic and partially because of thelocation, sited in a failing industrial corridor of the city.Due to this, development around this area is currentlystagnant. The analysis through Depthmap determinesthat the most visible locations in the area are, ofcourse, the intersections (illustration 9). Indevelopment, these areas should be predominantlycommercial or have an articulated edge to attract andpromote pedestrian movement.
Acknowledgedly, this software only predicts whatwould best work for a site or area without regards tocurrent zoning laws and plans. This area in Chicagois zoned as an industrial corridor to maintain a local
Illustration 2: Street level photograph of the analyzed site on thehigh vehicular traffic Western Avenue in Chicago, Illinois.(source: Lawber, R., 2007)
industrial commerce within the city. However, most of these businesses have relocated to the suburbs and thearea has become desolate with empty lots and abandoned buildings, creating an area that is not currently adaptedto pedestrian movement. With modified zoning of the area and reinstated rail transit, the location could developinto what the pedestrian analysis supposes.
IV. Criticisms
In the book The Image of the City, Kevin Lynch writes that there is an emphasis on physical qualities within citiesthat be can identified within a mental image. Lynch gives this the term imageability, the notion that certain aspectsof the city will remain in the mind of the observer.23 He states that “it is the shape, color, or arrangement whichfacilitates the making of vividly identified, powerfully structured, highly useful mental images of the environment.” Itapplies to areas that appeal “sharply and intensely to the senses.”24 He continues that “spatial prominence”generates sensory landmarks within two possibilities: creating an “element” visible from many locations, or havinga local variation within the urban system.25
It is this imageability that separates this software from actuality that makes it unreliable. Spatial magnitude variesaccording to location and the current humanized analysis programs ignore this inborn sense. Certain areas morepowerfully attract people to an experience within and around the space, and these areas can be naturally orartificially made locations. These areas occur on every site, although many times the magnitude is not asnoticeable. However, this notion should be incorporated into the program code.
It should be added that it is simple to critique a computerized imitation of human behavior. This evaluation hasbeen discussed throughout history by people disinclined toward technology too closely replicating humanmovement. Even when the printing press was invented, it was feared the new technology would “defile the nameof God.”26 It is a primitive fear of the unknown and a natural fear of technology. This said, and on a much smallerscale, criticisms of the visibility analysis programs is varied depending on whom is evaluating the software. Manyshared complaints argue that the programs do not consider many environmental elements, such as terrain, wind,temperature, light, etc that affect site developments. Much of this is examined with many of the spatial analysissoftwares that utilize GIS information not covered in this paper. Additionally, a site may have visual connectivity,but contain a physical barrier such as a fence.27 Also, the opposite of this is true as well: a site may have no visualconnectivity, but is able to be accessed on foot. Additionally, vehicular traffic is not considered, and because of thisa one lane road is viewed the same way as a four-lane highway. As an example of this, In the analysis of theChicago, Illinois site earlier in this paper, Depthmap analyzed the location without regard to the 70 feet (21.5meter) wide obstruction that is the highly vehicle trafficked Western Avenue, which is not easily crossed on footunless at a major intersection. Depthmap assumes these paths have no impedance. However, the software doesnot consider pedestrian paths of impedance and assumes an unperforated building edge. The programs viewpromenades with storefront entrances as equals to large warehouses with no public articulation. It is theuniqueness of specific areas among others (best stated by Lynch) that is ignored by this software.
Additionally, Depthmap does not consider the abnormal paths that a person may take when traveling by foot.Given, this would be very difficult for a program to replicate, but certain microclimates change pedestrian sensesof a site. Variance differs by setting, but factors such as sound and smell also determine pedestrian paths inaddition to sights. Also to be considered are human emotions. Fear will traditionally repel traffic just as joy willcreate it. The agents in the current version of Depthmap follow fairly straight lines between two points with nobacktracking, shortcuts, or feeling. In A Pattern Language Christopher Alexander writes:

“People want to be close to shops and services, for excitement andconvenience. And they want to be away from services, for quiet and green. Theexact balance of these two desires varies from person to person, but in theaggregate is the balance of these two desires which determines the gradient ofhousing densities in a neighborhood.”28
Psychological parameters of the users feelings and knowledge cannot be analyzed by the software. People willtend to maintain a distance from specific areas in a development more than other areas. Substandarddevelopment, industrial and manufacturing areas, alternative business hours, etc. cannot be predicted in thesoftware but occurs in real-world urban situations. Some of these criticisms could possibly be remedied withadditional end-user programming or additional map files, but most cannot. In its user manual, the creators ofDepthmap visibility graph analyses have stated as whether or not the output theoretically succeeds in itsdevelopment. The programmers do mention that people movement could possibly be better analyzed with otherapplications.29
V. Urban Applications
Aside from the criticisms, visibility graphs are currently being used in the placement of radio towers in thelandscape. Since a clear line of sight is needed for each antenna to function, this software is a perfect applicationto determine the location of the towers.30 This analysis software has also been used in autonomous robotics todetermine acceptable paths of motion. For example, in a vehicle factory that uses autonomous robots, the spaceneeds to be analyzed so when a robot rotates a manufactured part around the facility, it does not collide withanother machine in a different location. This is even more applicable in the manufacturing of the complex accuracyof computer circuits and chips.
The software has also been analyzed by University College London in aid to what they call “ecomorphic design.”31
The developers at UCL state “an ecomorphic design should act and react according to its occupation, so that theenvironment and its inhabitants form an ecological whole.” This has been envisioned in a computer program as acustomizable, generative, interactive architectural space.32 The developers “propose autopoietic software agentsthat similarly maintain themselves within the artificial environment through natural movement. In response, theartificial environment may adapt to the software agent.”33 However, bounds of computers mimicking humans haslimited this path until greater computer development has been created.
Additional possibilities for this intelligence applied to an urban context could be extremely useful. For example,manually operated vehicles on city streets could utilize a real-time visibility graph analysis software to analyze themovement of objects and people around it. This would be applicable to personal drivers, bus drivers, and railtransit system operators and allow for a vehicular system that constantly monitors and adjusts to its surroundings.Vehicles would repel from would-be collisions similar to magnets of the same polarity, avoiding other vehicles,cyclists, pedestrians, etc.
Building codes could also be modified with the use of this software's ability to track multiple pedestrian trafficzones in interior situations. This could be used to analyze egress requirements in buildings with a largeattendance. Auditoriums and civic centers would apply in this situation, but particularly high rise buildings,especially as more and more tall structures are being built as residential towers. The exits for these buildings, and

code requirements could be modified to benefit both the developers and the occupants with a possibility of lessfloor area designated toward egress requirements.
VI. Conclusion
Christopher Alexander states in A Pattern Language that “the simple social intercourse created when people rubshoulders in public is one of the most essential kinds of social 'glue' in society.”34 It is for these reasons that thispedestrian analysis is so important, and even more important to produce accurately. Pedestrians are the glue thatholds a city together.
A reasonable argument regarding intelligent spatial analysis and urban prediction and its replication, mimickinghuman development and knowledge is ever changing. This software is still theoretical and is bound to have someflaws in its design. This notion should be considered when using any nascent technology. One of the leaders in thehistory and theoretical research of artificial intelligence, Ray Kurzweil, states that computers will most likely exceedhuman development around the year 2020.35 This prediction is according to the Turing test, defined as ameasurement of a computer or program to demonstrate intelligence and exceed natural human development.36
Perhaps this perspective is a bit too science-fiction or futuristic, but demonstrations of computers replicatinghuman behavior have increased exponentially within the past century.37 Traditional methods for zoning, modeling,and developing properties are evolving and establishing a wider array of uses for urban areas, universitycampuses, and indoor construction. Although not perfected yet, this methodology of analysis is creating a newtypology for developments and a foundation for these new tools to be successfully implemented and utilized in thefuture.

Illustration 3: Analysis of Thornhill Square area. The red areas in the output have been analyzed to be more visible than the other colorsdown the spectrum, blue being the least visible.(source: Depthmap program, 2007)
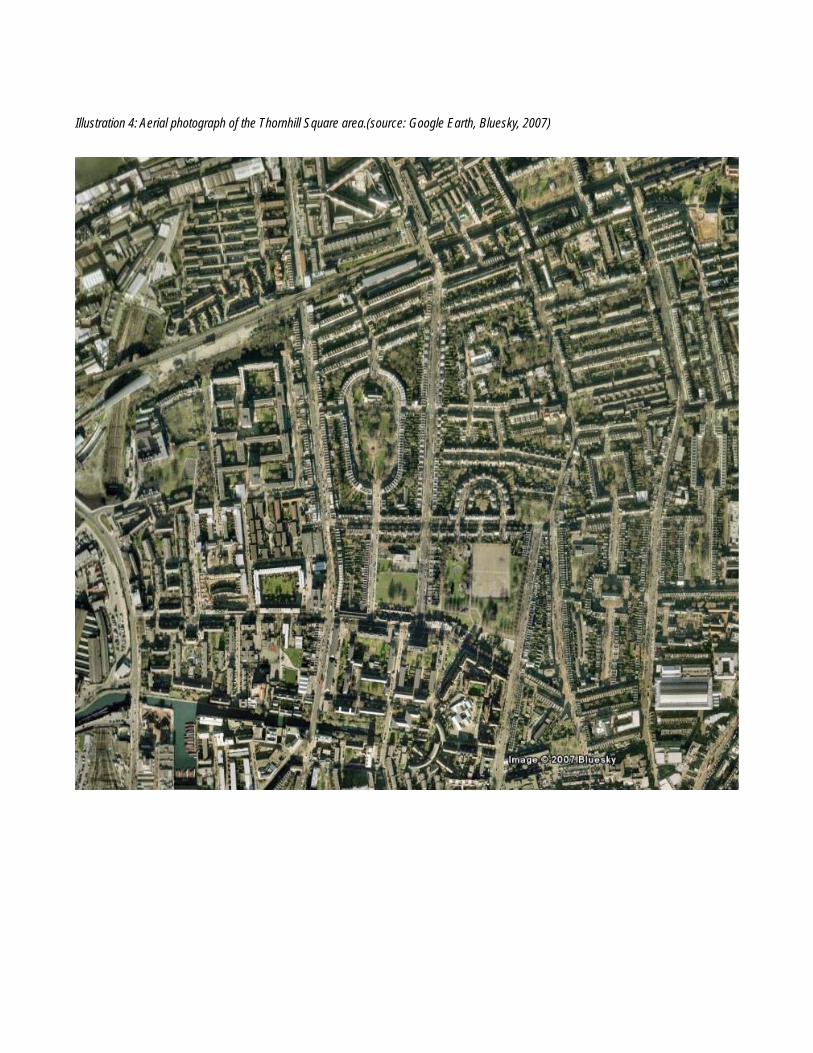
Illustration 4: Aerial photograph of the Thornhill Square area.(source: Google Earth, Bluesky, 2007)


Illustration 6: Aerial photograph of Washington DC.(source: Google Earth, Bluesky, 2007)

Illustration 7: Pedestrian flow analysis of the central business district of Duisburg, Germany.(source: Intelligent Space Partnership, 2007)

Illustration 8: Aerial photograph constructed after the analysis of the site of Duisburg, Germany.(source: Google Earth, Bluesky, 2007)

Illustration 9: Analysis of the site near Western Avenue and Lake Street in Chicago, Illinois. The large blank area in the upper left is a railyard. The most visible locations are the intersections of the streets as indicated by the red areas in the output and the other colors downthe spectrum, blue being the least visible. (source: Depthmap program, 2007)

Illustration 10: Site near Western Avenue and Lake Street in Chicago, Illinois. (source: Google Earth, Bluesky, 2007)

1 MCAG GIS: Glossary of GIS Terms, http://www.mcaggis.com/Glossary.html (December 2006, accessed October 23, 2007). 2 Batty, M. and Rana, S., Reformulating Space Syntax: The Automatic Definition and Generation of Axial Lines and Axial Maps, London UK, UCL, (2002, date PDF downloaded: December 9, 2007). page 1.3 Space Syntax Laboratory, Macintosh Bundle, University College London, http://www.spacesyntax.org/software/macbundle.asp
(accessed October 23, 2007). 4 WebmapAtHome, WebmapAtHome download page, http://www.thepurehands.org/webmapathome/ (accessed October 21, 2007).5 Turner, A. and Penn, A., Making Isovists Syntactic: Isovist Integration Analysis, London, UK, UCL, (1999, date PDF downloaded:
December 9, 2007).6 Moreno N. and Marceau D., Modelling Land-Use Changes Using a Novel Vector-Based Geographic Cellular Automata, (May 2007,
Date PDF downloaded: 10-22-07).7 MCAG GIS: Glossary of GIS Terms, http://www.mcaggis.com/Glossary.html (December 2006, accessed October 23, 2007). 8 de Berg, M., van Kreveld, M., Overmars, M. and Schwarzkopf O., Computational Geometry, 2nd revised edition, 2000
ISBN 3-540-65620-0. Chapter 15: Visibility Graphs: pp.307–317.9 Space Syntax Laboratory, UCL Depthmap, University College London, http://www.spacesyntax.org/software/depthmap.asp (2007,
accessed October 24, 2007).10 Turner, A. and Penn, A., Making Isovists Syntactic: Isovist Integration Analysis, London, UK, UCL, (1999, date PDF downloaded:
December 9, 2007).11 Yi-Luen Do, E. and Gross, M., Tools for Visual and Spatial Analysis of CAD model, Atlanta, Ga and Boulder, CO, (1997, date PDF
downloaded: October 17, 2007), page 3.12 Glossary--Self organization and statistical mechanics, http://www.geos.ed.ac.uk/homes/mnaylor/Glossary.html (January, 2007,
accessed December 9, 2007)13 Yi-Luen Do, E. and Gross, M., Tools for Visual and Spatial Analysis of CAD model, Atlanta, Ga and Boulder, CO, (1997, date PDF
downloaded: October 17, 2007), page 3.14 Space Syntax, Projects and Clients, http ://www.spacesyntax.com/main-nav/projects-and-clients.aspx (2007, accessed October 24,
2007).15 Intelligent Space Partnership, Fathom: Visibility Graph Analysis Software, http://www.intelligentspace.com/tech/fathom.htm (2007,
accessed October 24, 2007).16 Transport for London, What is Congestion Charging?, http://www.cclondon.com/whatis.shtml (2007, accessed October 24, 2007).17 Intelligent Space Patnership, Transport Accessibility Analysis. London, UK. (2006, Date PDF downloaded: October 14, 2007).18 Bechtel, R. and Churchman, A., Handbook of Environmental Psychology, (2003), Page 288.19 Humphries, C., Memories of Life in Thornhill Square during the Early 20th Century, Thornhill Square Association,
http://thornhillsquare.typepad.com/thornhill_square/thornhill_square_facts_and_history/index.html (2006, accessed October 24,2007).
20 Intelligent Space Partnership, Washington DC Former Convention Center Site Masterplan, (2005, accessed October 24, 2007)http ://www.intelligentspace.com/projects/10739.htm
21 Palladio, A., The Four Books of Architecture, (1965, Dover Publications Inc. originally published in 1738) page 60.22 Intelligent Space Partnership, Pedestrian Movement Analysis of Duisburg Town Centre, (2002, date PDF downloaded: October 25,
2007).23 K. Lynch. The Image of the City, (Cambridge: MIT Press, 1972), page 9.24 Ibid, page 9.25 Ibid, page 80.26 McClellan, J. and Dorn, H., Science and Technology in World History, (2006, JHU Press) page 109.27 Dalton, N., WebMapAtHome, Open University, Milton Keynes, UK. ( August 2007, Date PDF downloaded: October 14, 2007).28 Alexander, C. and others, A Pattern Language, (New York: Oxford University Press, 1977), page 156.29 Turner, A., Depthmap 4 - A Researchers Handbook, Bartlett School of Graduate Studies, UCL, London, (2004, Date PDF
downloaded: October 14, 2007).30 Turner, A., Doxa, M., O'Sullivan, D., and Penn, A., From isovists to visibility graphs: a methodology for the analysis of architectural
space--Environment and Planning B 28 103--121. (2001).31 Turner, A., Ecomorphic Design, http ://www.vr.ucl.ac.uk/research/ecomorphic/ (2005, accessed October 23, 2007).32 Ecomorphic Dialogues [Computer software], (February 2005), London, UK: http://www.vr.ucl.ac.uk/research/ecomorphic/ 33 Turner, A. July 2003. Reversing the Process of Living: Generating Ecomorphic Environments. London, UK. (Date PDF downloaded:
October 22, 2007).34 Alexander, C. and others, A Pattern Language, (New York: Oxford University Press, 1977), page 489.35 Kurzweil, R., The Age of Spiritual Machines, (Penguin Group, 1999).36 Oppy, Graham and David Dowe, "The Turing Test", The Stanford Encyclopedia of Philosophy (Winter 2005 Edition), Edward N.
Zalta (ed.), http://plato.stanford.edu/archives/win2005/entries/turing-test 37 Kurzweil, R., The Age of Spiritual Machines, (Penguin Group, 1999).