Tableof!Contents! · 2012-02-22 · Tableof!Contents! CreateaSite!.....!2! CustomizeyourSite!.....!5!
Urban Big Data: City Management and Real Estate Markets
Richard Barkham CBRE
Sheharyar Bokhari
Albert Saiz Urban Economics Lab
MIT Center for Real Estate and DUSP
(With a foreword from Chandra Dhandapani, Chief Digital & Technology Officer at CBRE)
2
Urban Big Data: City Management and Real Estate Markets
January 2018
ABSTRACT In this report, we discuss recent trends in the application of urban big data and their impact on real estate markets. We expect such technologies to improve quality of life and the productivity of cities over the long run. We forecast that smart city technologies will reinforce the primacy of the most successful global metropolises at least for a decade or more. A few select metropolises in emerging countries may also leverage these technologies to leapfrog on the provision of local public services. In the long run, all cities throughout the urban system will end up adopting successful and cost-‐effective smart city initiatives. Nevertheless, smaller-‐scale interventions are likely to crop up everywhere, even in the short run. Such targeted programs are more likely to improve conditions in blighted or relatively deprived neighborhoods, which could generate gentrification and higher valuations there. It is unclear whether urban information systems will have a centralizing or suburbanizing impact. They are likely to make denser urban centers more attractive, but they are also bound to make suburban or exurban locations more accessible.
3
Table of Contents
Foreword . . . . . . . . . . . . . . . . . . . . . . . . . . . . . . . . . . . . . . . . . . . . . . . . . . . . . . . . . . . . . . . . . . . . . . . . . . . . . . . . . . . . . . . . . . . . . . . . . . . . . . 4
Introduction . . . . . . . . . . . . . . . . . . . . . . . . . . . . . . . . . . . . . . . . . . . . . . . . . . . . . . . . . . . . . . . . . . . . . . . . . . . . . . . . . . . . . . . . . . . . . . . . . . 5
What Is Big Data? . . . . . . . . . . . . . . . . . . . . . . . . . . . . . . . . . . . . . . . . . . . . . . . . . . . . . . . . . . . . . . . . . . . . . . . . . . . . . . . . . . . . . . . . . . 5
City Data and Urban Eff iciency: Economic Impacts . . . . . . . . . . . . . . . . . . . . . . . . . . . . . . . . . . . . . . . . . . . 6
1. Big Data and City Management: The Present . . . . . . . . . . . . . . . . . . . . . . . . . . . . . . . . . . . . . . . . . . . . 10
1.1. City Innovation -‐Teams (I-‐Teams): Boston Mayor’s Office of New Urban Mechanics (MONUM) . . . . . . . . . . . . . . . . . . . . . . . . . . . . . . . . . . . . . . . . . . . . . . . . . . . . . . . . . . . . . . . . . . . . . . . . . . . . . . . . . . . 15
1.2. Planned “Smart” Cit ies: Korea’s Songdo International Business District . . . 16
1.3. Analyzing People Behavior: Andorra . . . . . . . . . . . . . . . . . . . . . . . . . . . . . . . . . . . . . . . . . . . . . . . . . . . . . . 18
1.4. Transportation: Nairobi, Kenya . . . . . . . . . . . . . . . . . . . . . . . . . . . . . . . . . . . . . . . . . . . . . . . . . . . . . . . . . . . . . 18
1.5. Real Estate Technology: BuildZoom .. . . . . . . . . . . . . . . . . . . . . . . . . . . . . . . . . . . . . . . . . . . . . . . . . . . . . . 19
2. Big Data and City Management: Sources of Data . . . . . . . . . . . . . . . . . . . . . . . . . . . . . . . . . . . . . . . 20
2.1. Administrative . . . . . . . . . . . . . . . . . . . . . . . . . . . . . . . . . . . . . . . . . . . . . . . . . . . . . . . . . . . . . . . . . . . . . . . . . . . . . . . . . . . . . 21
2.2. Sensors . . . . . . . . . . . . . . . . . . . . . . . . . . . . . . . . . . . . . . . . . . . . . . . . . . . . . . . . . . . . . . . . . . . . . . . . . . . . . . . . . . . . . . . . . . . . . . . 22
2.3. Apps . . . . . . . . . . . . . . . . . . . . . . . . . . . . . . . . . . . . . . . . . . . . . . . . . . . . . . . . . . . . . . . . . . . . . . . . . . . . . . . . . . . . . . . . . . . . . . . . . . . 22
2.4. Crowdsourcing . . . . . . . . . . . . . . . . . . . . . . . . . . . . . . . . . . . . . . . . . . . . . . . . . . . . . . . . . . . . . . . . . . . . . . . . . . . . . . . . . . . . . 23
2.5. Remote Image, GIS and User Behavior . . . . . . . . . . . . . . . . . . . . . . . . . . . . . . . . . . . . . . . . . . . . . . . . . . . 24
3. Challenges and Issues . . . . . . . . . . . . . . . . . . . . . . . . . . . . . . . . . . . . . . . . . . . . . . . . . . . . . . . . . . . . . . . . . . . . . . . . . . . . . 25
3.1. Open Data: Use and Usabil ity . . . . . . . . . . . . . . . . . . . . . . . . . . . . . . . . . . . . . . . . . . . . . . . . . . . . . . . . . . . . . . . . 25
3.2. Privacy . . . . . . . . . . . . . . . . . . . . . . . . . . . . . . . . . . . . . . . . . . . . . . . . . . . . . . . . . . . . . . . . . . . . . . . . . . . . . . . . . . . . . . . . . . . . . . . . 25
3.3. Technology and Human Capital Constraints . . . . . . . . . . . . . . . . . . . . . . . . . . . . . . . . . . . . . . . . . . . . 26
3.4. Solutions in Search of a Problem .. . . . . . . . . . . . . . . . . . . . . . . . . . . . . . . . . . . . . . . . . . . . . . . . . . . . . . . . . . 27
4. The Future: Impact of Big Data and Further Opportunities . . . . . . . . . . . . . . . . . . . . . . . . 27
4.1. Impact on Cities and Real Estate Values . . . . . . . . . . . . . . . . . . . . . . . . . . . . . . . . . . . . . . . . . . . . . . . . . 27
4.2. Examples of Further Opportunities . . . . . . . . . . . . . . . . . . . . . . . . . . . . . . . . . . . . . . . . . . . . . . . . . . . . . . . . 30 4.2.1. Leases: The Other Half of Property Transactions ......................................................................... 30 4.2.2. Urban Travel Patterns: What to Do Without Census Data? ......................................................... 31 4.2.3. Tracking Urban Land Use – Concatenating Local Property Tax Parcel Data ................................. 31
Acknowledgements . . . . . . . . . . . . . . . . . . . . . . . . . . . . . . . . . . . . . . . . . . . . . . . . . . . . . . . . . . . . . . . . . . . . . . . . . . . . . . . . . . . . . . 34
Endnotes . . . . . . . . . . . . . . . . . . . . . . . . . . . . . . . . . . . . . . . . . . . . . . . . . . . . . . . . . . . . . . . . . . . . . . . . . . . . . . . . . . . . . . . . . . . . . . . . . . . . . 35
4
Foreword As recent as two decades ago, only large enterprises and governments could have access to massive computing power through super computers and mainframes. The price of technologies in general, and storage in particular has continued to drop. As we have moved from the days of 1 MB floppy disks to unlimited cloud storage, barriers to innovation continue to collapse. In this thought-‐provoking paper, the authors tee up very important questions about the evolution of data analysis and future of the urban/suburban/exurban phenomena that we have become accustomed to. The chicken or egg question is whether the urban centers of today will drive innovation in smart city technologies or whether innovation in smart city technologies will shape the successful urban centers of tomorrow. The simple equation on spatial equilibrium in this paper very much resonated with me and one can see this equation lead to reinforcing cycles over time. This paper provides several examples of big data applications in cities around the world, and the anticipated impact on real estate values. These examples provide just a glimpse into the endless creativity of the human mind. As in previous cycles of innovation in human history, we are at the very early stages of uncovering the full potential of big data. The impact of various smart city technologies is currently easier to fathom from a qualitative perspective versus a clear quantitative ROI – i.e. the value of big data versus the cost of gathering, connecting and deriving value from the data. Our views on data privacy as a society will also continue to evolve. In spite of several unknowns, we live in a very interesting phase of the information age with simultaneous confluence of multiple dimensions in technological advancement – proliferation of big data with billions of IOT devices, technology companies rushing to democratize machine learning and AI, and rapidly growing applications with augmented reality and blockchain. These advancements are taking place on a well-‐established foundation of ‘social, mobile and cloud’ -‐ which by the way seems so yesterday already! All I can say is this is a transformational, and tremendously enjoyable time to be in commercial real estate and technology. I believe this report begins to explain why that is!
Chandra Dhandapani Chief Digital & Technology Officer | CBRE
5
Introduction We are in a period of extraordinarily rapid technological change. A great many innovations will transform our cities and the ways we work, live, and move around. Electric autonomous vehicles (AV)—available on demand—will eventually move us all around town. Robots and globalization will keep on having impacts on local labor markets. Smart buildings may make our lives a bit better. Yet a very significant transformation does not entail any physical changes, but rather data collection and a better use of information. The power of data to improve the living conditions of urban dwellers was illustrated early on by the series of cholera epidemics in London in the mid-‐19th century. While the medical profession of that time was comfortable in the belief that cholera was transmitted by a mysterious “miasma,” Doctor John Snow was busy tenaciously collecting data about where each of the dying patients had lived. Using this data, he quickly realized that mortality from cholera was much higher in buildings that were supplied water from a source that was contaminated by fecal material from wastewater. Subsequent data collection efforts proved unambiguously that all persons falling ill to cholera had exposure to contaminated water sources. This pointed to the solutions: better pipe insulation for fresh water and more careful disposal of brown waters. And thus, future epidemics were avoided. Many more similar advances are now possible by the generalization of data collected by sensors, internet-‐enabled devices, and the computerization of administrative and business records. Some of the applications are still in the health sector: in New York city, asthma patient records are now analyzed to identify which buildings need to be retrofitted to minimize the presence of mold and dust mites. Yet the use of urban big data can improve our standard of urban life in many other arenas by creating more efficient transportation systems, reducing energy usage, identifying and addressing criminal activity, reducing government waste, better illuminating streets, and creating environments that adapt and respond to human needs in real time.
What Is Big Data? Big data is a buzzword that permeates much of the discussion surrounding the use of digital information in business and government. Surprisingly, there is little consensus on a conceptual definition of the term. Hence—before proceeding further—we provide some alternate perspectives on what constitutes big data. Perhaps the most academic definition of big data comes from describing its characteristics by the three V’s1 of big data management:
1. Volume: Big data is often characterized by their very large size, often in petabytes or more. “Simply put, big data is too big to sit on your hard drive,” says Eric Scharnhorst, a data scientist at Redfin.2 Examples include user data on Facebook, flow of people through a transport system, or credit card transactions.
6
2. Velocity: Big data is often generated continuously, in or near real time. For example, Twitter posts, cell phone location, weather and air quality sensors.
3. Variety: Big data can be of any type, consisting of numbers, text, photos, videos, audio, and other kinds of data. Its analysis needs to be flexible enough to deal with any type or increasingly often a mix of these.
While this characterization may be useful in some contexts, the phenomenon of big data is recent enough that not all data examples will necessarily hold each of these characteristics. Furthermore, not all experts in the use of urban big data regard it in a similar vein. For example, Kent Larson of the MIT Media Lab thinks very broadly “of big data not in terms of a lot of data but complex data that can reveal patterns useful to understand, that aren’t evident without analyzing the data.”3 On the other hand, Jim Sempere of Real Capital Analytics—one of the main data providers in the US real estate industry—emphasizes, “… Big data as a variety of data, put together from various sources to come together in a meaningful way.” 4 And Fabio Duarte of MIT’s Senseable City Lab provides yet another perspective by regarding big data as “… any human activity that leaves digital traces, which does not have an immediate meaning, but when combined together gives some meaningful pattern.”5 While scale, variety, and frequency are oftentimes necessary for good applications, the three experts’ views above do coincide in two critical main characteristics: big data requires collection and analytical efforts, and must be socially useful.
City Data and Urban Efficiency: Economic Impacts Urban big data is still in its early stages, but what will be clear from the investigation in this report is that there is already a consolidated global movement around this phenomenon. Oftentimes, observers use the term “smart city” to encompass the places and initiatives that embrace the use of computerized information and analytics to improve municipal and building operations. Of course, it will take a while for urban data systems to be widely adopted in all their potential applications. Nonetheless, we are certain to eventually see urban analytics play an important role in many metropolises around the world. The extent and shape of the implementation of smart-‐city initiatives will have impacts on land use patterns, real estate markets, and the quality of life. It is therefore imperative for practitioners in the real estate industry to anticipate their effects, in order to take advantage of new opportunities, or simply to take corrective action to avoid disruption of established business practices. There are many angles to such “horizon scanning.” One of them focuses on the relative advantages of cities that adopt smart city technologies compared to other areas that do not. Economists have long formulated research on cities in terms of spatial equilibrium. A city is in spatial equilibrium at the point where there is no payoff for people to move in or out. The vast majority are doing fine where they are. Those who are not—and who might want to move on—would not be better off by leaving either, due to a lack of better opportunities elsewhere. Of

7
course, a highly mobile society always has people hopping across locales. In equilibrium, most of these moves cancel out so that net migration flows are smaller than gross movements. Where mobility does take place in thriving societies, it tends to follow opportunity in ways that are predictable. A wealth of evidence demonstrates that population growth tends to follow wage growth and—increasingly—the availability of amenities. But if the more successful cities tend to attract people, why don’t we see most of the population clustering in a just a few metropolitan areas? The answer partially resides in the role of the housing market. As cities grow larger, they also tend to become more expensive. When a city is somewhere close to its equilibrium, housing price inflation will exactly compensate for the gains in productivity, which gives rise to higher wages, so that there is no general advantage for even more people to move into more attractive places such as London, New York, Barcelona, or Boston. In practical terms, this means that if wages and the quality of life in urban areas are much higher than wages in non-‐urban areas, we expect higher urban rents for real estate as offsetting this urban wage premium. Glaeser, Kolko and Saiz6 formulate a simple equation to capture this concept of a spatial equilibrium:
Productivity Premium + Amenity Premium = Rent Premium This equation simply states that the effect of local wages and availability of good jobs (productivity premium) plus the local effect of quality of life (amenity premium) must be offset by local real estate values or rents (rent premium). This equation is not simply a theoretical identity, as it has been validated in many cities over many periods. It provides a good framework for forecasting the evolution of local real estate markets and for exploring the impact of current trends, such as the application of big data techniques to the management of cities. As an example, consider a case in which city wages are growing but housing costs are booming even faster. We can infer that the quality of life in the city has risen faster than the rise in productivity. This is exactly the case in a number of global gateway cities for at least the past twenty years. Productivity and wages have grown, but amenities have also grown, possibly faster. As a result, the global gateways have become very expensive places in which to live.
Higher Wages
Beper Ameniqes
Higher Rent per sqr
Job Availability
8
The productivity premium, which drives wages, comes mainly from two sources.7 One of them is the existence of agglomeration economies. These are efficiency gains in production that arise from having firms locate close to each other. More saliently, the clustering of firms by sector allows for flexible supply chains and reduces the transportation costs of inputs in industrial production. In the services sector, physical proximity facilitates face-‐to-‐face communication of high-‐level information and allows parties involved in complex transactions to develop trust. Parallel to physical input-‐output relationships between industrial plants, proximity between service firms allows for the presence of specialist sub-‐contractors and for fast reaction times from service providers. Agglomeration economies also arise with respect to attracting talent: if the best firms in a sector co-‐locate in a city, that city becomes a beacon for highly skilled workers, which in turn makes it yet more productive for more firms to locate there. Similar arguments can be made about the access to support networks for new firms, such as computer coding workshops or meet-‐and-‐greet cocktail parties. In parallel, firms can also be more productive in places where they have better access to ideas, technology, and skilled workers. These ideas range from changes in industrial techniques or product types to the most up-‐to-‐the-‐minute news about prices. This information is often transmitted by workers as they change firms and in social settings, like after-‐work happy hours. The amenity premium can arise from the provision of four types of amenities.8 First, an important amenity is the presence of a rich variety of services and consumer goods. A second amenity is aesthetics: physical attributes of a community that make life more pleasant appear to be increasingly valued by consumers. A third amenity is good public services, which include good schools, better public utilities and less crime, and cultural opportunities. The fourth amenity is the speed or ease with which individuals can move around in a city. As people become wealthier, they value their time more, in the sense that they are willing to pay higher amounts for more expeditious services, or they are willing to pay higher rents to live in locations closer to their jobs. The framework outlined above suggests that wherever big data efforts enable greater productivity gains and/or help cities provide better amenities, those gains and amenities will be associated with local real estate value appreciation. Urban data analytics certainly have the potential to improve the provision of urban amenities. Alternatively, they could maintain current municipal service levels at relatively low cost. If new IT systems and methods are successful in this latter regard, they could stem the secular “cost disease” of public services: their productivity has historically grown more slowly than in other sectors, rendering them relatively more expensive. Urban information systems could also help cities organize urban functions so that negative externalities are reduced. Negative externalities are instances where the behavior of some individuals has detrimental impact on the welfare of others. Negative externalities destroy amenities locally and at the city level. For instance, by using sensors to monitor noise levels in the street and software to contact municipal police whenever some pre-‐established thresholds are crossed, such nuisances could be swiftly remediated. Similarly, positive externalities—
9
where individual behavior has positive spillovers onto others—can be encouraged. For instance, crowdsourcing platforms can allow citizens to report problems—as in the Boston-‐based app allowing citizens to report the geolocation of potholes—thereby providing free monitoring services to all neighbors. Finally, the application of big data may increase the productivity of private firms in the city and generate new business opportunities for them. For instance, when app developers and corporate IT departments gain access to large quantities of data, they can develop new software and build better customer predictive analytics platforms. This discussion suggests that, either by providing productive value or by improving the local quality of life, the use of big data has the potential to increase urban residential and office demand, and therefore support local real estate valuations in the cities in which it is deployed. Yet, some substantive questions remain: 1. How much value? While urban IT systems can improve our quality of life and reduce
economic costs, the real issue is by how much. An additional matter pertains to real estate supply. In some markets, an increase in urban demand is easily accommodated by local markets via new real estate development. In these markets, real estate is essentially commoditized, and one would not expect pricing to deviate much from construction costs plus an adequate markup to account for development risk. In markets with high barriers to entry, improvements in the attractiveness of the city conversely translate quickly into more expensive land values.
2. Where? Real estate value emanates from differences in productivity across locales.
Technological change that has a broad impact everywhere—e.g., the smartphone—will not be captured by differential growth in property prices. It is therefore important to forecast how much heterogeneity we will see in the adoption of big data strategies across cities. Will there be winners and losers? How fast will innovations spread around? Will the implementation of such technologies allow cities that now lag in public services to leapfrog more advanced ones? Conversely, will most advanced cities be faster in adopting the techniques, therefore widening inequalities?
3. A last important issue regarding smart city technologies revolves around their impact
within metro areas. Will such technologies have re-‐centralizing effects, making core central cities more competitive? For instance, motion sensors may be cost-‐effective in denser urban settings but not on suburban roads. Alternatively, will such technologies favor leapfrogging in the provision of urban services by suburbs or edge cities? Even within central cities, technologies could have a disparate effect by allowing neighborhoods with social problems to catch up on the provision of services, such as safety and beautification.
In this report, we describe some of the new projects and technologies, and briefly explore the ultimate impact of urban IT systems in real estate markets. The paper is organized as follows. In
10
Chapter 1, we focus on the details of ongoing projects, the sampling of which emphasizes the variety of big data efforts that are taking shape. We discuss some of the common sources of urban big data and several examples of their use in cities. Chapter 2 discusses the main sources of data for the urban predictive analytics that we see arising. In Chapter 3, we turn to the discussion of the challenges and issues facing cities in implementing big data strategies, and point out some areas that are seeing improvement. Finally, in Chapter 4, we discuss the implications of big data use on the future of cities and real estate and what efforts might be specifically beneficial for the real estate industry.
1. Big Data and City Management: The Present This section provides some detail on specific projects or phenomena pertaining to big data that are presently underway around the world. We focus on examples that may directly or indirectly increase productivity or efficiency of actors in a city. We also highlight cases where a city’s policy explicitly considers “placemaking,” an effort where people collectively reimagine and reinvent public spaces. Public investments in leisure spaces and beautification, either through improved amenities or removal of bad amenities such as blight, can spur demographic change, bring economic development and result in long-‐run appreciation (or prevent long-‐run decline) of real estate values. Table 1 below gives several quick examples of initiatives, their improvements to the city, and the potential effect on real estate values in the long run. We then turn to a few case studies to understand the perspective of the actors involved in the effort. The examples in Table 1 and later in the chapter illustrate the diversity of such endeavors, and the creative processes that big data is unleashing on municipal government management and operations. These examples fall into a number of categories. Some cities are focusing on issues related to private and public health: by measuring and identifying morbidity patterns, they are better able to provide preventive care and interventions (Cincinnati), mitigate lead issues and rodent infestations (Chicago), provide one-‐point-‐access health services (New York, Yinchuan), and improve behavioral health (Rhode Island). Other efforts focus on environmental concerns and the reduction of waste. Examples include reducing water waste and costs (Santa Clara), mitigating the impact of runoff water on streets and neighborhoods (Philadelphia), and reducing electricity costs from lighting by rationalizing its use (Buenos Aires, Kansas City). In another set of applications, budding big data is deployed to deal with issues of public safety and risk prevention, including improvements in the perception of these phenomena by citizens. These include monitoring activity on streets (Rio, Songdo) and using artificial intelligence to forecast and thwart future criminal activity (Seattle). Applications in transportation have also emerged, be it by using big data to facilitate planning (London), provide consumers with information about how to get around on public

11
transportation (Nairobi), and monitor for recurring traffic problems in order to mitigate them (Songdo, Andorra). Land use, property taxes, and registration also occupy a niche in smart city applications, including detection of vacant properties (Detroit), enforcement of codes (Washington, DC), and fair local property taxation (Spain).
12
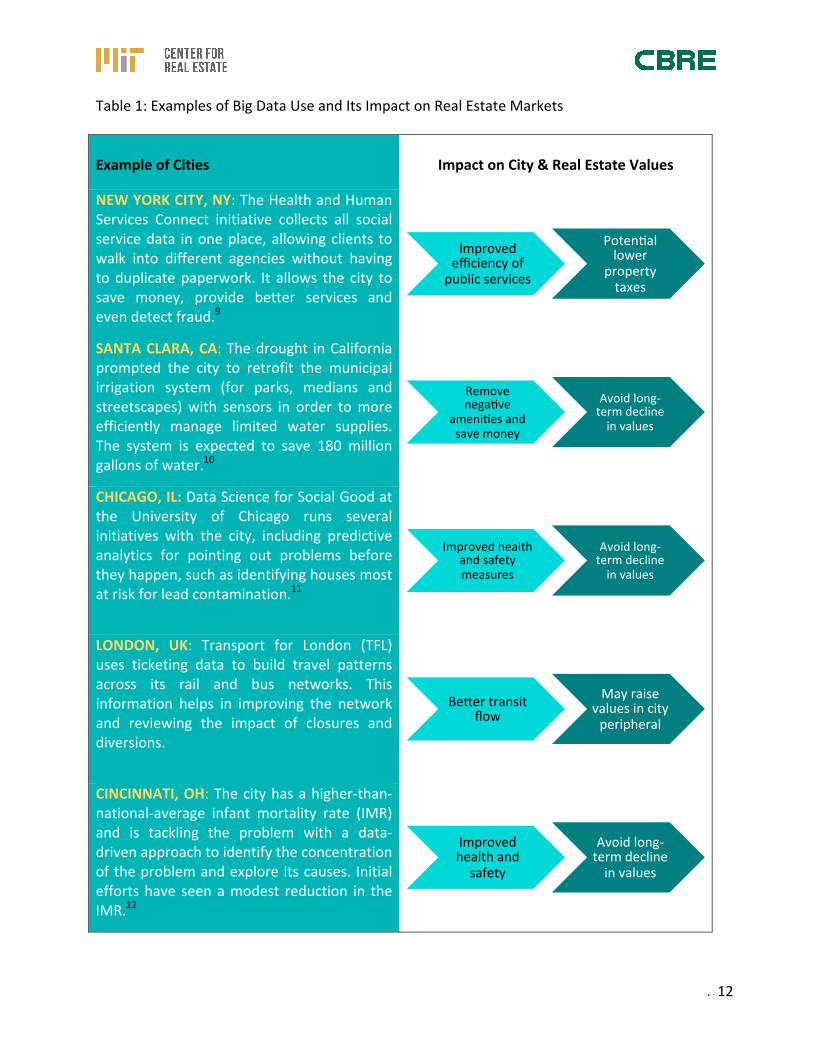
Table 1: Examples of Big Data Use and Its Impact on Real Estate Markets Example of Cities
Impact on City & Real Estate Values
NEW YORK CITY, NY: The Health and Human Services Connect initiative collects all social service data in one place, allowing clients to walk into different agencies without having to duplicate paperwork. It allows the city to save money, provide better services and even detect fraud.9
SANTA CLARA, CA: The drought in California prompted the city to retrofit the municipal irrigation system (for parks, medians and streetscapes) with sensors in order to more efficiently manage limited water supplies. The system is expected to save 180 million gallons of water.10
CHICAGO, IL: Data Science for Social Good at the University of Chicago runs several initiatives with the city, including predictive analytics for pointing out problems before they happen, such as identifying houses most at risk for lead contamination.11
LONDON, UK: Transport for London (TFL) uses ticketing data to build travel patterns across its rail and bus networks. This information helps in improving the network and reviewing the impact of closures and diversions.
CINCINNATI, OH: The city has a higher-‐than-‐national-‐average infant mortality rate (IMR) and is tackling the problem with a data-‐driven approach to identify the concentration of the problem and explore its causes. Initial efforts have seen a modest reduction in the IMR.12
Improved efficiency of public services
Potenqal lower
property taxes
Remove negaqve
ameniqes and save money
Avoid long-‐term decline in values
Improved health and safety measures
Avoid long-‐term decline in values
Beper transit flow
May raise values in city peripheral
Improved health and safety
Avoid long-‐term decline in values

13
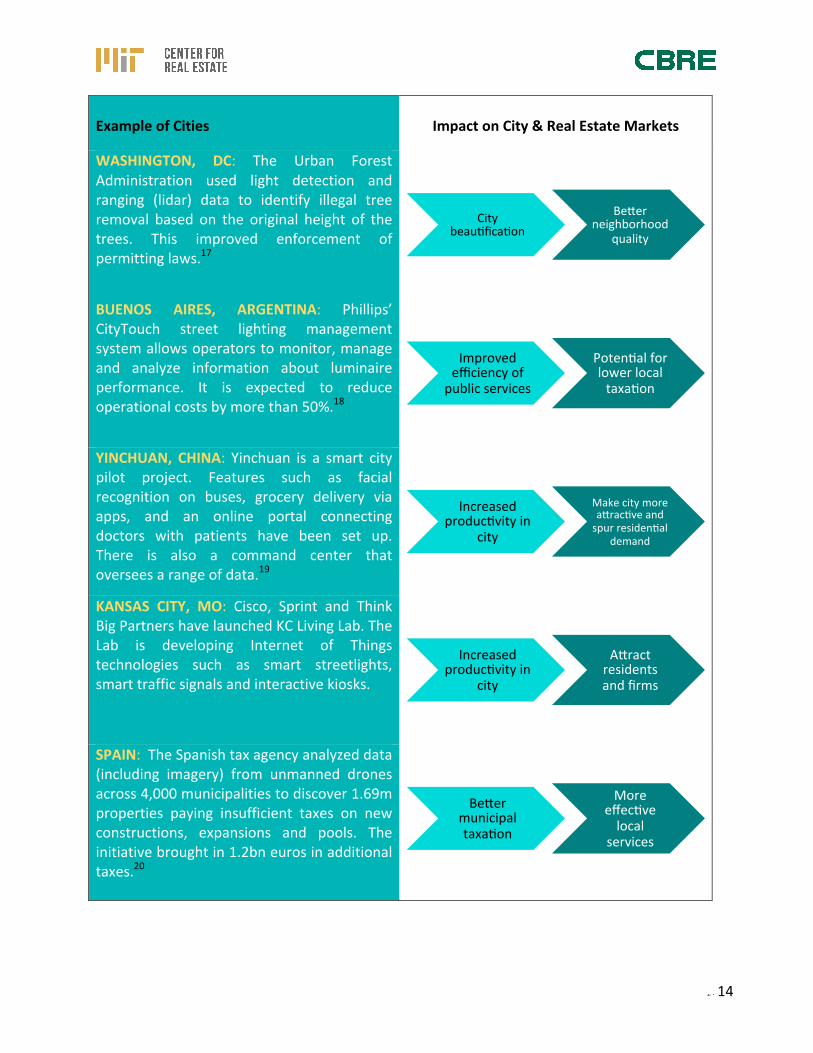
Example of Cities
Impact on City & Real Estate Markets
PROVIDENCE, RI: Two-‐thirds of the city’s children fall behind national benchmarks by kindergarten. The city provides low-‐income families with devices that measure the auditory environment of children and nudges parents/caregivers to increase the number of words the children are hearing.13
PHILADELPHIA, PA: Lacking a physical divide between storm water and the sewer system, the city implemented rain barrels and street trees to absorb rainfall. A profusion of sensors spread within the city’s sewer system provide the data to see if the approach is working.14
RIO DE JANEIRO, BRAZIL: IBM has designed the Operations Center of the city that integrates data from 30 different agencies. These provide valuable public services related to safety as well as early warning and evacuation system for Rio’s favelas.
SEATTLE, WA: The city implemented predictive policing software that uses historical data to predict potential crime locations. By focusing patrols in the high-‐risk areas, the software is expected to limit the need for additional officers on patrol and reduce the number of arrests.15
DETROIT, MI: The city has very high vacancy rates. Its Blight Removal Task Force surveyed the city’s properties, sending information wirelessly to an operations center. This has helped start a data-‐driven approach to identifying candidates for demolition and blight removal.16
Improved educaqon
Long-‐term posiqve
support of residenqal market
Remove negaqve ameniqes
Avoid long-‐term decline in values
Improved public services and safety net
Long-‐term posiqve impact
on poor neighborhoods
Less crime Avoid long-‐term decline in values
Remove negaqve
ameniqes at lower cost
Avoid long-‐term decline in values
14
Example of Cities
Impact on City & Real Estate Markets
WASHINGTON, DC: The Urban Forest Administration used light detection and ranging (lidar) data to identify illegal tree removal based on the original height of the trees. This improved enforcement of permitting laws.17
BUENOS AIRES, ARGENTINA: Phillips’ CityTouch street lighting management system allows operators to monitor, manage and analyze information about luminaire performance. It is expected to reduce operational costs by more than 50%.18
YINCHUAN, CHINA: Yinchuan is a smart city pilot project. Features such as facial recognition on buses, grocery delivery via apps, and an online portal connecting doctors with patients have been set up. There is also a command center that oversees a range of data.19
KANSAS CITY, MO: Cisco, Sprint and Think Big Partners have launched KC Living Lab. The Lab is developing Internet of Things technologies such as smart streetlights, smart traffic signals and interactive kiosks.
SPAIN: The Spanish tax agency analyzed data (including imagery) from unmanned drones across 4,000 municipalities to discover 1.69m properties paying insufficient taxes on new constructions, expansions and pools. The initiative brought in 1.2bn euros in additional taxes.20
City beauqficaqon
Beper neighborhood
quality
Improved efficiency of public services
Potenqal for lower local taxaqon
Increased producqvity in
city
Make city more apracqve and spur residenqal
demand
Increased producqvity in
city
Apract residents and firms
Beper municipal taxaqon
More effecqve local
services
15
1.1. City Innovation -‐Teams (I-‐Teams): Boston Mayor’s Office of New Urban Mechanics (MONUM)
City leaders have begun to recognize the need for better ways to generate ideas. All over the world, innovation teams (or i-‐teams) are being created to catalyze innovation. The Boston Mayor’s Office of New Urban Mechanics (MONUM) was among the earliest of its kind, launching in 2010. “By now, we are no longer unique. Pretty much every major city in the United States has some version of what we do,”21 says Director Nigel Jacobs. MONUM was initially created by public funding but since then has received significant private support as well. It serves as a good model for what cities are striving to do. Jacobs speaks of their effort as “we are always trying to track as closely as we can to the important items; the big, strategic issues.” The team is given freedom to be experimental and to collaborate with third parties, and it is structured to be flexible enough to adapt to new developments. Currently, MONUM’s work is divided across four major initiatives:
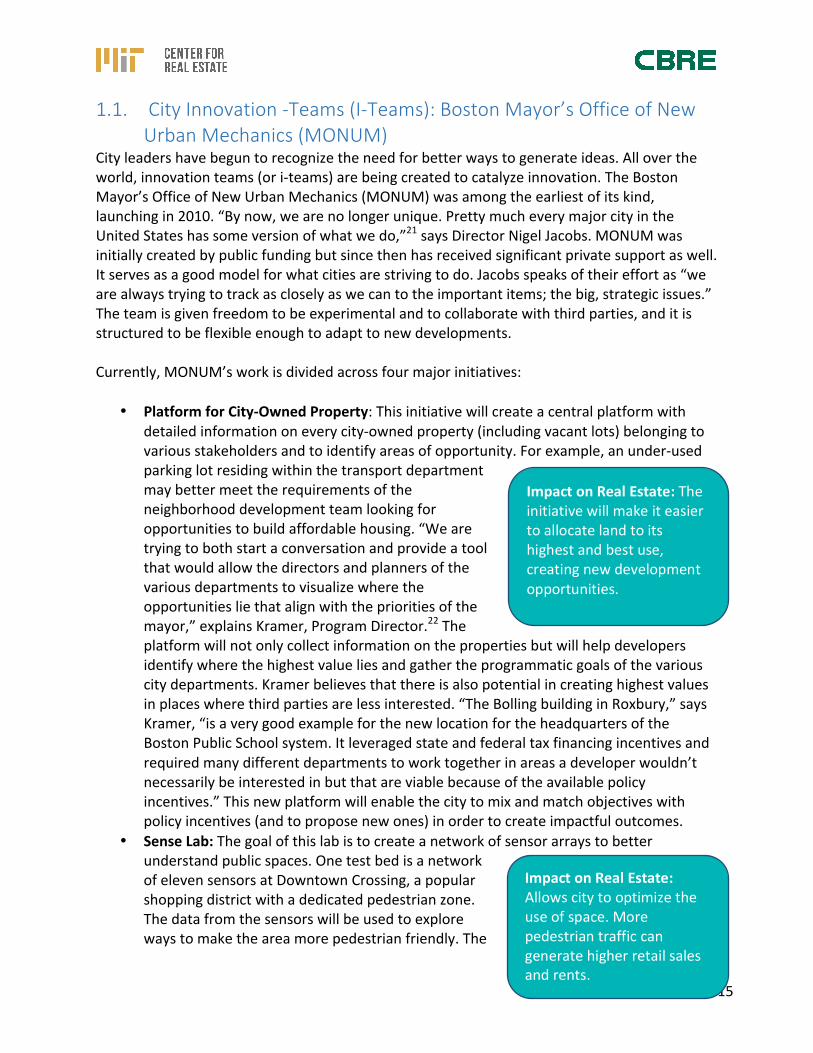
• Platform for City-‐Owned Property: This initiative will create a central platform with detailed information on every city-‐owned property (including vacant lots) belonging to various stakeholders and to identify areas of opportunity. For example, an under-‐used parking lot residing within the transport department may better meet the requirements of the neighborhood development team looking for opportunities to build affordable housing. “We are trying to both start a conversation and provide a tool that would allow the directors and planners of the various departments to visualize where the opportunities lie that align with the priorities of the mayor,” explains Kramer, Program Director.22 The platform will not only collect information on the properties but will help developers identify where the highest value lies and gather the programmatic goals of the various city departments. Kramer believes that there is also potential in creating highest values in places where third parties are less interested. “The Bolling building in Roxbury,” says Kramer, “is a very good example for the new location for the headquarters of the Boston Public School system. It leveraged state and federal tax financing incentives and required many different departments to work together in areas a developer wouldn’t necessarily be interested in but that are viable because of the available policy incentives.” This new platform will enable the city to mix and match objectives with policy incentives (and to propose new ones) in order to create impactful outcomes.
• Sense Lab: The goal of this lab is to create a network of sensor arrays to better understand public spaces. One test bed is a network of eleven sensors at Downtown Crossing, a popular shopping district with a dedicated pedestrian zone. The data from the sensors will be used to explore ways to make the area more pedestrian friendly. The
Impact on Real Estate: The initiative will make it easier to allocate land to its highest and best use, creating new development opportunities.
Impact on Real Estate: Allows city to optimize the use of space. More pedestrian traffic can generate higher retail sales and rents.

16
sensors record people counts, activity spots, environment quality and luminosity throughout the day. The lab is also correlating their data with various kinds of socioeconomic records in order to study larger design questions. “We hope to make a portable array of sensors that we can bring to neighborhoods around the city,”23 says Stephen Walter, program director, in speaking about making sensors more ubiquitous in the planning process.
• Third Spaces Lab: Third spaces are everything outside of the home and work, particularly public and social spaces where people interact, such as public parks, coffee shops, and even community gatherings in private spaces. The main goal of the Third Spaces Lab is to improve the quality of life of a neighborhood. It is exploring how government can support third spaces and aims to use its funding to create design prototypes to make these spaces more vibrant, equitable, and resilient over time. Program Director Susan Nyugen emphasizes that their initial focus is not on showing an economic benefit of investments in third spaces but rather on improving their quality of life, “We will be coupling the quantitative investment analysis of the space with the qualitative experiences of the space. We want to figure out how a quantitative investment can actually turn into a qualitative effect.”24
While these are the major current projects underway at MONUM, there have been several impactful projects in the past. We will return to discuss some of them further in later chapters.
1.2. Planned “Smart” Cities: Korea’s Songdo International Business District
Following Anthony Townsend’s broad definition, smart cities are “… places where information technology is combined with infrastructure, architecture, everyday objects, and even our bodies to address social, economic, and environmental problems.”25 Some major examples of master-‐planned smart cities are Konza Technology City in Kenya, Forrest City in Malaysia, Masdar City in Abu Dhabi, and Songdo City in Korea. In addition, both China and India have announced plans to build several smart cities. There are nearly 200 pilot projects of smart cities in China26 and the Indian government has announced plans to develop 100 smart cities.27 After 15 years of development since 2001, Korea’s Songdo International Business District (IBD) currently houses more than 45,000 residents and over 1,500 businesses.28 The project has been developed by Gale International with the support of the Incheon municipal government and is expected to be completed by 2018. The new city is part of the larger Incheon Free Economic Zone and is connected to the Korean mainland by bridges. It is strategically located close to the Incheon International Airport, which boasts 90-‐minute flights to Shanghai and Tokyo. According to Andrew Snowhite, senior vice president at Gale International, the master-‐developer
Impact on Real Estate: Make leisure places more attractive. Long-‐term positive effect on surrounding residential and retail values.
17
designed and built over 65 million square feet of buildings in the International Business District, with roughly 22 million square feet in LEED-‐certified buildings. In total, 40% of the land is devoted to green spaces, including a 101-‐acre central park with a self-‐sustaining irrigation system. Mr. Snowhite explains that initially, Incheon City built the infrastructure around Songdo and created a company called Incheon U-‐City Corporation to provide the technology overlay. It laid fiber optics in the ground and systems monitoring services throughout the city. A myriad of sensors has been placed throughout the city, from which data on environmental pollution, safety and security are analyzed and monitored from an operations center. The data collected allows for automatized service delivery (e.g., computers automatically calling the fire department upon sensors detecting fire). The bridges connected to mainland Korea host cameras that collect photos of license plates of every vehicle entering Songdo, allowing for automatic tolling, better traffic control, and security. Surveillance systems throughout the city have face recognition capabilities. While the potential for misuse of this technology is obvious, it could also be used to tailor specific services to each citizen (e.g., by opening specific doors on sight). We discuss the privacy concerns surrounding these measures in section 3.2. The city also has the world’s largest pneumatic waste disposal system, which bypasses the need for garbage collection. In order to create ubiquitous technology to improve people´s lives, Gale International, in collaboration with Cisco, created a company called U.Life Solutions to install building management systems, with security sensors, a grey water facility, and lighting sensors. “Each residential apartment has hardware on the wall that manages energy usage in order to reduce costs, controls electronics in the house, provides a CCTV with a view of the playground (to monitor children’s safety), and offers a Telepresence service that you can opt into to take classes (with a personal tutor) for sewing or learning English,” says Snowhite.29 Gale International estimates that the overall energy in Songdo IBD is up to 40% less per person than an average city due to better insulation, high-‐performance glass, and the high-‐tech equipment for lighting, heating and air-‐conditioning. It is unclear whether all the technological solutions in Songdo are cost-‐effective and broadly generalizable, or even desired by wide segments of the population. They certainly provide a maximalist example of what a connected city can be nowadays, and a real estate product that can appeal to the sensitivity of Korean consumers. Songdo can also be seen as a pioneering effort from which other smart cities will no doubt learn.
Impact on Real Estate: SMART technologies provide security measures, improve public service efficiency, and give residents services to make them more productive at work and at home. Apartments and office space could sell at a premium in the long run.
18
1.3. Analyzing People Behavior: Andorra Andorra is a small country between France and Spain with a tourism-‐focused economy. It is also the location of a unique collaboration between the MIT Media Lab, Andorra’s government and international companies such as GE. The goal of the collaboration is to apply data science methodologies to understanding the country’s dynamics on tourism, commerce, human mobility, transportation systems, and environmental impact, as well as to look for radical improvements in these areas. Kent Larson of the MIT Media Lab contrasts the approach of his team in Andorra with that of smart cities as “I think of it (big data) as two ends of a spectrum. One is the typical smart city’s use of it, which is more about optimization, improving the throughput of cars on the roadways and what not. And then there is the use of data to gain new insights on how the city functions and how to improve the fundamentals of the city.”30 Toward that effort, he describes the following projects underway:
• Tourist Recommendation System: This project integrates data from cell phones, social media, bank transactions, energy consumption and transportation to study the flow and behavior of people. The analysis generated from this big data platform is used to predict tourist behavior and routes in Andorra to develop a targeted tourist attraction recommendation system.
• Traffic Flow: Since Andorra has no airport or train service, most of the 8 million tourists
visiting the country arrive by car, making traffic management and car parking important challenges. Having cell phone data of the tourists and equipped with the knowledge of their mobility (how they move around the city, how long they stay, where they come from, etc.) and transportation data, a traffic prediction tool is being created to avoid congestion. There is also a pilot program for deploying autonomous vehicles for transporting tourists.31
One of the end-‐goals of the initiative is for Andorran authorities to have the capability to effectively use the data on their own. Later in Chapter 4, we discuss human capital constraints on cities, so it is important to underscore that this is a unique example of a participatory collaboration where expertise is handed over after the initial phase of development is complete.
1.4. Transportation: Nairobi, Kenya In many developing countries, the public transit system is “informal,” with basic information about schedules, routes and fares not readily available. The Kenyan capital of Nairobi has over 3.5 million people and many rely on the “matatus”—public service vehicles such as minibuses— to get around. These are owned by many private and poorly regulated businesses. Schedules
Impact on Real Estate: Routing tourists to increase expenditures can result in higher retail and hotel revenues.
Impact on Real Estate: Lower congestion means more tourists and potentially higher retail and hotel revenues
19
and ticket prices can change without any notice and a lot of insider knowledge is required to navigate the network in an efficient way. In an effort to address these shortcomings, a collaboration between the University of Nairobi, Columbia University, and MIT’s Civic Data Design Lab launched a project called Digital Matatus (or the digitization of the public transit system). To collect data, Kenyan students rode over 130 Matatus routes with smartphones in hand and a GIS unit that recorded data every couple of seconds.32 They carefully geo-‐located stops and collected key information about the route. “The data developed in this project was launched in Google Maps, making it the first informal transit in which Google has provided transit routing directions,” says Sarah Williams of MIT’s Civic Data Design Lab.33 Professor Williams and her colleagues also converted the data into a subway-‐style map that shows all the routes and main stops. The paper map and the transit data were released for free and have found use by riders, Kenyan officials, and app developers. While it was virtually impossible for many users to figure out combinations of two or three rides to reach to every point of the city, they can do so now. Many African cities consist of very expensive downtown cores, which are unaffordable to the middle class and migrants, and large —often informal—suburbs that extend for miles. By facilitating mobility and access to jobs, travel digital information technologies improve the lives of suburban dwellers. Improvements in their earning capacity can eventually allow them to build better homes in suburban location and raise neighborhood values. At the same time, increased accessibility and broader options may mute the affordability issues downtown. Thus, smart cities that have a positive impact on suburban transportation may contribute to a “flattening” of the real estate value curve within the city. Of course, if the improvements are large enough, this will be accompanied by even more migration into the city and a generic increase in land values in mega-‐cities.
1.5. Real Estate Technology: BuildZoom Irrespective of city, big data can help improve the efficiency of the real estate sector itself. BuildZoom is a real estate technology company that operates in the so-‐called home services market, remodeling jobs that typically require city permits and experienced contractors. BuildZoom makes use of big data analytics to match commercial or residential owner projects with appropriate contractors: those who specialize in the job at hand, are geographically close, and have high ratings from satisfied customers. The company is able to do that by collecting data from thousands of government sources to create comprehensive profiles for every single licensed contractor in the U.S. It is estimated that there are over 110 million building permits, over a million customer recommendations and 3.5 million state license records. BuildZoom is part of a much larger
Impact on Real Estate: A more efficient travel system can have positive influence on suburban development
Impact on Real Estate: Matching counterparties with big data analytics facilitates efficient allocation of resources; savings can accrue to homeowners with more options
20
technology trend where big data analytics is being used to bring more objectivity and transparency to decision-‐making, enhancing the matching process in the market for local contractors. BuildZoom also uses its data to provide intelligence about the pace of remodeling work in each major city of the U.S. For instance, a large contractor or do-‐it-‐yourself firm can now learn about the number of kitchen renovations in each city of the Chicago metropolitan are in the past month, thereby improving their marketing and provisioning strategies.
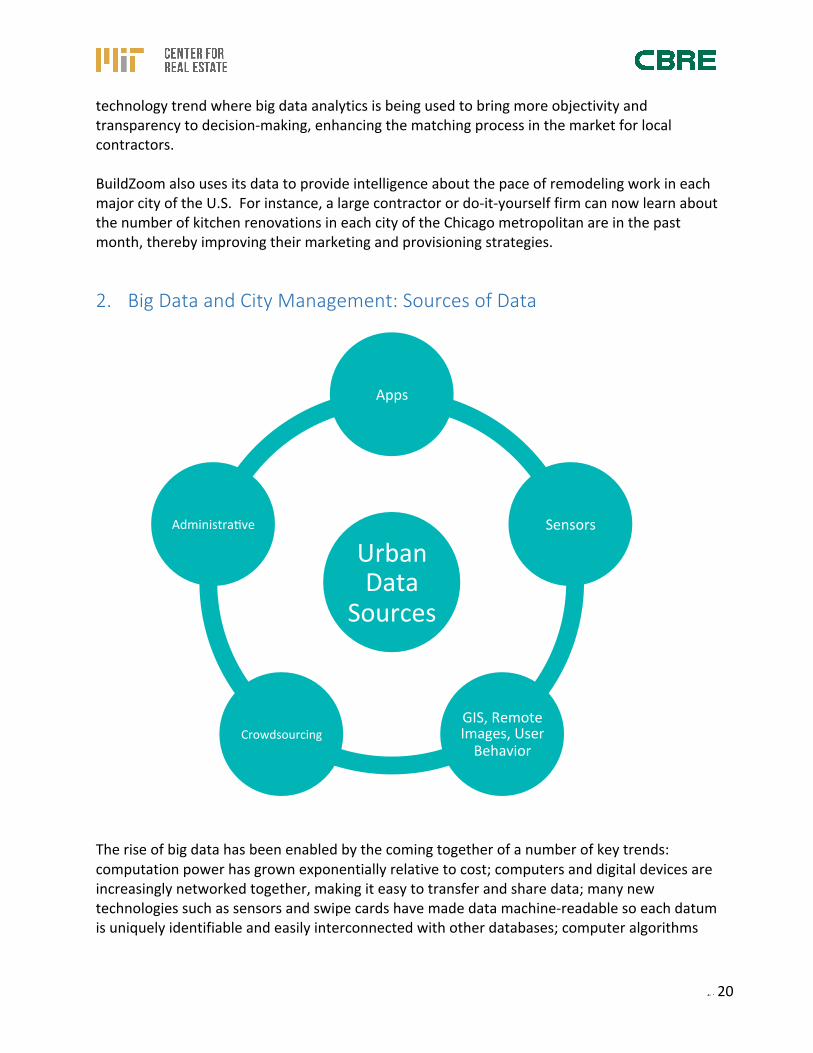
2. Big Data and City Management: Sources of Data
The rise of big data has been enabled by the coming together of a number of key trends: computation power has grown exponentially relative to cost; computers and digital devices are increasingly networked together, making it easy to transfer and share data; many new technologies such as sensors and swipe cards have made data machine-‐readable so each datum is uniquely identifiable and easily interconnected with other databases; computer algorithms
Urban Data
Sources
Apps
Sensors
GIS, Remote Images, User Behavior
Crowdsourcing
Administraqve
21
have exponentially improved with data and computer power; and finally, data storage has expanded and become considerably cheaper. Thus, a big data platform may store data from various sources such as sensors, apps, geographic information systems (GIS), images and videos, user behavior (e.g., social media) and crowdsourcing efforts, and makes them indexable so that different pieces of information can be queried together. The data collection may be in real time or at irregular intervals (such as monthly), with typical databases growing by several gigabytes or terabytes per frequency of collection. In this chapter, we illustrate the recent proliferation of urban data with examples from different sources, and suggest their possible impact on enabling improvements in the city and its real estate values. These examples are not meant to be exhaustive and we can expect that the creativity with which people tackle local problems will give rise to new ways of data generation in the future.
2.1. Administrative In an effort to improve transparency and accountability, several cities are moving toward a culture of open data. A common effort across several cities is the digitization and compilation of existing administrative data that may be spread across various city departments. For example, in New York City, the open data platform has an identifiable code for each building and each parcel. Each of these can in turn be linked with real estate transactions, leases, and capital expenditures along with a plethora of city-‐related information such as data from every city department, air pollution measurements from sensors, taxi and limousine trips from the buildings, public work orders and even the type of trees on the sidewalk, to name a few. This data can be used in a myriad of ways, from app development to monitoring of pollution and congestion to better identifying inefficiency in public provision. OpenGov, a startup in Palo Alto, is now working with over 100 local governments to develop city-‐manager dashboards incorporating real-‐time data from municipal operations and finances. Their open-‐data platform allows citizens to access the information. Furthermore, many cities are moving away from paper processes to online ones. The city of Cambridge, Massachusetts, now has an online voting platform for its residents to democratically allocate $700,000 to capital projects to improve the community. During the idea collection phase, ideas can be submitted via an interactive online map. The data is processed and the final list of projects for voting is once again shown on the interactive map for selection during the voting period. Such easy-‐to-‐use open-‐data portals that focus on citizen engagement, transparency, and accountability have the potential of saving cities money through more efficient operations, better communication, more competitive contracting, and lower risk of fraud or abuse.
Impact on Real Estate: Administrative data can reduce long-‐term operating costs and increase productivity across the city, having a long-‐run positive effect on values
22
2.2. Sensors Sensors are perhaps becoming the most well known form of collecting urban big data. They are placed in structures and buildings to measure a variety of input, ranging from light, temperature, and air quality to movement and speed of people in the area. BitScense, a startup company, has installed environmental sensors at Downtown Crossing in Boston to measure dust, oxygen and carbon dioxide levels, noise pollution, and even the number of people at a given distance from the sensor at any given time. Arianna Salazar, a co-‐founder of BitScense, says the city has allowed them their platform to come up with innovative ways to use this data. “Our partnership with the city is actually trying to solve the problem of providing data analytics.”34 BitScense will create a platform from which this data can be analyzed. Yet another firm partnering with cities is Phillips Lighting. Talmai Oliveria, a senior researcher at Phillips Research, says “light is ubiquitous and one of our goals is to leverage light to make lives better, to make streets safer and make light improvements to bring people together.”35 In Cambridge, Massachusetts, Phillip’s light and sound sensors at intersections are currently being tested to identify which intersections pose the greatest risk. The urban flow measured at these intersections will be fed into a dashboard that will control and experiment with directed lighting to understand how to help drivers see pedestrians and bikers more clearly. Lighting configurations helping traffic and pedestrian flows improve, and they can then be widely adopted. In New York City, fiber optic sensors monitor the cracks on the Brooklyn Bridge as well as other indicators such as temperature fluctuation. This information helps structural engineers determine when the vaults will ultimately need to be replaced. The Williamsburg Bridge also has sensors that provide continuous data to engineers on the century-‐old suspension cables. These systems help minimize costs associated with unnecessary inspections, and avoid under-‐maintenance, which could lead to very expensive emergency repairs or catastrophic events.
2.3. Apps Smartphone apps are also emerging as new big data conduits. Software on the iPhone and Android platforms is being deployed to both make use of existing information and collect or produce new intelligence. New uses for smartphones as tools that use data output from online sources are proliferating. With the advent of open transit data, there are now plenty of public transit apps in major cities that provide real-‐time information to riders. Once the data from the Digital Matatus project, discussed in section 1.4, was released in Nairobi, five high-‐quality mobile apps were immediately launched by the local tech community to serve the general public. Other examples
Impact on Real Estate: Sensors collect continuous data that can provide real-‐time information for monitoring safety measures, charting user behavior patterns and creating automated response systems; this raises overall productivity and the quality of local services
23
are provided by apps that map local crime rates using real-‐time data provided by local police reports. Smartphones also allow for users to consciously input data, or for applications to monitor their behavior. Internet connectivity then allows centralized databases to collect such data. In Boston, the Mayor’s Office of New Urban Mechanics created a crowdsourcing mobile app called Street Bump that helps residents improve their neighborhood streets by inputting road condition data while they drive. The data is collected and analyzed in real time to provide information to the city on locations that need to be further investigated by employees. Yet another app, Boston311, allows citizens to report city problems from mobile devices. It currently has over 50,000 users. A central system collects all the reports and then funnels them to the appropriate public works department. Several other cities, such as San Francisco, Chicago, New York, and Seattle, have similar apps. There is now a concerted effort to make apps more “civic.” In the aftermath of Hurricane Sandy, the Airbnb community came together to provide emergency housing. Airbnb now officially runs a Disaster Response Service to make it easier for its members to provide emergency accommodations in times of crises.36
2.4. Crowdsourcing Crowdsourcing is where a large number of people, often volunteers, produce data collectively on particular issues. One form of crowdsourcing is known as citizen science, where volunteers generate, prepare, and process observations and detailed measurements of some phenomenon. In a study by Gehl Architects,37 volunteers recorded the activity and flow of people in downtown Denver. A striking conclusion from the study was that the introduction of public art, such as a sculpture on the street, actually reduced public pedestrian traffic. Another conclusion was that expanding café patios all the way to the street increased public activity. By pinpointing the best initiatives to activate street life, such big data methods can increase pedestrian traffic and enhance the value of main street retail locations. A vibrant street scene is also a key element in the revitalization and redevelopment of residential neighborhoods. The Beijing Air Tracks project38 was a collaboration between the MIT Civic Media Lab and the Associated Press, where journalists attending the Beijing Olympics were armed with handheld aerosol-‐monitoring devices and a GPS unit. These tracked both air quality and the journalists’ geographical location as they moved throughout the city in their daily reporting. The images produced from a month’s worth of data were invaluable in understanding the larger patterns of regional pollution. The results provided an
Impact on Real Estate: Apps save time for city resi-‐dents as well as for workers; they can be a competitive advantage for the city
Impact on Real Estate: Crowdsourced data mobilizes citizens to generate information used to creatively address problems or to beautify the city; these can prevent long-‐term declines in values and generate local growth

24
independent confirmation of the poor air quality, while the local government was largely labeling it as simply fog, instead of smog. By providing transparency, such applications can pressure municipal governments into action to improve the quality of life of residents. In Boston, a project called Street Cred is being tested within the Boston311 app to engage citizens to perform certain tasks themselves instead of reporting them to the public works department. Research has shown that apps that involve citizen participation also promote civic-‐minded behavior and improve trust between the government and its constituents. By garnering the efforts and sweat equity of local residents, governments can produce better, more-‐targeted services at lower cost to taxpayers, and mitigate costly vandalism issues.
2.5. Remote Image, GIS and User Behavior Given the explosion in the number and variety of digital devices in use around the world, it is not surprising that they provide ways of interaction with each other that further create sophisticated datasets. The Atlas of Lighting39 is a joint project between Philips, the MIT Center for Advanced Urbanism, and the MIT Civic Data Design Lab that is looking at how lighting intensity varies by various types of socioeconomic conditions in the Chicago area. An interactive mapping tool brings together statistical data on demographics, intensity of urban development and nighttime light intensity using satellite imagery. The tool is integrated within Google Places and uses geo-‐tagged Instagram posts as proxy for human activity. It is also intended to be used as an engagement tool for the public and policymakers in the planning of business districts. The city of Louisville, Kentucky, has a large population suffering from breathing disorders. In order to address the problem, the city distributed 500 smart inhalers to asthmatic residents that recorded the time and place of when those devices were used. Louisville was one of the cities chosen in IBM’s smart cities challenge; thus, data analysts from IBM analyzed the data sent by the devices to create “heat maps” of asthma emergency attacks and suggested interventions such as SMART inhalers that let residents track where and when they are having a hard time breathing. The maps also facilitate avoidance behavior. It is estimated that asthma symptoms declined by 43%.40 User-‐generated data from social media such as Twitter and chip readers such as transit cards are now being used extensively in research on people’s behavior. As we learnt from the example of Andorra in section 1.3, these sources are increasingly becoming important in analyzing cities. For example, the city of Los Angeles mines text on its officials’ social media accounts to understand what its citizen are most concerned about, what topics are trending in public discourse, and how their public relations team should respond or prioritize their focus.
Impact on Real Estate: User-‐Behavior data obtained via social media or urban patterns studied via remote imagery and GIS potentially provide solutions to difficult urban problems and improve the quality of life, and could lead to local positive impact on residential values
25
3. Challenges and Issues It is not all progress toward a world of better information and greater efficiency. The wholesale collection of data, and the use of it, raises profound concerns about the nature of privacy. Not everyone is convinced of the benefits of big data-‐led policies either. This section discusses the range of issues facing the urban big data movement. In particular, we document the opposition to making the data public, privacy concerns, human capital and technology constraints, and the general skepticism about the efficacy of popular big data solutions to urban problems.
3.1. Open Data: Use and Usability The open data movement is based on the three principles of transparency, participation, and collaboration.41 While it is believed that through openness, sharing and working together, the value of data to society can be truly realized, the rapid opening of government data has not been universally welcomed. How open data projects become funded in the absence of clear revenue streams is a challenge facing many cities. Furthermore, “when resources are limited, data can become a commodity,”42 says Sarah Williams of MIT’s Civic Data Lab, referring to the unwillingness of city departments to share information. In many cases, taxes pay for the process of integrating and opening the data. In the U.S., Socrata, a third-‐party private company, is sometimes employed to create data platforms on behalf of municipal governments. However, there are still many open data websites that are simply file dumps. These unstructured sites do not follow any standard or even give any attention to the usability of the content. Part of the reason is that they have been built by enthusiasts during hackathons and data dives.43 In these cases, unfortunately, there is often no post-‐event follow up, maintenance, or further development. As a result, data use often drops quite markedly after an initial spark of interest. Implicit in the discussion on open data is the notion that data is neutral and that everyone has the potential to access and use it. This is not always the case. Not all citizens have either the skills to process and interpret open datasets nor the ability to voice their opinions about them. For example, the digitization of land records in Bangalore, India, exemplifies an open data project that was promoted as a “pro poor” initiative. However, in some cases, it ended up being put to use by upper income people and organizations to gain ownership of land from the poor by taking advantage of mistakes in documents and instructing land surveyors as well as lawyers to challenge titles.44 In this case, open data may have facilitated a change in land rights from the poor to the wealthy.
3.2. Privacy In much of the developed world, privacy is considered a basic human right and is protected by law. However, the concept of privacy is in flux. People’s behavior is constantly recorded in an increasingly greater number of ways: through social media, the Internet of Things, GPS, transaction records, credit cards, and more. As Talmai Oliveria, senior researcher at Phillips, puts it, “Privacy is relevant but we are at a transition point.”45
26
How privacy is dealt with in big data analysis varies from case to case. “There are always privacy issues…. We have to very carefully de-‐identify our data, but in a way that allows us to do what we want. We may want to know that someone from Barcelona bought shoes in Andorra for this amount and at this time, but not exactly the identity of the person or the shoe store,” explains MIT’s Kent Larson about the complications in using data that is sourced from multiple people and organizations.46 Andrew Snowhite of Gale International says that the South Korean government has placed strict regulations on the use of data collected from sensors, cameras, and face recognition software in Songdo. He says, “Data is kept for one month and then deleted.”47 Talmai Oliveria also says that at Phillips there are privacy and security checks on data at every stage, from acquisition and transfer to analytics and storage. In light of the ubiquitous nature of data collection, cities are beginning to think more broadly about how to lay guidelines around privacy. With regard to sensors in public spaces, Stephen Walter, program director at Boston’s Mayor’s Office of New Urban Mechanics, explains: “Right now, we have stickers on the street letting people know that there are sensors. But we are also developing a smart cities playbook to create a series of guidelines for everything, from vendors to public sitting out in the streets. What are your rights and privacy in public? What is the social contract there? You are giving something to us, some data, so what do you get in return? We are trying to think more clearly about what that looks like and we’re looking into creating a community advisory board that oversees the various sensor projects.”48 It is still early to fully predict how this new data commons might shape up.
3.3. Technology and Human Capital Constraints “Building a large, useful, machine-‐readable, and meaningful data portal is a non-‐trivial technical task,” writes Brett Goldstein, former chief data officer of Chicago’s Department of Innovation and Technology.49 While companies such as Socrata can provide cities with a ready-‐to-‐go platform, Goldstein asserts that cities need to go beyond that to make the platform sustainable without the role of a middleman. “Ninety percent of the data that goes onto data.cityofchicago.org arrives there automatically,” says Goldstein. In order to build an effective platform, cities need to be aware of their staff’s capabilities and have the available funding to make it happen. As Susan Nyugen of MONUM puts it, “You need to think about what kind of functions you need on the team to do this effectively.”50 In an effort to address technological and human constraints, Bloomberg Philanthropies’ What Works Cities initiative is developing customized approaches to help certain cities expand their use of data. A particular technological effort that ended in failure was an attempt to build a citywide wireless network in Philadelphia. It failed because Wi-‐Fi was never designed for large-‐scale, seamless outdoor networks. Partly as a result of that experience and also due to the lack of technical expertise, many cities today seek less risky ways, and a growing number are fishing for useful existing apps that use government data. Apps built around the public transit system are the most successful, making it possible to build viable businesses that leverage open government data. However, many apps built via contests are quickly abandoned. Anthony

27
Townsend writes that the problem with apps is that “they rely on programmers to define problems, instead of citizens or even government itself.”51 Nevertheless, app development contests have catalyzed a community of technologists inside and outside government trying to improve the lives of residents.
3.4. Solutions in Search of a Problem A major trend in urban big data is the presence of private corporations such as IBM, Cisco, Siemens, Intel, and Microsoft that have become active players in city management. This is either through being key partners in building new smart cities or partnering with established cities to retrofit their infrastructure with information and communications technology (ICT) and data solutions. While such companies might be fostering innovative and useful interventions, there are concerns about their foray into roles traditionally delivered by the city. “They do not spend enough time understanding the unique problems that a certain city has,”52 says Stephen Walter of MONUM. In working with sales teams from various corporations, Susan Nyugen of MONUM finds that “there is a quick jump to conclusion that the solution to every problem is a technology solution.” She believes that this “surface level understanding of big data is not going to produce any results that we as a team care about or we as a city care about.”53 Director Nigel Jacobs of MONUM, who is a computer scientist by training, says, “There is also the problem of government people not pushing back on these products. Data visualization is often used to obfuscate or give a very superficial level of understanding. It is eye candy, and what do you do with that? There is a need for government people to start asking how that visualization is going to connect to people’s lives.”54 Talmai Oliveria, senior researcher at Phillips, says in relation to the big data analysis he performs, “We understand that just putting a sensor will not solve any problem. That is why we sift through the data and try to find value to the end user; find proof that there is an impact on the city.”55 Oliveria points out that collaboration with the community is an essential part of this process.
4. The Future: Impact of Big Data and Further Opportunities In this section, we discuss the places that are leading the front on big data use and what we can expect in terms of its potential impact on different types of cities and on their real estate values. We conclude with a look ahead at some areas where big data collection can contribute to the real estate industry in general.
4.1. Impact on Cities and Real Estate Values Currently in the U.S., cities such as Boston, New York, New Orleans, Los Angeles, and Chicago are at the forefront of urban big data use. They have successfully overcome the financial, human and technological constraints in setting themselves up to make data-‐driven decisions. As mentioned in several of the examples in previous sections, they are able to mine user-‐
28
generated data via social media, apps, card readers, etc., and create integrated data platforms that allow them to better understand the issues facing their communities, and as a result, be more efficient and productive in providing public services. The main implications of the urban information systems revolutions will be an increase in the quality of local public services, and the potential to stem the secular cost disease affecting their provision. We are not quite there yet, because fully unleashing the power of data analytics will require better coordination across government agencies, standardization of data and software, and moving along the learning curve with regard to which applications are cost effective. Nevertheless, efficient data-‐driven approaches, sensors, and automated systems will no doubt become more prevalent. If we recall the framework introduced in the introduction of this report, the implication of big data use is that it could help adopting cities be more productive and raise their quality of life, thereby potentially increasing local real estate values. However, the value of real estate is local and relative. Therefore, we only expect large impacts inasmuch as such innovations are unevenly spread. There are reasons to believe that this will be so. A disproportionate number of the early adaptors are cities with a combination of forward-‐looking leadership, multicultural open-‐minded citizenry, an already active street life, and a high-‐tech worker base. Therefore, at least for some time, the local implementation of urban information systems to improve quality of life will probably become another force for heterogeneity in city attractiveness, likely reinforcing existing trends. “Consumer cities” that have higher concentrations of people in the “creative class”56 will likely be early adopters, making their urban environments even more attractive to the highly skilled workers on which they are coming to depend. Major super-‐star cities57 in which new real estate development encounters severe barriers to entry are likely to become yet-‐more-‐expensive, 24/7 public service locales: London, Barcelona, Boston, New York, Seattle, Portland, Tokyo, Dubai, San Francisco, Mumbai, Moscow, and others. However, in a number of smaller creative cities with elastic housing supply, implementing smart city concepts will be feasible without such steep price growth. In places such as Austin, Hyderabad, Tallinn (Estonia), Boise, and Provo, available local talent pools can be tapped to deploy IT and improve the local quality of life. While real estate valuations in these areas will grow, they may still remain competitive due to increased supply and substantial real estate development. Cities with relatively low levels of human capital may be behind this trend for some time. Of course, these technologies have the potential for urban laggards—such as some struggling post-‐industrial cities—to leapfrog in terms of quality of life. However, the instances where this happens may be relatively rare in the medium run, and confined to cities with strong leadership
29
and vision, enlightened local business communities, access to strong institutions of higher learning, or those receiving strong regional or national subsidies for this purpose. The potential for leapfrogging is greater in the developing world, although the challenges outlined in section 4 are greatly magnified in developing countries, especially when it comes to monetary and technological constraints. Therefore, we will see leapfrogging and the appearance of a number of leading smart cities in emerging countries, particularly those with the necessary educational, financial, and political assets. China is a likely exception because the urban system is still, to a large extent, impacted by central government decisions. Implementation there will probably come through a top-‐down process. We believe that big data collection also has the potential to provide firms with valuable information, business services, and opportunities for the development of local apps. The “low-‐hanging fruit” of urban big data still lies in the innumerable opportunities for the improvement of municipal services. We expect stronger synergies with firms outside of the IT sector to play an ever-‐larger part in urban productivity growth. The use of big data in smaller-‐scale placemaking efforts can have an impact on real estate valuations within cities. Most municipal governments will not have the capability to move toward full smart city concepts. Nevertheless, easy-‐to-‐implement local interventions will abound. As we have seen in some of the examples in this paper, such interventions tend to focus on improvements on relatively impoverished neighborhoods (health, crime, transportation). Therefore, it is possible that such efforts are associated with rent and price convergence, whereby marginalized neighborhoods are made more attractive. One last question relates to the impact of urban IT applications to suburbanization and sprawl. Interestingly, many “smart city” interventions focusing on quality of life and placemaking are likely to be more successful in densely urbanized areas. Sensors, lighting, traffic and pedestrian flows, accurate statistics, and crowdsourcing opinions may be too dispersed in the suburbs to justify the cost. These would seem to be a force toward densification and higher residential and retail rents in denser locations. However, urban IT systems geared toward improvements in transportation systems could have the opposite effect. By lowering transportation costs, they could assist with furthering decentralizing employment. Urban data systems could also improve the functioning of autonomous vehicles.58 In some of the examples in this paper, apps (such as carpooling, or those providing information about bus movements) and digital maps have had a positive impact on accessibility to job opportunities from remote locales. By leveling the playing field, these technologies could flatten the real estate value curve, making suburban locations relatively more attractive. Therefore, the ultimate impact of smart city technologies on the relative growth of suburban versus central real estate values depends on how they affect urban amenities and
30
transportation. Improvements in public service and amenities will tend to have a centralizing effect, whereas reductions in transportation costs should have a centripetal one.
4.2. Examples of Further Opportunities Several potential sources of big data exist today in forms that require seemingly small incremental investment to become useful to both public and private sector users. This section discusses three of these and the opportunities they present. They are meant as examples of a vast set of opportunities that urban big data opens up. We expect an explosion of creativity in the next decade, with hundreds of similar and better ideas emerging.
4.2.1. Leases: The Other Half of Property Transactions For the past several decades, large databases have evolved that track the sales transactions of properties, both residential and commercial. This big data source exists because of title laws and the corresponding requirements for property ownership registration. Concatenating data sources across local registries has contributed greatly to market transparency and efficiency. The same has not been true for lease transactions, either residential or commercial. As a consequence, leasing is far less transparent and much less understood than ownership. In large measure this is due to the fact that leases are simply private contracts between tenant and landlord, with no requirements to register or report them. With greater lease transparency, tenant and landlord could spend less time on rental negotiations, speeding up the process of relocation. New and innovative lease features could be more quickly assessed, analyzed and adopted to the benefit of both parties. An interesting issue pertains to the impact of open-‐source big data on market intermediation. For instance, assume that regulations allow for the appearance of a public repository of leases with standardized fields for each potential contractual contingency. Would this development facilitate parties to advertise and search for space, and sign contracts online thereafter without recourse to real estate brokers? We believe that the answer to this question is no. After all, the proliferation of online information about residential properties on platforms such as Zillow has hardly affected the brokerage model of housing sales. In fact—beyond their impact on city government—information technologies and big data are also transforming private business models in the real estate sector. But as disparate and incompatible applications proliferate, the need for standardization and consolidation grows. Furthermore, it is often the case that only a few players have the expertise and scale to collect and process data, or to create online exchanges. For instance, the company Costar Group has acquired a dominant market position in the listing of commercial properties for sale and lease via their online platform LoopNet. Albert Saiz and Arianna Salazar59 predict that “the proliferation of software packages aiding in—or even automating parts of—the development, construction, asset management, leasing, zoning, and underwriting services will keep apace. In due time, comprehensive online platforms will consolidate these applications, led by current major real estate service providers and, perhaps, a few entrants from the IT world.”

31
4.2.2. Urban Travel Patterns: What to Do Without Census Data?
For more than 40 years, U.S. transportation planning has relied on using the U.S. Census Long-‐Form (a 5% subsample) to identify home-‐workplace commuting patterns. With the abandonment of the Long Form (and substitution by the far smaller ACS survey), such commuting pattern data will no longer be available. Savings on transportation costs in terms of money and time is the main force behind the very need for urbanization. Firms and households make critical location decisions in part based on travel costs. Real estate rents and asset prices in core areas mostly capture a premium to pay in order to avoid high commuting and transportation costs further on. Providing and improving transportation infrastructure not only enables cities to operate better but also enhances productivity for the country as a whole. There has been some initial discussion about using cell phone records to provide information that can be used to estimate urban travel behavior and at much higher frequency than the decennial Census. Already, cell phone tracking allows providers such as Google to estimate travel speeds on most roads and surface transportation systems. When combined with knowledge of system capacity, travel flows can also be estimated—on each link of a system. Tracking the actual position of cell phones at, say, 5 a.m. and then 10 a.m. could be used to estimate home-‐workplace locations and hence (to a first-‐order approximation) an origin-‐destination matrix. This would allow firms to know where their potential workers live, or retailers to calculate catchment areas. The use of phone records would require using raw data that already exists. Of course, this must all be done with regard to the issues of openness and privacy discussed in the previous section.
4.2.3. Tracking Urban Land Use – Concatenating Local Property Tax Parcel Data In much of the developed world, an official and often very efficient system exists for appraising real property and collecting annual ad valorem taxes there upon: property taxation. This system is always operated at the local (city, town, municipal) level. In most cases, an automated database exists for the parcels or properties within a jurisdiction that contains considerable information about the property (e.g., land area, Floor-‐to-‐Area ratio, age). The problem is that there are hundreds and often thousands of jurisdictions within a country collecting this data. Even within the economic definition of a “city” (e.g., a metropolitan area) often there can be hundreds of legal jurisdictions independently operating property taxation. In many instances, higher-‐level state or national governments have imposed standardized requirements for these databases. What has yet to be accomplished is the concatenation of this data to provide a composite picture of land use at the metropolitan area level. By studying the timing and geography of recent land use changes, real estate entrepreneurs could identify the most promising areas for future development.
32
5. Conclusions
The big data revolution is radically affecting our daily lives. We buy products recommended by online programs, watch videos suggested by streaming services, listen to music proposed by computer algorithms, and drive our cars using directions beamed to our smartphones by map applications. Crowdsourced customer ratings help us avoid bad restaurants, hotels, and faulty consumer products. Data-‐driven statistical models swiftly underwrite our mortgages and consumer credit. Retailers use big data to stock their shops with the products we want and to offer us the discounts we require. While most of these innovations may not be reflected in the GDP, many of them are making our lives better. Governments are slowly catching up to these transformational technologies. As we have seen in this report, some of the most significant opportunities lie at the municipal level. Urban information technologies can make our cities “smart.” Data analysis and forecasts can improve outcomes in health, education, and planning. Sensors and programmed feedback loops can optimize the operations of traffic lights, street lamps, water systems, heating and A/C in municipal buildings, and public infrastructure. Opportunities are emerging to use information about citizen preferences to provide better services at lower cost. We are, however, at an incipient stage in the development of smart city technologies. Practitioners should thus be cautious about over-‐hyping and over-‐promoting “solutions” that do not solve problems in a cost-‐effective way. Nonetheless, the process of creative destruction over the current experimental stage will certainly bring us abundant feasible smart city technologies. We expect innovations that substantially reduce operating and capital costs to be the first widely adopted. Technologies with clear, immediate benefits in terms of quality of life will follow. Finally, technologies that improve quality of life and the productivity of cities over the long run will progressively expand as localized demonstration projects prove their benefits to outweigh costs. We forecast that smart city technologies will reinforce the primacy of the most successful global metropolises, at least for a decade or more. These cities have the IT know-‐how, human capital base, and experimental attitude required. Most of the time, they also have progressive leaderships. As such technologies come to full fruition, thereby improving quality of life and local productivity, these areas are better positioned to reap their full benefits. This means that real estate valuations in these areas will continue to grow robustly, especially so in those metropolitan areas with inelastic supply due to barriers to new development. A few select metropolises in emerging countries may also leverage these technologies to leapfrog on the provision of local public services. In the very long run, all cities throughout the urban system will end up adopting successful and cost-‐effective smart city initiatives, thereby diluting the first-‐mover advantage of the leaders. Nevertheless, smaller-‐scale interventions are likely to crop up everywhere, even in the short
33
run. These programs are more likely to improve conditions in blighted or relatively deprived neighborhoods, which could generate gentrification and higher valuations there. It is unclear whether urban information systems will have a centralizing or suburbanizing impact. They are likely to make denser urban centers more attractive, but they are also bound to make suburban or exurban locations more accessible. Policies and interventions based on urban big data will develop in a period of accelerating technological change. Real estate markets will be concurrently impacted by technological innovation: new materials and construction methods, transactional platforms, smart buildings, virtual reality, and new retail models.60 Automated vehicles will transform our transportation systems and have a deep imprint on the built environment. Likewise, increasing automation and use of IT systems will transform the ways in which we work and communicate. Environmental issues will come to the forefront. After the dust settles, we should hope to see smart city technologies making our cities cleaner, leaner, and more efficient, in time to improve the quality of life of an increasingly urban global population.

34
Acknowledgements We would like to thank Professor William Wheaton for his feedback on an earlier draft and his valuable contribution to the section on future opportunities. We also greatly appreciate the generosity of experts for discussing the examples, research and issues raised in this report. Finally, we’d like to thank CBRE for the idea of this report and their financial support for research assistance.
35
Endnotes 1 Kitchen, Rob (2014), The Data Revolution: Big Data, Open Data, Data Infrastructures and Their Consequences. Sage Publications: London. 2 Conversation with author, Oct. 17, 2016. 3 Conversation with author, Sept. 28, 2016. 4 Conversation with author, Nov. 14, 2016. 5 Conversation with author, Sept. 30, 2016. 6 Glaeser, E., Kolko, J. and A. Saiz, (2001), “Consumer City,” Journal of Economic Geography, pp. 27-‐50. 7 Ibid. 8 Ibid. 9 Goldsmith, S. and S. Crawford (2014), The Responsive City: Engaging Communities Through Data-‐Smart Governance, Jossey-‐Bass: San Francisco. 10 CityOS (Nov 2016), Case Study: Santa Clarita Reduces Water Usage by 20% with Smart Irrigation. (https://cityos.io/question/17658/Case-‐Study-‐Santa-‐Clarita-‐reduces-‐water-‐usage-‐by-‐20-‐with-‐smart-‐irrigation). 11 See more at https://dssg.uchicago.edu. 12 Kabak, V. (2014), Using Data to Combat Infant Mortality in Cincinnati, Article (http://datasmart.ash.harvard.edu/news/article/come-‐drought-‐or-‐high-‐water-‐728). 13 NPR Article (2013), Closing the `Word Gap’ Between Rich and Poor. (http://www.npr.org/2013/12/29/257922222/closing-‐the-‐word-‐gap-‐between-‐rich-‐and-‐poor). 14 Grohsgal, B.W. (2013), Low-‐Tech Solutions Meet Data Analytics in Philadelphia’s CSO Approach, Article (http://datasmart.ash.harvard.edu/news/article/low-‐tech-‐solutions-‐meet-‐data-‐analytics-‐in-‐philadelphias-‐cso-‐approach-‐250). 15 Casey, J. (2013), Seattle’s Predictive Policing Program, Article (http://datasmart.ash.harvard.edu/news/article/using-‐predictive-‐policing-‐to-‐reduce-‐crime-‐rate-‐189). 16 Froling, B. (2016), Detroit launches demolition tracker, Article (http://www.crainsdetroit.com/article/20160622/NEWS/160629916/detroit-‐launches-‐demolition-‐tracker). 17 Goldsmith, S. and S. Crawford (2014), The Responsive City: Engaging Communities Through Data-‐Smart Governance, Jossey-‐Bass: San Francisco. 18 See more at http://www.lighting.philips.com/main/cases/cases/road-‐and-‐street/citytouch-‐buenos-‐aires. 19 See also http://www.cnn.com/2016/10/10/asia/yinchuan-‐smart-‐city-‐future/. 21 Conversation with author, Nov. 2, 2016. 22 Conversation with author, Nov. 2, 2016. 23 Conversation with author, Nov. 2, 2016. 24 Conversation with author, Nov. 2, 2016.
36
25 Townsend, A. (2013) Smart Cities: Big Data, Civic Hackers, and the Quest for a New Utopia. W.W. Norton: New York. 26 Yongling, L., Yanliu L. and S. Geertman (2015), The development of smart cities in China. Working Paper, Computers in Urban Planning and Urban Management (Available Online at http://web.mit.edu/cron/project/CUPUM2015/proceedings/Content/pss/291_li_h.pdf). 27 Government of India (2015), Smart Cities: Mission Statement and Guidelines. Delhi: Ministry of Urban Development (http://smartcities.gov.in/writereaddata/smartcityguidelines.pdf). 28 Gale International’s Press Release (2016) http://www.prnewswire.com/news-‐releases/songdo-‐international-‐business-‐district-‐to-‐be-‐featured-‐at-‐greenbuild-‐2016-‐as-‐exemplar-‐of-‐sustainable-‐new-‐city-‐300338912.html. 29 Conversation with author, Oct. 11, 2016. 30 Conversation with author, Sept. 28, 2016. 31 Article, Ara Andorra (2016), Primers passos d’un vehicle autonomy per descongestionar zones de vianants (http://www.ara.ad/societat/Primers-‐vehicle-‐autonom-‐descongestionar-‐vianants_0_1656434541.html). 32 Williams, S., Waiganjo, P., Orwa D. and J. Klopp (2015), The Digital Matatu Project: Using Cell Phones to Create an Open Source Data for Nairobi’s Semi-‐Formal Bus System, Journal of Transport Geography, 49:39 – 51. 33 Conversation with author, Sept. 27, 2016. 34 Conversation with author, Oct. 14, 2016. 35 Conversation with author, Oct. 21, 2016. 36 See more at https://www.airbnb.com/disaster-‐response. 37 Gehl Architects (2015), Downtown Denver 16h St. Mall: Small Steps Towards Big Change. Report. 38 Williams, S. (2013), Beijing Air Tracks: Tracking Data for Good. in Accounting Technologies: Tools for Asking Hard Questions, Edited by Offenhuber, D., Schechtner, K., AMBRA, Austria: Vienna. 39 See more at http://civicdatadesignlab.org. 40 Eells, A. and S. Fletcher (2016), Understanding Collaborative Participation: “Asthampolis” in Louisville, Kentucky (http://participedia.net/en/cases/understanding-‐collaborative-‐participation-‐asthmapolis-‐louisville-‐kentucky). 41 See White House Directive https://www.whitehouse.gov/open/documents/open-‐government-‐directive. 42 Conversation with author, Sept. 27, 2016. 43 Townsend, A. (2013) Smart Cities: Big Data, Civic Hackers, and the Quest for a New Utopia. W.W. Norton: New York. 44 Gurstein, M. (2011), Open data: Empowered or effective data use for everyone? First Monday, 16 (2) 45 Conversation with author, Oct. 21, 2016. 46 Conversation with author, Sept. 28, 2016. 47 Conversation with author, Oct. 11, 2016. 48 Conversation with author, Nov. 2, 2016.

37
49 Goldstein, B. (2013), Open Data in Chicago: Game On, in Beyond Transparency, Edited by Goldstein B. and L. Dyson, Code for America Press: San Francisco. 50 Conversation with author, Nov. 2, 2016. 51 Townsend, A. (2013) Smart Cities: Big Data, Civic Hackers, and the Quest for a New Utopia. W.W. Norton: New York. 52 Conversation with author, Nov. 2, 2016. 53 Conversation with author, Nov. 2, 2016. 54 Conversation with author, Nov. 2, 2016. 55 Conversation with author, Oct. 21, 2016. 56 Florida, R. L. (2002). The rise of the creative class: And how it's transforming work, leisure, community and everyday life. New York, NY: Basic Books. 57 Gyourko, Joseph, Christopher Mayer, and Todd Sinai. 2013. "Superstar Cities." American Economic Journal: Economic Policy, 5(4): 167-‐99. 58 Saiz, Albert and Arianna Salazar (2017). “Real Trends: The Future of Real Estate in the United States.” Capital One Banking/Massachusetts Institute of Technology. 59 Ibid. 60 Idid.