Urban Computing with Taxicabs TMSG Cappuccino Oct. 12th, 2011.
45
Urban Computing with Taxicabs TMSG Cappuccino Oct. 12th, 2011
-
Upload
diana-ingledue -
Category
Documents
-
view
213 -
download
0
Transcript of Urban Computing with Taxicabs TMSG Cappuccino Oct. 12th, 2011.
Urban Computing with Taxicabs
TMSGCappuccino
Oct. 12th, 2011

About the Authors..
• Yu Zheng, Yanchi Liu, Jing Yuan, Xing Xie from M$RA
Yu Zheng• Ubicomp - Ubiquitious computing group• WSM - Web Search & Mining Group
Yu Zheng’s weibo : http://www.weibo.com/msyuzheng

About the Authors..
• Yu Zheng, Yanchi Liu, Jing Yuan, Xing Xie from M$RA
• Yanchi Liu, also from University of Science and Technology Beijing
• Paper published by ACM on Sept. 2011 ( ? )

Agenda
• About the authors(finished)• Introduction• Overview• Evaluation Settings• Evaluation Results• Related Works• Conclusion• Comments

Introduction
• GPS equips are generally used nowadays.• GPS-equipped taxicabs can be viewed as
ubiquitious mobile sensiors, gathering datas of traffic flows.

Introduction
• This paper’s goal is to detect the flawed and less effective urban planning in a city according to the GPS trojectories of taxicabs.
• Saying Beijing has 35 million personal trips per day created by various kinds of vehicles and that 1.44 million personal trips are generated by taxi. Thus, the percentage of taxi trips from total trips are 4.2%. The author believed 4.2% is a significant sample reflecting to urban traffic flow.

Overview
• Let’s introduce the variables one at a time..

Overview
Overview

Overview
• Consisted of two major components:Modeling citywide trafficDetecting flawed planning

Overview
• Disjoint regions usingmajor roads.

Overview
• Building region matrix: This process can be break down into 3 steps...
• 1. Temporal partition• Weekday/weekend• Rush hours/un-rush hours

Overview
• 1. Temporal partition

Overview
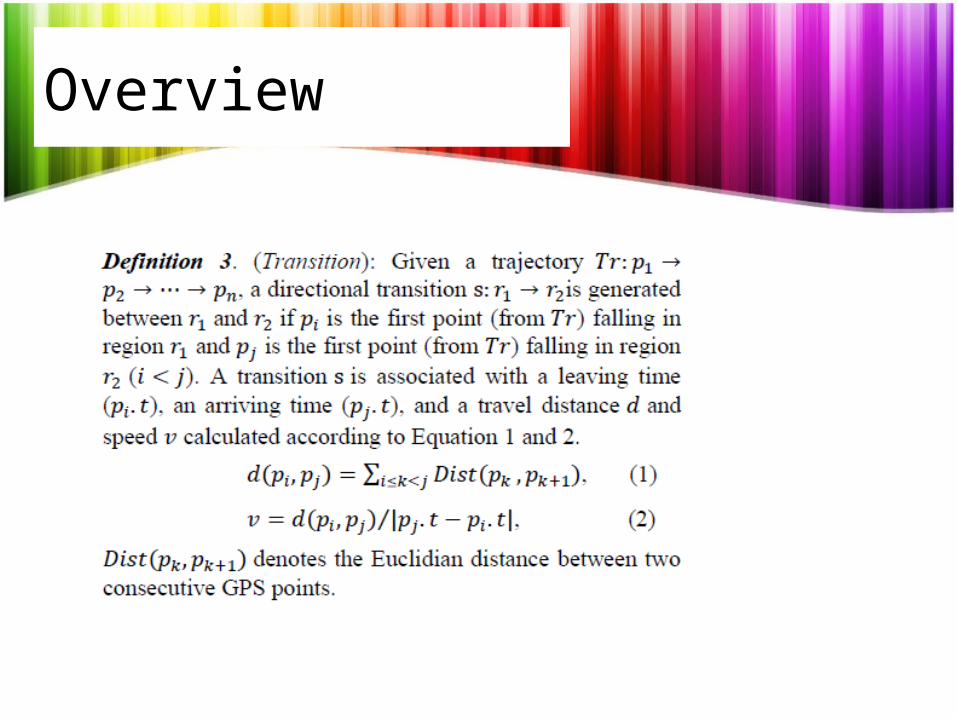
• 2. Transition construction• Pick out effective(occupied) taxi trajectories• Construct transitions between two regions
according to Def. 3

Overview
• 2. Transition construction• Note that a trajectory discontinuously
traversing two regions still formulate a transition between two regions.
Overview
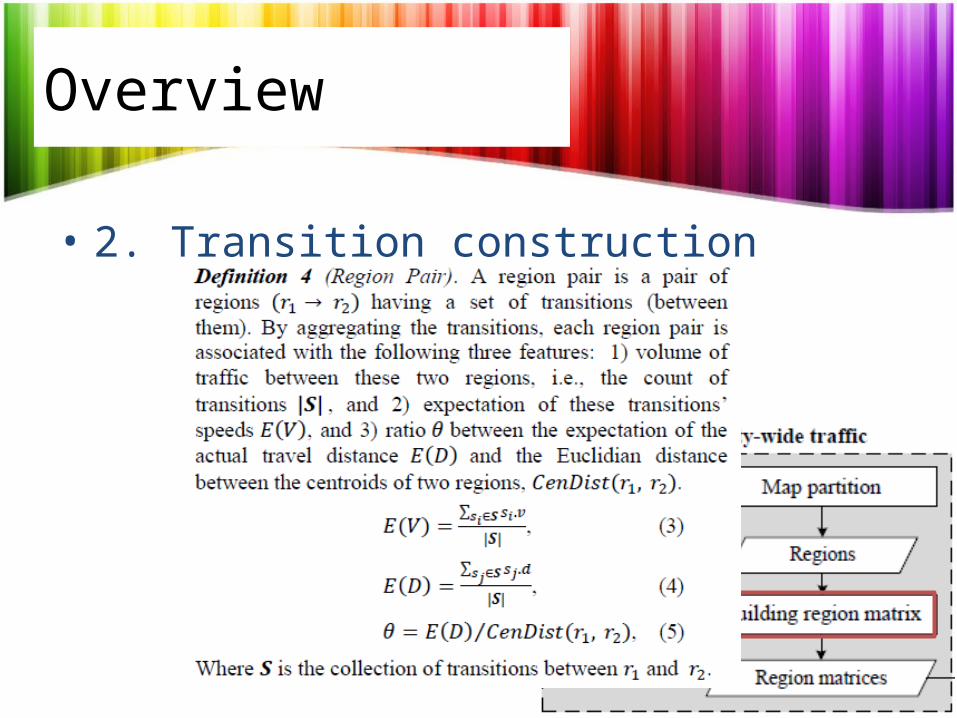
• 2. Transition construction

Overview
• 2. Transition constructionBlack point representsa region pair, while blueand red points are the projections of these re-gion pairs on XZ and YZspaces.

Overview
• 2. Transition constructionMost taxis intend to travel through a shortcut instead of the roundabout route if the shortcut is effective. On the contrary, if most taxis pass additional regions, that means the route directly connecting two places is not very effective.

Overview
• 3. Build region matrix

Overview
• Detecting flawed planningSkyline detection

Overview
• In this paper, which means there’s no region pair a(p, q) having a lower speed and bigger theta than those belongs to skyline.

Overview
• The detected skyline is comprised of 3 kinds of region pairs.
1. Very small E(V) and theta, which means the two regions are connected with some direct routes while the capacity of these routes are not sufficient.
Overview
2. A region pair with a small E(V) and big theta, which means people have to take detours and also suffer from a very slow speed. Worse case.3. A region pair with a big E(V) and big theta. Meaning that the travel speed is fast but far, still has flaws.

Overview
Examples of 1, 2, and 3.
Overview
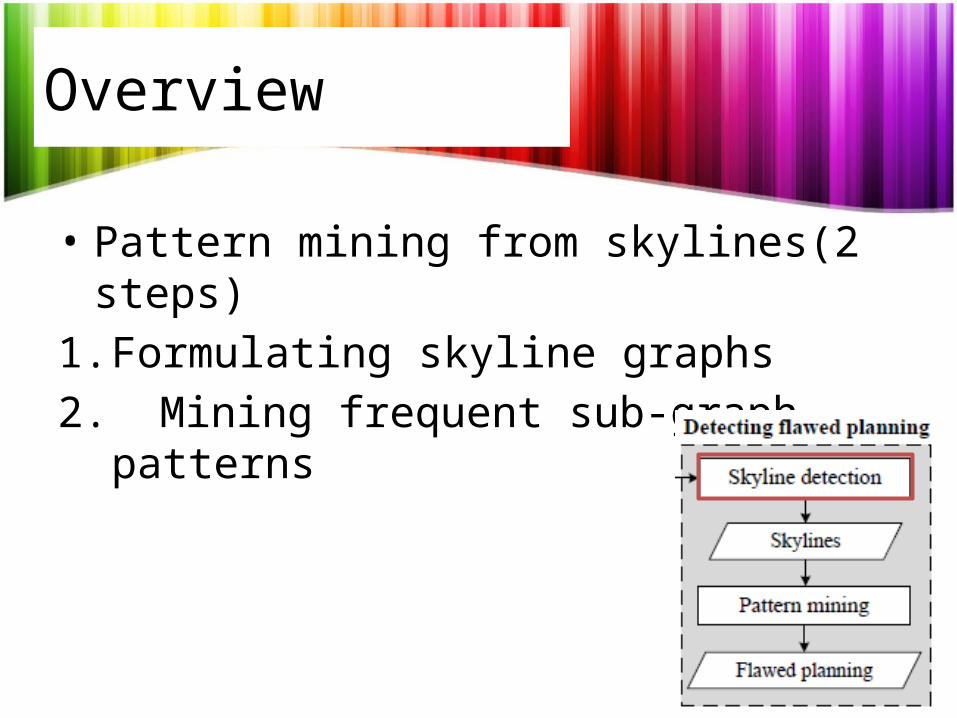
• Pattern mining from skylines(2 steps)1. Formulating skyline graphs2. Mining frequent sub-graph patterns

Overview
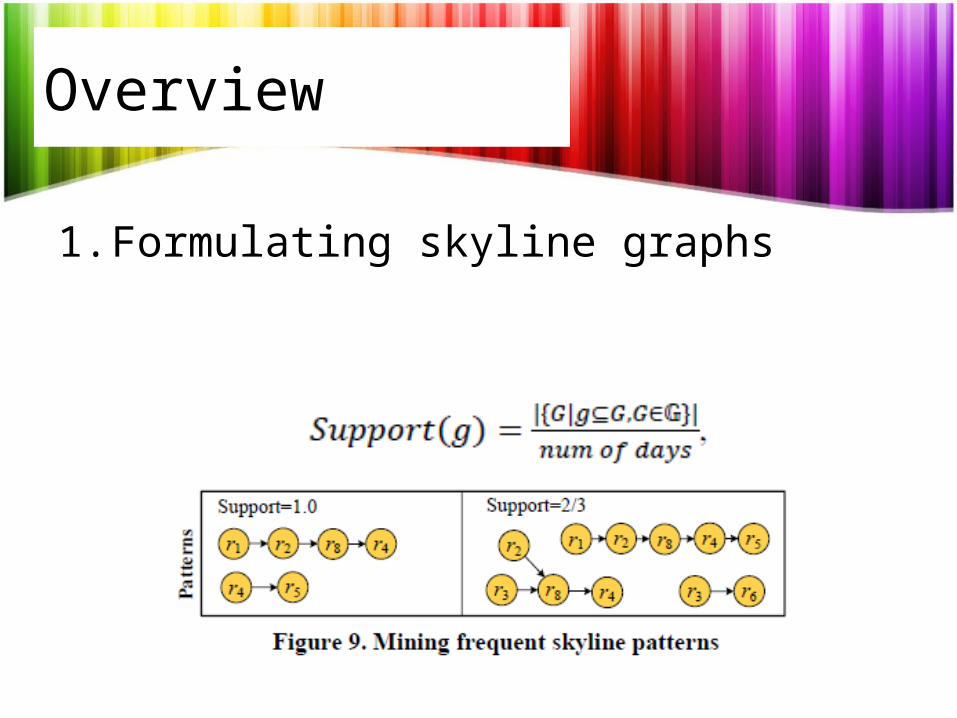
1. Formulating skyline graphsconnect two consecutive slotsif they are spatially close to each other.
There could be multiple isolated graphs pertaining to a day.
Overview
1. Formulating skyline graphs

Overview
2. Mining frequent sub-graph patternsMining the association rules.
The mined association rules can consist of over 2 patterns. E.g. g1, g2 => g3. Also, these association rules may NOT be geospatially close to each other.
Evaluation Settings
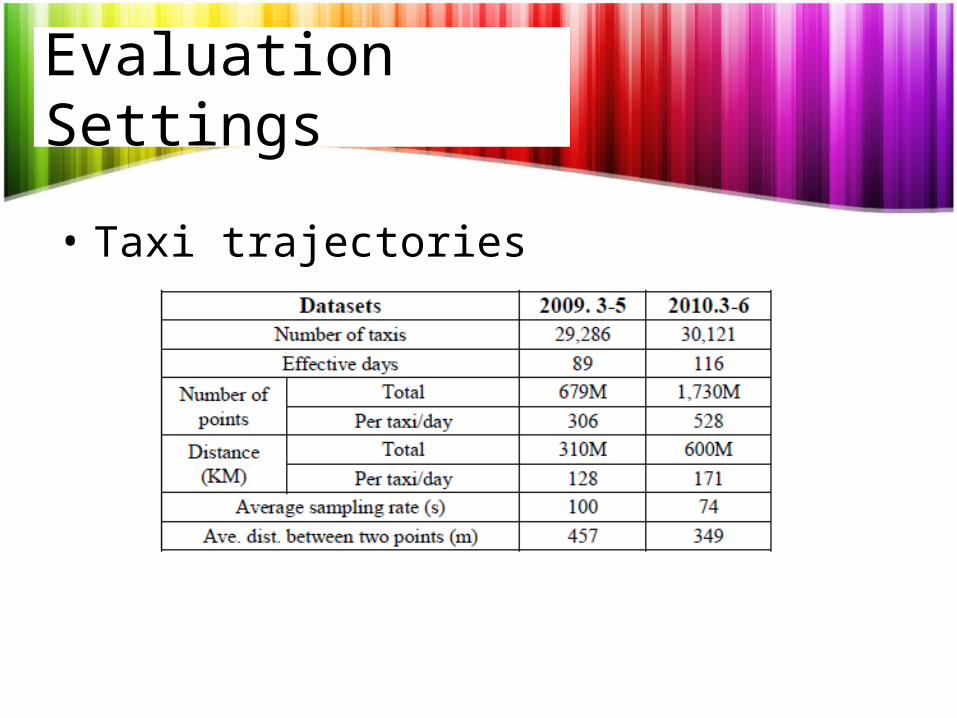
• Taxi trajectories

Evaluation Settings
• Map dataRoad network of Beijing, consist of 106,579 road
vertices and 141,380 road segments.Picked out 25,262 road segments w/ leveling from
0 to 6. Use only the 0 to 2 level. (0 is highest representing highways)
Create 444 regions in result.

Evaluation Settings
• Verify the detected flaws in the following 2 ways:1. Verify the urban plannings that had been
implemented between the times of the two datasets.
2. Check if some flaws that have been detected in both datasets by our methods embodied in the future urban planning of Beijing.

Evaluation Results

Evaluation Results
• Sum up that the traffic conditions in Beijing become worse in 2010 than 2009.

Evaluation Results
• Taxi drivers took fewer passengers than b4.• The average speed dropped between the two
years.• In short, the traffic condition became worse.

Evaluation Results
• Most regions becomesshallower in 2010 than2009, especially in hotareas.
• The travel speed of taxis in these regionsdecreased.

Evaluation Results
• By looking at the results, we observe two aspects:1. Some flawed planning occurring in 2009 disappeared in 2010.
2. The number of regions having defects increased in 2010 beyond 2009 and some flaws occuring in 2009 still exist.

Evaluation Results
• Some flawed planning occurring in 2009 disappeared in 2010.

Evaluation Results
• Some flawed planning that still exists in 2010.
The planning of these two subway lines denotes that
the urban planner has recognized the problem existing in the regions,
justifying the validity of the results generated using our
method.

Evaluation Results
• Can also found association rules between the detected patterns.
Support = 0.05Confidence = 0.7

Evaluation Results
• We will show more interesting results and a live demo during the presentation at the conference.

Related works
• Mining taxi trajectoriesEffectiveness, like what I’ve presented last time.Destination prediction, like what Danny presented
last time.• Urban computing
Most papers do their researchs on social computing and some user interaction stuff while this paper explore the urban computing from the perspective of urban planning.

Conclusion
• This paper detect the flaws in the existing urban planning of a city using the GPS trajactories of taxis traveling in the urban areas.

Conclusion
• Future plans:1.Studying the geographic features of a region, such as the road segments and POI.2. The purpose of people’s travel.

Comments
• Easy reading• Interesting and well-applied on a useful case • Chart arrangement thing again.• Like reading a novel or comic, no highlights.

Urban Computing with Taxicabs
The End