Urban Climate News · Urban Climate News Quarterly Newsletter ... ... just do one thing,” said...
28
ISSUE NO. 28 JUNE 2008 • INTERNATIONAL ASSOCIATION FOR URBAN CLIMATE Urban Climate News Quarterly Newsletter of the IAUC www.urban-climate.org News: Hong Kong breeze blocked • Cities lead on climate change Feature: Recent trends in literature related to urban climate Projects: Singapore energy & CO2 • India urban rainfall • Design models Country Report: Urban climate modelling & research in Hungary Conferences: ICUC-7 Yokohama • PLEA Dublin • AMS Phoenix • IGC Tunis Bibliography: Recent publications IAUC Board: Award • New member Inside the Summer issue... 2 4 6 17 21 24 Matthias Roth [email protected] From the IAUC President Welcome to Urban Climate News, the quarterly newsletter of IAUC. I am writing this column in Stock- holm, Sweden where I have attended the American Meteorological Society’s 18 th Symposium on Bound- ary Layers and Turbulence. I was very pleased to see a number of presentations with urban themes by active IAUC members. The increasing growth of urban-related research is also documented in Kevin Gallo’s Feature Article about recent urban climate trends in the literature. Conferences: The Local Organizing Committee of ICUC-7 has just published the Second Circular which can be viewed and downloaded at the of- ficial conference website (http://www.ide.titech. ac.jp/~icuc7/). In addition I would like to draw your attention to the upcoming PLEA meeting which will take place in Dublin in October 2008 and the AMS general meeting in Phoenix in January 2009 whose theme is “Urban Weather and Climate: Now and the Future.” The meeting will also include a special symposium in honor of our past president, Tim Oke. Where not too late, please consider submitting an abstract. I am also happy to report that PLEA and AMS have agreed to serve as co-sponsors of ICUC-7. This newsletter features two Urban Project re- ports on research in tropical regions, namely on en- ergy and carbon dioxide fluxes in Singapore and the influence of urban growth on pre-monsoon rain in Kolkata, India. A third article is devoted to the need for an urban climatology applied design model. The latest addition to our Country Report series is a re- port about climate research in Hungary. I would like to thank all of you who have partici- pated in the recent IAUC elections, especially those who stood for election for the Board. I am pleased to announce that Sofia Thorsson from University of Gothenburg will join the Board and want to express my sincere thanks to Dr Wilhelm Kuttler for his ex- cellent work during the past four years (see more details later in the newsletter). The 2007 Luke How- ard Award has officially been presented to Dr. Ma- satoshi Yoshino in Japan and pictures from the cer- emony are included in a short report. I would like to thank Winston Chow who recently joined the news- letter team as the new sub-editor for the Urban Climate in the News section. Winston is a graduate student in the School for Geographical Sciences at Arizona State University. He will be happy to receive any news items at [email protected]. I hope that you enjoy this newsletter and remem- ber that you are always welcome to contribute with an article, short research report, urban climate news item or conference report. 1998 2000 2002 2004 2006 Year
Transcript of Urban Climate News · Urban Climate News Quarterly Newsletter ... ... just do one thing,” said...

ISSUE NO. 28 JUNE 2008 • INTERNATIONAL ASSOCIATION FOR URBAN CLIMATE
Urban Climate NewsQuarterly Newsletter of the IAUC
www.urban-climate.org
News: Hong Kong breeze blocked• Cities lead on climate change
Feature: Recent trends in literature related to urban climate
Projects: Singapore energy & CO2 • India urban rainfall • Design models
Country Report: Urban climate modelling & research in Hungary
Conferences: ICUC-7 Yokohama • PLEA Dublin • AMS Phoenix • IGC Tunis
Bibliography: Recent publications IAUC Board: Award • New member
Inside the Summer issue...
2
4
6
17
21
24
Matthias Roth
From the IAUC PresidentWelcome to Urban Climate News, the quarterly
newsletter of IAUC. I am writing this column in Stock-holm, Sweden where I have attended the American Meteorological Society’s 18th Symposium on Bound-ary Layers and Turbulence. I was very pleased to see a number of presentations with urban themes by active IAUC members. The increasing growth of urban-related research is also documented in Kevin Gallo’s Feature Article about recent urban climate trends in the literature.
Conferences: The Local Organizing Committee of ICUC-7 has just published the Second Circular which can be viewed and downloaded at the of-ficial conference website (http://www.ide.titech.ac.jp/~icuc7/). In addition I would like to draw your attention to the upcoming PLEA meeting which will take place in Dublin in October 2008 and the AMS general meeting in Phoenix in January 2009 whose theme is “Urban Weather and Climate: Now and the Future.” The meeting will also include a special symposium in honor of our past president, Tim Oke. Where not too late, please consider submitting an abstract. I am also happy to report that PLEA and AMS have agreed to serve as co-sponsors of ICUC-7.
This newsletter features two Urban Project re-ports on research in tropical regions, namely on en-ergy and carbon dioxide fluxes in Singapore and the influence of urban growth on pre-monsoon rain in Kolkata, India. A third article is devoted to the need for an urban climatology applied design model. The latest addition to our Country Report series is a re-port about climate research in Hungary.
I would like to thank all of you who have partici-pated in the recent IAUC elections, especially those who stood for election for the Board. I am pleased to announce that Sofia Thorsson from University of Gothenburg will join the Board and want to express my sincere thanks to Dr Wilhelm Kuttler for his ex-cellent work during the past four years (see more details later in the newsletter). The 2007 Luke How-ard Award has officially been presented to Dr. Ma-satoshi Yoshino in Japan and pictures from the cer-emony are included in a short report. I would like to
thank Winston Chow who recently joined the news-letter team as the new sub-editor for the Urban Climate in the News section. Winston is a graduate student in the School for Geographical Sciences at Arizona State University. He will be happy to receive any news items at [email protected].
I hope that you enjoy this newsletter and remem-ber that you are always welcome to contribute with an article, short research report, urban climate news item or conference report.
0
100
200
300
400
500
1988 1990 1992 1994 1996 1998 2000 2002 2004 2006Year
Num
ber o
f Pub
licat
ions All Journals

In the News 2
ISSUE NO. 28 JUNE 2008 INTERNATIONAL ASSOCIATION FOR URBAN CLIMATE
Prof.Tim Oke at the Hong Kong PolyUWorkshop onEarthObservationinUrbanPlanning&Management.
Breeze block blamed for urban heat in Hong KongMay, 2008
Mong Kok and Causeway Bay are sweltering with the hottest temperatures in the city of Hong Kong, because of the urban heat island (UHI) effect.
The UHI effects on Hong Kong and other cities were explored at the Second Workshop on Earth Observation in Urban Planning and Management, which was orga-nized by the Department of Land Surveying and Geo-Informatics (LSGI) of The Hong Kong Polytechnic Univer-sity (PolyU) from May 20 to 21.
Leading experts in remote sensing, geographic infor-mation system (GIS) and urban climatology presented their latest findings, exchanged ideas and discussed var-ious issues related to urban planning and management at this two-day workshop. Professor Tim Oke, who first put forward a theory to explain the formation of the UHI in 1982, also made a special trip from the University of British Columbia in Canada to attend this conference.
Professor Oke said the effect in Hong Kong is due to the density and height of the buildings that block the sea breeze. “It’s because of the way Hong Kong is built that has caused an excess of temperature and there’s no sign of this slowing down,” Oke explained. “If Kowloon is made bigger through reclamation the intensity of the UHI effect will increase. The cleaner air from the harbor is being intercepted by the walls of buildings.”
Experts said continued reclamation on the harbor-front has worsened the effect over the years, particularly in reclaimed areas such as Olympic station. Planners, Oke said, should build at a lower density to allow ventilation.
Hong Kong is one of six cities, including Atlanta and Vancouver, which experience maximum temperature dif-ferences. “Twelve degrees is the maximum difference, so Hong Kong is at the top of the scale,” Oke said.
With its densely populated urban area, Hong Kong provides a typical example of the UHI effect. In studying the territory’s UHI intensity last winter, PolyU LSGI Asso-ciate Professor Dr. Janet Nichol and her research team reviewed satellite images and collected ground data by making some 20 trips on special mobile vehicles in dusk and dawn. Each vehicle was equipped with two temper-ature sensors and a GPS receiver.
After analyzing the data, PolyU researchers found that there was an average temperature difference of 7-8oC between urban and rural areas on a winter night, and the maximum difference could be as high as 12oC. On a summer night the difference between urban and rural areas was 5-6oC. Although in most cases the land was cooler than the sea at night, Kowloon and the north-ern part of the Hong Kong Island were much warmer. In summer the land is significantly warmer than the sea,
offering the potential for cooling sea breezes. In both summer and winter the hottest urban area is Mong Kok, closely followed by Causeway Bay. The coolest area is the rural area around Ta Kwu Ling.
Dr. Nichol said the large urban centre of Kowloon, with a population of over two million, is dominated by a strongly developed, regional scale urban boundary layer, and its urban canopy layer climate is reinforced by heating from both above and below. Reduced ventila-tion, high temperatures and the blocking of sea breezes by tall buildings on the newly reclaimed land, or the so called ”wall effect“ are contentious issues.
The UHI effect has the potential to directly influence the health and well-being of city dwellers, particularly during a heat wave, as it deprives urban residents of the cool relief found in rural areas during the night.
Sources:http://www.thestandard.com.hk/news_detail.asp?pp_cat=11&art_id=66192&sid=19028252&con_type=1http://www.polyu.edu.hk/cpa/polyu/hotnews/details_e.php?year=all&news_id=1435
Thermal model with southward view over KowloonPeninsula.Source: Nichol and Wong, 2005.

In the News �
ISSUE NO. 28 JUNE 2008 INTERNATIONAL ASSOCIATION FOR URBAN CLIMATE
Cities take lead on climate changeJune, 2008
CAMBRIDGE, Mass.--City governments’ response to cli-mate change ranges from cutting-edge distributed energy to adding more bike lanes and trees.
Climate change experts from four cities--London, To-ronto, Chicago, and New York--spoke recently about the connections between sustainable urban design, energy, the economy, and human health at the Mass Impact Sym-posium, organized by the Boston Society of Architects and the Massachusetts Institute of Technology.
The cities’ climate action plans, some of which have yet to be fully rolled out, call for aggressive goals to measure, reduce, and monitor greenhouse gas levels--aiming for de-creases of 50 to 80 percent in the next three decades.
Under that over-arching goal are dozens of programs, including promotion of green technologies to lower ener-gy consumption in transportation and buildings. “We can’t just do one thing,” said Ariella Maron, deputy director of New York’s Office of Long-Term Planning and Sustainability. She said the city’s plan covers clean energy, efficient build-ings, transportation, and avoiding sprawl--all of which im-pact water, land use, and air quality.
Called PlaNYC, the program stems from simple demo-graphics: another 1 million people will join its current pop-ulation of 8.25 million by 2030.
It’s not just New York. Urbanization is rapidly accelerat-ing around the world. That means the “tipping point” to-ward greenhouse gas reductions will come from making cities more sustainable, particularly in developing coun-tries, said John Fernandez, an associate professor at MIT’s architecture department.
More than half of the world’s residents now live in cities, and 85 percent of the world’s population growth will be in urban areas in the coming decades, mostly in Asia, Africa, and Latin America, Fernandez said.
Green retrofitsTop on the list of these cities’ programs is building en-
ergy efficiency. Overall, energy consumption in buildings is about one-third of all U.S. energy use, but it can be a lot higher in cities--in New York, it’s 80 percent and rising.
Chicago requires city buildings requesting funding to meet the U.S. Green Building Council’s Silver-level LEED cer-tification. But while cities can make visible commitments to environment stewardship, it’s typically a drop in the bucket when it comes to carbon emissions. That’s because 80 per-cent of buildings that exist today will still be around in two decades, making technologies to retrofit existing buildings more important, city representatives said.
There are also opportunities for individuals or neighbor-hoods to generate their own energy. Toronto is experiment-ing with a program called SolarCity to encourage commu-nities to purchase solar hot water systems.
At the end of this month, the PlaNYC program will an-nounce details of a program to lower buildings’ carbon emissions 30 percent by 2017 by promoting micro-power generation and waste-to-power technologies, Maron said.
London, meanwhile, is exploring more futuristic ap-proaches, where whole neighborhoods would generate their own energy. Nicky Gavron, the former deputy mayor of London, said city planners envision replacing natural gas production either by producing bio-gas from organic wastes in anaerobic digesters or using waste to make syn-thetic gas through plasma arc gasification. The energy from waste would be used in either individual or neighborhood combined heat and power systems. “We have an opportu-nity to usher in a new era of municipally owned enterprises around low-carbon technologies,” said Gavron.
Not keeping pace with technology?City governments are eager to show leadership by
adopting green technologies in their own operations. Toronto’s LightSavers pilot is testing to see whether more efficient LED lighting with controls can be used for street lights, parking garages, and pedestrian areas. And the FleetWise plug-in hybrid pilot has allowed the city govern-ment to improve its fuel economy by 50 percent, said Philip Jessup, director of the Toronto Atmospheric Fund. In Win-nipeg, Canada, already 70 percent of taxis are hybrids.
Water treatment is an important feature of climate change response, according to planners. With more ex-treme precipitation, New York is enlisting trees to try to capture run-off and pollutants. The city is trying to add more green spaces to its streets and change the tree pit specifications so that they are big enough to retain more water, Maron said.
Despite the good intentions, representatives from these cities said that politics--particularly with regard to fund-ing-- make climate change all the more challenging. To get different sources of revenue, London has taken a minority stake in an energy services company that uses savings from energy efficiency to offset upfront investments. Toronto’s Atmospheric Fund was created and sustained by the sav-ings from building energy retrofits.
Another challenge is that political institutions are falling behind the technology advances in areas like lighting and transportation, said Toronto’s Jessup. “The job descriptions, the bureaucracies, have not changed fast enough for these new technologies -- so they just don’t get it,” he said.
WillcitiesofthefuturelooklikeBeijing,picturedhere?Credit: Tom Krazit/CNET News.com
Feature 4
ISSUE NO. 28 JUNE 2008 INTERNATIONAL ASSOCIATION FOR URBAN CLIMATE
MethodologyThe Scopus abstract and citation database (Else-
vier B.V. © 2008) was used to conduct the literature searches included in this analysis. Scopus includes more than 15,000 journals from over 4,000 publish-ers in this database as well as open-access journals, conference proceedings and trade publications.
Since the initial goal of this literature search was a rather focused survey of the topic of urban influ-ences on temperature trends, the Scopus database was searched with several combinations of “key-words” that could be mentioned in either the article title, abstract, or specific list of keywords that are
usually supplied by article authors. However, only the search results for the combination of keywords “Urban and Climate” are presented.
This literature search was limited to documents published within the last 20 years (from 1988 through 2007). Two literature searches were made for each of the combinations of keywords of “Urban and Climate” that included 1) articles within all avail-able subject area topics covered by Scopus; Life Sci-ences, Health Sciences, Physical Sciences, and Social Sciences (> 15,000 journals) and 2) articles limited to the journals classified within Scopus as those of the “Physical Sciences” (> 5,500 titles).
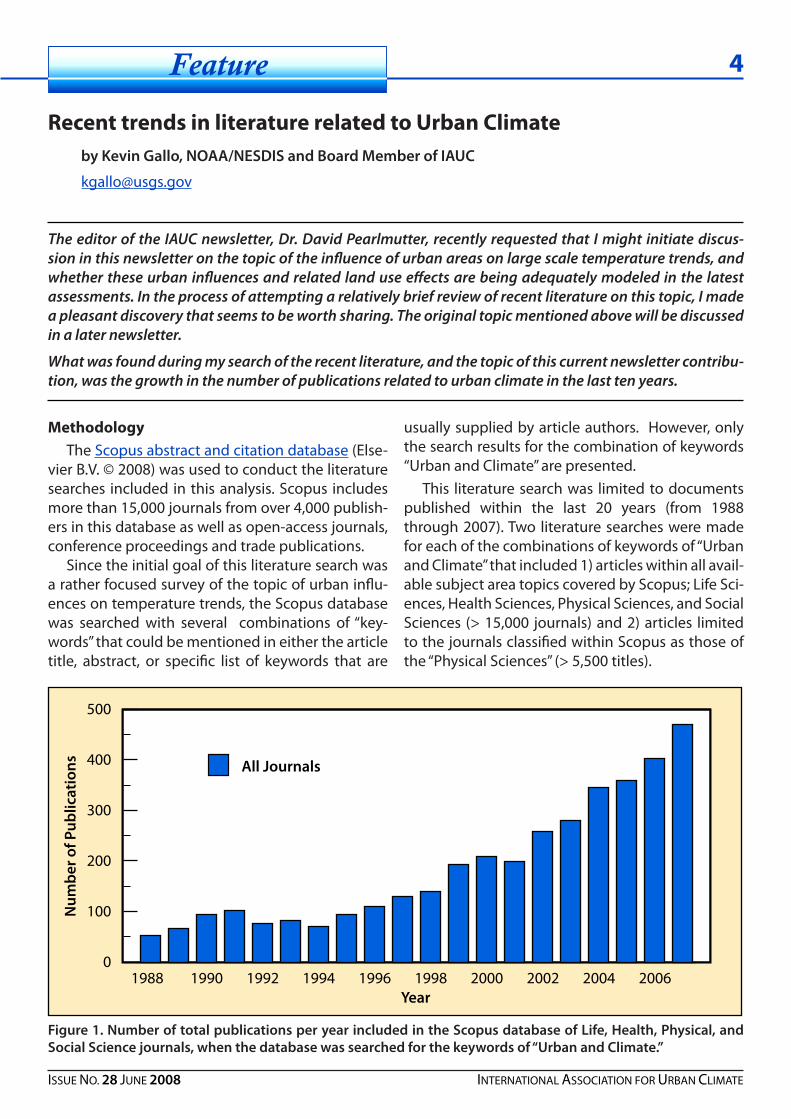
Recent trends in literature related to Urban ClimatebyKevinGallo,NOAA/NESDISandBoardMemberofIAUC
The editor of the IAUC newsletter, Dr. David Pearlmutter, recently requested that I might initiate discus-sion in this newsletter on the topic of the influence of urban areas on large scale temperature trends, and whether these urban influences and related land use effects are being adequately modeled in the latest assessments. In the process of attempting a relatively brief review of recent literature on this topic, I made a pleasant discovery that seems to be worth sharing. The original topic mentioned above will be discussed in a later newsletter.
What was found during my search of the recent literature, and the topic of this current newsletter contribu-tion, was the growth in the number of publications related to urban climate in the last ten years.
Figure1.NumberoftotalpublicationsperyearincludedintheScopusdatabaseofLife,Health,Physical,andSocialSciencejournals,whenthedatabasewassearchedforthekeywordsof“UrbanandClimate.”
0
100
200
300
400
500
1988 1990 1992 1994 1996 1998 2000 2002 2004 2006Year
Num
ber o
f Pub
licat
ions All Journals

Feature �
ISSUE NO. 28 JUNE 2008 INTERNATIONAL ASSOCIATION FOR URBAN CLIMATE
Results and Discussion
The results of the literature search of the above combinations of keywords, for all topical journals (Life, Health, Physical, and Social Sciences, designat-ed “All Journals”), are displayed in Figure 1. Those defined as Physical Science journals, and the Non-physical Science journals (difference between “All” and Physical Science journals) are shown in Fig. 2.
Over 450 articles were found within the Scopus database (Figure 1) as published during 2007 with-in journals of all of the above science topics (Life, Health, Physical, and Social Sciences) included in the Scopus database. Over 350 publications were published within the Physical Science journals dur-ing 2007, thus roughly 100 were published within the Non-physical Science journals included in the Scopus database. While the number of articles was near or below 100 from 1988 through 1995, after 1995 the number of articles generally increased through 2007. As might be expected, the Physi-cal Science Journals are the primary location of articles with the keywords of “Urban and Climate” with approximately 60 to 80% of the articles associ-ated with these keywords during the 1988 through 2007 interval published within the Physical Science journals. The linear increase in publications per year during the 10-year interval of 1998 through 2007 was 34.0 for all science journals, 28.2 for the Physical Science journals, and 5.8 for the Non-physical Sci-ence journals.
In summary, based on the number of publications in the last 10 years it appears that the general topic of “Urban Climate” has had an increase of roughly 34 publications per year with most of the publica-tions occurring within journals classified as Physical Science journals. Also of interest is that within this combination of keywords the increase of publica-tions within the Non-physical Science Journals (Life, Health and Social Sciences) included in the Scopus database, has increased at a rate of nearly 6 publica-tions per year within the last 10 years, perhaps an indication and acknowledgement of the impact of the urban climate on other disciplines as the world-wide proportion of urban population, compared to total population, is projected to increase to 61% by 2030 (United Nations, 2004).
Acknowledgements
The manuscript contents do not constitute a statement of policy, decision, or position on behalf of NOAA or the U. S. Government.
Reference
United Nations, 2004. World Urbanization Pros-pects: The 2003 Revision. Department of Economic and Social Affairs Population Division. New York, 335 pp. Available at:
http://www.un.org/esa/population/publications/wup2003/WUP2003Report.pdf
Figure2.NumberofpublicationsperyearincludedintheScopusdatabaseofthePhysicalSciencejournalsandNon-physicalSciencejournals,whenthedatabasewassearchedforthekeywordsof“UrbanandClimate.”
0
100
200
300
400
1988 1990 1992 1994 1996 1998 2000 2002 2004 2006Year
Num
ber o
f Pub
licat
ions Physical Sciences
Non-physical Science
Urban Projects
classification Af) characterized by uniformly high annual temperature (~27 °C) and abundant precipi-tation (~2300 mm/year) throughout the year. There are two distinct wind regimes, the SW and NE mon-soons. The SW monsoon, occurring between May and September, is slightly warmer compared to the December to February NE monsoon which is more cloudy and receives more precipitation. Between the monsoon seasons are shorter periods where the wind direction is variable.
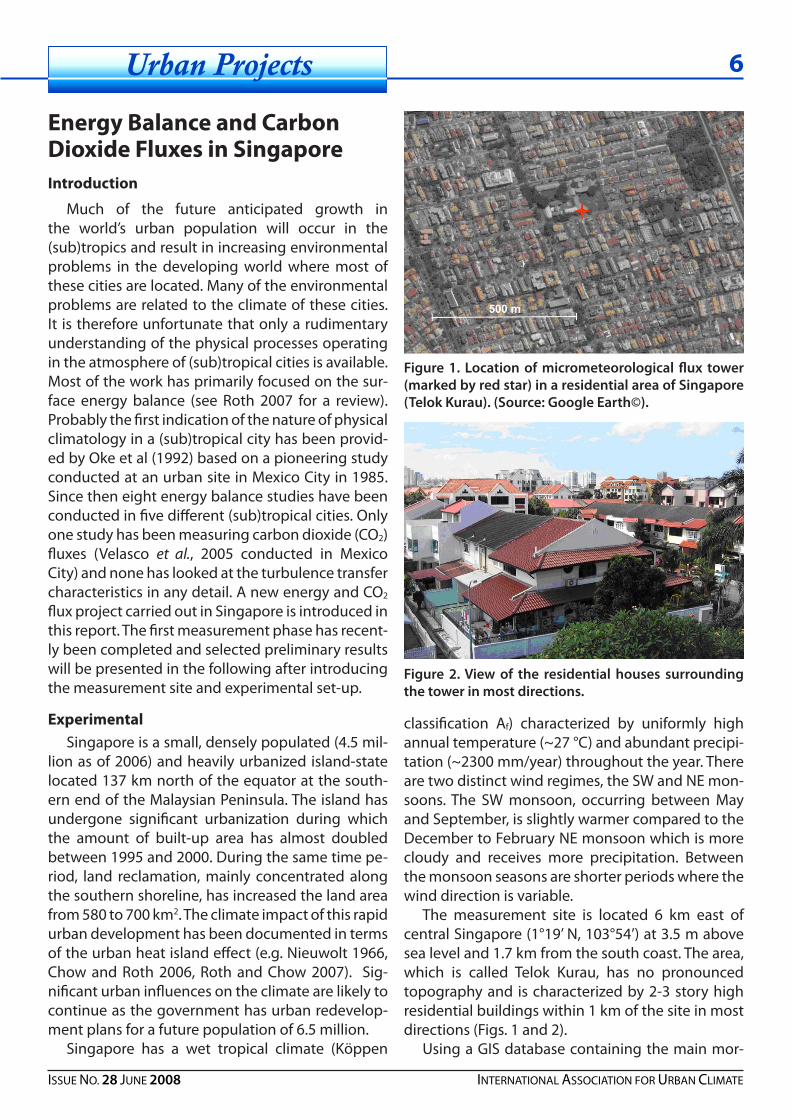
The measurement site is located 6 km east of central Singapore (1°19’ N, 103°54’) at 3.5 m above sea level and 1.7 km from the south coast. The area, which is called Telok Kurau, has no pronounced topography and is characterized by 2-3 story high residential buildings within 1 km of the site in most directions (Figs. 1 and 2).
Using a GIS database containing the main mor-
Energy Balance and CarbonDioxide Fluxes in SingaporeIntroduction
Much of the future anticipated growth in the world’s urban population will occur in the (sub)tropics and result in increasing environmental problems in the developing world where most of these cities are located. Many of the environmental problems are related to the climate of these cities. It is therefore unfortunate that only a rudimentary understanding of the physical processes operating in the atmosphere of (sub)tropical cities is available. Most of the work has primarily focused on the sur-face energy balance (see Roth 2007 for a review). Probably the first indication of the nature of physical climatology in a (sub)tropical city has been provid-ed by Oke et al (1992) based on a pioneering study conducted at an urban site in Mexico City in 1985. Since then eight energy balance studies have been conducted in five different (sub)tropical cities. Only one study has been measuring carbon dioxide (CO2) fluxes (Velasco et al., 2005 conducted in Mexico City) and none has looked at the turbulence transfer characteristics in any detail. A new energy and CO2
flux project carried out in Singapore is introduced in this report. The first measurement phase has recent-ly been completed and selected preliminary results will be presented in the following after introducing the measurement site and experimental set-up.
ExperimentalSingapore is a small, densely populated (4.5 mil-
lion as of 2006) and heavily urbanized island-state located 137 km north of the equator at the south-ern end of the Malaysian Peninsula. The island has undergone significant urbanization during which the amount of built-up area has almost doubled between 1995 and 2000. During the same time pe-riod, land reclamation, mainly concentrated along the southern shoreline, has increased the land area from 580 to 700 km2. The climate impact of this rapid urban development has been documented in terms of the urban heat island effect (e.g. Nieuwolt 1966, Chow and Roth 2006, Roth and Chow 2007). Sig-nificant urban influences on the climate are likely to continue as the government has urban redevelop-ment plans for a future population of 6.5 million.
Singapore has a wet tropical climate (Köppen
Figure 1. Location of micrometeorological flux tower(markedbyredstar)inaresidentialareaofSingapore(TelokKurau).(Source:GoogleEarth©).
Figure 2.View of the residential houses surroundingthetowerinmostdirections.
6
ISSUE NO. 28 JUNE 2008 INTERNATIONAL ASSOCIATION FOR URBAN CLIMATE

Urban Projects
phological characteristics of the area, the mean height of buildings and trees (zH) was determined as 8.6 m. The plan area fraction occupied by buildings and vegetation is 0.39 and 0.12, respectively. The site-specific aerodynamic properties were assessed from analysis of surface form according to Grim-mond and Oke (1999). Using several equations the aerodynamic roughness length (z0) is 1 m and the zero-plane displacement length (zd) 6 m with good agreement amongst the various equations. As de-termined using the logarithmic wind profile under neutral conditions, z0 was 2 m.
The main eddy covariance instrumentation was mounted at the top of a pneumatic tower (Hilo-mast; NL22) at a height of 20.7 m above ground (Fig. 3), i.e. about 2.4 times the mean height of the houses and trees. It consisted of a sonic anemom-eter (CSAT3) measuring the three-dimensional wind velocities and virtual air temperature, an open-path infrared gas analyzer (Li7500) measuring CO2 and water vapor and a radiation sensor (CNR1) measur-ing incoming and outgoing long- and shortwave radiation. The sonic anemometer and gas analyzer as well as the CNR1 were placed at the end of op-posing booms extending approximately 0.8 m each from the tower (Fig. 4). The distance between the centre of the sonic transducers and the Li7500 head was 20 cm. The leveling of the CSAT3 was monitored with a miniature inclinometer and kept to within 1.5 degrees on average. To minimize tower interference on the flow field, the sonic anemometer head was turned into the main wind direction, i.e. towards approximately 40 degrees during the NE monsoon and towards 180 degrees during the SW monsoon periods. The sensors were connected to a data log-ger (CR5000, Campbell Scientific) and data sampled at 10 Hz. Other measurements conducted at the site included air temperature and relative humidity at 20 m above ground, precipitation and surface tem-perature.
Before turbulent fluxes were computed, wind components were rotated into a streamwise coor-dinate system and linear trends removed using an averaging time of 30 minutes. QH values were cor-rected to account for the use of sonic virtual air temperature (Schotanus et al., 1983) and density corrections were applied to QE and FCO2 (Webb et al., 1980). Unrealistic raw data, defined as values outside fixed threshold limits, were deleted before
any calculations were conducted. The entire 30 min block was rejected if it contained more than 10% missing data. Similar to raw data, turbulent fluxes outside prescribed limits were rejected. Observa-tions were conducted between 1 March 2006 and 22 March 2008. Data availability was high during most months but dropped below 30% for individ-ual months during the NE monsoon periods when frequent rainfall affected the CSAT3 and Li7500 sig-nals. Wind directions from 260-360 degrees were not considered because of unusually high buildings and trees in this sector. Measurements were inter-rupted in April 2007 for five months when the tower was hit by lightning and had to be stopped in March
Figure 3. Pneumatic micrometeorological tower witheddy covariance sensors installed at 20.7 m aboveground.
Figure4.Close-upofeddycovariancesensorsinstalledat topofmast.CSAT3andLi7500arevisibleonr.h.s.andCNR1onl.h.s.Thinverticalextensionincenterislightningrod.
7
ISSUE NO. 28 JUNE 2008 INTERNATIONAL ASSOCIATION FOR URBAN CLIMATE
Urban Projects
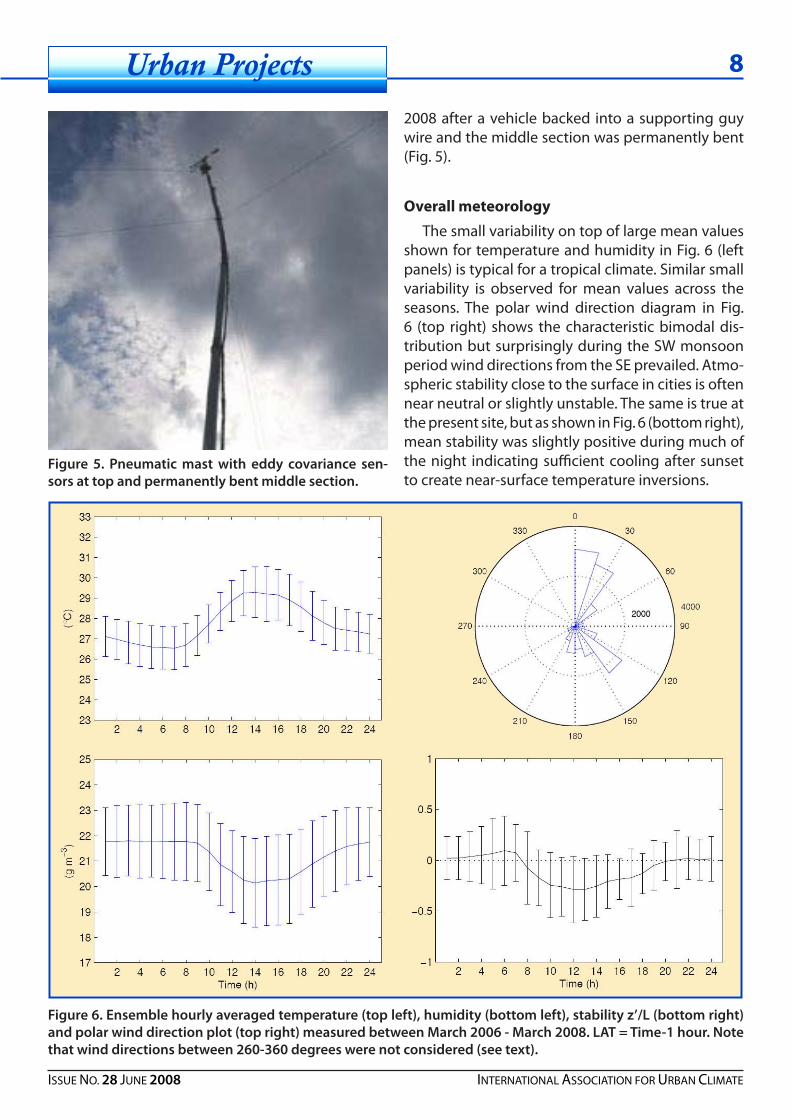
2008 after a vehicle backed into a supporting guy wire and the middle section was permanently bent (Fig. 5).
Overall meteorology
The small variability on top of large mean values shown for temperature and humidity in Fig. 6 (left panels) is typical for a tropical climate. Similar small variability is observed for mean values across the seasons. The polar wind direction diagram in Fig. 6 (top right) shows the characteristic bimodal dis-tribution but surprisingly during the SW monsoon period wind directions from the SE prevailed. Atmo-spheric stability close to the surface in cities is often near neutral or slightly unstable. The same is true at the present site, but as shown in Fig. 6 (bottom right), mean stability was slightly positive during much of the night indicating sufficient cooling after sunset to create near-surface temperature inversions.
Figure 5. Pneumatic mast with eddy covariance sen-sorsattopandpermanentlybentmiddlesection.
Figure6.Ensemblehourlyaveragedtemperature(topleft),humidity(bottomleft),stabilityz’/L(bottomright)andpolarwinddirectionplot(topright)measuredbetweenMarch2006-March2008.LAT=Time-1hour.Notethatwinddirectionsbetween260-360degreeswerenotconsidered(seetext).
�
ISSUE NO. 28 JUNE 2008 INTERNATIONAL ASSOCIATION FOR URBAN CLIMATE

Urban ProjectsEnergy balance and CO2 fluxes
Because of the equatorial location seasonal vari-ability in radiation is small and the ensemble mean values shown in Figure 7 are applicable to all months. Average incoming shortwave radiation is relatively large and individual values can exceed 1000 W m-2 around noon on clear days. Incoming and outgoing longwave radiation is also relatively large (~420 and ~480 W m-2, respectively) because of the warm and humid air. The values are similar to those measured in Miami located just outside the tropics (25º44’N) in the summer (Newton et al., 2007).
The net radiation gain during daytime is almost equally partitioned into sensible and storage (de-termined as the residual of the energy balance) heat during the morning hours (Fig. 8). In the afternoon and early evening the sensible heat flux remains positive while the surface starts to release heat from storage after around 5 pm. The latent heat flux is an important component during daytime but it is smaller than expected considering the abundance of rain throughout the year. One possible expla-nation is the large amount of sealed surfaces and an extensive drainage system to prevent flooding which efficiently discharges any surface water. In addition, a relatively low vapor pressure deficit of typically 6-10 hPa might restrict evaporation. This daily balance looks similar to that observed in cities in other climate regions.
Although seasonal variability is relatively small, differences are clearly present as demonstrated in Figure 9. The latent heat flux is systematically high-er during the NE monsoon period compared to the relatively drier SW monsoon period. The opposite result is obtained for the sensible heat flux where drier conditions result in higher fluxes.
The present study provides the first systematic, long-term observations of carbon dioxide fluxes in a tropical city. Similar to results from cities in other cli-mate regions, the flux is mostly positive, i.e. the city is a source of CO2 (Fig. 10). The absolute values are slightly smaller than observed for example in Basel (Vogt et al., 2006), Marseille (Grimmond et al., 2004), Melbourne (Coutts et al., 2007) or Tokyo (Moriwaki and Kanda, 2004). This is possibly due to the resi-dential nature of this particular site with little heavy traffic and the absence of major local emission sources. Fluxes are highest during the early morn-ing and late evening when the traffic volume peaks.
Photosynthesis during daytime contributes to low values which, however, are still positive on average. The daily variation of the CO2 concentrations (Fig. 10) mirrors that of the fluxes. More work is needed to relate these daily patterns to traffic volume, at-mospheric stability or mixing layer height. Similar to the energy balance fluxes, seasonal variability is low.
Future plansA number of publications are presently under
preparation. The study will be continued in fall 2008 with an expanded scope and plans to include mea-surements of the spatial variability of the energy and CO2 fluxes and a more detailed assessment of the various emission sources contributing to the CO2 budget.
Figure7.Ensemblehourlyaveragedradiationfluxden-sitiesmeasuredbetweenMarch2006-March2008forallweatherconditions.LAT=Time-1hour.
Figure8.Ensemblehourlyaveragedenergyfluxdensi-ties(periodasinFig.7).Qn–netradiation,QH–sensibleheatflux,LE–latentheatflux,∆S–storageheatflux.
�
ISSUE NO. 28 JUNE 2008 INTERNATIONAL ASSOCIATION FOR URBAN CLIMATE

Urban Projects
ReferencesChow, W. and Roth, M., 2006: Temporal dynamics of the ur-ban heat island of Singapore. International Journal of Clima-tology 26, 2243-2260.Coutts, A.M., Beringer, J. and Tapper, N.J. 2007: Character-istics influencing the variability of urban CO2 fluxes in Mel-bourne, Australia. Atmospheric Environment 41, 51-62.Grimmond, C.S.B. and Oke, T.R., 1999: Aerodynamic proper-ties of urban areas derived from analysis of surface form. Journal of Applied Meteorology ��, 1262-1292.Grimmond, C.S.B., Salmond, J.A., Oke, T.R., Offerle, B., and Lemonsu, A. 2004: Flux and turbulence measurements at a dense urban site in Marseille: Heat, Mass (water, carbon dioxide) and Momentum. Journal of Geographical Research 10�, 1-19.Moriwaki, R., and Kanda, M. 2004: Seasonal and diurnal flux-es of radiation, heat, water vapor and CO2 over a suburban area. Journal of Applied Meteorology 4�, 1700-1710.Newton, T., Oke, T.R., Grimmond, C.S.B. and Roth, M., 2007: The suburban energy balance in Miami, Florida, Geografiska Annaler. Series A, ��A (4), 331-347.Nieuwolt S., 1966: The urban microclimate of Singapore. Journal of Tropical Geography 22, 30–37.Roth, M, 2007: Review of urban climate research in (sub)tropical regions. International Journal of Climatology 27, 1859-1873.Roth, M. and Chow W., 2007: UHI research in Singapore, IAUC Newsletter 24, 7-11.Schotanus, P., Nieuwstadt, F.T.M. and deBruin, H.A.R., 1983: Temperature measurements with a sonic anemometer and its application to heat and moisture fluxes. Boundary-Layer Meteorol., 26, 81-93.Velasco, E., Pressley, S., Allwine, E., Westberg, H. and Lamb, B. 2005: Measurements of CO2 fluxes from the Mexico City urban landscape. Atmospheric Environment ��, 7433-7446.Vogt, R., Christen, A., Rotach, M.W., Roth, M. and Satyana-rayana, A.N.V. 2006: Temporal dynamics of CO2 fluxes and profiles over a central European city. Theoretical and Applied Climatology �4, 117-126.Webb E.K., Pearman G.I., Leuning R., 1980: Correction of flux measurements for density effects due to heat and water va-pour transfer. Quart. J. Ro.y Meteor. Soc. 106, 85–100.
AcknowledgementsWe are grateful for the help by Dr. A.N.V Satyana-
rayana during the early stages of the project. We would also like to thank Ms. Michelle Cher for grant-ing access to the site and acknowledge help from Mr. Muhammad Rahiz with downloading data and obaining meta data and from Ms. Quek See Leng and Ms. Cheah Li Min with the GIS database.
Matthias RothDepartment of Geography
National University of Singapore
Christer JanssonRoyal Institute of Technology
Stockholm, Sweden
Figure9.Ensemblehourlyaveragedlatentheatfluxdensi-ties(periodasinFig.7).Solidline-allmonths,dottedline-SWmonsoonperiod,dashedline-NEmonsoonperiod.
Figure10.EnsemblehourlyaveragedCO2fluxdensities(top)andconcentrations(bottom),periodasinFig.7.
10
ISSUE NO. 28 JUNE 2008 INTERNATIONAL ASSOCIATION FOR URBAN CLIMATE

Urban Projects
1. Introduction
In 2008, more than half the world’s population lived in urban areas and this could balloon to 81% by 2030 (Trenberth et al. 2007). “Urban footprints” spread well beyond the immediate vicinity of cities, affecting local to global scale atmospheric composi-tion, surface energetics, water and carbon cycle pro-cesses, and ecosystem development. While the ur-ban heat island (UHI) is well understood (Oke, 1987), the IPCC’s recent report and a review by Shepherd (2005) have highlighted the growing body of re-search linking urban-related processes and regional precipitation. Very little work has been done on this topic in the rapidly urbanizing developed nations. The city of Kolkata in eastern India has been aggres-sively multiplying itself in the last three decades, particularly during the Indian independence phase (1940s and 1950s), and such rapid expansion con-tinues (Chakraborty, 1990) due to the increasingly important socio-economic role that Kolkata plays in the region (Roy, 2003).
a. Pre-monsoon rainfall in IndiaThe pre-monsoon (March-May) rainfall period
contributes approximately 12% of the annual total rainfall in our study area (Figure 1). During the pre-monsoon season (PMS), there is relatively little in-fluence of large-scale atmospheric phenomena like the monsoon. It is therefore an appropriate period to theoretically investigate how urban land-cover could affect precipitation in the study region. PMS rainfall is also poorly studied in the literature be-cause of the dominant influence of the monsoon.
The PMS rainfall is characterized by local to re-gional forcing: i) deep convection resulting from the dryline, and ii) convection initiated at mesoscale boundaries (e.g. sea-breeze front (Lohar, 1993). Sad-hukhan et al. (2000) showed that PMS rainfall vari-ability is dependant on local features. An increase in PMS precipitation was noted in the 1970’s and afterwards. Previous studies have theorized that land-cover dynamics related to deforestation (Sad-hukhan et al. 2000) and irrigation (Lohar and Pal, 1995) could describe precipitation changes, yet the limited studies have been contradictory or lacked
robustness. Further, none of these studies consid-ered the influence of urban-related land-cover.
b. Research Objectives and HypothesesThe overarching research objectives of this study
are: (1) To identify possible relationships between urban land-cover dynamics and pre-monsoon sea-son rainfall variability, (2) To project how the urban land-cover of Kolkata will grow in the next 25 years (using a cellular automata growth model, SLEUTH), and (3) To assess, using a coupled atmosphere-land surface modeling system how past, current, and future urban land-cover in Kolkata influences pre-monsoonal precipitation. Herein, we focus primar-ily on research objective one and offer insight into the direction of our research for the subsequent ob-jectives.
The hypothesis underlying the first objective is that PMS rainfall at urban Kolkata stations have trended upward due to increased urban land-cover dynamics. Figure 2 is preliminary work suggesting that the urban recording station exhibits an upward trend in pre-monsoon season rainfall while other regional stations do not. This is particularly interest-ing since there is also no trend in the regional pre-monsoon rainfall of the East Gangetic area (Fig. 3).
2. Data
For the first objective, the historical maps and satellite images were used to delineate the urban land-cover growth of Kolkata city (e.g., historical paper maps, Landsat images (1990 and 2000), and topographical maps (# 79 B/6 & 79 B/7). The maps
Figure1.Meanmonthlyrainfallforthearea(82-89oE,19-26oN)usingLegatesandWillmott(1990)dataset.
The Dynamic of Urban Growth in Kolkata, India and Potential Impacts on Pre-Monsoon Precipitation
11
ISSUE NO. 28 JUNE 2008 INTERNATIONAL ASSOCIATION FOR URBAN CLIMATE

Urban Projects
Figure2.Timeseriesofpre-monsoonrainfallatcoastal(Contai),urban(Kolkata),andnon-urban(Krishnanagar)stations,withmapofstationlocationsinIndia.
used for the first objective will also be used to pre-pare the layers for the SLEUTH model.
Data from Tropical Rainfall Measuring Mission (TRMM) Multi-Satellite Product, Legates-Willmott surface dataset, and the Indian Meteorological De-partment will be used to examine the spatio-tempo-ral variability of pre-monsoon rainfall. For the third objective data will be acquired from the European Center for Medium Range Weather Forecasting (EC-MWF) to initialize the meteorological conditions for WRF. Standard United States Geological Survey surface characteristics distributed with WRF-NOAH and remote sensing analysis from the previous ob-jectives will be used for land surface initialization.
�. Methods
Table 1 summarizes the methodology used in support of the three research objectives.
Figure3. Timeseriesofarea-averagedpre-monsoonmeanrainfall(mm)fortheEastGangeticregion(1951-1999),usingtheLegatesandWillmott(1990)dataset.
12
ISSUE NO. 28 JUNE 2008 INTERNATIONAL ASSOCIATION FOR URBAN CLIMATE

Urban Projects
Table 1: Summary of methodology in support of research objectives
Objective 1 Digitization and georectification of historical maps and satellite imageryTrend analysis for Kolkata urban land-cover over a 300-year period (time series, decadal trends, etc.) (See Figure 4 and Table 2)Trend analysis of national, East Gangetic, and local (e.g. urban Kolkata, non-urban Kolkata area) pre-monsoonal rainfall over a 50-100 year periodMann-Kendall statistical testing on rainfall data on individual and regional levels to assess significance of trendsStatistical correlation analysis to identify urban land-cover dynamics - PMS relationships
••
•
•
•
Objective 2 Pre-processing of relevant GIS data and layers for SLEUTH cellular automata modeling
Assessment of Kolkata’s past, current, and future land-cover growth and governing factors
•
•
Objective � WRF-NOAH mesoscale modeling simulations under three Kolkata land-cover scenarios: Kol-kata 1950, Kolkata 2000, and Kolkata Future (circa 2025).
Statistical analysis of spatio-temporal changes in pre-monsoon rainfall, convergence, sen-sible/latent heat fluxes, a boundary layer structure as a function of land-cover scenarios. Validation using available data will also be conducted.
•
•
Figure4.DigitizedmapsfromtraditionalcartographicandsatellitesourcesofKolkataillustratingurbanland-covergrowthinphases.
1�
ISSUE NO. 28 JUNE 2008 INTERNATIONAL ASSOCIATION FOR URBAN CLIMATE

Urban Projects
4. Significance of Research
The study represents possibly the most thor-ough spatio-temporal evaluation of Kolkata’s urban dynamics, spanning several centuries and one of the first studies investigating effects of Kolkata on PMS rainfall. The study represents one of the first at-tempts to use the urban growth model, SLEUTH on any city in India. The use of this model will help oth-ers to conduct similar application on cities around the world, which are as flat as Kolkata (<10 meters). The knowledge gained regarding the future growth of the city will benefit the government, the real estate industry and even the common people im-mensely as all development decisions can be taken keeping the direction of future growth in mind. Fi-nally, the study is providing a prototype methodol-ogy for studying future urban land-cover growth scenarios and how they will affect hydroclimates in developing countries.
ReferencesChakraborty S.C. 1990. The growth of Calcutta in the twentieth century. In S. Chaudhuri, ed. Calcutta: The Living City. Calcutta: Oxford University Press, 1-14.Legates, D. R., and C. J. Willmott, 1990: Mean sea-sonal and spatial variability in global surface air temperature. Theor. Appl. Climatol., 41, 11-21.Lohar D. 1993. Sea breeze circulation over south West Bengal. Ph.D. Thesis. Indian Institute of Tech-nology, Kharagpur, p 153.Lohar D and B. Pal. 1995. The effect of irrigation on premonsoon season precipitation over South West Bengal, India. Journal of Climate. �. pp 2567-2570.
Oke, T.R. 1987. Boundary Layer Climates. Routledge Publishing.Roy A. 2003. City Requiem, Calcutta: gender and the politics of poverty. University of Minneapolis Press.Sadhukhan I., D. Lohar and D.K. Pal. 2000. Studies on recent changes in premonsoon season climatic vari-ables over Gangetic west Bengal and its surround-ings, India. Atmosfera 1�, pp. 261-270.Shepherd, J.M., 2005: A review of current investiga-tions of urban-induced rainfall and recommenda-tions for the future. Earth Interactions, �, 1-27.Trenberth, K.E., P.D. Jones, P. Ambenje, R. Bojariu, D. Easterling, A. Klein Tank, D. Parker, F. Rahimzadeh, J.A. Renwick, M. Rusticucci, B. Soden, P. Zhai 2007. Observations: Surface and Atmospheric Climate Change. In: Climate Change 2007: The Physical Science Basis. Contribution of Working Group I to the Fourth Assessment Report of the Intergovernmental Panel on Climate Change [Solomon S, Qin D, Manning M, Chen Z, Marquis M, Averyt KB, Tignor M, Miller HL(eds.)]. Cambridge University Press, Cambridge, United Kingdom and New York, NY, USA.
Table 2: Time series of urban land area change for Kolkata (square kilometers).
Years Total Area (sq. km) Change in area Sq. km change/year
Before 17�6 3.46
17�6-17�� 33.57 30.11 0.8137
17��-1��6 135.88 102.31 1.6239
1��6-1�47 361.27 225.39 2.4768
1�47-1��0 1363.36 1002.09 23.3044
1��0-2000 1658.12 294.76 29.476
Chandana Mitra*J. Marshall Shepherd
Thomas R. Jordan
Geography DepartmentUniversity of Georgia
Athens, Georgia 30602, USA* [email protected]
14
ISSUE NO. 28 JUNE 2008 INTERNATIONAL ASSOCIATION FOR URBAN CLIMATE

Urban Projects 1�
ISSUE NO. 28 JUNE 2008 INTERNATIONAL ASSOCIATION FOR URBAN CLIMATE
The need for an urban climatology applied design model
Urban climatology research has provided a good appreciation of topics such as energy budget mod-els, classifications of urban layers, field measure-ments and simulations (Landsberg, 1973; Oke, 1984; Golany, 1996; Eliasson, 2000; Arnfield, 2003; and Oke, 2006). Many studies have carried out excellent work from the physical, mathematical and meteoro-logical points of view. However, much less work has been done with respect to applied urban climatol-ogy experiments and methodologies, planning and design (Fathy, 1973; Rahamimoff, 1984; Bitan, 1988; Pearlmutter et al., 1999; Nikolopoulou and Steemrs, 2003; and Ali-Toudert and Mayer, 2007).
There is a requirement for a much broader mul-tidisciplinary approach that includes groups such as architects, landscapers, urban designers, plan-ners, econo-sociologists and psychologists. Such an approach would, for example, not only be able to model an urban canyon’s complete energy bal-ance but also quantify the design benefits of this model in terms of urban thermal comfort, energy saving and climate change. The need is for a model that translates all of the passive solar design knowl-edge, urban heat island mitigation methodologies and precedents experience to the urban realm and the actual construction regulations, to the develop-ments of communities and urban growth - an ordi-nance to regulate the fabric form that is capable of enhancing the canopy layer climate by delivering opportunities for people to obtain their own ther-mal comfort. The need is for an urban climatology planning and applied design model.
Such a model should illustrate the dimensions and relationships between fabric proportions, as-pect ratios, and closure ratios of clusters. Also the pattern types, such as those shown in Figures 1 and 2, are dependent on the function of the pattern. For example, should it be residential then specific population densities could be estimated. The im-portance of population density in urban planning relates to urban heat island mitigation to provide a certain quality of life (Harlen et al, 2006). Finally the integration between fabric and vegetation, includ-ing urban trees, is a key consideration in many cas-es. A passive urban design technique would involve positioning particular types of trees in city zones and structuring the public green areas to embed
them into the whole pattern. An urban climate de-sign model is thus an interaction between specific passive tools and the expected urban form – as out-lined in Figure 3.
Correspondingreadings:
Ali-Toudert, F. (2005). Dependence of Out Door Thermal Comfort on the Street Design in Hot and Dry Climate. PhD Thesis, Institute of Meteorology, Freiburg, Germany.Ali-Toudert, F., and Mayer, H. (2007). Thermal comfort in an east-west oriented street canyon in Freiburg (Germany) under hot summer conditions. Theoreti-cal and Applied Climatology �7(1-4), 223-237.Arnfield, A. J. (2003). Two Decades of Urban Climate Research: A review of Turbulence, Exchange of En-ergy, Water and the urban heat islands. International Journal of Climatology 2�(1), 1-26.Bitan, A. (1988). The Methodology of Applied Clima-tology in Planning and Building. Energy and Build-ings 11(1), 1-10.Eliasson, I. (2000). The use of climate knowledge in urban planning. Landscape and urban planning 4�(1-2), 31-44. Fathy, H. (1973). Architecture for the Poor: An Exper-
Figure 2 Centre and main urban space of Al-GournaVillageformthe1960s(Fathy,1973).
Figure1.Centreandmainaxestotheparkofthefirstgardencity,Hampstead(1909).Source: Google© 2008

Urban Projects
Physical EnvironmentDesign and Life Cycle 1
23
8
4
5
6
7 9
10
GrowthInner heartsregeneration
Publicparticipation
from step1-9
Urban planningand design
methodologyDesign
principles forpattern spaces
& fabric
Design modeland procedurefor alternatives
Check for aimsand objectives
Designproduct
Development
Impactassessment & urban
managementfrom step 1-9
Urban planningtheory
Physical & spatialform
16
ISSUE NO. 28 JUNE 2008 INTERNATIONAL ASSOCIATION FOR URBAN CLIMATE
iment in Rural Egypt. University of Chicago Press, Chicago.Golany, G. (1996). Urban design morphology and Thermal performance. Atmospheric Environment �0(3), 455-465.Harlan, S. L., Brazel, A. J., Prashad, L., Stefanov, W. L., and Larsen, L. (2006). Neighborhood microclimates and vulnerability to heat stress. Social science and Medicine 6�(11), 2847-2863.Landsberg, H. (1973). The Meteorologically Utopian City. Bulletin of the American Meteorological Society �4(2), 86-89.Nikolopoulou, M., and Steemers, K. (2003). Thermal comfort and psychological adaptation as a guide for designing urban spaces. Energy and Buildings ��(1), 95-101.Oke, T. R. (1984). Towards a prescription for the greater use of climatic principles in settlement plan-ning. Energy and Buildings 7(1), 1-10.Oke, T. R. (2006). Towards better scientific commu-
nication in urban climate. Theoretical and Applied Climatology �4(1-3), 179-190.Pearlmutter, D., Bitan, A., and Berliner, P. (1999). Mi-croclimatic analysis of ‘compact’ urban canyons in an arid zone. Atmospheric Environment ��(24-25), 4143 - 4150.
Mohamad FahmySchool of Architecture, University of Sheffield,
Sheffield, [email protected]
Steve SharplesHead of the Environmental Research Group, School
of Architecture, University of Sheffield,Sheffield, UK
Figure3.Theneedforthemissingloopofurbanform–aclimatologicallyinterconnecteddesignmodel.
Country Report
Urban Climate Research in HungaryThis is a short summary of the recent urban climate
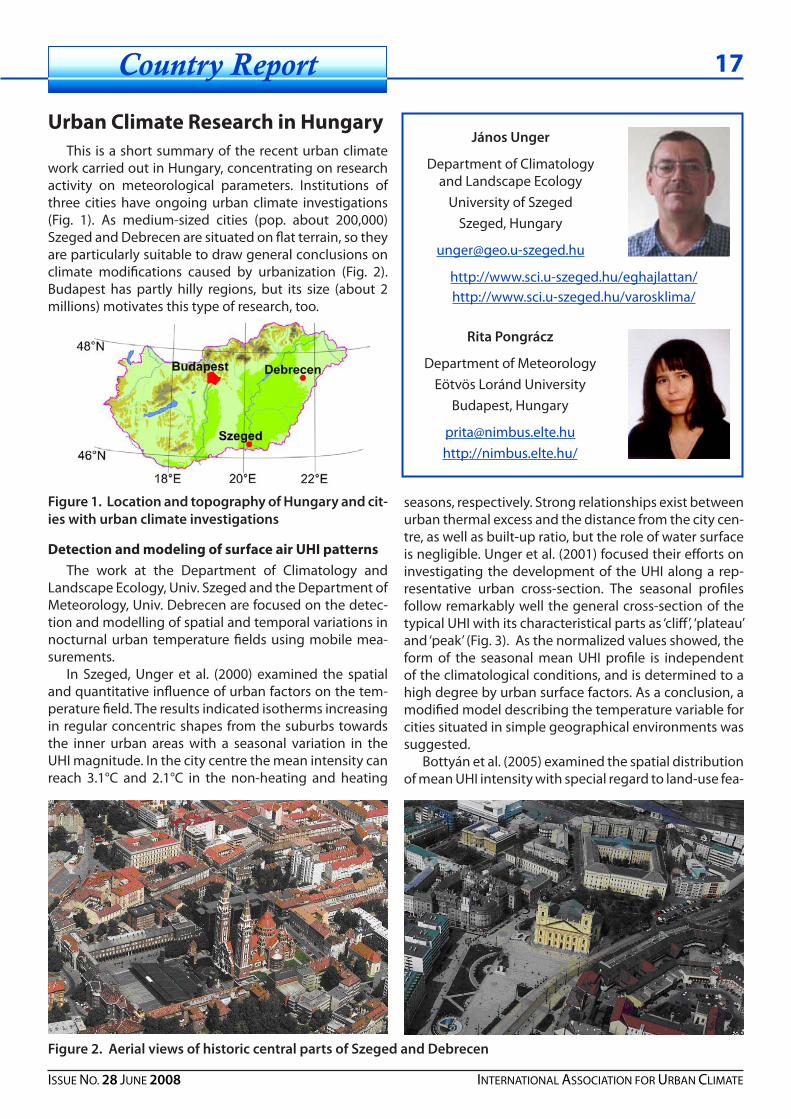
work carried out in Hungary, concentrating on research activity on meteorological parameters. Institutions of three cities have ongoing urban climate investigations (Fig. 1). As medium-sized cities (pop. about 200,000) Szeged and Debrecen are situated on flat terrain, so they are particularly suitable to draw general conclusions on climate modifications caused by urbanization (Fig. 2). Budapest has partly hilly regions, but its size (about 2 millions) motivates this type of research, too.
Detection and modeling of surface air UHI patternsThe work at the Department of Climatology and
Landscape Ecology, Univ. Szeged and the Department of Meteorology, Univ. Debrecen are focused on the detec-tion and modelling of spatial and temporal variations in nocturnal urban temperature fields using mobile mea-surements.
In Szeged, Unger et al. (2000) examined the spatial and quantitative influence of urban factors on the tem-perature field. The results indicated isotherms increasing in regular concentric shapes from the suburbs towards the inner urban areas with a seasonal variation in the UHI magnitude. In the city centre the mean intensity can reach 3.1°C and 2.1°C in the non-heating and heating
JánosUnger
Department of Climatology and Landscape Ecology
University of SzegedSzeged, Hungary
seasons, respectively. Strong relationships exist between urban thermal excess and the distance from the city cen-tre, as well as built-up ratio, but the role of water surface is negligible. Unger et al. (2001) focused their efforts on investigating the development of the UHI along a rep-resentative urban cross-section. The seasonal profiles follow remarkably well the general cross-section of the typical UHI with its characteristical parts as ‘cliff’, ‘plateau’ and ‘peak’ (Fig. 3). As the normalized values showed, the form of the seasonal mean UHI profile is independent of the climatological conditions, and is determined to a high degree by urban surface factors. As a conclusion, a modified model describing the temperature variable for cities situated in simple geographical environments was suggested.
Bottyán et al. (2005) examined the spatial distribution of mean UHI intensity with special regard to land-use fea-
http://www.sci.u-szeged.hu/eghajlattan/http://www.sci.u-szeged.hu/varosklima/
RitaPongrácz
Department of MeteorologyEötvös Loránd University
Budapest, Hungary
[email protected]://nimbus.elte.hu/
Figure1.LocationandtopographyofHungaryandcit-ieswithurbanclimateinvestigations
Figure2.AerialviewsofhistoriccentralpartsofSzegedandDebrecen
17
ISSUE NO. 28 JUNE 2008 INTERNATIONAL ASSOCIATION FOR URBAN CLIMATE

Country Report
tures such as built-up ratio and its areal extensions in De-brecen using multiple linear regression analysis. As the measured and predicted mean UHI patterns show, there is an obvious connection between the spatial distribu-tion of urban thermal excess and the examined land-use parameters.
The spatial distribution of the annual mean UHI inten-sity was simulated by a multiple variable empirical mod-el based on temperature and easily determinable urban surface cover datasets (evaluating from Landsat images) for Szeged and Debrecen (Balázs et al., 2008). This model was verified by independent datasets from three other settlements. In order to get some impression on the mean UHI patterns in other cities with no temperature measurements available, the model was extended to the urban areas of four other cities situated in geographi-cal environments similar to that of Szeged and Debre-cen. The main shortcoming of typical empirical models, namely that they are often restricted to a specific loca-tion, is overcome by the obtained model since it is not entirely site-specific, but rather more region-specific.
At the Department of Fluid Mechanics of Technical University in Budapest, Kristóf et al. (2006) adapted a general-purpose CFD software to simulate atmospheric flow induced by the UHI effect. Non-hydrostatic formula-tion of the governing equations has been employed with a realizable k-e turbulent model. Compressibility and thermal stratification effects were taken into account by utilizing a novel system of transformations to the field variables and in addition consequential source terms to the standard set of transport equations. The model was used for simulating UHI circulation in Szeged (Fig. 4). Data on urban surface geometry as well as temperature patterns were taken from on site measurements. The dis-tributions of anthropogenic heat sources and the field variables of flow structure were obtained from the simu-lation model.
Urban surface geometry versus UHIBased on the available scientific literature Unger
(2004) provided a comprehensive review on intra-urban
Figure 3. Seasonal cross-section profiles of the nor-malizedUHIinSzeged
sky view factor (SVF) − temperature relationship. The ob-tained results are rather contradictory. The explanation may be that previous investigations were limited to the central or only specific parts and comparisons were of-ten based on element pairs measured at some selected sites. The study in Szeged utilized a large number of ar-eal means of numerous measurements of SVF and air temperature related to almost a whole city. There was a strong relationship in the intra-urban variations of these variables, that is, urban surface geometry is a significant determining factor of the air temperature distribution in-side a city if the selected scale is appropriate. Therefore, investigation of a sufficient number of appropriate-sized areas covering the largest part of a city or the entire city is needed to draw well-established conclusions on the studied relationship.
The use of high resolution 3D urban raster and vec-tor databases in urban climatology was presented by Gál et al. (2008). Results from the applied vector and raster based methods to the calculation of continuous SVFs showed similar values. Furthermore, they evaluated the relationship between urban geometry, quantified by SVF, and intra-urban nocturnal temperature variations using areal means in the whole urban area of Szeged. The usefulness of using areal means in SVF–temperature relations was confirmed. The vector and the raster ap-proaches to the derivation of areal means of SVF were both shown to be powerful tools to obtain a general pic-ture of the geometrical conditions of an urban environ-ment.
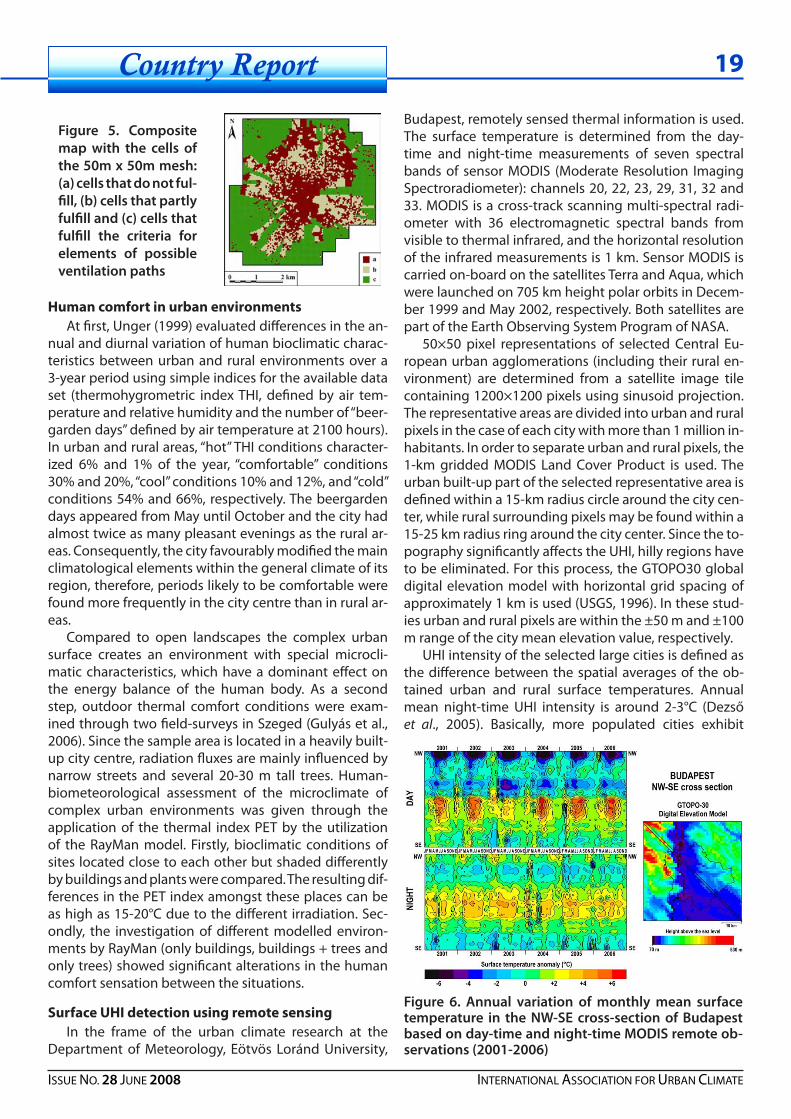
Gál and Unger (2008) presented an urban rough-ness mapping method in a large study area of Szeged. With this procedure the potential ventilation paths of the city can be located. The calculations of the rough-ness parameters were based on a 3D building database; this new approach using the lot area polygons provided more detailed results than other recent studies. The de-tected ventilation paths could play a significant role in the development of the UHI circulation and result in the reduction of air pollution in the central parts of the city (Fig. 5). Based on the results, the areas can be marked out where the city government should keep the advantages of the ventilation paths considering the human comfort aspects of the urban climate.
Figure 4. Cross-section of the 3D velocity field inSzegedobtainedfromthesimulationmodel
1�
ISSUE NO. 28 JUNE 2008 INTERNATIONAL ASSOCIATION FOR URBAN CLIMATE
Country Report
Human comfort in urban environmentsAt first, Unger (1999) evaluated differences in the an-
nual and diurnal variation of human bioclimatic charac-teristics between urban and rural environments over a 3-year period using simple indices for the available data set (thermohygrometric index THI, defined by air tem-perature and relative humidity and the number of “beer-garden days” defined by air temperature at 2100 hours). In urban and rural areas, “hot” THI conditions character-ized 6% and 1% of the year, “comfortable” conditions 30% and 20%, “cool” conditions 10% and 12%, and “cold” conditions 54% and 66%, respectively. The beergarden days appeared from May until October and the city had almost twice as many pleasant evenings as the rural ar-eas. Consequently, the city favourably modified the main climatological elements within the general climate of its region, therefore, periods likely to be comfortable were found more frequently in the city centre than in rural ar-eas.
Compared to open landscapes the complex urban surface creates an environment with special microcli-matic characteristics, which have a dominant effect on the energy balance of the human body. As a second step, outdoor thermal comfort conditions were exam-ined through two field-surveys in Szeged (Gulyás et al., 2006). Since the sample area is located in a heavily built-up city centre, radiation fluxes are mainly influenced by narrow streets and several 20-30 m tall trees. Human-biometeorological assessment of the microclimate of complex urban environments was given through the application of the thermal index PET by the utilization of the RayMan model. Firstly, bioclimatic conditions of sites located close to each other but shaded differently by buildings and plants were compared. The resulting dif-ferences in the PET index amongst these places can be as high as 15-20°C due to the different irradiation. Sec-ondly, the investigation of different modelled environ-ments by RayMan (only buildings, buildings + trees and only trees) showed significant alterations in the human comfort sensation between the situations.
Surface UHI detection using remote sensingIn the frame of the urban climate research at the
Department of Meteorology, Eötvös Loránd University,
Budapest, remotely sensed thermal information is used. The surface temperature is determined from the day-time and night-time measurements of seven spectral bands of sensor MODIS (Moderate Resolution Imaging Spectroradiometer): channels 20, 22, 23, 29, 31, 32 and 33. MODIS is a cross-track scanning multi-spectral radi-ometer with 36 electromagnetic spectral bands from visible to thermal infrared, and the horizontal resolution of the infrared measurements is 1 km. Sensor MODIS is carried on-board on the satellites Terra and Aqua, which were launched on 705 km height polar orbits in Decem-ber 1999 and May 2002, respectively. Both satellites are part of the Earth Observing System Program of NASA.
50×50 pixel representations of selected Central Eu-ropean urban agglomerations (including their rural en-vironment) are determined from a satellite image tile containing 1200×1200 pixels using sinusoid projection. The representative areas are divided into urban and rural pixels in the case of each city with more than 1 million in-habitants. In order to separate urban and rural pixels, the 1-km gridded MODIS Land Cover Product is used. The urban built-up part of the selected representative area is defined within a 15-km radius circle around the city cen-ter, while rural surrounding pixels may be found within a 15-25 km radius ring around the city center. Since the to-pography significantly affects the UHI, hilly regions have to be eliminated. For this process, the GTOPO30 global digital elevation model with horizontal grid spacing of approximately 1 km is used (USGS, 1996). In these stud-ies urban and rural pixels are within the ±50 m and ±100 m range of the city mean elevation value, respectively.
UHI intensity of the selected large cities is defined as the difference between the spatial averages of the ob-tained urban and rural surface temperatures. Annual mean night-time UHI intensity is around 2-3°C (Dezső et al., 2005). Basically, more populated cities exhibit
Figure 5. Compositemap with the cells ofthe50mx50mmesh:(a)cellsthatdonotful-fill,(b)cellsthatpartlyfulfilland(c)cellsthatfulfill the criteria forelements of possibleventilationpaths
Figure 6. Annual variation of monthly mean surfacetemperature in the NW-SE cross-section of Budapestbasedonday-timeandnight-timeMODISremoteob-servations(2001-2006)
1�
ISSUE NO. 28 JUNE 2008 INTERNATIONAL ASSOCIATION FOR URBAN CLIMATE

Country Report
more intense heat islands. Orographical modification, distribution of land cover types of rural surroundings (i.e., portions of cropland, grassland, and forest), and ur-ban air quality disturb this relationship. Analyzing the 6-year-long time series of satellite-based observations, the results suggest that the annual variation of monthly mean UHI intensity is larger in day-time than in night-time (Pongrácz et al., 2006). The most intense UHI effect occurred on summer days when monthly mean UHI in-tensity is around 4-6°C. Direct solar radiation and ther-mal inertia can be considered as possible reasons. UHI intensity is larger in night-time than in day-time in the spring and autumn months, which is in contrast with the summer UHI intensities. This considerable difference can be explained partly by shorter day-time lengths in these equinox seasons than in summer, and partly by the rela-tively high values of air humidity and the often occurring cloudy weather.
Furthermore, spatial structures of the UHI effect be-tween 2001 and 2006 were analyzed and compared depending on seasons (Dezső et al., 2005; Pongrácz et al., 2006). In order to analyze the temporal variation of the UHI structure of the Central European agglomera-tion areas, time series of the monthly mean differences of surface temperature of each pixel and the rural mean along the major cross-sections were compared (Pon-grácz et al., 2006). The characteristic cross-sections were selected on the basis of the representativeness of geo-graphical and orographical features of the cities and their surroundings. In case of Budapest the downtown regions (administrative and commercial center) can be clearly recognized due to the positive anomaly values larger than 5-6°C, and 3-4°C in day-time and night-time, respectively (Fig. 6 ). Annual variation of the monthly mean values is more pronounced in day-time than in night-time. The maximum anomaly occurs in the sum-mer months in both cases. The difference between the warmest and the coldest surface temperature exceeds 15°C in summer. The western part of the city is hilly and covered by forests, so its surface is relatively cold (Fig. 7). The downtown area (located on the left bank of the river Danube and characterized by 25-30 m high build-ings from the late 19th century), can become very hot on summer days.
References
Balázs B, Unger J, Gál T, Sümeghy Z, Geiger J and Szegedi S, 2008: Simulation of the mean urban heat island using 2D sur-face parameters: empirical modeling, verification and exten-sion. Meteorological Applications (accepted)Bottyán Z, Kircsi A, Szegedi S and Unger J, 2005: The relation-ship between built-up areas and the spatial development of the mean naximum urban heat island in Debrecen, Hungary. Int Journal of Climatology 2�, 405-418Dezső Zs, Bartholy J and Pongrácz R, 2005: Satellite-based analysis of the urban heat island effect. Időjárás 10�, 217-232Gál T, Lindberg F and Unger J, 2008: Computing continuous sky view factor using 3D urban raster and vector data bases: comparison and application to urban climate. Theoretical and Applied Climatology doi:10.1007/s00704-007-0362-9Gál T and Unger J, 2008: Detection of ventilation paths us-ing high-resolution roughness parameter mapping in a large urban area. Building and Environment doi:10.1016/j.buildenv.2008.02.008Gulyás Á, Unger J and Matzarakis A, 2006: Assessment of the microclimatic and human comfort conditions in a complex urban environment: modelling and measurements. Building and Environment 41, 1713-1722Kristóf G, Bányai T and Rácz N, 2006: Development of com-putational model for urban heat island convection using general purpose CFD solver. Preprints 6th Int Conf on Urban Climate, Göteborg, Sweden, 822-825Pongrácz R, Bartholy J and Dezső Zs, 2006: Remotely sensed thermal information applied to urban climate analysis. Ad-vances in Space Research �7, 2191-2196Unger J, 1999: Comparisons of urban and rural bioclimato-logical conditions in the case of a Central-European city. Int Journal of Biometeorology 4�, 139-144Unger J, 2004: Intra-urban relationship between surface ge-ometry and urban heat island: review and new approach. Cli-mate Research 27, 253-264Unger J, Bottyán Z, Sümeghy Z and Gulyás Á, 2000: Urban heat island development affected by urban surface factors. Időjárás 104, 253-268Unger J, Sümeghy Z and Zoboki J, 2001: Temperature cross-section features in an urban area. Atmospheric Research ��, 117-127United States’ Geological Survey (USGS), 1996: GTOPO30 documentation.
Figure7.PanoramaofBudapestwithhillywesternpartsandflateasternparts
20
ISSUE NO. 28 JUNE 2008 INTERNATIONAL ASSOCIATION FOR URBAN CLIMATE

Conferences
Upcoming Conferences. . .
CLIMATECHANGEANDURBANDESIGNThe Third International C.E.U. CongressOslo, Norway • 14-16 September 2008http://www.ceunet.org
PASSIVE&LOW-ENERGYARCHITECTURE25th PLEA International ConferenceDublin, Ireland • 22-24 October 2008http://www.plea2008.org
21
ISSUE NO. 28 JUNE 2008 INTERNATIONAL ASSOCIATION FOR URBAN CLIMATE

Conferences
Upcoming Conferences. . .
URBANWEATHER&CLIMATE:NOWANDTHEFUTUREAMS 89th Annual MeetingPhoenix, Arizona, USA • 11–15 January 2009http://www.ametsoc.org/meet/annual/index.html
The meeting will include a special symposium in honor of IAUC past president, Prof. Tim Oke.
For additional information, please contact Sue Grimmond ([email protected]).
22
ISSUE NO. 28 JUNE 2008 INTERNATIONAL ASSOCIATION FOR URBAN CLIMATE

Conferences
Upcoming Conferences. . .
URBANISATIONANDCLIMATECHANGE31st International Geographical Congress Tunis • 12-15 August 2008(http://www.igc-tunis2008.com/)
This congress will include the theme of “Urbanisation and Climate Change” as part of a special inter-disciplinary session which is being co-sponsored by IAUC.
2�
ISSUE NO. 28 JUNE 2008 INTERNATIONAL ASSOCIATION FOR URBAN CLIMATE

Bibliography 24
ISSUE NO. 28 JUNE 2008 INTERNATIONAL ASSOCIATION FOR URBAN CLIMATE
Recent publications in UrbanClimatologyDe´Donato, F. & Perucci, C. (2008), Airport and city-cen-tre temperatures in the evaluation of the association be-tween heat and mortality, International Journal of Biome-teorology �2(4), 301-310.
Aghemo, C.; Pellegrino, A. & LoVerso, V. (2008), The ap-proach to daylighting by scale models and sun and sky simulators: A case study for different shading systems, Building and Environment 4�(5), 917-927.
Alexandri, E. & Jones, P. (2008), Temperature decreases in an urban canyon due to green walls and green roofs in diverse climates, Building and Environment 4�(4), 480-493.
de Almeida Castanho, A.D.; Martins, J.V. & Artaxo, P. (2008), MODIS Aerosol Optical Depth Retrievals with high spatial resolution over an Urban Area using the Critical Reflectance, J. Geophys. Res. 11�, D02201.
Alpert, P. & Kishcha, P. (2008), Quantification of the effect of urbanization on solar dimming, Geophys. Res. Lett. ��, L08801.
Alvarado, J. & Martínez, E. (2008), Passive cooling of ce-ment-based roofs in tropical climates, Energy and Build-ings 40(3), 358-364.
Andrade, H. (2008), Microclimatic variation of thermal comfort in a district of Lisbon (Telheiras) at night, Theo-retical and Applied Climatology �2(3-4), 225-237.
Arthur J. Horowitz, K.A.E. (2008), Monitoring urban im-pacts on suspended sediment, trace element, and nutri-ent fluxes within the City of Atlanta, Georgia, USA: pro-gram design, methodological considerations, and initial results, Hydrological Processes 22(10), p 1473-1496.
Barzyk, T.M. & Frederick, J.E. (2008), A Semiempirical Mi-croscale Model of the Surface Energy Balance and Its Application to Two Urban Rooftops, Journal of Applied Meteorology and Climatology 47(3), 819--834.
Beig, G.; Ghude, S.D.; Polade, S.D. & Tyagi, B. (2008), Threshold exceedances and cumulative ozone exposure indices at tropical suburban site, Geophys. Res. Lett. ��, L02802.
Bein, K.J.; Zhao, Y.; Johnston, M.V. & Wexler, A.S. (2008), In-teractions between boreal wildfire and urban emissions, J. Geophys. Res. 11�, D07304.
Benson, J.; Ziehn, T.; Dixon, N. & Tomlin, A. (2008), Global sensitivity analysis of a 3-dimensional street canyon model, Part II: Application and physical insight using sensitivity analysis, Atmospheric Environment 42(8), 1874-1891.
Bi, X. & Fu, J. (2008), Composition and major sources of organic compounds in urban aerosols, Atmospheric Re-
Thanks to everyone for their contribution. Papers published up until June 2008 are listed here. Micro-meteorologists, designers and modelers sure will find interesting top-ics in this edition.
Soon we will be putting together the complete ‘Urban Climate’ bibliography for the period 2005-2007 for publication on the IAUC website. All readers are invited to send any peer-reviewed references to be included in this database.
Papers published since June 1, 2008 are welcome for inclusion in the next newsletter.
Please note that my e-mail has changed and from now on send your references to [email protected] with a header “IAUC pub-lications” and the following format:
Author:
Title:
Journal:
Volume:
Pages:
Dates:
Keywords:
Language:
Abstract:
Happy reading,
Julia Hidalgo

Bibliography 2�
ISSUE NO. 28 JUNE 2008 INTERNATIONAL ASSOCIATION FOR URBAN CLIMATE
search 88(3-4), 256-265.
Brooks, H.E.; III, C.A.D. & Sutter, D. (2008), Low-Level Winds in Tornadoes and Potential Catastrophic Tornado Impacts in Urban Areas, Bulletin of American Meteorologi-cal Society ��, 87-90.
Carlson, J.D. & Arndt, D.S. (2008), The Oklahoma Disper-sion Model: Using the Gaussian Plume Model as an Op-erational Management Tool for Determining Near-Sur-face Dispersion Conditions across Oklahoma, Journal of Applied Meteorology and Climatology 47(2), 462--474.
Christen, A.; van Gorsel, E. & Vogt, R. (2007), Coherent structures in urban roughness sublayer turbulence, In-ternational Journal of Climatology 27(14), 1955-1968.
Chu, C. & Lin, I. (2008), Ambient air dry deposition and ionic species analysis by using various deposition collec-tors in Shalu, central Taiwan, Atmospheric Research ��(3-4), 212-223.
Chun, C.; Kwok, A.; Mitamura, T.; Miwa, N. & Tamura, A. (2008), Thermal diary: Connecting temperature history to indoor comfort, Building and Environment 4�(5), 877-885.
Clerbaux, C.; Edwards, D.P.; Deeter, M.; Emmons, L.; La-marque, J.; Tie, X.X.; Massie, S.T. & Gille, J. (2008), Carbon monoxide pollution from cities and urban areas ob-served by the Terra/MOPITT mission, Geophys. Res. Lett. ��, L03817.
Coceal, O.; Dobre, A. & Thomas, T.G. (2007), Unsteady dy-namics and organized structures from DNS over an ide-alized building canopy, International Journal of Climatol-ogy 27(14), 1943-1953.
Dameng, L.; Shaopeng, G. & Xianghua, A. (2008), Distri-bution and source apportionment of Polycyclic aromatic hydrocarbons from atmospheric particulate matter PM2.5 in Beijing, Advances in Atmospheric Sciences 2�(2), 297-305.
Duan, J. & Hao, J. (2008), Concentration, sources and ozone formation potential of volatile organic com-pounds (VOCs) during ozone episode in Beijing, Atmo-spheric Research ��(1), 25-35.
Emmanuel, R.; Rosenlund, H. & Johansson, E. (2007), Ur-ban shading - a design option for the tropics? A study in Colombo, Sri Lanka, International Journal of Climatology 27(14), 1995-2004.
Esen, F. & Vardar, N. (2008), Atmospheric concentrations of PAHs, their possible sources and gas-to-particle parti-tioning at a residential site of Bursa, Turkey, Atmospheric Research 88(3-4), 253-245.
Ferguson, G. & Woodbury, A.D. (2007), Urban heat island in the subsurface, Geophys. Res. Lett. �4, L23713.
Gokhale, S. & Raokhande, N. (2008), Performance evalua-
tion of air quality models for predicting PM10 and PM2.5 concentrations at urban traffic intersection during win-ter period, Science of The Total Environment ��4(1), 9-24.
de Gouw, J.A.; Brock, C.A.; Atlas, E.L.; Bates, T.S.; Fehsen-feld, F.C.; Goldan, P.D.; Holloway, J.S.; Kuster, W.C.; Lerner, B.M.; Matthew, B.M.; Middlebrook, A.M.; Onasch, T.B.; Peltier, R.E.; Quinn, P.K.; Senff, C.J.; Stohl, A.; Sullivan, A.P.; Trainer, M.; Warneke, C.; Weber, R.J. & Williams, E.J. (2008), Sources of particulate matter in the northeastern United States in summer: 1. Direct emissions and secondary for-mation of organic matter in urban plumes, J. Geophys. Res. 11�, D08301.
Grossman-Clarke, S.; Liu, Y.; Zehnder, J.A. & Fast, J.D. (2008), Simulations of the Urban Planetary Boundary Layer in an Arid Metropolitan Area, Journal of Applied Meteorology and Climatology 47(3), 752--768.
Gurjar, B.; Butler, T.; Lawrence, M. & Lelieveld, J. (2008), Evaluation of emissions and air quality in megacities, At-mospheric Environment 42(7), 1593-1606.
Hacker, J.N.; Saulles, T.D.; Minson, A. & Holmes, M. (2008), Embodied and operational carbon dioxide emissions from housing: A case study on the effects of thermal mass and climate change, Energy and Buildings 40(3), 375-384.
Hamdi, R. (2008), Sensitivity study of the urban heat is-land intensity to urban characteristics, International Jour-nal of Climatology 2�(7), 973-982.
Henninger, S. (2008), Analysis of near surface CO2 vari-ability within the urban area of Essen, Germany, Meteo-rologische Zeitschrift 17(1), 19-27.
Ihara, T. & Kondo, H. (2008), Changes in year-round air temperature and annual energy consumption in office building areas by urban heat-island countermeasures and energy-saving measures, Applied Energy ��(1), 12-25.
J. H. C. Gash, P.T.W.R. (2008), A note on estimating urban roof runoff with a forest evaporation model, Hydrological Processes 22(8), 1230-1233.
Jacobson, M.; Kaufman, Y.J. & Rudich, Y. (2007), Examin-ing feedbacks of aerosols to urban climate with a model that treats 3-D clouds with aerosol inclusions, J. Geophys. Res. 112, D24205.
Jia, C.; Batterman, S. & Godwin, C. (2008), VOCs in indus-trial, urban and suburban neighborhoods, Part 2: Factors affecting indoor and outdoor concentrations, Atmo-spheric Environment 42(9), 2101-2116.
Kalkstein, L.S.; Greene, J.S.; Mills, D.M.; Perrin, A.D.; Sa-menow, J.P. & Cohen, J. (2008), Analog European Heat Waves for U.S. Cities to Analyze Impacts on Heat-Related Mortality, Bulletin of American Meteorological Society ��, 75-85.

Bibliography 26
ISSUE NO. 28 JUNE 2008 INTERNATIONAL ASSOCIATION FOR URBAN CLIMATE
Kanaya, Y.; Fukuda, M.; Akimoto, H.; Takegawa, N.; Kom-azaki, Y.; Yokouchi, Y.; Koike, M. & Kondo, Y. (2008), Urban photochemistry in central Tokyo: 2. Rates and regimes of oxidant (O3 + NO2) production, J. Geophys. Res. 11�, D06301.
Kaskaoutis, D.G. & Kambezidis, H.D. (2008), The role of aerosol models of the SMARTS code in predicting the spectral direct-beam irradiance in an urban area, Renew-able Energy ��(7), 1532-1543.
Kawai, T.; Kanda, M.; Narita, K. & A, H. (2007), Validation of a numerical model for urban energy-exchange using outdoor scale-model measurements, International Jour-nal of Climatology 27(14), 1931-1942.
Kim, Y. (2008), Does the restoration of an inner-city stream in Seoul affect local thermal environment?, Theo-retical and Applied Climatology �2(3-4), 239-248.
Klein, P.; Leitl, B. & Schatzmann, M. (2007), Driving physi-cal mechanisms of flow and dispersion in urban cano-pies, International Journal of Climatology 27(14), 1887-1907.
Kuttler, W.; Weber, S.; Schonnefeld, J. & Hesselschwerdt, A. (2007), Urban/rural atmospheric water vapour pres-sure differences and urban moisture excess in Krefeld, Germany, International Journal of Climatology 27(14), 2005-2015.
Lee, H. & Kim, Y. (2008), Source identification of PM2.5 particles measured in Gwangju, Korea, Atmospheric Re-search ��(3-4), 199-211.
Lemonsu, A.; B&eacute;lair, S.; Mailhot, J.; Benjamin, M.; Chagnon, F.; Morneau, G.; Harvey, B.; Voogt, J. & Jean, M. (2008), Overview and First Results of the Montreal Ur-ban Snow Experiment 2005, Journal of Applied Meteorol-ogy and Climatology 47(1), 59--75.
Lin, C.; Chen, W.; Liu, S.; Liou, Y.; Liu, G. & Lin, T. (2008), Nu-merical study of the impact of urbanization on the pre-cipitation over Taiwan, Atmospheric Environment 42(13), 2934-2947.
Lin, C.; Xia, Q. & Calhoun, R. (2008), Retrieval of Urban Boundary Layer Structures from Doppler Lidar Data. Part II: Proper Orthogonal Decomposition, Journal of Atmo-spheric Sciences 6�, 21-42.
Lin, Z. & Deng, S. (2008), A study on the thermal comfort in sleeping environments in the subtropics?Measuring the total insulation values for the bedding systems com-monly used in the subtropics, Building and Environment 4�(5), 905-916.
Lundquist, J.K. & Mirocha, J.D. (2008), Interaction of Noc-turnal Low-Level Jets with Urban Geometries as Seen in Joint Urban 2003 Data, Journal of Applied Meteorology and Climatology 47(1), 44--58.
Martano, P. (2008), Inverse Parameter Estimation of the
Turbulent Surface Layer from Single-Level Data and Sur-face Temperature, Journal of Applied Meteorology and Cli-matology 47(4), 1027--1037.
Martilli, A. (2007), Current research and future challenges in urban mesoscale modelling, International Journal of Climatology 27(14), 1909-1918.
Mills, G. (2007), Cities as agents of global change, Inter-national Journal of Climatology 27(14), 1849-1857.
Mochida, M.; Miyakawa, T.; Takegawa, N.; Morino, Y.; Kawamura, K. & Kondo, Y. (2008), Significant alteration in the hygroscopic properties of urban aerosol particles by the secondary formation of organics,, Geophys. Res. Lett. ��, L02804.
Montávez, J.P.; González-Rouco, J.F. & F, V. (2008), A sim-ple model for estimating the maximum intensity of noc-turnal urban heat Island, International Journal of Clima-tology 2� (2), 235-242.
Nielsen-Gammon, J.W.; Powell, C.L.; Mahoney, M.J.; An-gevine, W.M.; Senff, C.; White, A.; Berkowitz, C.; Doran, C. & Knupp, K. (2008), Multisensor Estimation of Mixing Heights over a Coastal City, Journal of Applied Meteorol-ogy and Climatology 47(1), 27--43.
Oleson, K.W.; Bonan, G.B.; Feddema, J. & Vertenstein, M. (2008), An Urban Parameterization for a Global Climate Model. Part II: Sensitivity to Input Parameters and the Simulated Urban Heat Island in Offline Simulations, Jour-nal of Applied Meteorology and Climatology 47(4), 1061--1076.
Oleson, K.W.; Bonan, G.B.; Feddema, J.; Vertenstein, M. & Grimmond, C.S.B. (2008), An Urban Parameterization for a Global Climate Model. Part I: Formulation and Evalu-ation for Two Cities, Journal of Applied Meteorology and Climatology 47(4), 1038--1060.
Ooka, R. (2007), Recent development of assessment tools for urban climate and heat-island investigation especial-ly based on experiences in Japan, International Journal of Climatology 27(14), 1919-1930.
Oxizidis, S.; Dudek, A. & Papadopoulos, A. (2008), A com-putational method to assess the impact of urban climate on buildings using modeled climatic data., Energy and Buildings 40(3), 215-223.
Panicker, A.; Pandithurai, G.; Safai, P.D. & Kewat, S. (2008), Observations of enhanced aerosol longwave radiative forcing over an urban environment, Geophys. Res. Lett. ��, L04817.
Pigeon, G.; D, L.; Durand, P. & Masson, V. (2007), Anthro-pogenic heat release in an old European agglomeration (Toulouse, France), International Journal of Climatology 27(14), 1969-1981.
Rantala, J. & Leivo, V. (2008), Thermal, moisture and mi-crobiological boundary conditions of slab-on-ground

Bibliography 27
ISSUE NO. 28 JUNE 2008 INTERNATIONAL ASSOCIATION FOR URBAN CLIMATE
structures in cold climate, Building and Environment 4�(5), 736-744.
Rigo, G. & Parlow, E. (2007), Modelling the ground heat flux of an urban area using remote sensing data, Theo-retical and Applied Climatology �0(3-4), 185-199.
Roth, M. (2007), Review of urban climate research in (sub)tropical regions, International Journal of Climatol-ogy 27(14), 1859-1873.
Roy Bhowmik, S.K. (2008), Air temperature variation with time and thermally evaluated atmospheric conditions correlated with land use change in urban areas of Japan, International Journal of Climatology 2�(6), 789-795.
Santana, L. (2007), Landsat ETM+ image applications to extract information for environmental planning in a Colombian city, International Journal of Remote Sensing 2�(19), 4225-4242.
Santiago, J. & Martín, F. (2008), SLP-2D: A new Lagrangian particle model to simulate pollutant dispersion in street canyons, Atmospheric Environment 42(17), 3927-3936.
Schichtel, B.A.; Malm, W.C.; Bench, G.; Fallon, S.; McDade, C.E.; Chow, J.C. & Watson, J.G. (2008), Fossil and contem-porary fine particulate carbon fractions at 12 rural and urban sites in the United States, J. Geophys. Res. 11�, D02311.
Shitzer, A. (2008), Transient Analysis of Cold Winds on Ex-posed Skin: Reflections on the Assessment of Wind Chill Equivalent Temperatures, Journal of Applied Meteorology and Climatology 47(3), 917--924.
Tham, Y. & Sakugawa, H. (2008), Polycyclic aromatic hy-drocarbons (PAHs) associated with atmospheric parti-cles in Higashi Hiroshima, Japan: Influence of meteoro-logical conditions and seasonal variations, Atmospheric Research ��(3-4), 224-233.
Thorsson, S.; Lindberg, F.; Eliasson, I. & Holmer, B. (2007), Different methods for estimating the mean radiant tem-perature in an outdoor urban setting, International Jour-nal of Climatology 27(14), 1983-1993.
Tsunematsu, N.; Nagai, T.; Murayama, T.; Adachi, A. & Mu-rayama, Y. (2008), Volcanic Ash Transport from Mount Asama to the Tokyo Metropolitan Area Influenced by Large-Scale Local Wind Circulation, Journal of Applied Meteorology and Climatology 47(4), 1248--1265.
Voogt, J. (2008), Assessment of an Urban Sensor View Model for thermal anisotropy, Remote Sensing of Environ-ment 112(2), 482-495.
Weng, Q. & Lu, D. (2008), A sub-pixel analysis of urbaniza-tion effect on land surface temperature and its interplay with impervious surface and vegetation coverage in In-dianapolis, United States, International Journal of Applied Earth Observation and Geoinformation 10, 68-83.
Wray, C. & Akbari, H. (2008), The effects of roof reflectance
on air temperatures surrounding a rooftop condensing unit., Energy and Buildings 40(1), 11-28.
Xia, Q.; and R. Calhoun, C.L.L. & Newsom, R.K. (2008), Re-trieval of Urban Boundary Layer Structures from Doppler Lidar Data. Part I: Accuracy Assessment, Journal of Atmo-spheric Sciences 6�, 3-20.
Xian, G. (2007), Analysis of impacts of urban land use and land cover on air quality in the Las Vegas region using re-mote sensing information and ground observations, In-terational Journal of Remote Sensing 2�(24), 5427-5445.
Yilmaz, Z. & Kundakci, A. (2008), An approach for energy conscious renovation of residential buildings in Istanbul by Trombe wall system, Building and Environment 4�(4), 508-517.
Yu, B.; Z.Chen; Shang, P. & Yang, J. (2008), Study on the influence of albedo on building heat environment in a year-round, Energy and Buildings 40(5), 945-951.
Zeng, N.; Ding, Y.; Pan, J.; Wang, H. & Gregg, J. (2008), SUS-TAINABLE DEVELOPMENT: Climate Change--the Chinese Challenge, Science �1�(5864), 730--731.
Zerefos, S.C. (2007), On the performance of double skin facades in different environmental conditions, Interna-tional Journal of Sustainable Energy 26(4), 221--229.
Zhou, Y. & Levy, J. (2008), The impact of urban street can-yons on population exposure to traffic-related primary pollutants, Atmospheric Environment 42(17), 3087-3098.
Ziehn, T. & Tomlin, A. (2008), Global sensitivity analysis of a 3-dimensional street canyon model Part I: The de-velopment of high dimensional model representations, Atmospheric Environment 42(8), 1857-1873.
This book presents a set of peer-reviewed papers following the NATO Advanced Research Workshop (ARW) “Atmospheric Boundary Layers: Modelling and Applications to Environmental Security” held in Dubrovnik, Croatia in April 2006 (see the ARW website: http://pbl-nato-arw.dmi.dk).
AtmosphericBoundaryLayers:Nature,TheoryandApplicationstoEnvironmentalModelling&Security
Alexander Baklanov and Branko Grisogono, Editors
http://www.springer.com/geosciences/meteorology/book/978-0-387-74318-9
Recently Published . . .
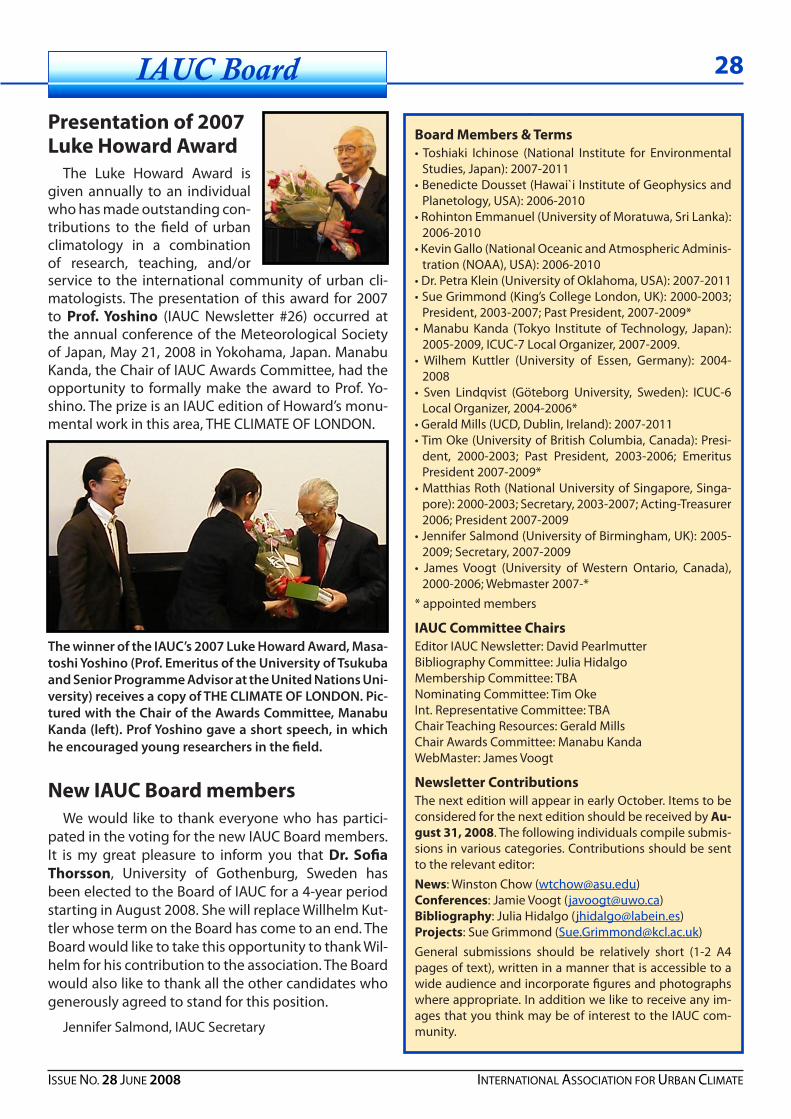
IAUC Board
Presentation of 2007Luke Howard AwardJennifer Salmond, IAUC Secretary
Board Members & Terms• Toshiaki Ichinose (National Institute for Environmental
Studies, Japan): 2007-2011• Benedicte Dousset (Hawai`i Institute of Geophysics and
Planetology, USA): 2006-2010• Rohinton Emmanuel (University of Moratuwa, Sri Lanka):
2006-2010• Kevin Gallo (National Oceanic and Atmospheric Adminis-
tration (NOAA), USA): 2006-2010• Dr. Petra Klein (University of Oklahoma, USA): 2007-2011• Sue Grimmond (King’s College London, UK): 2000-2003;
President, 2003-2007; Past President, 2007-2009*• Manabu Kanda (Tokyo Institute of Technology, Japan):
2005-2009, ICUC-7 Local Organizer, 2007-2009.• Wilhem Kuttler (University of Essen, Germany): 2004-
2008• Sven Lindqvist (Göteborg University, Sweden): ICUC-6
Local Organizer, 2004-2006*• Gerald Mills (UCD, Dublin, Ireland): 2007-2011• Tim Oke (University of British Columbia, Canada): Presi-
dent, 2000-2003; Past President, 2003-2006; Emeritus President 2007-2009*
• Matthias Roth (National University of Singapore, Singa-pore): 2000-2003; Secretary, 2003-2007; Acting-Treasurer 2006; President 2007-2009
• Jennifer Salmond (University of Birmingham, UK): 2005-2009; Secretary, 2007-2009
• James Voogt (University of Western Ontario, Canada), 2000-2006; Webmaster 2007-*
* appointed members
IAUC Committee ChairsEditor IAUC Newsletter: David PearlmutterBibliography Committee: Julia HidalgoMembership Committee: TBANominating Committee: Tim OkeInt. Representative Committee: TBAChair Teaching Resources: Gerald MillsChair Awards Committee: Manabu KandaWebMaster: James Voogt
Newsletter ContributionsThe next edition will appear in early October. Items to be considered for the next edition should be received by Au-gust �1, 200�. The following individuals compile submis-sions in various categories. Contributions should be sent to the relevant editor:News: Winston Chow ([email protected])Conferences: Jamie Voogt ([email protected])Bibliography: Julia Hidalgo ([email protected])Projects: Sue Grimmond ([email protected])General submissions should be relatively short (1-2 A4 pages of text), written in a manner that is accessible to a wide audience and incorporate figures and photographs where appropriate. In addition we like to receive any im-ages that you think may be of interest to the IAUC com-munity.
Presentation of 2007Luke Howard Award
The Luke Howard Award is given annually to an individual who has made outstanding con-tributions to the field of urban climatology in a combination of research, teaching, and/or service to the international community of urban cli-matologists. The presentation of this award for 2007 to Prof. Yoshino (IAUC Newsletter #26) occurred at the annual conference of the Meteorological Society of Japan, May 21, 2008 in Yokohama, Japan. Manabu Kanda, the Chair of IAUC Awards Committee, had the opportunity to formally make the award to Prof. Yo-shino. The prize is an IAUC edition of Howard’s monu-mental work in this area, THE CLIMATE OF LONDON.
ThewinneroftheIAUC’s2007LukeHowardAward,Masa-toshiYoshino(Prof.EmeritusoftheUniversityofTsukubaandSeniorProgrammeAdvisorattheUnitedNationsUni-versity)receivesacopyofTHECLIMATEOFLONDON.Pic-turedwiththeChairoftheAwardsCommittee,ManabuKanda(left).ProfYoshinogaveashortspeech,inwhichheencouragedyoungresearchersinthefield.
New IAUC Board membersWe would like to thank everyone who has partici-
pated in the voting for the new IAUC Board members. It is my great pleasure to inform you that Dr. Sofia Thorsson, University of Gothenburg, Sweden has been elected to the Board of IAUC for a 4-year period starting in August 2008. She will replace Willhelm Kut-tler whose term on the Board has come to an end. The Board would like to take this opportunity to thank Wil-helm for his contribution to the association. The Board would also like to thank all the other candidates who generously agreed to stand for this position.
Jennifer Salmond, IAUC Secretary
2�
ISSUE NO. 28 JUNE 2008 INTERNATIONAL ASSOCIATION FOR URBAN CLIMATE