Urban Climate Newsurban-climate.org/newsletters/IAUC059.pdf · Urban Climate News. As you may have...
30
INTERNATIONAL ASSOCIATION FOR URBAN CLIMATE Urban Climate News Quarterly Newsletter of the IAUC ISSUE NO. 59 MARCH 2016 • Inside the Spring issue... 2 6 12 21 23 30 of the atmosphere and its changes brought about by urb banization, this gave me pause. The petition asks acab demic professional associations: “to measure and report the environmental impact of their conferences; to radib cally reduce the amount of flying needed for conferencb ing; to establish and publish shortb and mediumbterm benchmarks for reductions; and to work with universityb based members to meet key professional objectives in ways that do not require flying and that are sustainable.” The FAQ page associated with the petition provides an extensive collection of material on the environmental imb pact, common misconceptions (for example the authors take on the impact of carbon offsetting) and possible reb sponses by universities and professional associations. It provides interesting reading in its own right and a useful reference list. (...continued on page 30) Colleagues, welcome to the March 2016 issue of the Urban Climate News. As you may have seen from the website or email anb nouncement, the Board has selected New York City as the host city for ICUC-10. ICUCb10 is scheduled for June 2018 at the City University of New York and will again be held jointly with the 14th AMS Symposium on the Urban Environment. This will be the first ICUC to be held in the Americas. The decision was a difficult one as all the finalb ists, which also included Hong Kong, Phoenix, and Singab pore, had very strong proposals and organizing teams, and represent excellent destinations for an urban climate conference. I would like to thank all those members inb volved in the proposals for their efforts and to the Board for their thoughtful discussion and deliberations. Finally, thank you to all the IAUC members who participated in the process by completing the member survey of ICUC locations, which is an important part of the selection prob cess. ICUCb10 has adopted a theme of sustainable coastal urban environments. It recognizes the large urban popub lation who live in coastal areas and who may be particub larly exposed to hazards associated with climate change. The impacts from Superstorm Sandy on the New York area provide some local context for this theme. The importance of climate change and cities is reb flected in this edition of the Urban Climate News: Edward Ng (CUHK) has contributed a feature article “Adapting Asian cities to climate and urban climatic changes” and UCN editor David Pearlmutter has provided a special reb port “Towards net zerobenergy settlements: A European demonstration project”. Also included are two urban project reports by winners in the ICUCb9 student presenb tation competition: Stephanie Jacobs of Monash Univerb sity: “Comparison of modelled thermal comfort during a heatwave in Melbourne Australia”, and Brian Bailey of the University of Utah: “Incorporating resolved vegetation in citybscale simulations of urban micrometeorology and its effect on the energy balance”. Thanks to all our contribub tors in this issue and to editor David Pearlmutter for putb ting it all together. And on the theme of IAUC, ICUC and climate change, I received an email the other day from flyingless.org. It contained a petition initiated in October 2015 that calls upon universities and academic professional associations to greatly reduce their flyingbrelated footprint as part of an effort to cut greenhouse gas emissions. Considering that IAUC is a scientific organization related to the study From the IAUC President − James Voogt, IAUC President [email protected] News: Rising tides? • Smarter birds Earth Hour for cities • Viral warming Feature: Adaptation of Asian cities to climatic changes − A Chinese tale Projects: Simulation of heat waves Urbanbscale modeling of vegetation Special Reports: Demonstrating net zerobenergy settlements in Europe Bibliography: Recent publications Conferences: Upcoming gatherings IAUC Board: Meteorological society honors veteran urban climatologist
Transcript of Urban Climate Newsurban-climate.org/newsletters/IAUC059.pdf · Urban Climate News. As you may have...

INTERNATIONAL ASSOCIATION FOR URBAN CLIMATE
Urban Climate NewsQuarterly Newsletter of the IAUC
ISSUE NO. 59 MARCH 2016 •
Inside the Spring issue...
2
6
12
21
23
30
of the atmosphere and its changes brought about by urbbbanization, this gave me pause. The petition asks acabbdemic professional associations: “to measure and report the environmental impact of their conferences; to radibbcally reduce the amount of flying needed for conferencbbing; to establish and publish shortb and mediumbterm benchmarks for reductions; and to work with universitybbased members to meet key professional objectives in ways that do not require flying and that are sustainable.” The FAQ page associated with the petition provides an extensive collection of material on the environmental imbbpact, common misconceptions (for example the authors take on the impact of carbon offsetting) and possible rebbsponses by universities and professional associations. It provides interesting reading in its own right and a useful reference list. (...continued on page 30)
Colleagues, welcome to the March 2016 issue of the Urban Climate News.
As you may have seen from the website or email anbbnouncement, the Board has selected New York City as the host city for ICUC-10. ICUCb10 is scheduled for June 2018 at the City University of New York and will again be held jointly with the 14th AMS Symposium on the Urban Environment. This will be the first ICUC to be held in the Americas. The decision was a difficult one as all the finalbbists, which also included Hong Kong, Phoenix, and Singabbpore, had very strong proposals and organizing teams, and represent excellent destinations for an urban climate conference. I would like to thank all those members inbbvolved in the proposals for their efforts and to the Board for their thoughtful discussion and deliberations. Finally, thank you to all the IAUC members who participated in the process by completing the member survey of ICUC locations, which is an important part of the selection probbcess.
ICUCb10 has adopted a theme of sustainable coastal urban environments. It recognizes the large urban popubblation who live in coastal areas and who may be particubblarly exposed to hazards associated with climate change. The impacts from Superstorm Sandy on the New York area provide some local context for this theme.
The importance of climate change and cities is rebbflected in this edition of the Urban Climate News: Edward Ng (CUHK) has contributed a feature article “Adapting Asian cities to climate and urban climatic changes” and UCN editor David Pearlmutter has provided a special rebbport “Towards net zerobenergy settlements: A European demonstration project”. Also included are two urban project reports by winners in the ICUCb9 student presenbbtation competition: Stephanie Jacobs of Monash Univerbbsity: “Comparison of modelled thermal comfort during a heatwave in Melbourne Australia”, and Brian Bailey of the University of Utah: “Incorporating resolved vegetation in citybscale simulations of urban micrometeorology and its effect on the energy balance”. Thanks to all our contribubbtors in this issue and to editor David Pearlmutter for putbbting it all together.
And on the theme of IAUC, ICUC and climate change, I received an email the other day from flyingless.org. It contained a petition initiated in October 2015 that calls upon universities and academic professional associations to greatly reduce their flyingbrelated footprint as part of an effort to cut greenhouse gas emissions. Considering that IAUC is a scientific organization related to the study
From the IAUC President
− James Voogt,IAUC President
News: Rising tides? • Smarter birds Earth Hour for cities • Viral warming
Feature: Adaptation of Asian cities to climatic changes − A Chinese tale
Projects: Simulation of heat waves Urbanbscale modeling of vegetation
Special Reports: Demonstrating net zerobenergy settlements in Europe
Bibliography: Recent publications Conferences: Upcoming gatherings
IAUC Board: Meteorological society honors veteran urban climatologist

In the News 2
ISSUE NO. 59 MARCH 2016 INTERNATIONAL ASSOCIATION FOR URBAN CLIMATE
Climate guru James Hansen warns: expect much worse sea level rise
March 2016 — The current rate of global warming could raise sea levels by “several meters” over the combbing century, rendering most of the world’s coastal cities uninhabitable and helping unleash devastating storms, according to a paper published by James Hansen, the former NASA scientist who is considered the father of modern climate change awareness.
The research, published in Atmospheric Chemistry and Physics, references past climatic conditions, recent obbbservations and future models to warn the melting of the Antarctic and Greenland ice sheets will contribute to a far worse sea level increase than previously thought.
Without a sharp reduction in greenhouse gas emisbbsions, the global sea level is likely to increase “several meters over a timescale of 50 to 150 years”, the paper states, warning that the Earth’s oceans were six to nine meters higher during the Eemian period – an interglacial phase about 120,000 years ago that was less than 1oC warmer than it is today.
Global warming of 2oC above prebindustrial times – the world is already halfway to this mark – would be “dangerous” and risk submerging cities, the paper said. A separate study, released in February, warned that New York, London, Rio de Janeiro and Shanghai will be among the cities at risk from flooding by 2100.
Hansen’s research, written with 18 international colbbleagues, warns that humanity would not be able to properly adapt to such changes, although the paper concedes its conclusions “differ fundamentally from exbbisting climate change assessments”.
The IPCC has predicted a sea level rise of up to one meter by 2100, if emissions are not constrained. Hansen, and other scientists, have argued the UN body’s assessbbment is too conservative as it doesn’t factor in the potenbbtial disintegration of the polar ice sheets.
Hansen’s latest work has proved controversial because it was initially published in draft form last July without undergoing a peer review process. Some scientists have questioned the assumptions made by Hansen and the soaring rate of sea level rise envisioned by his research, which has now been peerbreviewed and published.
Michael Mann, a prominent climate scientist at Pennbbsylvania State University, said the revised paper still has the same issues that initially “caused me concern”.
“Namely, the projected amounts of meltwater seem… large, and the ocean component of their model doesn’t resolve key windbdriven current systems (e.g. the Gulf Stream) which help transport heat poleward,” Mann said
in an email to the Guardian.“I’m always hesitant to ignore the findings and warnbb
ings of James Hansen; he has proven to be so very prebbscient when it comes to his early prediction about global warming. That having been said, I’m unconvinced that we could see melting rates over the next few decades anywhere near his exponential predictions, and everybbthing else is contingent upon those melting rates being reasonable.”
Hansen was one of the first scientists to push climate change into the public’s consciousness, following a sebbries of appearances before Congress in the 1980s. He retired from his role at NASA in 2013 and has become increasingly outspoken about the need to slash emisbbsions, criticizing last year’s Paris climate deal as a “fraud” because it didn’t go far enough.
His new research warns that water gushing from melted glaciers is already influencing important ocean circulations near both poles. The added cold water risks “shutting down” the North Atlantic heat circulation, triggering a series of storms similar to Hurricane Sandy, which hobbled New York City in 2012.
“If the ocean continues to accumulate heat and inbbcrease melting of marinebterminating ice shelves of Antbbarctica and Greenland, a point will be reached at which it is impossible to avoid largebscale ice sheet disintegration with sea level rise of at least several meters,” the paper states. “The economic and social cost of losing functionbbality of all coastal cities is practically incalculable.”
Hansen said the world was “pretty darned close” to the point of no return, warning that emissions need to
Former NASA researcher and father of climate change awareness says melting of ice sheets could cause ‘several meters’ rise in a century, swamping coastal cities
Arizona Avenue is seen underwater following coastal flooding in Atlantic City, New Jersey, in January. More than 13 million Americans are at risk with a 1.8 meter rise in sea level. Source: theguardian.com

In the News 3
ISSUE NO. 59 MARCH 2016 INTERNATIONAL ASSOCIATION FOR URBAN CLIMATE
City birds are smarter, healthier than country birdsMarch 2016 — It seems like living in the urban jungle
has given birds street smarts, too, according to researchbbers from the McGill University in Quebec, Canada.
In a firstbever study comparing bird brains in the city to their country counterparts, results showed that city birds have better problembsolving capabilities, such as accessing to food in drawers, and are more daring.
The birds have adapted to their tough urban environbbment, allowing them to learn new tricks of the trade.
A team of three researchers, namely JeanbNicholas Audet, Simon Ducatez and Louis Lefebvre, conducted the study with more than 50 Barbados bullfinches from different parts of the Carribean Island.
The Carribean was a prime location since some of its areas have human settlements, while others are mostly untouched.
Audet, a doctoral candidate in Biology told CBC News that he was inspired to do the test after being “hounded by birds at a restaurant terrace in Barbados.”
Barbados bullfinches are the only endemic bird spebbcies in the islandbnation. They are seedeaters and have shown great adaptation with humans.
Besides attitude and skill, urban birds also showed better immunity than rural counterparts, with Audet saying that they seem to “have it all.”
Their study is published in the current issue of the journal Behavioral Ecology.
On the other hand, other research show that not only bullfinches have certain smarts. Mental Floss compiled a list of surprisingly smart birds, including Galapagos woodpeckers that arm themselves to get grub and rabbvens that are excellent meat cutters.
Studies on crows have also been quite extensive. Prior research show that crows can recognize faces, have sharp memory and can pass information to their offspring.
Now, researchers from University of Washington are figuring out if crows also know about death, as per this AP report. Source: http://www.natureworldnews.com/articles/20318/20160322/citybbirdsbcountrybbirdsburbbbanbruralbanimalbbehaviorbbehaviorbcognitivebbehavbbiorbadaptationbuniversitybofbmcgill.htm
A Barbados bullfinch performs a task for the study. Source: natureworldnews.com
be cut by about 6% a year in order to stabilize the clibbmate.
“What we are threatening to do to young people is irreversible, it’s irreparable harm,” he said. “This is somebbthing they didn’t cause but will be out of their control. Among the top experts, there’s agreement that this is very urgent, we can’t continue on this path hoping that emissions will go down, we have to take actions.”
Hansen reiterated his call for a global tax on carbon, denying that the roles of scientist and advocate for change are conflicted.
“This isn’t advocacy, this is what is needed,” he said. “We are allowing fossil fuel companies to use the atmobbsphere as a free waste dump. If scientists don’t say it then politicians will tell you what’s needed and that will be based upon politics rather than science. I don’t see any reason to not make the whole story clear, or to draw a line and say ‘I’m not going to step beyond this.’”
Tom Wagner, NASA’s program scientist for the cryobbsphere, said Hansen has done an “amazing job” in probbviding a “provocative” piece of research on sea level rise.
“It’s an interesting paper as it’s one of the few times
when all of these different fields have been combined,” he said. “It is at odds with some research from other places. He’s made a great effort to combine the Eemian period to what is happening today, which is hard to do. It’s a tough one. Source: https://www.theguardian.com/science/2016/mar/ 22/seablevelbrisebjamesbhansenbclimatebchangebscientist
James Hansen argues that the effects of melting glaccciers, such as this one near Ilulissat, Greenland, could be devastating. Source: theguardian.com
https://www.theguardian.com/science/2016/mar/22/sea-level-rise-james-hansen-climate-change-scientist

In the News �
ISSUE NO. 59 MARCH 2016 INTERNATIONAL ASSOCIATION FOR URBAN CLIMATE
From Sydney to New York, landmarks go dark for Earth HourMarch 2016 — From Sydney’s Opera House to New York’s
Empire State Building and Paris’s Eiffel tower, landmarks worldwide dimmed their lights for the 10th edition of the Earth Hour campaign against climate change.
Millions of people from 178 countries and territories were expected to take part in WWF’s Earth Hour this year, organbbisers said, with monuments and buildings such as Berlin’s Brandenburg Gate plunging into darkness for 60 minutes from 8:30 pm local time on March 19th.
The annual event kicked off in Sydney, where the Earth Hour idea originated in 2007. “We just saw the Sydney Harbbbour Bridge switch its lights off... and buildings around as well,” Earth Hour’s Australia manager Sam Webb told AFP from The Rocks area.
Earth Hour’s global executive director Siddarth Das said organisers were excited about how much the movement had grown since it began nine years ago. “From one city it has now grown to over 178 countries and territories and over 7,000 cities, so we couldn’t be happier about how milbblions of people across the world are coming together for climate action,” he told AFP from Singapore ahead of the lights out.
Over 150 buildings in Singapore dimmed their lights, while Taipei’s 101 skyscraper gradually turned lights off for one hour and the city’s four historical gates and bridges also went dark. The lights also dimmed across Hong Kong’s usually glittering skyline, although online commentators pointed out that China’s People’s Liberation Army garrison headquarters on the harbour front kept the lights blazing. “Imagine being the manager of the only building in a major metropolis to forget,” said one Twitter post alongside a picbbture of the PLA building lit up against a darkened skyline.
After Asia, Earth Hour shifted to Europe where St Peter’s Basilica, Rome’s Trevi Fountain and the Parthenon temple in Athens were among a slew of iconic sites to go offbgrid.In London, the lights were shut off at the Houses of Parliabbment, the London Eye, Tower Bridge, St Paul’s Cathedral, Buckingham Palace and Harrods department store. In Parbbis, the Eiffel Tower was plunged into darkness, as was the Kremlin in Moscow.
When New York’s Empire State Building went dark, one New Yorker joked on Twitter “I was wondering why my skyline is black.” In Chile’s capital, Santiago, the La Moneda presidential palace cut off its lighting for an hour, while in Mexico, the capital city’s Monument to the Revolution went dark as well.
Meanwhile Canadian Prime Minister Justin Trudeau tweeted a cozy photo of himself and his wife, illuminatbbed only by candlelight, with a fireplace glowing in the background. “We’re all on this planet together. During #EarthHour and every day thereafter,” he wrote. Source: http://articles.economictimes.indiatimes.com/2016b03b20/news/71678546_1_earthbhourblightsbeiffelbtower
Are these the seven most sustainable cities?
Landmarks around the world went dark for Earth Hour this weekend, but many cities are making longer term moves towards sustainability. From Hamburg to
São Paulo – seven cities taking radical stepsSee more at: theguardian.com
Banning coffee pods and bottled water - Hamburg
Getting cars out of the city centre - Oslo
Better buses - Bogotá

In the News �
ISSUE NO. 59 MARCH 2016 INTERNATIONAL ASSOCIATION FOR URBAN CLIMATE
March 2016 — With warmer temperatures this year, 50 U.S. cities are faced with higher risk of Zika virus spread, scientists found.
The Centers for Disease Control and Prevention (CDC) reports that there are 258 travelbassociated Zika virus infecbbtions in its various states while in U.S. territories, three were travelbassociated while 283 are locallybacquired. If the virus continues to spread, however, scientists created a map to show which states will be impacted the most.
In a new study published in the journal PLOS Currents Outbreaks, researchers from the National Center for Atbbmospheric Research (NCAR), NASA Marshall Space Flight Center and the University Corporation for Atmospheric Research (UCAR) observed 50 U.S. cities. They wanted to demonstrate which cities have ideal weather conditions that could boom Aedes aegypti mosquito numbers during warmer months.
One key factor that contributed to the Zika virus spread in the Americas is warm temperature. With the right mix of certain conditions including warmer weather, these are favorable for populations of mosquito along the East Coast as far as New York and in the southern parts of the country including Los Angeles and Phoenix.
The researchers created computer models by using data on climate, air travel, mosquito breeding patterns and sobbcioeconomic status to determine which areas would make for a hospitable environment for Zika virus outbreak.
They found that between December and March, the weather condition is not conducive for mosquitoes except in south Texas and south Florida because of their relabbtively warm conditions. From July to September, however, weather conditions are very suitable for Aedes aegypti mosquitoes.
The computer models show that the highest mosquito abundance would likely to occur in southeast and south Texas. Areas like southern Florida and south Texas are likely to be affected by travelbrelated virus spread while they ofbbfer suitable environments for populations of mosquitoes.
“This research can help us anticipate the timing and lobbcation of possible Zika virus outbreaks in certain U.S. citbbies,” said Andrew Monaghan of NCAR. He added that even if there is still more to learn about Zika virus, shedding light on the mosquito patterns and where they can thrive in the country could help establish mosquito control efforts.
The researchers stressed that even if Zika virus would spread in mainland U.S., it would not be like the outbreak that ravaged through the Americas. Most Americans live in airbconditioned rooms which are sealed from the outdoors which lessens the contact between humans and diseasebcausing mosquitoes. Source: http://www.techtimes.com/articles/142748/20160321/warmerbclimatebplacesb50busbcitiesbatbriskbforbzikabvirus.htm
Warmer climate places �0 US cities at risk for Zika virus
Mobility on demand - Helsinki
Big data city - Seoul
Paying cyclists - Paying cyclists - Milan
Advertising-free street - São Paulo
Feature 6
ISSUE NO. 59 MARCH 2016 INTERNATIONAL ASSOCIATION FOR URBAN CLIMATE
By Professor Edward NG ([email protected])
Chinese University of Hong Kong
Adapting Asian Cities to Climate and Urban Climatic Changes:A Chinese Tale
The COP21 Paris Agreement and developing countries in Asia
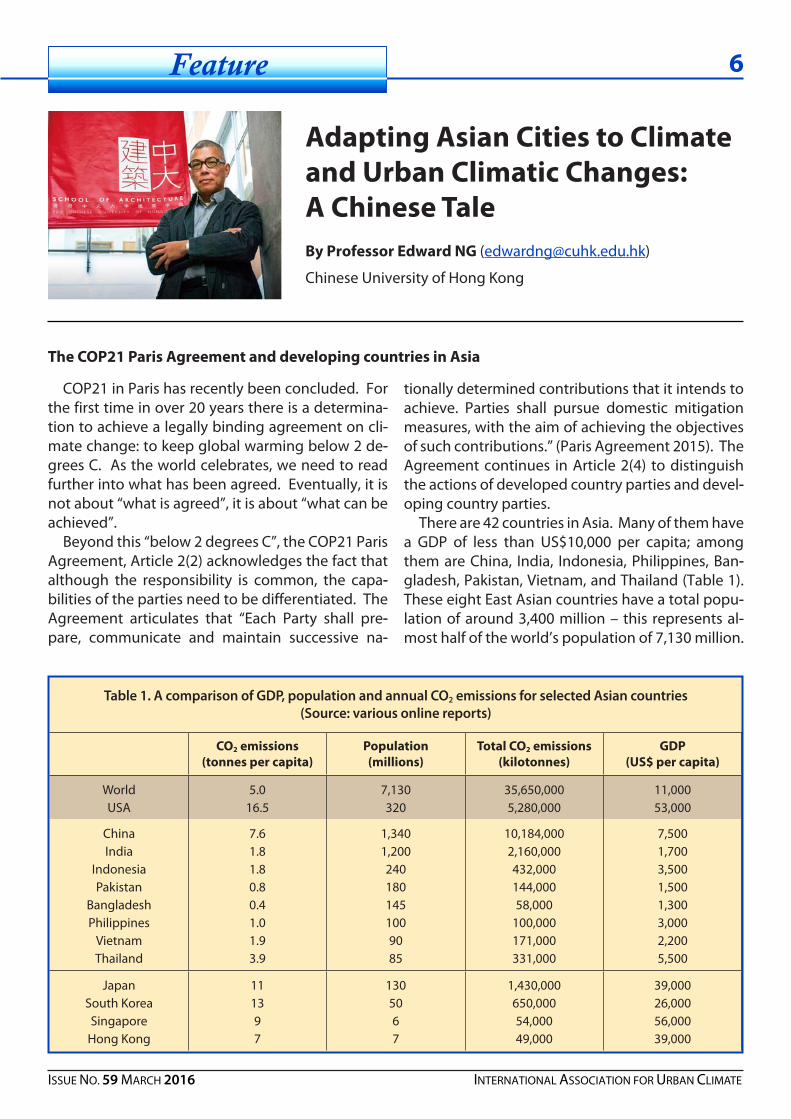
Table 1. A comparison of GDP, population and annual CO2 emissions for selected Asian countries(Source: various online reports)
CO2 emissions(tonnes per capita)
Population(millions)
Total CO2 emissions (kilotonnes)
GDP(US$ per capita)
WorldUSA
5.016.5
7,130320
35,650,0005,280,000
11,00053,000
ChinaIndia
IndonesiaPakistan
BangladeshPhilippines
VietnamThailand
7.61.81.80.80.41.01.93.9
1,3401,2002401801451009085
10,184,0002,160,000432,000144,00058,000
100,000171,000331,000
7,5001,7003,5001,5001,3003,0002,2005,500
JapanSouth KoreaSingapore
Hong Kong
111397
1305067
1,430,000650,00054,00049,000
39,00026,00056,00039,000
tionally determined contributions that it intends to achieve. Parties shall pursue domestic mitigation measures, with the aim of achieving the objectives of such contributions.” (Paris Agreement 2015). The Agreement continues in Article 2(4) to distinguish the actions of developed country parties and develbboping country parties.
There are 42 countries in Asia. Many of them have a GDP of less than US$10,000 per capita; among them are China, India, Indonesia, Philippines, Banbbgladesh, Pakistan, Vietnam, and Thailand (Table 1). These eight East Asian countries have a total popubblation of around 3,400 million – this represents albbmost half of the world’s population of 7,130 million.
COP21 in Paris has recently been concluded. For the first time in over 20 years there is a determinabbtion to achieve a legally binding agreement on clibbmate change: to keep global warming below 2 debbgrees C. As the world celebrates, we need to read further into what has been agreed. Eventually, it is not about “what is agreed”, it is about “what can be achieved”.
Beyond this “below 2 degrees C”, the COP21 Paris Agreement, Article 2(2) acknowledges the fact that although the responsibility is common, the capabbbilities of the parties need to be differentiated. The Agreement articulates that “Each Party shall prebbpare, communicate and maintain successive nabb

Feature �
ISSUE NO. 59 MARCH 2016 INTERNATIONAL ASSOCIATION FOR URBAN CLIMATE
and ensuring an adequate adaptation response in the context of the temperature goal referred to in Article 2.” The determinant of adoption of any adaptation strategy is the cost involved – and it rebbmains to be seen how Article 9 of the Agreement on financial aids might be substantiated.
It is very easy for a nation to develop an adaptabbtion plan. However, a plan is only as good as how it is implemented and realised. For many Asian develbboping countries, this, perhaps more than the need for mitigation measures, is the real challenge. Apart from the need to finance adaptation measures, the other challenge is technology. Both detection and facilitation technologies are needed, that is to say, knowing “where the problems are” and “how to tackle the problem” require technological knowbbhow that may exceed the capability of many develbboping nations. This is where Article 10 and 11 of the Agreement on technology transfer may assist.
A reading of the COP21 Paris Agreement, as outbblined above, provides the context when the national plans of different Asian countries are dissected.
Under Article 2(4) of the Agreement, these eight debbveloping countries are only required to “enhance” their mitigation efforts, and are only “encouraged to move over time towards economybwide emisbbsion reduction or limitation targets in the light of different national circumstances”.
The crucial point to note is: how does China see itbbself? On the one hand, from an economic and social development point of view, China is still very much a developing country; however, from a total energy consumption and CO2 emission point of view, it is a major contributor. The fact is, if China chooses only to “enhance” its mitigation efforts as in Article 2(4) of the Agreement, it is difficult to see how the two degree limit may be achieved.
Apart from the issue of mitigation, the Agreement also touches on the issue of adaptation. Article 7(1) of the Agreement spells it out clearly: “Parties herebbby establish the global goal on adaptation of enbbhancing adaptive capacity, strengthening resilience and reducing vulnerability to climate change, with a view to contributing to sustainable development
Figure 1. Total CO2 emissions of major emitters in 1970–2012. (Zhu Liu, 2015)

Feature �
ISSUE NO. 59 MARCH 2016 INTERNATIONAL ASSOCIATION FOR URBAN CLIMATE
China’s National Climate Change ProgramIn terms of industrialisation, China started late.
The World Resources Institute has compiled a set of historical data (Table 2). Since the turn of the twenbbtybfirst century, China has industrialised rapidly (Figure 1). By 2005, it had surpassed the USA as the world’s largest CO2 emitter. By 2010, China’s annual CO2 emission level was about 8,200 megatonnes, and it is increasing rapidly at about 3% per year.
China issued its first National Climate Change Program in 2007 (NDRCbChina, 2007). In a nutshell, the 2007 Program set up six guiding principles (UN, 2007):
—To address climate change within the framebbwork of sustainable development;
—To place equal emphasis both on mitigation and adaptation;
—To integrate climate change policy with other interrelated policies;
—To rely on the advancement and innovation of science and technology;
—To follow the principle of “common but differbbentiated responsibilities”; and
—To actively engage in wide international coopbberation.
The 2007 Program also set up a number of Objecbbtives (UN, 2007):
—To reduce energy consumption per unit GDP by 20%;
—To increase the share of renewable energy to 10% of primary energy supply;
—To stabilize nitrous oxide emissions from inbbdustrial processes at the 2005 level;
—To control the growth rate of methane emisbbsions;
—To increase the forest coverage rate to 20%; and
—To increase the carbon sink by 50 million tonnes over the 2005 level.
It is not difficult to see, when examining the prinbbciples and objectives of the 2007 Program, that for China the development of its economy has very much been the overarching concern. For example, given the average growth rate of about 8% per year, achieving the CO2 intensity target of 20% over five years means that actually more CO2 will be emitbbted. Indeed, in the years between 2005 and 2010, China’s CO2 emissions increased from 5,935 to 8,159 megatonnes per year. This represents an increase of 37%.
In 2011, a revised set of policies was published (NDRCbChina, 2011). It set the CO2 intensity target of 17% reduction over five years. Even given the slowdown of the Chinese economy, the undeniable fact is that China’s total CO2 emission will still be on an upward trend.
A recent report by the Netherlands Environmenbbtal Assessment Agency highlights that China’s CO2 emission level in 2014 was around 10,500 Mt; this is an annual increase of about 7% since 2010. In 2014 at the UN Climate Summit, China committed to peaking its total CO2 emissions by 2030. This was in line with an earlier announcement (November 2014) on the “US – China Joint Announcement on Climate Change and Clean Energy Cooperation”. China had also set the goal of reducing its carbon intensity by up to 45% by 2020. How the promise is to be fulbbfilled is a major question. But the most important fact is that China’s CO2 emissions, given an annual growth rate of say 5%, will in 2030 be around 22,000 megatonnes. Unfortunately, this number alone will make COP21’s two degree target impossible.
China’s Adaptation Strategies
Given the impossible story China has so far prebbsented in terms of mitigation, it seems that adapbbtation measures are its only hope. The 2011 policy document reveals that the emphases are on water,
Table 2. CO2 emissions (megatonnes per year) from 1850 to 2010.(Source: World Resources Institute)
1��0 1900 1920 19�0 1960 19�0 2000 2010
UKUSA
China
122bb
420662
4701,871
26
4751,900
86
5832,858780
5784,7031,465
5335,7473,607
4785,4698,159

Feature 9
ISSUE NO. 59 MARCH 2016 INTERNATIONAL ASSOCIATION FOR URBAN CLIMATE
and economic development of China during the last 30 years has in a way set the direction and priorbbity of the nation. Government leaders and officials are not going to dampen the shortbterm economic gains in return for longbterm benefits. At the end of the day, let us hope that it is not going to be too little too late.
From Climate Change to Urban Climate2030 or 2050 is too far away for politicians, but
2014 was not. Premier Xi Jinping in his opening address at the AsiabPacific Economic Cooperation (APEC) November 2014 meeting in Beijing remindbbed delegates of Beijing’s air pollution and urban clibbmate problems. He hoped that, as part of his “Chibbnese dream”, one day China will see “blue sky, green mountains and clean water”. The directive set off a chain reaction.
The address was preceded by the National Plan on Climate Change 2014–2020 published in Septembbber 2014 (NDRCbChina 2014). The paper mentions, for the first time, policies related to urban climate and urban living. Keywords like urban heat island, heat stress prevention, building design, transportabbtion planning, open space provision, urban greenbbery, and water body have been included.
Almost immediately after Xi’s address, China finalbbly passed its 2009 draft Design Standard for Thermal Environment of Urban Residential Areas (JGJ, 2013). It specifies that the urban heat island effect will be limited to 1.5 degrees C.
In May 2015, the 2011 draft Technical Guideline for Climatic Feasibility Demonstration in Urban Overall Planning by the China Meteorological Administrabbtion was passed. As a major basis of city planning, the document mentions the need to calculate and quantify human thermal comfort, air pollution inbbdex, urban heat island intensity, mixing height, and so on.
In June 2015, the Ministry of Housing and Urban–Rural Development (MHURD) published a draft policy paper titled National City Environmental Probbtection and Development Policies (MHURD, 2015). It highlights the importance of Xi’s “blue sky, green mountains and clean water”. The key strategies are “city air corridors” and “urban greening”. It recombbmends that China’s major cities – and there are 291 of them – need to complete their Greening Masterbbplan and Air Corridor Masterplan by 2017.
health, land use, forestry, transport, air pollution, and industrial processes. No target was set, and, surprisingly, sea level rise was not mentioned. Subbbsequently, in 2013, a set of revised policies was pubbblished (NDRCbChina, 2013). The six highlights are:
(A) Disaster Prevention and Mitigation: The Minbbistry of Civil Affairs, the Ministry of Agriculture and the Ministry of Water Resources now work closely together to build defensive infrastructure for exbbtreme weather. Above all else is the production of flood risk maps and assessment mechanism. Howbbever, given the vastness of China’s territory, the task is challenging.
(B) Monitoring and Early Warning: The China Meteorological Administration and the State Ocebbanic Administration are charged with providing the needed early warning and monitoring mechanism.
(C) Agriculture and Water Resources: The Outbbline of National Agricultural Water Conservation (2012–2020) promotes waterbsaving agriculture. Strictest Water Resources Management Systems have been developed for river basin protection.
(D) Coastal Areas and Ecosystems: Overseen by the State Oceanic Administration, the coastal debbfences are being reinforced. The long coast lines and the cities on or near the flood plains are the key challenges. A report by the Organization for Economic Cooperation and Development (OECD) reckons that a number of Chinese cities, including Guangzhou, Shanghai, Tianjin, Hong Kong, and Qingdao, are ranked in the top 20 most vulnerable cities in the world (Pan et al., 2011).
(E) Public Health: For Climate Change’s impact on public health, the issue of heatwaves has not been explicitly mentioned. Drinking water and PM2.5 are the focuses.
Despite the above highlights of China’s action plans, a question remains: is China ready for Climate Change? For the Chinese Government, the most risky challenges are agriculture and water resources (Darkin, 2008). Droughtbrelated and floodbrelated crop failure poses the highest impact not only sobbcially and economically, but also politically. China’s agriculture and water infrastructures are outdated. A lot of investment is going to be needed. Apart from building defensive measures, advances in agrobbiological technology are also needed.
Having policies and action plans are one thing, realising them is another. The rapid urbanisation

Feature 10
ISSUE NO. 59 MARCH 2016 INTERNATIONAL ASSOCIATION FOR URBAN CLIMATE
The MHURD’s paper was followed by a joint MHURD/NDRC paper in February 2016 on Climate Change Adaptation Action Plan for Cities (MHURD/NDRC, 2016). It requires results to be realised by the local governments of 30 key cities.
One of the bigger cities to have attempted an initial understanding is the city of Wuhan. It is lobbcated inland on the Yangtze River 700 km west of Shanghai. It has more than 10 million inhabitants. The city’s climate is humid subtropical (Köppen Cfa). It has very hot and humid summers, but is well endowed with lakes in and around the city.
Using the excellent GIS database of the city’s planbbning department, the research team at the Chinese University of Hong Kong calculated the city’s Fronbbtal Area Density (FAD) as the basis of its air path unbbderstanding (Figure 2). Potential air path locations at the urban and neighbourhood scales are then identified (Figure 3). The understanding provides a useful initial basis for planners.
What is next? So, one city is almost there, and there are 290
more to go. Two challenges lie ahead. The first challenge must be the technical capabb
bility to quickly finish the initial assessment of all 290 cities. For that to happen, detailed urban morbbphological data of the cities are needed. The recent WUDAPT initiative by Gerald Mills, Jason Ching, Ren Chao and others provides us with hope (Ching et al., 2015). As of today (March 2016), Professor Ren Chao’s team has already finished most major cities to WUDAPT Level 0. Her team will complete all 290 cites by the end of the year. The harmonised dabbtabase will provide the muchbneeded basis for an air corridor assessment of these cities. Based on the dataset, Ren’s team will be able to quickly assemble the urban climatic maps of all the cities (Ren, 2011). Planning advices may then follow.
The other challenge is more difficult because it is beyond science. It has to do with the political will and more importantly the administrative capabilbbity for professional planners to take on the scienbbtific information and merge it into their daybtobday practice of city planning. According to Professor Ingegard Eliasson, the challenge is conceptual, knowledgebbased, institutional, and technical (Elibbasson, 2000). The call has been echoed by Professor Gerald Mills and his cobauthors (Mills et al., 2010).
And two fundamentals of the quality of the needed information are “prevailing” and “criticality” (Mills, 2006; Ng, 2011). Let us see how our leaders can cross the river by feeling the stones!
As for now, my takebhome message when I gave the plenary lecture at the 9th ICUC conference in Toulouse is still valid: The giants of our discipline, Professor Tim Oke, Professor Bob Bornstein, and the like, and our predecessors have inspired us much on what we need to “know”, now it is our turn to pay re--spect by making “real” what we know.
Figure 2. The FAD map of Wuhan. (Source: Author)
Figure 3. Using the FAD map of Wuhan, the existing air paths through the city may be defined. They need to be protected. (Source: Author)

Feature 11
ISSUE NO. 59 MARCH 2016 INTERNATIONAL ASSOCIATION FOR URBAN CLIMATE
References
Ching, J., Mills, G., See, L., Bechtel, B., Feddema, J., Stewart, I., Hanna, A., Wang X. M., Ng, E, Ren, C., Brousse, O., Martilli, A., Neophytou, M., Milcinski, G., Foley, M., Alexander, P., Hidalgo, J. & Masson, V. WuDapt (World Urban Database and Access Portal Tools): An international collaborative project for climate relevant physical geography data for the world’s cities. 96th AMS Annual Meeting in New Orbbleans, LA (January 2016).
Darkin, B. Climate Resilience in China and the EU: Managing impacts and adaptation, Chatham House, UK, 2008. https://www.e3g.org/docs/Climate_Resilbbience.pdf (Accessed 12 March, 2016)
Eliasson, I. (2000). The use of climate knowledge in urban planning, Landscape and Urban Planning, 48, 31–44.
JGJ 286. (2013). Design Standard for Thermal Environment of Urban Residential Areas 城市居住区热环境设计标准JGJ 286–2013, Beijing. http://www.soujianzhu.cn/Norm/csgh38.htm (Accessed 12 March, 2016)
MHURD/NDRC. (2016). Climate Change Adaptabbtion Action Plan for Cities. 城市适应气候变化行动方案, a joint MHURD/NDRC paper. http://www.sdpc.gov.cn/gzdt/201411/W020141104591413713551.pdf (Accessed 12 March, 2016)
MHURD. (2015). National City Environmental Protection and Development Policies, (全国城市生态保护与建设规划), Beijing, China. http://www.sdpc.gov.cn/fzgggz/ncjj/zhdt/201411/W020141119598729670157.pdf (Accessed 12 March, 2016)
Mills, G., Cleugh, H., Emmanuel, R., Endlicher, W., Erell, E., McGranahan, G., Ng, E., Nickson, A., Rosenbbthal, J., & Steemer, K. (2010). Climate Information for Improved Planning and Management of Mega Citbbies (Needs Perspective). Procedia Environmental Sci--ences, 1, 228–246.
Mills, G. (2006). Progress toward sustainable setbbtlements: a role for urban climatology. Theor. Appl. Climatol., 84, 69–76.
NDRCbChina. (2007). National Climate Change Program 2007 by the National Development and Reform Commission (NDRC), 4th June, 2007.
http://www.china.org.cn/english/environbbment/213624.htm#5 (Accessed 12 March, 2016)
NDRCbChina. (2011). China’s Policies and Actions for Addressing Climate Change by the National Debbvelopment and Reform Commission (NDRC).
http://www.ccchina.gov.cn/WebSite/CCChina/UpFile/File1324.pdf (Accessed 12 March, 2016)
NDRCbChina. (2013). China’s Policies and Actions for Addressing Climate Change by the National Debbvelopment and Reform Commission (NDRC).
http://en.ndrc.gov.cn/newsrelease/201311/P020131108611533042884.pdf (Accessed 12 March, 2016)
NDRCbChina. (2014). National Plan on Climate Change 2014–2020 by the National Development and Reform Commission (NDRC). 国家应对气候变化规划(2014–2020 年). http://www.sdpc.gov.cn/gzdt/201411/W020141104591413713551.pdf (Acbbcessed 12 March, 2016)
Ng, E. (2010). Towards a Planning and Practical Understanding for the Need of Meteorological and Climatic Information for the Design of High Density Cities – a case based study of Hong Kong. Interna--tional Journal of Climatology, 32: 582–598.
Pan, J.H., Zheng, Y, & Markandya, A. (2011). Adbbaptation Approaches to Climate Change in China: An Operational Framework. Economía Agraria y Recursos Naturales, Vol. 11–1. 99–112. https://core.ac.uk/download/files/153/6506796.pdf (Accessed 12 March, 2016)
Paris Agreement. (2015). http://unfccc.int/files/meetings/paris_nov_2015/application/pdf/parbbis_agreement_english_.pdf (Accessed 12 March, 2016)
Ren, C., Ng, E., & Katzschner L. (2011). Urban Clibbmatic Map Studies: a Review. International Journal of Climatology, 31, (15): 2213–2233.
UN. (2007). General Assembly 61st session – Thebbmatic debate on Climate Change as a global chalbblenge. 31 July and 1 August, 2007.
http://www.un.org/ga/president/61/followbup/climatechange/ChinabKeyElements.pdf (Accessed 12 March, 2016)
Zhu Liu. (2015). China’s Carbon Emissions Rebbport 2015. Belfer Centre, Harvard Kennedy School, USA. http://belfercenter.ksg.harvard.edu/files/carbbbonbemissionsbreportb2015bfinal.pdf (Accessed 12 March, 2016)

Urban Projects 12
ISSUE NO. 59 MARCH 2016 INTERNATIONAL ASSOCIATION FOR URBAN CLIMATE
IntroductionOn January 28b30, 2009 the city of Melbourne in southbb
eastern Australia experienced a recordb breaking heatbbwave with three days above 43˚C and one night above 30˚C. Following the event, over 374 excess deaths and 714 hospitalisations were attributed to the heatwave (Victorian Department of Health 2009).
Heatwaves in southeastern Australia are typically driven by synoptic scale processes comprising an antibbcyclone to the east of the continent that advects hot dry air from the desert interior of Australia to the southeast of the country, where Melbourne is located (Pezza et al. 2011). Heatwaves in southeast Australia have also been associated with large scale modes of variability such as the negative phase of the Southern Annular Mode (Marbbshall et al. 2013) and the La Niña phase of the El Niño Southern Oscillation (Parker et al. 2014).
Perkins (2015) found that antecedent soil moisture conditions had a large impact on Australian heatwaves, where drier soils mean longer, hotter and more heatbbwave days per season. Indeed, antecedent soil moisture and its negative correlation with maximum temperature was shown to contribute greatly to the intensity and spatial extent of the January 2009 heatwave when simubblated with a short lead time (Kala et al. 2015).
For urban areas, where soil or vegetation covered surfacbbes are increasingly being replaced by impervious surfaces, soil moisture can impact the magnitude of the urban heat island (Hafner & Kidder 1999), as well as the soil temperabbture and air pollution concentration (Jacobson 1999).
The January 2009 heatwave event came at the end of a 13byear drought for southeastern Australia (Ummenbbhofer et al. 2009). As such, there was no rain recorded at Melbourne Airport weather station between January 9, 2009 and February 7, 2009 (Engel et al. 2013). The daily maximum temperature in Melbourne is known to be 1b3˚C higher after drought conditions (Nicholls and Larsen 2011), which may have contributed to the intensity of the 2009 heatwave.
For southeastern Australia, accurate soil moisture probbfiles for model initialisation are essential for simulating the spatial extent and intensity of heatwaves (Kala et al. 2015). Our research tests this by simulating the January 28b30, 2009 heatwave using two different methods of initialisbbing soil moisture, one wetter and one drier, to determine whether improving the accuracy of soil moisture measurebbments can improve the representation of extreme heat in urban areas using Melbourne as a case study.
The motivation for this research is that heatwaves over Australia are predicted to become hotter, longer and more frequent with climate change (Cowan et al. 2014), and they have been shown to exacerbate the urban heat
Local soil moisture product improves Australian heatwave simulation
island (Li and BoubZeid 2013), which creates a higher risk of heat stress in urban areas (Fischer et al. 2012). There is also evidence that human resilience to heat is very sensitive to particular temperature thresholds (Nicholls et al. 2008), making more accurate simulations crucial, particularly over cities. Therefore, it remains pertinent to simulate heatwaves accurately and understand the full impact of soil moisture initialisation for the modelling of Australian heatwaves, particularly in urban areas.
Data and methodsThis study uses a modelling framework and compares
simulations to instrumental nearbsurface temperature observations to determine how different soil initialisabbtion techniques affect the accuracy of a modelled Ausbbtralian heatwave.
Model frameworkWe used the Weather Research and Forecasting modbb
el (WRF) V3.6.0 (Skamarock et al. 2008) driven by 0.7˚ x 0.7˚ gridded ERA Interim reanalysis data (Dee et al. 2011) to simulate the January 28b30, 2009 heatwave at a 2km spatial resolution over Melbourne. WRF was coupled to a single layer urban canopy model (Kusaka et al. 2001; Chen et al. 2011) to better represent the urban features of the city. WRF has been extensively used to simulate urban arbbeas (Argüeso et al. 2014, 2015; Salamanca et al. 2012) and heatwaves (Kala et al. 2015; Stegehuis et al. 2015).
We used the MODIS land surface categories in WRF which as a default have only one urban category. Howbb
Figure 1. Domain 1 covers the entire figure at a 10km grid resolution and the red box shows the 2km inner domain for Melbourne and its surrounding areas.

Urban Projects 13
ISSUE NO. 59 MARCH 2016 INTERNATIONAL ASSOCIATION FOR URBAN CLIMATE
ever, the single layer urban canopy model in WRF allows for three different urban categories: low, medium and high density, so to define these three urban categories for Melbourne, the land surface data set from Jackson et al. (2010) was used. The low, medium and high density urban fractions in WRF were set to 0.71, 0.77 and 0.8 rebbspectively based on values in Coutts et al. (2007). These values were chosen as the fraction of urban surface that is not vegetation. We used two domains in the WRF simbbulations with Melbourne and its surrounding areas as the innermost domain. The largest domain had a 10km resolution and the innermost domain a 2km resolution (Figure 1). All domains used onebway nesting.
The physics schemes used in WRF were the Noah land surface scheme, the Yonsei University boundary layer scheme, the KainbFritsch cumulus scheme (only for the larger domain with a resolution of 10km), the Dudhia shortwave radiation scheme, the MoninbObukhov surbbface similarity scheme, the Rapid Radiative Transfer Modbbel longwave radiation scheme and the WRF Single Mobbment 5bclass microphysics scheme. This group of physics schemes has been deemed one of the best combinations for southeastern Australia on seasonal (Evans and McCabe 2010) and diurnal timescales (Evans and Westra 2012).
Experimental designTo determine the sensitivity of temperatures in heatbb
waves to the initial conditions of soil moisture, two exbbperiments were performed. Experiment 1) ran WRF using ERA Interim as the model driver for three days with the first day discarded as model spin up and repeated this process until the heatwave was fully simulated. These threebday simulations were repeated 8 times to form an 8b
member ensemble to reduce the sensitivity to initial conbbditions (Georgescu et al. 2014). Each ensemble member was initialised 6 hours apart. Experiment 2) ran WRF with the same setup as Experiment 1, but the top layer of ERA Interim soil moisture (0b7cm) was replaced with gridded 0.05˚ x 0.05˚ soil moisture data from the Australian Water Availability Project (AWAP, http://www.csiro.au/awap/). The AWAP soil moisture is a locally made high resolution soil moisture reanalysis product, which has undergone local verification on monthly and weekly time scales (Raupach et al. 2009). The top layer AWAP soil moisture is an order of magnitude drier than the ERA Interim soil moisture, showing the large difference between the two products (Figure 2). We ran each ensemble from 18UTC January 24, 2009 until 18UTC January 31, 2009.
Observational dataTo test the accuracy of our two model experiments
we validate WRF against two observational datasets. First, we obtained gridded AWAP maximum and minibbmum temperature data (Jones et al. 2009). This data has been interpolated from observational weather stations around Australia to a 0.05˚ x 0.05˚ grid. To compare the 2km resolution WRF to the ~5km resolution gridded data we interpolated the WRF data to the AWAP grid usbbing a nearest neighbour method so that the two datasbbets were directly comparable.
Next, threebhourly 2m temperature data from six urbbban Australian Bureau of Meteorology weather stations in Melbourne were obtained to compare the results from the closest WRF gridpoint to the weather stations. We calculated a root mean square error (RMSE) between WRF and the weather station for the warmest part of
Figure 2: The ERA Interim top layer of soil moisture used in Experiment 1 compared to the AWAP soil moisture used as the top layer of the simulation in Experiment 2. The AWAP soil moisture is an order of magnitude dryer. Note that this scale only varies between 0 and 0.3. The soil moisture variable actually varies between 0 and 1, though not in this domain, where water covered surfaces (shown here in white) have a soil moisture of 1.

Urban Projects 1�
ISSUE NO. 59 MARCH 2016 INTERNATIONAL ASSOCIATION FOR URBAN CLIMATE
the day (12pmb6pm) for the three days of the heat wave and the coolest part of the day (12amb6am) for the two middle nights of the heatwave. A cold front swept across Melbourne at 6pm on the final day of the heatwave, yet in Experiments 1 and 2, WRF simulated the cold front at 8pm. This resulted in an unusually large error between the observed 2m temperature and the WRF values, which lead to an over inflation of the RMSE values. Therefore, for our warmest part of the day RMSE calculations, we have excluded the 6pm value on January 30, the final day of the heatwave. The observational data is from 00:00 Janubbary 28 2009 until 00:00 January 31 2009 (local Australian Eastern Daylight time) and the weather station details are in Table 1.
These simple measures of validating WRF against nearbsurface temperature will highlight which soil moisture initialisation experiment best simulates the January 2009 heatwave over Melbourne.
ResultsThe areabaveraged urban temperature bias of the WRF
heatwave simulations show that the maximum temperabbture is underestimated and the minimum temperature is overestimated for both Experiment 1 and 2. Experiment 1 had an ensemble mean maximum temperature bias of b2.92˚C and a minimum temperature bias of 4.68˚C, whereas Experiment 2 had an ensemble mean maximum temperature bias of b1.87˚C and a minimum temperature bias of 3.86˚C. The maximum and minimum temperature
bias for Experiment 2 is over 1˚C lower than for Experibbment 1 indicating that the drier soil simulation is better at achieving the extremely high maximum temperatures of the heatwave in Melbourne as well as the cooler nights.
The large minimum temperature bias for both experibbments is partially due to the extremely high observational minimum temperature on the first night of the heatwave. Throughout this night the minimum temperature was 30.5˚C at Melbourne Airport weather station, and while WRF is prone to overestimating the minimum temperabbture, it still did not achieve this unusually high nightbtime temperature.
The explanation for these results is that the antecedbbent soil moisture conditions are known to have a negative correlation with maximum temperature (Kala et al. 2015). This is because liquid water has a higher heat capacity than air, meaning it takes more time to heat up and cool down. Drier soils are filled with more air than water and so are able to warm up during the day and cool down at night faster than soils with a higher moisture content.
When comparing the 2m temperature from 6 urban weather stations to the closest WRF gridpoint we found that Experiment 2 performed better for the warmest part of the day (12pmb6pm) and the coolest part of the day (Table 2). This confirms the ensemble mean results where having the drier AWAP soils in the simulation enables WRF to better simulate the diurnal variability of the heatwave. It is worth noting that WRF is on a 2km grid and so choosbbing one representative point to compare to a weather stabb
Table 1. The latitude, longitude and altitude of the 6 urban weather stations.
Station name Latitude (˚) Longitude (˚) Altitude (m)
Essendon AirportLaverton RAAFMelbourne AirportMoorabbinScoresbyViewbank
b37.73b37.86b37.67b37.98b37.87b37.74
144.91144.76144.83145.10145.26145.10
78.420.1
113.412.180.066.1
Table 2. The root mean square error (RMSE, in oC) between the observational urban weather stations and the closest WRF grid point over the warmest part of the day and the coolest (bold indicates lower RMSE value).
Experiment 1 (ERA Interim soil moisture) Experiment 2 (AWAP soil moisture)
Weather Station 12pm-6pm 12am-6am 12pm-6pm 12am-6am
Essendon AirportLaverton RAAFMelbourne AirportMoorabbinScoresbyViewbank
1.681.151.562.072.472.72
2.841.952.0�3.413.152.63
1.291.151.031.6�1.�32.21
2.�11.692.473.0�2.�92.33
Urban Projects 1�
ISSUE NO. 59 MARCH 2016 INTERNATIONAL ASSOCIATION FOR URBAN CLIMATE
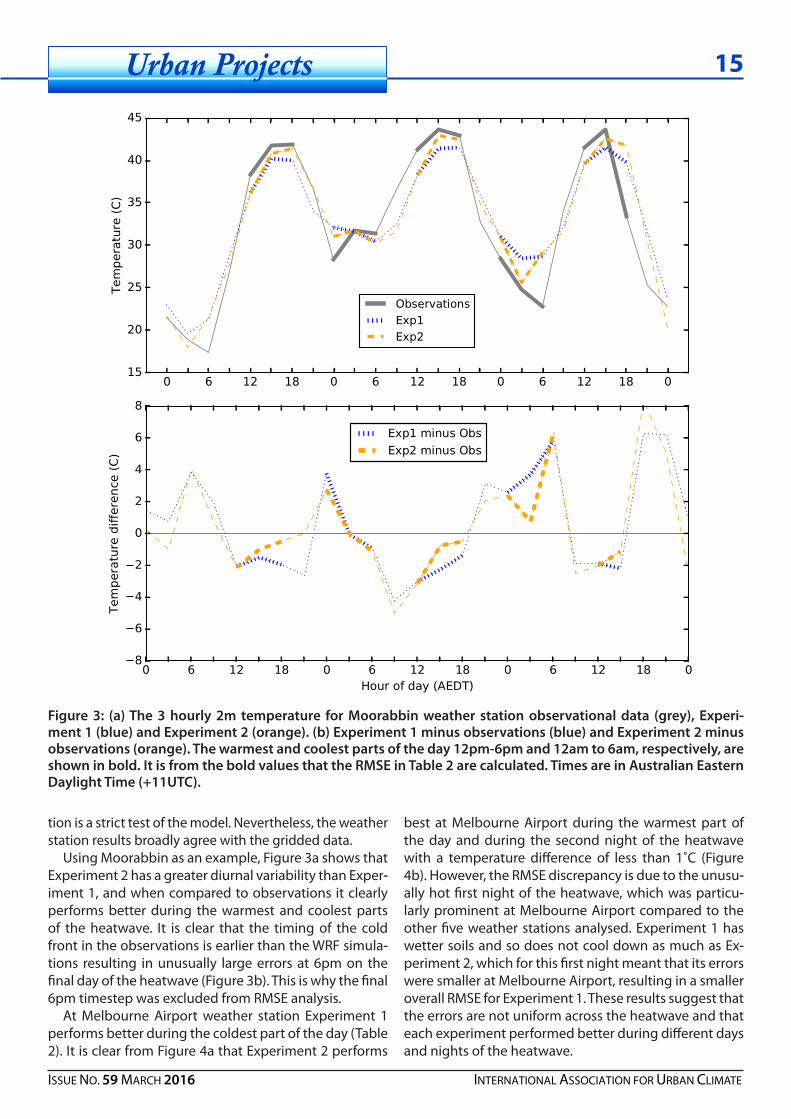
tion is a strict test of the model. Nevertheless, the weather station results broadly agree with the gridded data.
Using Moorabbin as an example, Figure 3a shows that Experiment 2 has a greater diurnal variability than Experbbiment 1, and when compared to observations it clearly performs better during the warmest and coolest parts of the heatwave. It is clear that the timing of the cold front in the observations is earlier than the WRF simulabbtions resulting in unusually large errors at 6pm on the final day of the heatwave (Figure 3b). This is why the final 6pm timestep was excluded from RMSE analysis.
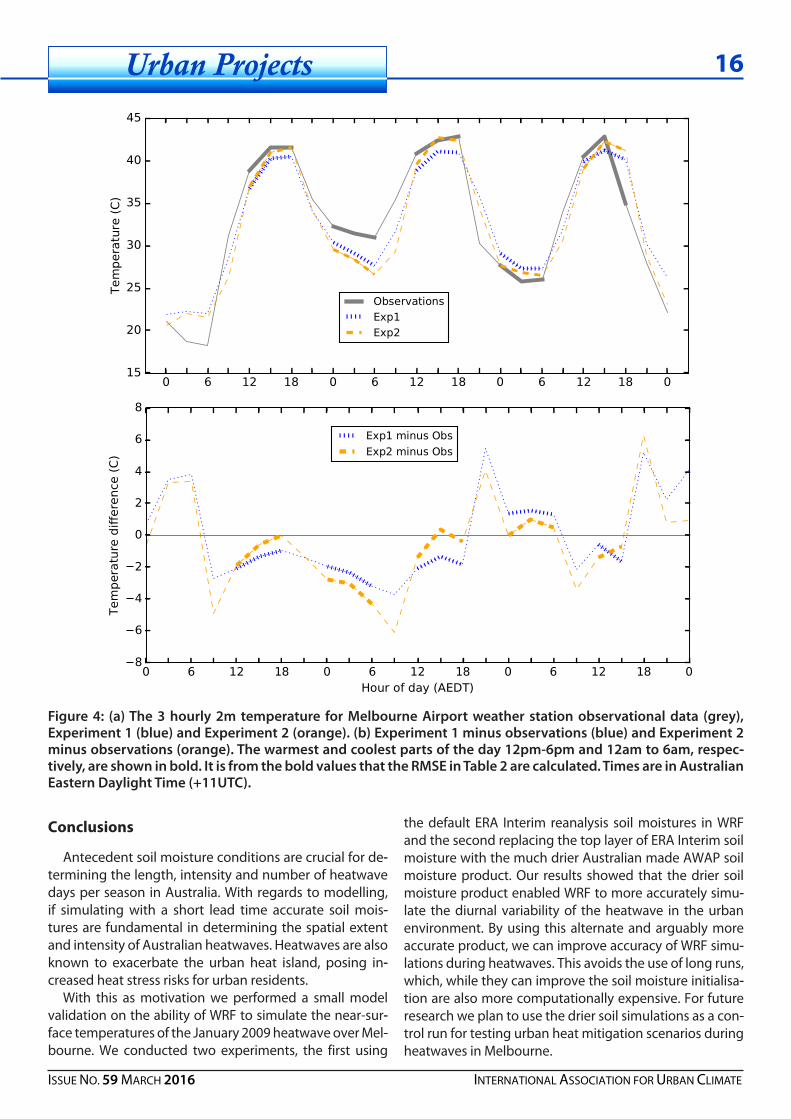
At Melbourne Airport weather station Experiment 1 performs better during the coldest part of the day (Table 2). It is clear from Figure 4a that Experiment 2 performs
best at Melbourne Airport during the warmest part of the day and during the second night of the heatwave with a temperature difference of less than 1˚C (Figure 4b). However, the RMSE discrepancy is due to the unusubbally hot first night of the heatwave, which was particubblarly prominent at Melbourne Airport compared to the other five weather stations analysed. Experiment 1 has wetter soils and so does not cool down as much as Exbbperiment 2, which for this first night meant that its errors were smaller at Melbourne Airport, resulting in a smaller overall RMSE for Experiment 1. These results suggest that the errors are not uniform across the heatwave and that each experiment performed better during different days and nights of the heatwave.
Figure 3: (a) The 3 hourly 2m temperature for Moorabbin weather station observational data (grey), Expericcment 1 (blue) and Experiment 2 (orange). (b) Experiment 1 minus observations (blue) and Experiment 2 minus observations (orange). The warmest and coolest parts of the day 12pmc6pm and 12am to 6am, respectively, are shown in bold. It is from the bold values that the RMSE in Table 2 are calculated. Times are in Australian Eastern Daylight Time (+11UTC).
Urban Projects 16
ISSUE NO. 59 MARCH 2016 INTERNATIONAL ASSOCIATION FOR URBAN CLIMATE
Conclusions
Antecedent soil moisture conditions are crucial for debbtermining the length, intensity and number of heatwave days per season in Australia. With regards to modelling, if simulating with a short lead time accurate soil moisbbtures are fundamental in determining the spatial extent and intensity of Australian heatwaves. Heatwaves are also known to exacerbate the urban heat island, posing inbbcreased heat stress risks for urban residents.
With this as motivation we performed a small model validation on the ability of WRF to simulate the nearbsurbbface temperatures of the January 2009 heatwave over Melbbbourne. We conducted two experiments, the first using
the default ERA Interim reanalysis soil moistures in WRF and the second replacing the top layer of ERA Interim soil moisture with the much drier Australian made AWAP soil moisture product. Our results showed that the drier soil moisture product enabled WRF to more accurately simubblate the diurnal variability of the heatwave in the urban environment. By using this alternate and arguably more accurate product, we can improve accuracy of WRF simubblations during heatwaves. This avoids the use of long runs, which, while they can improve the soil moisture initialisabbtion are also more computationally expensive. For future research we plan to use the drier soil simulations as a conbbtrol run for testing urban heat mitigation scenarios during heatwaves in Melbourne.
Figure 4: (a) The 3 hourly 2m temperature for Melbourne Airport weather station observational data (grey), Experiment 1 (blue) and Experiment 2 (orange). (b) Experiment 1 minus observations (blue) and Experiment 2 minus observations (orange). The warmest and coolest parts of the day 12pmc6pm and 12am to 6am, respeccctively, are shown in bold. It is from the bold values that the RMSE in Table 2 are calculated. Times are in Australian Eastern Daylight Time (+11UTC).

Urban Projects 1�
ISSUE NO. 59 MARCH 2016 INTERNATIONAL ASSOCIATION FOR URBAN CLIMATE
ReferencesArgüeso, D., J. P. Evans, L. Fita, and K. J. Bormann, 2014: Tembb
perature response to future urbanization and climate change. Clim. Dyn., 42, 2183–2199.
——, J. P. Evans, A. J. Pitman, and A. Di Luca, 2015: Effects of City Expansion on Heat Stress under Climate Change Condibbtions. PLoS One, 10.
Chen, F., and Coauthors, 2011: The integrated WRF/urban modelling system: development, evaluation, and applications to urban environmental problems. Int. J. Climatol., 31, 273–288.
Coutts, A. M., J. Beringer, and N. J. Tapper, 2007: Impact of inbbcreasing urban density on local climate: Spatial and temporal variations in the surface energy balance in Melbourne, Austrabblia. J. Appl. Meteorol. Climatol., 46, 477–493.
Cowan, T., A. Purich, S. Perkins, A. Pezza, G. Boschat, and K. Sadler, 2014: More Frequent, Longer, and Hotter Heat Waves for Australia in the TwentybFirst Century. J. Clim., 27, 5851–5871.
Engel, C. B., T. P. Lane, M. J. Reeder, and M. Rezny, 2013: The meteorology of black saturday. Q. J. R. Met. Soc., 139, 585–599.
Evans, J. P., and M. F. McCabe, 2010: Regional climate simulabbtion over Australia’s MurraybDarling basin: A multitemporal asbbsessment. J. Geophys. Res., 115, D14114.
Evans, J. P., and S. Westra, 2012: Investigating the Mechanisms of Diurnal Rainfall Variability Using a Regional Climate Model. J. Clim., 25, 7232–7247.
Fischer, E. M., K. W. Oleson, and D. M. Lawrence, 2012: Conbbtrasting urban and rural heat stress responses to climate change. Geophys. Res. Lett., 39, 1–8.
Georgescu, M., P. E. Morefield, B. G. Bierwagen, C. P. Weaver, 2014: Urban adaptation can roll back warming of emerging megapolitan regions. Proc. Natl. Acad. Sci. USA, 111, 2909b2914.
Hafner, J., and S. Q. Kidder, 1999: Urban Heat Island Modeling in Conjunction with SatellitebDerived Surface/Soil Parameters. J. Appl. Meteorol., 38, 448–465.
Jackson, T. L., J. J. Feddema, K. W. Oleson, G. B. Bonan, J. T. Baubber, 2010: Parameterization of Urban Characteristics for Global Climate Modeling. Ann. Assoc. Am. Geogr., 100, 848b865.
Jacobson, M. Z., 1999: Effects of Soil Moisture on Temperabbtures, Winds, and Pollutant Concentrations in Los Angeles. J. Appl. Meteorol., 38, 607–616.
Jones, D., W. Wang, R. Fawcett, 2009: Highbquality spatial clibbmate databsets for Australia. Aust. Met. Oceanog. J., 58, 233b248.
Kala, J., J. P. Evans, and A. J. Pitman, 2015: Influence of antebbcedent soil moisture conditions on the synoptic meteorology of the Black Saturday bushfire event in southeast Australia. Q. J. R. Meteorol. Soc., 141, 3118–3129.
Kusaka, H., H. Kondo, Y. Kikegawa, and F. Kimura, 2001: A simbbple singleblayer urban canopy model for atmospheric models: Comparison with multiblayer and slab models. Boundary-Layer Meteorology 101(3), 329b358.
Li, D., and E. BoubZeid, 2013: Synergistic interactions between urban heat islands and heat waves: The impact in cities is larger than the sum of its parts. J. Appl. Met. Climat., 52, 2051–2064.
Marshall, A. G., D. Hudson, M. C. Wheeler, O. Alves, H. H. Henbbdon, M. J. Pook, and J. S. Risbey, 2013: Intrabseasonal drivers of extreme heat over Australia in observations and POAMAb2. Clim. Dyn., 1–23.
Nicholls, N., and S. Larsen, 2011: Impact of drought on tembb
perature extremes in Melbourne, Australia. Aust. Meteorol. Oceanogr. J., 61, 113–116.
Nicholls, N., C. Skinner, M. Loughnan, and N. Tapper, 2008: A simple heat alert system for Melbourne, Australia. Int. J. Biome--teorol., 52, 375–384.
Parker, T. J., G. J. Berry, M. J. Reeder, and N. Nicholls, 2014: Modes of climate variability and heat waves in Victoria, southbbeastern Australia. Geophys. Res. Lett, 41, 6926–6934.
Perkins, S. E., D. Argüeso, and C. J. White, 2015: Relationships between climate variability, soil moisture, and Australian heatbbwaves. J. Geophys. Res. Atmos., 120, 8144–8164.
Pezza, A. B., P. van Rensch, and W. Cai, 2011: Severe heat waves in Southern Australia: synoptic climatology and large scale connections. Clim. Dyn., 38, 209–224.
Raupach, M. R., P. R. Briggs, V. Haverd, E. a. King, M. Paget, and C. M. Trudinger, 2009: Australian Water Availability Project (AWAP): CSIRO Marine and Atmospheric Research Component: Final Report for Phase 3. 1b72 pp.
Salamanca, F., A. Martilli, and C. Yagüe, 2012: A numerical study of the Urban Heat Island over Madrid during the DESIREX (2008) campaign with WRF and an evaluation of simple mitigabbtion strategies. Int. J. Climatol., 32, 2372–2386.
Stegehuis, A. I., R. Vautard, P. Ciais, A. J. Teuling, D. G. Miralles, and M. Wild, 2015: An observationbconstrained multibphysbbics WRF ensemble for simulating European mega heat waves. Geosci. Model Dev., 8, 2285–2298.
Ummenhofer, C. C., M. H. England, P. C. Mclntosh, G. A. Meybbers, M. J. Pook, J. S. Risbey, A. Sen Gupta, and A. S. Taschetto, 2009: What causes southeast Australia’s worst droughts? Geo--phys. Res. Lett., 36, 1–5.
Victorian Department of Health, 2009: January 2009 Heatbbwave in Victoria: an Assessment of Health Impacts. https://www2.health.vic.gov.au/getfile/?sc_itemid=%7B78C32CE8bA619b47A6b8ED1b1C1D34566326%7D&title=January 2009 Heatwave in Victoria%3A an Assessment of Health Impacts.
*Australian Research Council Centre of Excellence for Climate System Science
Stephanie Jacobs*
Ailie Gallant* Nigel Tapper
Monash University School of Earth,
Atmosphere and Environment
Coboperative Research Centre for WaterSensitive Cities
Urban Projects 1�
ISSUE NO. 59 MARCH 2016 INTERNATIONAL ASSOCIATION FOR URBAN CLIMATE
IntroductionUrban vegetation plays a critical role in the exchange
of heat and mass across a wide range of scales. Shading and evaporative cooling by trees reduce air and surface temperatures, which can increase human comfort, rebbduce building energy usage, and mitigate the urban heat island effect (Akbari et al., 2001; Oberndorfer et al., 2007; Susca et al., 2011). Urban vegetation can also improve air quality through deposition and respiration processes (Akbari et al., 2001; Nowak et al., 2007).
Despite the clear benefits of urban vegetation, it is dibbcult to determine how their local effects translate across neighborhoodb and citybscales, and the degree to which their benefits offset their costs. It is relatively straightforbbward to determine the local effects of urban vegetation by measuring the surface and air temperature in the dibbrect vicinity of the vegetation. However, the widespread effects of vegetation are extremely difficult to measure directly due to the complicated interactions between micrometeorology and topography.
Remote sensing has been successfully used to meabbsure citywide surface temperature (e.g., Nichol, 2005; Weng, 2009). However, air temperature is the quantity that is most relevant in assessing the microclimate of humans.
Modeling is one commonly used method to fill in the gaps of limited measurements. The wide disparity in length scales between tree, building, and citybscales presents substantial difficulty in modeling the effects of vegetation on urban microclimate. Citybscale models are too coarse to represent localized changes in urban form, and building/treebscale models are too inefficient to feabbsibly represent whole citybscales.
To address these issues, we have developed a new modeling framework that includes highly detailed modbbels for threebdimensionally resolved urban vegetation. The model directly resolves buildings and trees, but is computationally efficient enough to include cityscales.
In this work, the modeling system is used to explore several “what if?” scenarios regarding various urban vegbbetation congurations.
Model overviewThe overall goal of the model is to provide the threeb
dimensional distribution of temperature and temperabbturebrelated quantities (e.g., fluxes of radiation, sensible heat, moisture) in the urban environment over kilomebbterbscales at meter or subbmeter resolution. This requires resolving the effects of individual trees and buildings. It is not feasible to resolve every individual leaf within the domain, as this likely amounts to trillions of leaves in an
Incorporating resolved vegetation in city-scale simulations of urban micrometeorology and its effect on the energy balance
expected urban area. To incorporate subbtree heterogebbneity without having to represent every leaf, vegetation is discretized into subbvolumes of arbitrary shape and size, within which properties are constant (Bailey et al., 2014). Solid surfaces such as the ground or buildings are discretized into subbareas called patches. Using this approach, urban domains can be built up using these primitive elements analogous to Lego® blocks. For each vegetation volume, the user must specify radiative propbberties of the leaves (emissivity, transmissivity, reflectivbbity), the leaf area density, and the leaf angle distribution function. For each patch, radiative properties and the bibdirectional reflectance distribution function (BRDF) must be specified.
Radiation model: Radiation absorption, scattering, and emission by patches or vegetation volumes was modeled using the approach developed by Bailey et al. (2014) and Overby et al. (2016). The model uses a quasibdeterministic ray tracing approach to determine radiabbtion transport over PAR, NIR, and TIR bands. The effects of leaf anisotropy are incorporated by integrating the leaf angle distribution function to determine radiation transfer parameters (e.g., attenuation coefficient, scatbbtering phase function).
Surface energy balance model: Surface fluxes of heat and moisture, as well as surface temperature were modbbeled using the approach of Bailey et al. (2016). The rabbdiation model described above is used to drive a surface energy balance model for all surfaces and vegetation volumes in the domain, which considers a balance bebbtween radiation, sensible heat, latent heat, and, in the case of the ground and buildings, energy storage.
Turbulent transport model: Turbulent transport is the mechanism that couples heat and moisture transport between individual elements in the urban domain. The model of Briggs (2015) was used, which solves an advecbb
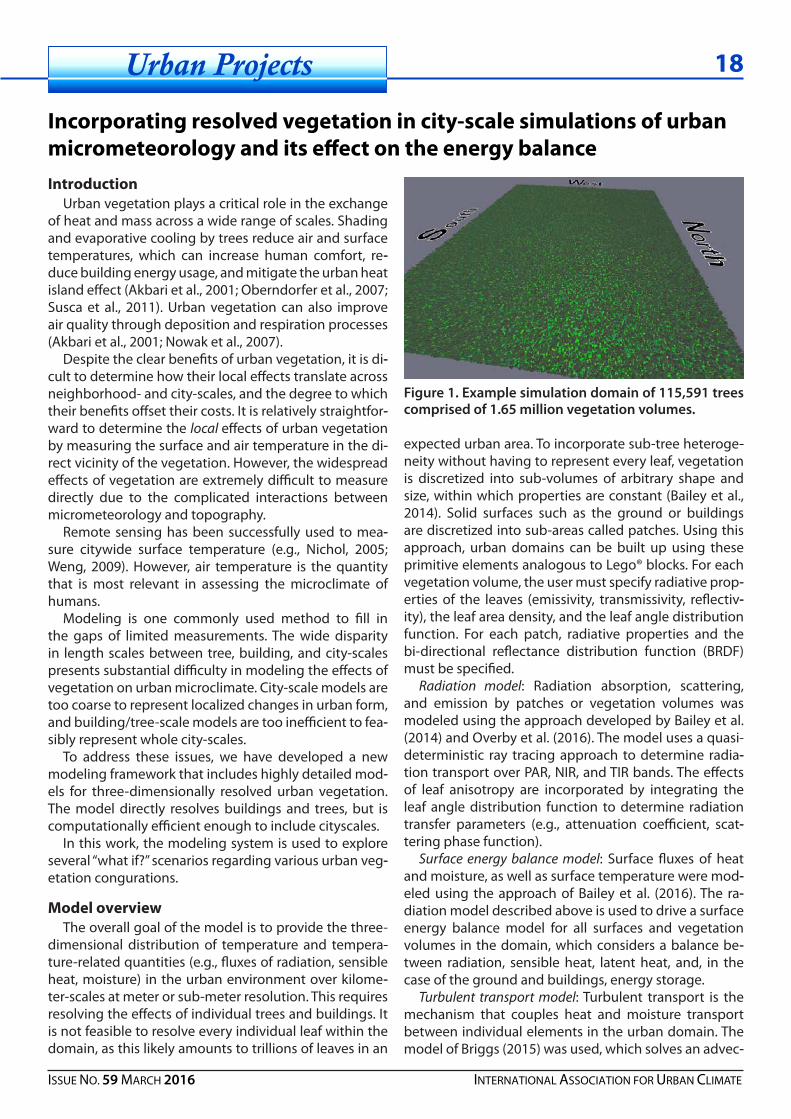
Figure 1. Example simulation domain of 115,591 trees comprised of 1.65 million vegetation volumes.

Urban Projects 19
ISSUE NO. 59 MARCH 2016 INTERNATIONAL ASSOCIATION FOR URBAN CLIMATE
tionbdiffusion equation for heat and moisture. The advecbbtion component requires a threebdimensional prediction of the ensemble turbulent wind field, which is provided by the Quick Urban & Industrial Complex (QUIC) model (Singh et al., 2008).
GPU accelerationThe above models have high demands in terms of
computational resources. This means that standard desktop and laptop computers are not powerful enough to run them in a reasonable length of time. Supercombbputers provide the required power, but many anticipatbbed model users (e.g., urban planners) do not have access to supercomputing resources.
Graphics processing units (GPUs), which are standard hardware on all desktop and laptop computers, are esbbsentially miniature supercomputers that were designed to perform graphicsbrelated computations with high efbbficiency. They are exceptionally suited to perform the expensive raybtracing calculations associated with the radiation models. The NVIDIA OptiX raybtracing framebbwork was used to perform highly efficient radiation simulations in parallel on commodityblevel GPUs. Bailey et al. (2014) showed that using this framework allowed the execution time of the radiation models to scale linbbearly with domain size. This has allowed us to run dobbmains with hundreds of thousands of trees at subbmeter resolution (Fig. 1). Additionally, the turbulent transport model is also accelerated by leveraging the parallelism afforded by the GPUs.
Impact of urban vegetation on citywide micro--climate
The simulation tool was used to examine various urbbban vegetation scenarios in Salt Lake City, UT USA. City databases of building and tree locations were used to reconstruct a 5 km2 area of the downtown portion of the city. This area consisted of 552 buildings and 1,812 trees, each of which were resolved by a model grid of size 4 m3 (Fig. 2).
The simulations were driven by a mean wind origibbnating out of the Southwest (Fig. 3a). The mean air temperature was set at 21oC. Radiative conditions were characteristic of Salt Lake City for clearbsky conditions on October 1.
Figure 3 shows simulated air and surface temperature distributions for 14:00 local time. Substantial reductions in surface temperature can be seen in areas of shadow, vegetation, and grass. The range of surface temperature in the domain is greater than 15oC. However, reductions in air temperature are much less dramatic (range of less than 3oC), as localized effects of heterogeneity are mixed out by turbulent transport.
To assess the impacts of trees on microclimate, three
different scenarios were simulated. Cases were considbbered with no trees, the actual number of trees, and doubbble the actual number of trees. Plane averages of tembbperature are given in Fig. 4 for each of these cases. Values at a height of zero correspond to surface temperatures.
Trees reduced the domainbaveraged surface temperabbture, but this reduction was small at about 0.5oC. When the number of trees was doubled, the average surface temperature was only negligibly reduced. This indicated a scenario of diminishing returns, where trees began to shade each other rather than the ground. Air temperabbture was negligibly impacted by vegetation at all heights. Although localized reductions in air temperature due to vegetation can be several degrees, overall these reducbbtions were negligible when integrated over the entire domain.
ReferencesAkbari, H., M. Pomerantz, and H. Taha (2001). Cool surbb
faces and shade trees to reduce energy use and improve air quality in urban areas. Solar Energy 70, 295b310.
Bailey, B. N., M. Overby, P. Willemsen, E. R. Pardyjak, W. F. Mahaee, and R. Stoll (2014). A scalable plantbresolving radiative transfer model based on optimized GPU ray tracing. Agric. For. Meteorol. 198b199, 192b208.
Bailey, B. N., R. Stoll, E. R. Pardyjak, and N. E. Miller (2016). A new threebdimensional energy balance model for complex plant canopy geometries: Model developbbment and improved validation strategies. Agric. For. Me--teorol. 218b219, 146b160.
Briggs, K. A. (2015). valuation of moisture and heat
Figure 2. Salt Lake City test case, which consists of 552 buildings and 1,812 trees. Individual buildings shown in blue, trees shown in green.

Urban Projects 20
ISSUE NO. 59 MARCH 2016 INTERNATIONAL ASSOCIATION FOR URBAN CLIMATE
transport in the fastbresponse buildingresolving urban transport code QUIC EnvSim. Master’s thesis, University of Utah, Salt Lake City, UT.
Nichol, J. (2005). Remote sensing of urban heat islands by day and night. Photogramm. Eng. Remote Sens. 5, 613b621.
Nowak, D. J., D. E. Crane, and J. C. Stevens (2007). Air polluion removal by urban trees and shrubs in the Unitbbed States. Urb. For. & Urb. Green. 4, 115b123.
Oberndorfer, E., J. Lundholm, B. Bass, R. R. Coman, H. Doshi, N. Dunnett, S. Gan, M. Köhler, K. K. Y. Liu, and B. Rowe (2007). Green roofs as urban ecosystems: Ecobblogical structures, functions, and services. BioScience 57, 823b833.
Overby, M., P. Willemsen, B. N. Bailey, S. Halverson, and
(a)
(b)
(c)
Figure 3. Salt Lake City test case simulation of (a) mean wind velocity vectors at a height of 2 m, (b) air temccperature at a height of 2 m, (c) surface temperature.
Figure 4: Profiles of temperature for various vegetation scenarios: no trees, the actual number of trees, and double the actual number of trees. The temperature at a height of zero corresponds to the average surface temperature, and all other heights correspond only to air temperature.
E. R. Pardyjak (2016). A rapid and scalable radiation transbbfer model for complex urban domains. Urban Climate 15, 25b44.
Singh, B., B. S. Hansen, M. J. Brown, and E. R. Pardyjak (2008). Evaluation of the QUICURB fast response urban wind model for a cubical building array and wide buildbbing street anyon. Environ. Fluid Mech. 8, 281b312.
Susca, T., S. R. Gan, and G. R. Dell’Osso (2011). Positive effects of vegetation: Urban heat island and green roofs. Environ. Pollution 159, 2119b2126.
Weng, Q. (2009). Thermal infrared remote sensing for urban climate and environmental studies: Methods, apbbplications, and trends. ISPRS J. Photogramm. Remote Sens. 64, 335b344.
Brian N. [email protected]
United States Department of AgricultureAgricultural Research Service, Corvallis, OR

21
ISSUE NO. 59 MARCH 2016 INTERNATIONAL ASSOCIATION FOR URBAN CLIMATE
Special Report
ZERO-PLUS: Achieving near-zero and positive energy settlements in Europe using advanced energy technology
By David Pearlmutter, Editor
In Europe, over 40% of final energy use occurs in resibbdential and commercial buildings, making the “building sector” the largest consumer of energy and emitter of carbon. There is a growing reliance in much of Europe on energybintensive airbconditioning, which is expected to intensify in a climate that is warming both globally due to climate change, and locally in cities due to UHI effects. In addition to the implications for public health and wellbbeing, the burden of rising energy consumpbbtion in buildings has a pronounced economic dimenbbsion, as fuel poverty becomes a reality for an increasing number of EU citizens.
In response to a growing perception that the trajecbbtory of energy use patterns in buildings is not sustainbb
able, the European Union has established specific polibbcies aimed at reducing fossil fuel consumption and their related greenhouse gas emissions. The “Europe 2020” strategy adopted by the European Commission stipubblates three targets to be met by the year 2020 (relative to 1990): a reduction in GHG emissions of 20%, an inbbcrease in energy efficiency of 20%, and an increase in the contribution of renewable energy sources equivalent to 20% of final energy consumption. By simultaneously rebbducing consumption and relying on “clean”production, a goal has emerged of achieving “net zerobenergy” (NZE) – by which energy consumption decreases over time and is eventually matched by an equivalent supply of energy from renewable sources. Net zerobenergy buildbbings are thus intended to have highly energy efficient performance, and the low amount of energy that they require comes from sustainable nonbfossil resources.
Partners in the European ZEROcPLUS project met recently in Dalmine, Italy to discuss advanced technoloccgies for achieving extreme energy efficiency – highlighting the multicfaceted relationship between climate and the built environment.

22
ISSUE NO. 59 MARCH 2016 INTERNATIONAL ASSOCIATION FOR URBAN CLIMATE
Special Report
The “Energy Performance in Buildings Directive” (EPBD) issued by the EU requires that by the year 2020, all new buildings be “nearly” zerobenergy.
This month in Dalmine, Italy, a diverse group of Eurobbpean academics, practitioners and industrial partners met to demonstrate the feasibility of achieving the net zerobenergy concept in practice. They are contributors to an ambitious Horizon 2020 project entitled “Achieving near Zero and Positive Energy Settlements in Europe using Adbbvanced Energy Technology” or ZERObPLUS – which aims to show that at an urban scale, residential settlements can not only be designed to produce more energy than they consume, but they can also be realized with significantly reduced costs.
The project is being coordinated by Prof. Mat Santamouris from the University of Athens, and includes research partners from a host of institutions around Eubbrope. The selected “zerobplus” technologies will be intebbgrated in the design and construction of four actual case study projects in Italy, Cyprus, France and the UK. In each of these “settlementbscale” case studies, advanced techbbnologies which are found to be most cost effective for the particular climate and site requirements will be selected and implemented. The investment in these technologies will be concentrated in four main areas that are considbbered critical for minimizing the “net” consumption of enbbergy: a) energybconserving building envelope systems, b) highbefficiency heating and cooling systems, c) renewable and lowbcarbon energy supply systems, and c) smart enerbbgy management systems for optimizing the distribution of energy services at the building and settlement level. Much of the design emphasis at the settlement scale is placed on contributing to UHI mitigation, and in turn to energy conservation through reduced cooling loads.
While the zerobenergy concept has largely focused until
now on achieving a net zero balance within the framework of an individual building, the settlement scale has imporbbtant advantages in terms of energy management. Taking advantage of energy exchange within a local “smartbgrid“ overcomes important limitations of “autonomous buildbbings,” for which onbsite energy storage can be prohibitivebbly expensive. Such storage is essential given the intermitbbtent nature of solar radiation and wind flow, the primary renewable sources of energy for local power generation.
Even if individual buildings within a neighborhood or district do not meet the NZE target due to limiting factors such as their inefficient spacebtobvolume ratio, or their sizbbable energy demand due to specific needs, the cumulative NZE balance still can be achieved at a larger scale if there is compensation by other buildings with better perforbbmance. This framework potentially allows greater flexibilbbity in architectural design, and a larger variety of building forms and functions. With a mix of residential and combbmercial uses, for example, large structures such as parkbbing facilities and commercial buildings may provide ample space for onbsite energy generation using rooftop solar photovoltaic panels, while reducing the embodied energy of ground based PV field arrays which require dedicated foundations and supporting structures.
According to a study conducted by the International Energy Agency in 2010, more than 200 projects around the world have been realized in the last two decades with a reputable claim of a net zerobenergy balance. Every year more and more projects are being built, since more debbvelopers and architects are inspired by the demonstrated benefits of the NZE building approach. The increasing efficiency and affordability of technologies is also a sigbbnificant convincing factor – which is why the ZERObPLUS demonstration of feasability in actual built projects is so important.
Zerocenergy settlements use efficiently designed buildings and systems to reduce energy demand to a minimum, and then meet this demand by generating renewable energy oncsite. The ZEROcPLUS project will demonstrate that this ambitious strategy for cutting carbon emissions can be achieved at a significantly lowered cost. Pictured above: the existing BedZed development in London (left) and Schlierberg settlement in Freiburg (right).

Bibliography 23
ISSUE NO. 59 MARCH 2016 INTERNATIONAL ASSOCIATION FOR URBAN CLIMATE
Recent Urban Climate PublicationsAbdrabo M, Hassaan MA (2015) An integrated framework for urban resilience to climate change – Case study: Sea level rise impacts on the Nile Delta coastal urban areas. Urban Climate 14, Part 4:554b565.Archer D, Dodman D (2015) Making capacity building critical: Power and justice in building urban climate resilbbience in Indonesia and Thailand. Urban Climate 14, Part 1:68b78.Ascione F, Böttcher O, Kaltenbrunner R, Vanoli GP (2015) Methodology of the costboptimality for improvbbing the indoor thermal environment during the warm season. Presentation of the method and application to a new multibstorey building in Berlin. Applied Energy (doi:10.1016/j.apenergy.2015.10.169).Aylett A (2015) Institutionalizing the urban governance of climate change adaptation: Results of an international survey. Urban Climate 14, Part 1:4b16.Azevedo JA, Chapman L, Muller CL (2016) Quantifying the Daytime and NightbTime Urban Heat Island in Birbbmingham, UK: A Comparison of Satellite Derived Land Surface Temperature and High Resolution Air Temperabbture Observations. Remote Sensing 8:153.Bajanski IV, Milocevic DD, Savic SM (2015) Evaluation and improvement of outdoor thermal comfort in urban areas on extreme temperature days: Applications of automatic algorithms. Building and Environment 94, Part 2:632b643.Behera SN, Sharma M, Mishra PK, Nayak P, DamezbFonbbtaine B, Tahon R (2015) Passive measurement of NO2 and application of GIS to generate spatiallybdistributed air monitoring network in urban environment. Urban Cli--mate 14, Part 3:396b413.Belanger D, Abdous B, Gosselin P, Valois P (2015) An adbbaptation index to high summer heat associated with adverse health impacts in deprived neighborhoods. Cli--matic Change 132:279b293.BothambMyint D, Recktenwald GW, Sailor DJ (2015) Therbbmal footprint effect of rooftop urban cooling strategies. Urban Climate 14, Part 2:268b277.Brink J (2015) Boundary tracking and estimation of polbblutant plumes with a mobile sensor in a lowbdensity statbbic sensor network . Urban Climate 14, Part 3:383b395.Buchin O, Hoelscher MT, Meier F, Nehls T, Ziegler F (2016) Evaluation of the healthbrisk reduction potential of counbbtermeasures to urban heat islands. Energy and Buildings 114:27b37.Buzan JR, Oleson K, Huber M (2015) Implementation and comparison of a suite of heat stress metrics within the Community Land Model version 4.5. Geoscientific Model Development 8:151b170.Calcerano F, Martinelli L (2016) Numerical optimisation
In this edition a list is presented of publications that have generally come out between Decem--ber 201� and February201�. As usual, papers published since this date are welcome for inclubbsion in the next newsletter and IAUC online dabbtabase. Please send your references to the email address below with a header “IAUC publications” and the following format: Author, Title, Journal, Year, Volume, Issue, Pages, Dates, Keywords, URL, and Abstract. In order to make the lives of the Bibliography Committee members easier, please send the references in a .bib format.
Please note that we are still supporting (young) researchers to join and contribute to the Committee. If you are interested to join or would like to receive more information, please let me know via the email address below.
Regards,
Matthias Demuzere
Department of Earth andEnvironmental Sciences,KU Leuven, Belgium
through dynamic simulation of the position of trees around a standbalone building to reduce cooling energy consumption. Energy and Buildings 112:234b243.Calmet I, Mestayer P (2015) Study of the thermal internal boundary layer during seabbreeze events in the complex coastal area of Marseille. Theoretical and Applied Clima--tology 123:801b826.Castaldo VL, Coccia V, Cotana F, Pignatta G, Pisello AL, Rossi F (2015) Thermalbenergy analysis of natural “cool» stone aggregates as passive cooling and global warming mitigation technique. Urban Climate 14, Part 2:301b314.Castell N, Kobernus M, Liu HY, Schneider P, Lahoz W, Berre AJ, Noll J (2015) Mobile technologies and services for enbbvironmental monitoring: The CitibSensebMOB approach. Urban Climate 14, Part 3:370b382.Charabi Y, AlbYahyai S (2015) Evaluation of ensemble NWP models for dynamical downscaling of air temperature over complex topography in a hot climate: A case study from the Sultanate of Oman. Atmosfera 28:261b269.Conry P, Sharma A, Potosnak MJ, Leo LS, Bensman E, Hellmann JJ, Fernando HJS (2015) Chicago’s Heat Island and Climate Change: Bridging the Scales via Dynamical Downscaling. J. Appl. Meteor. Climatol. 54:1430b1448.

Bibliography 2�
ISSUE NO. 59 MARCH 2016 INTERNATIONAL ASSOCIATION FOR URBAN CLIMATE
Costanzo V, Evola G, Marletta L (2016) Energy savings in buildings or UHI mitigation? Comparison between green roofs and cool roofs. Energy and Buildings 114:247b255.Cui D, Mak C, Kwok K, Ai Z (2016) CFD simulation of the effect of an upstream building on the interbunit disperbbsion in a multibstory building in two wind directions. Journal of Wind Engineering and Industrial Aerodynamics 150:31b41.D. Akbari, S. Homayouni, A. Safari, Mehrshad N (2016) Mapping urban land cover based on spatialbspectral classification of hyperspectral remotebsensing data. In--ternational Journal of Remote Sensing 37:440b454.Da Silva RG, Maia ASC, Macedo Costa LL (2014) Index of thermal stress for cows (ITSC) under high solar radiation in tropical environments. International Journal of Biome--teorology 59:551b559.Despini F, Ferrari C, Bigi A, Libbra A, Teggi S, Muscio A, Ghermandi G (2016) Correlation between remote sensbbing data and ground based measurements for solar rebbflectance retrieving. Energy and Buildings 114:227b233.Duarte DHS, Shinzato P, Gusson C, Alves CA (2015) The impact of vegetation on urban microclimate to counterbbbalance built density in a subtropical changing climate. Urban Climate 14, Part 2:224b239.E. Li, P. Du, A. Samat, J. Xia, Che M (2015) An automatic approach for urban landbcover classification from Landbbsatb8 OLI data. International Journal of Remote Sensing 36:5983b6007.Eicker U, Monien D, Duminil É, Nouvel R (2015) Energy performance assessment in urban planning competibbtions. Applied Energy 155:323b333.Engel BA, Ahiablame LM, Leroy JD (2015) Modeling the impacts of urbanization on lake water level using LbTHIA. Urban Climate 14, Part 4:578b585.Feng X, Myint SW (2016) Exploring the effect of neighbbboring land cover pattern on land surface temperature of central building objects. Building and Environment 95:346b354.Filho EPM, Oliveira AP, Vita WA, Mesquita FLL, Codato G, Escobedo JF, Cassol M, França JRA (2016) Global, diffuse and direct solar radiation at the surface in the city of Rio de Janeiro: Observational characterization and empirical modeling. Renewable Energy 91:64b74.Ganeshan M, Murtugudde R (2015) Nocturnal propagatbbing thunderstorms may favor urban “hotbspots”: A modbbelbbased study over Minneapolis. Urban Climate 14, Part 4:606b621.Garschagen M, RomerobLankao P (2013) Exploring the relationships between urbanization trends and climate change vulnerability. Climatic Change 133:37b52.Greene JS, Kalkstein LS, Kim KR, Choi YbJ, Lee DbG (2015)
The application of the European heat wave of 2003 to Korean cities to analyze impacts on heatbrelated mortalbbity. International Journal of Biometeorology 60:231b243.Gros A, Bozonnet E.and Inard C, Musy M (2016) Simulabbtion tools to assess microclimate and building energy b A case study on the design of a new district. Energy and Buildings 114:112b122.Gualtieri G, Toscano P, Crisci A, Di Lonardo S, Tartaglia M, Vagnoli C, Zaldei A, Gioli B (2015) Influence of road traffic, residential heating and meteorological condibbtions on PM10 concentrations during air pollution critical episodes. Environmental Science and Pollution Research 22:19027b19038.Guan M, Sillanpaa N, Koivusalo H (2016) Storm runoff rebbsponse to rainfall pattern, magnitude and urbanization in a developing urban catchment. Hydrological Processes 30:543b557.Guo X, Sun Y, Miao S (2015) Characterizing Urban Turbbbulence Under Haze Pollution: Insights into TemperabbturebHumidity Dissimilarity. Boundary-Layer Meteorology 158:501b510.Hab K, Ruddell BL, Middel A (2015) Sensor lag correction for mobile urban microclimate measurements. Urban Cli--mate 14, Part 4:622b635.Han Y, Taylor JE, Pisello AL (2015) Exploring mutual shadbbing and mutual reflection interbbuilding effects on buildbbing energy performance. Applied Energy (doi:10.1016/j.apenergy.2015.10.170).Hendel M, Royon L (2015) The effect of pavementbwaterbbing on subsurface pavement temperatures. Urban Cli--mate 14, Part 4:650b654.
Henschel S, Tertre AL, Atkinson RW, Querol X, Pandolfi M, Zeka A, Haluza D, Analitis A, Katsouyanni K, Bouland C, Pascal M, Medina S, Goodman PG (2015) Trends of nibbtrogen oxides in ambient air in nine European cities bebbtween 1999 and 2010. Atmospheric Environment 117:234 b241.
Hirano Y, Fujita T (2016) Simulating the CO2 reduction caused by decreasing the air conditioning load in an urbbban area. Energy and Buildings 114:87b95.
Ho H, Knudby A, Xu Y, Hodul M, Aminipouri M (2016) A comparison of urban heat islands mapped using skin temperature, air temperature, and apparent temperabbture (Humidex), for the greater Vancouver area. Science of The Total Environment 544:929b938.
Hoelscher MT, Nehls T, Janicke B, Wessolek G (2016) Quantifying cooling effects of facade greening: Shadbbing, transpiration and insulation. Energy and Buildings 114:283b290.
Holman C, Harrison R, Querol X (2015) Review of the efbbficacy of low emission zones to improve urban air qualbb

Bibliography 2�
ISSUE NO. 59 MARCH 2016 INTERNATIONAL ASSOCIATION FOR URBAN CLIMATE
ity in European cities. Atmospheric Environment 111:161 b169.Horvath M, KassaibSzoo D, Csoknyai T (2016) Solar enbbergy potential of roofs on urban level based on building typology. Energy and Buildings 111:278b289.Hu L, Monaghan AJ, Brunsell NA (2015) Investigation of Urban Air Temperature and Humidity Patterns during Extreme Heat Conditions Using SatellitebDerived Data. J. Appl. Meteor. Climatol. 54:2245b2259.Hughes S (2015) A metabanalysis of urban climate change adaptation planning in the U.S. Urban Climate 14, Part 1:17b29.Hurth V, McCarney P (2015) COMMENTARY: Internationbbal standards for climatebfriendly cities. Nature Climate Change 5, 1025b1026.Irga PJ, Burchett MD, Torpy FR (2015) Does urban forestry have a quantitative effect on ambient air quality in an urban environment? Atmospheric Environment 120:173b181.J. Wang, Q. Zhan, H. Guo, Jin Z (2016) Characterizing the spatial dynamics of land surface temperaturebimpervibbous surface fraction relationship. International Journal of Applied Earth Observation and Geoinformation 45:55b65.Jarvinen A, Kuuluvainen H, Niemi JV, Saari S, Maso MD, Pirjola L, Hillamo R, Janka K, Keskinen J, Ronkko T (2015) Monitoring urban air quality with a diffusion charger based electrical particle sensor. Urban Climate 14, Part 3:441b456.Jeanjean APR, Hinchliffe G, McMullan WA, Monks PS, Leigh RJ (2015) A study on the effectiveness of trees to disperse road traffic emissions at a city scale. Atmospher--ic Environment 120:1b14.Jeong MbA, Park S, Song GbS (2016) Comparison of hubbman thermal responses between the urban forest area and the central building district in Seoul, Korea. Urban Forestry & Urban Greening 15:133b148.Jim CY (2015) Thermal performance of climber greenbbwalls: Effects of solar irradiance and orientation. Applied Energy 154:631b643.Jin K, Wang F, Chen D, Jiao Q, Xia L, Fleskens L, Mu X (2015) Assessment of urban effect on observed warming trends during 1955–2012 over China: a case of 45 cities. Climatic Change 132:631b643.Kaloustian N, Diab Y (2015) Effects of urbanization on the urban heat island in Beirut. Urban Climate 14, Part 2:154b165.Kamal S, Huang HbP, Myint SW (2015) The Influence of Urbanization on the Climate of the Las Vegas Metrobbpolitan Area: A Numerical Study. J. Appl. Meteor. Climatol. 54:2157b2177.Kanda I, Yamao Y (2016) Passive scalar diffusion in and
above urbanblike roughness under weakly stable and unstable thermal stratification conditions. Journal of Wind Engineering and Industrial Aerodynamics 148:18b33.Karagulian F, Belis CA, Dora CFC, PrüssbUstün AM, Bonbbjour S, AdairbRohani H, Amann M (2015) Contributions to cities’ ambient particulate matter (PM): A systematic review of local source contributions at global level. At--mospheric Environment 120:475b483.Ketterer C, Matzarakis A (2014) Comparison of different methods for the assessment of the urban heat island in Stuttgart, Germany. International Journal of Biometeorol--ogy 59:1299b1309.Kikumoto H, Ooka R, Arima Y (2016) A study of urban thermal environment in Tokyo in summer of the 2030s under influence of global warming. Energy and Buildings 114:54b61.Kleerekoper L, Dobbelsteen A, Ham E, Hordijk T, Marbbtin C (2015) Creating drafts in urban settings through coloured façades: Exploring a new climate adaptation measure based on thermal stratification. Urban Climate 14, Part 2:290b300.Klein PM, Hu XbM, Shapiro A, Xue M (2015) Linkages Bebbtween BoundarybLayer Structure and the Development of Nocturnal LowbLevel Jets in Central Oklahoma. Bound--ary-Layer Meteorology 158:383b408.Kochanski AK, Pardyjak ER, Stoll R, Gowardhan A, Brown MJ, Steenburgh WJ (2015) OnebWay Coupling of the WRF–QUIC Urban Dispersion Modeling System. J. Appl. Meteor. Climatol. 54:2119b2139.
Konarska J, Uddling J, Holmer B, Lutz M, Lindberg F, Pleijel H, Thorsson S (2015) Transpiration of urban trees and its cooling effect in a high latitude city. International Journal of Biometeorology 60:159b172.
Kraxner F, Aoki K, Kindermann G, Leduc S, Albrecht F, Liu J, Yamagata Y (2016) Bioenergy and the city b What can urban forests contribute? Applied Energy 165:990b1003.
Krayenhoff ES, Voogt JA (2016) Daytime Thermal Anisotbbropy of Urban Neighbourhoods: Morphological Causabbtion. Remote Sensing 8:108.
Krebs G, Kuoppamaki K, Kokkonen T, Koivusalo H (2016) Simulation of green roof test bed runoff. Hydrological Processes 30:250b262.
Kumar P, Feiz AbA, Ngae P, Singh SK, Issartel JbP (2015) CFD simulation of shortbrange plume dispersion from a point release in an urban like environment. Atmospheric Environment 122:645b656.
Kuras ER, Hondula DM, BrownbSaracino J (2015) Heterobbgeneity in individually experienced temperatures (IETs) within an urban neighborhood: insights from a new apbbproach to measuring heat exposure. International Jour--nal of Biometeorology 59:1363–1372.

Bibliography 26
ISSUE NO. 59 MARCH 2016 INTERNATIONAL ASSOCIATION FOR URBAN CLIMATE
Lau KK, Ren C, Ho J, Ng E (2016) Numerical modelling of mean radiant temperature in highbdensity subbtropical urban environment. Energy and Buildings 114:80b86.Lazzarini M, Molini A, Marpu PR, Ouarda TBMJ, Ghedira H (2015) Urban climate modifications in hot desert citbbies: The role of land cover, local climate, and seasonality. Geophysical Research Letters 42(22)9980b9989.Lee H, Mayer H, Chen L (2016) Contribution of trees and grasslands to the mitigation of human heat stress in a residential district of Freiburg, Southwest Germany. Landscape and Urban Planning 148:37b50.Lee T, Painter M (2015) Comprehensive local climate polbbicy: The role of urban governance. Urban Climate 14, Part 4:566b577.Lee YY, Kim JT, Yun GY (2016) The neural network predicbbtive model for heat island intensity in Seoul. Energy and Buildings 110:353b361.Lemonsu A, Viguie V, Daniel M, Masson V (2015) Vulnerbbability to heat waves: Impact of urban expansion scenarbbios on urban heat island and heat stress in Paris (France). Urban Climate 14, Part 4:586b605.Liu X, Hu G, Ai B, Li X, Shi Q (2015) A Normalized Urban Areas Composite Index (NUACI) Based on Combination of DMSPbOLS and MODIS for Mapping Impervious Surbbface Area. Remote Sensing 7:17168b17189.Lobaccaro G, Acero JA (2015) Comparative analysis of green actions to improve outdoor thermal comfort inbbside typical urban street canyons. Urban Climate 14, Part 2:251b267.Luo Z, Yang L, Liu J (2016) Embodied carbon emissions of office building: A case study of China’s 78 office buildbbings. Building and Environment 95:365b371.Magli S, Lodi C, Contini FM, Muscio A, Tartarini P (2016) Dynamic analysis of the heat released by tertiary buildbbings and the effects of urban heat island mitigation stratbbegies. Energy and Buildings 114:164b172.Maia PA, Ruas ÁCé, Bitencourt DP (2015) Wetbbulb globe temperature index estimation using meteorological data from Sao Paulo State, Brazil. International Journal of Biometeorology 59:1395b1403.Martin M, Afshari A, Armstrong PR, Norford LK (2016) A new validation protocol for an urban microclimate modbbel based on temperature measurements in a Central Eubbropean city. Energy and Buildings 114:38b53.Mason LR, Agan TC (2015) Weather variability in urban Philippines: a gender analysis of household impacts. Cli--matic Change 132:589b599.Moloney S, Fanfgeld H (2015) Emergent processes of adaptive capacity building: Local government climate change alliances and networks in Melbourne. Urban Cli--mate 14, Part 1:30b40.
Morabito M, Crisci A, Messeri A, Orlandini S, Raschi A, Mabbracchi G, Munafa M (2016) The impact of builtbup surfacbbes on land surface temperatures in Italian urban areas. Science of The Total Environment 551b552:317b326.Morille B, Musy M, Malys L (2016) Preliminary study of the impact of urban greenery types on energy consumpbbtion of building at a district scale: Academic study on a canyon street in Nantes (France) weather conditions. En--ergy and Buildings 114:275b282.Musy M, Malys L, Morille B, Inard C (2015) The use of SOLENEbmicroclimat model to assess adaptation stratbbegies at the district scale. Urban Climate 14, Part 2:213b223.N. S. Ngo, Horton RM (2016) Climate change and fetal health: The impacts of exposure to extreme temperabbtures in New York City. Environmental Research 144:158b164.Nakayoshi M, Kanda M, Shi R, Dear R (2014) Outdoor therbbmal physiology along human pathways: a study using a wearable measurement system. International Journal of Biometeorology 59:503b515.Nazarian N, Kleissl J (2016) Realistic solar heating in urbbban areas: Air exchange and streetbcanyon ventilation. Building and Environment 95:75b93.Nelson MA, Brown MJ, Halverson SA, Bieringer PE, Anbbnunzio A, Bieberbach G, Meech S (2015) A Case Study of the Weather Research and Forecasting Model Applied to the Joint Urban 2003 Tracer Field Experiment. Part 1: Wind and Turbulence. Boundary-Layer Meteorology 158:285b309.
Nguyen JL, Dockery DW (2015) Daily indoorbtoboutdoor temperature and humidity relationships: a sample across seasons and diverse climatic regions. International Jour--nal of Biometeorology 60:221b229.
Noro M, Lazzarin R (2015) Urban heat island in Padua, Itbbaly: Simulation analysis and mitigation strategies. Urban Climate 14, Part 2:187b196.
Ohashi Y, Ihara T, Kikegawa Y, Sugiyama N (2016) Numeribbcal simulations of influence of heat island countermeabbsures on outdoor human heat stress in the 23 wards of Tokyo, Japan. Energy and Buildings 114:104b111.
Ordoñez C, Duinker PN (2015) Climate change vulnerbbability assessment of the urban forest in three Canadian cities. Climatic Change 131:531b543.
Ouldboukhitine SbE, Belarbi R, Sailor DJ (2014) Experibbmental and numerical investigation of urban street canbbyons to evaluate the impact of green roof inside and outbbside buildings. Applied Energy 114:273b282.
Pagnini LC, Burlando M, Repetto MP (2015) Experimental power curve of smallbsize wind turbines in turbulent urbbban environment. Applied Energy 154:112b121.

Bibliography 2�
ISSUE NO. 59 MARCH 2016 INTERNATIONAL ASSOCIATION FOR URBAN CLIMATE
Papantoniou S, Kolokotsa DD (2016) Prediction of outbbdoor air temperature using neural networks: Application in 4 European cities. Energy and Buildings 114:72b79.Park SbJ, Kim JbJ, Kim MJ, Park RJ, Cheong HbB (2015) Charbbacteristics of flow and reactive pollutant dispersion in urbbban street canyons. Atmospheric Environment 108:20b31.Phelan PE, Kaloush K, Miner M, Golden J, Phelan B, III HS, Taylor RA (2015) Urban Heat Island: Mechanisms, Implibbcations, and Possible Remedies. Annual Review of Envi--ronment and Resources 40:285b307.Pisello AL, Castaldo VL, Pignatta G, Cotana F, Santamouris M (2016) Experimental inblab and inbfield analysis of wabbterproof membranes for cool roof application and urban heat island mitigation. Energy and Buildings 114:180b 190.Polydoros A, Cartalis C (2015) Assessing the impact of urban expansion to the state of thermal environment of periburban areas using indices. Urban Climate 14, Part 2:166b175.Pomerantz M, Rosado PJ, Levinson R (2015) A simple tool for estimating citybwide annual electrical energy savings from cooler surfaces. Urban Climate 14, Part 2:315b325.Putro B, Kjeldsen T, Hutchins M, Miller J (2016) An empiribbcal investigation of climate and landbuse effects on wabbter quantity and quality in two urbanising catchments in the southern United Kingdom. Science of The Total Envi--ronment 548b549:164b172.Qaid A, Ossen DR (2014) Effect of asymmetrical street asbbpect ratios on microclimates in hot, humid regions. Inter--national Journal of Biometeorology 59:657–677.Rafiee A, Dias E, Koomen E (2016) Local impact of tree volume on nocturnal urban heat island: A case study in Amsterdam. Urban Forestry & Urban Greening 16:50b61.Rasul A, Balzter H, Smith C (2015) Spatial variation of the daytime Surface Urban Cool Island during the dry season in Erbil, Iraqi Kurdistan, from Landsat 8. Urban Climate 14, Part 2:176b186.Razzaghmanesh M, Beecham S, Salemi T (2016) The role of green roofs in mitigating Urban Heat Island effects in the metropolitan area of Adelaide, South Australia. Ur--ban Forestry & Urban Greening 15:89b102.Reinmann A, Hutyra L, Trlica A, Olofsson P (2016) Assessbbing the global warming potential of human settlement expansion in a mesic temperate landscape from 2005 to 2050. Science of The Total Environment 545b546:512b524.Ren G, Li J, Ren Y, Chu Z, Zhang A, Zhou Y, Zhang L, Zhang Y, Bian T (2015) An Integrated Procedure to Determine a Reference Station Network for Evaluating and Adjusting Urban Bias in Surface Air Temperature Data. J. Appl. Me--teor. Climatol. 54:1248b1266.Rodopoulou S, Samoli E, Analitis A, Atkinson RW,
de’Donato FK, Katsouyanni K (2015) Searching for the best modeling specification for assessing the effects of temperature and humidity on health: a time series analybbsis in three European cities. International Journal of Bio--meteorology 59:1585b1596.Rosenfelder M, Koppe C, Pfafferott J, Matzarakis A (2015) Effects of ventilation behaviour on indoor heat load based on test reference years. International Journal of Biometeorology 60:277b287.Rossi F, Bonamente E, Nicolini A, Anderini E, Cotana F (2016) A carbon footprint and energy consumption asbbsessment methodology for UHIbaffected lighting sysbbtems in built areas. Energy and Buildings 114:96b103.Ruiz MA, Sosa MB, Cantaloube ENC, Canton MA (2015) Suitable configurations for forested urban canyons to mitigate the UHI in the city of Mendoza, Argentina. Ur--ban Climate 14, Part 2:197b212.Ryan D (2015) From commitment to action: a literature review on climate policy implementation at city level. Climatic Change 131:519b529.Saaroni H, Pearlmutter D, Hatuka T (2015) Humanbbiobbmeteorological conditions and thermal perception in a Mediterranean coastal park. International Journal of Bio--meteorology 59:1347b1362.Sailor DJ, Georgescu M, Milne JM, Hart MA (2015) Develbbopment of a national anthropogenic heating database with an extrapolation for international cities. Atmospher--ic Environment 118:7b18.Salamanca F, Georgescu M, Mahalov A, Moustaoui M (2015) Summertime Response of Temperature and Coolbbing Energy Demand to Urban Expansion in a Semiarid Environment. J. Appl. Meteor. Climatol. 54:1756b1772.Sarralde JJ, Quinn DJ, Wiesmann D, Steemers K (2015) Sobblar energy and urban morphology: Scenarios for increasbbing the renewable energy potential of neighbourhoods in London. Renewable Energy 73:10b17.
Sarzynski A (2015) Public participation, civic capacity, and climate change adaptation in cities. Urban Climate 14, Part 1:52b67.
Savage MJ (2015) Nowcasting daily minimum air and grass temperature. International Journal of Biometeorol--ogy 60:183b194.
Schaeffer L, CrouybChanel P, Wagner Vé, Desplat J, Pascal M (2015) How to estimate exposure when studying the temperaturebmortality relationship? A case study of the Paris area. International Journal of Biometeorology 60:73b83.
Sekertekin A, Kutoglu SH, Kaya S (2016) Evaluation of spatiobtemporal variability in Land Surface Temperature: A case study of Zonguldak, Turkey. Environmental Moni--toring and Assessment 188:30.

Bibliography 2�
ISSUE NO. 59 MARCH 2016 INTERNATIONAL ASSOCIATION FOR URBAN CLIMATE
Shahrestani M, Yao R, Luo Z, Turkbeyler E, Davies H (2015) A field study of urban microclimates in London. Renew--able Energy 73:3b9.Shahtahmassebi AR, Song J, Zheng Q, Blackburn GA, Wang K, Huang LY, Pan Y, Moore N, Shahtahmassebi G, Haghighi RS, Deng JS (2016) Remote sensing of impervibbous surface growth: A framework for quantifying urban expansion and rebdensification mechanisms. Interna--tional Journal of Applied Earth Observation and Geoinfor--mation 46:94b112.Shkaruba A, Skryhan H, Kireyeu V (2015) Sensebmaking for anticipatory adaptation to heavy snowstorms in urbbban areas. Urban Climate 14, Part 4:636b649.Shrubsole C, Das P, Milner J, Hamilton IG, Spadaro JV, Oikonomou E, Davies M, Wilkinson P (2015) A tale of two cities: Comparison of impacts on CO2 emissions, the inbbdoor environment and health of home energy efficiency strategies in London and Milton Keynes. Atmospheric En--vironment 120:100b108.Shui T, Liu J, Zhang P, Liu S, Zhao Z (2016) Development of an urban canopy model for the evaluation of urban thermal climate with snow cover in severe cold regions. Building and Environment 95:160b170.Simões T, Estanqueiro A (2016) A new methodology for urban wind resource assessment. Renewable Energy 89:598b605.Sismanidis P, Keramitsoglou I, Kiranoudis CT (2015) A satbbellitebbased system for continuous monitoring of Surface Urban Heat Islands. Urban Climate 14, Part 2:141b153.Smoliak BV, Snyder PK, Twine TE, Mykleby PM, Hertel WF (2015) Dense Network Observations of the Twin Cities CanopybLayer Urban Heat Island. J. Appl. Meteor. Clima--tol. 54:1899b1917.Solecki W, Seto KC, Balk D.and Bigio A, Boone CG, Creutbbzig F, Fragkias M, Lwasa S, Marcotullio P, RomerobLankao P, Zwickel T (2015) A conceptual framework for an urban areas typology to integrate climate change mitigation and adaptation. Urban Climate 14, Part 1:116b137.Son JbY, Gouveia N, Bravo MA, Freitas CU, Bell ML (2015) The impact of temperature on mortality in a subtropical city: effects of cold, heat, and heat waves in Sao Paulo, Brazil. International Journal of Biometeorology 60:113b121.Song J, Tse K, Tamura Y, Kareem A (2016) Aerodynamics of closely spaced buildings: With application to linked buildings. Journal of Wind Engineering and Industrial Aerodynamics 149:1b16.
Sun Y, Yang Y, Zhang L, Wang Z (2015) The relative roles of climate variations and human activities in vegetation change in North China. Physics and Chemistry of the Earth, Parts A/B/C 87b88:67b78.
Sun Y, Yang Y, Zhang Y, Wang Z (2015) Assessing vegetabbtion dynamics and their relationships with climatic varibbability in northern China. Physics and Chemistry of the Earth, Parts A/B/C 87b88:79b86.Tan Z, Lau KK, Ng E (2016) Urban tree design approachbbes for mitigating daytime urban heat island effects in a highbdensity urban environment. Energy and Buildings 114:265b274.Taylor J, Wilkinson P, Davies M, Armstrong B, Chalabi Z, Mavrogianni A, Symonds P, Oikonomou E, Bohnenstenbbgel SI (2015) Mapping the effects of urban heat island, housing, and age on excess heatbrelated mortality in London. Urban Climate 14, Part 4:517b528.Tayyebi A, Darrel G (2016) Increases in the climate change adaption effectiveness and availability of vegetation across a coastal to desert climate gradient in metropolibbtan Los Angeles, CA, USA. Science of The Total Environ--ment 548b549:60b71.TojabSilva F, LopezbGarcia O, Peralta C, Navarro J, Cruz I (2016) An empiricalbheuristic optimization of the buildbbingbroof geometry for urban wind energy exploitation on highbrise buildings. Applied Energy 164:769b794.Touchaei AG, Akbari H (2015) Evaluation of the seasonal effect of increasing albedo on urban climate and energy consumption of buildings in Montreal. Urban Climate 14, Part 2:278b289.Touchaei AG, Hosseini M, Akbari H (2016) Energy savings potentials of commercial buildings by urban heat island reduction strategies in Montreal (Canada). Energy and Buildings 110:41b48.V. Arroyo, J. Diaz, C.Ortiz, C. Roth, M.Saez, Linares C (2016) Short term effect of air pollution, noise and heat waves on preterm births in Madrid (Spain). Environmental Re--search 145:162b168.Wahl T, Jain S, Bender J, Meyers SD, Luther ME (2015) Inbbcreasing risk of compound flooding from storm surge and rainfall for major US cities. Nature Climate Change 5, 1093–1097. Waite M, Modi V (2014) Potential for increased windbgenbberated electricity utilization using heat pumps in urban areas. Applied Energy 135:634b642.Wang J, Zhan Q, Guo H (2016) The Morphology, Dynambbics and Potential Hotspots of Land Surface Temperature at a Local Scale in Urban Areas. Remote Sensing 8(1):18.Wang M, Chang HbC, Merrick J, Amati M (2016) Assessbbment of solar radiation reduction from urban forests on buildings along highway corridors in Sydney. Urban For--estry & Urban Greening 15:225b235.Wang Y, Berardi U, Akbari H (2016) Comparing the effects of urban heat island mitigation strategies for Toronto, Canada. Energy and Buildings 114:2b19.
Conferences 29
ISSUE NO. 59 MARCH 2016 INTERNATIONAL ASSOCIATION FOR URBAN CLIMATE
FIRST INTERNATIONAL CONFERENCE ON URBAN PHySICS (FICUP)Quito b Galápagos • Sept 25 b Oct 2, 2016http://www.ficup2016.com/
2ND URBAN & INFRASTRUCTURE DEvELOPMENT CONFERENCE FOR EAST AND CENTRAL AFRICAKampala, Uganda • October 5b6, 2016http://uidc.siup.ac.ug/
Upcoming Conferences...
INTERNATIONAL CONFERENCE ON COUNTERMMMEASURES TO URBAN HEAT ISLANDSNUS, Singapore • May 30 b June 1, 2016http://www.ic2uhi2016.org/
EUROPEAN FORUM ON URBAN FORESTRy(EFUF 2016)Ljubljana, Slovenia • May 31 b June 4, 2016http://efuf2016.gozdis.si/
Wang Y, Li L, Kubota J, Han R, Zhu X, Lu G (2016) Does urbbbanization lead to more carbon emission? Evidence from a panel of BRICS countries. Applied Energy 168:375b380.
Wang ZbH, Zhao X, Yang J, Song J (2016) Cooling and enbbergy saving potentials of shade trees and urban lawns in a desert city. Applied Energy 161:437b444.
Watanabe S, Ishii J (2016) Effect of outdoor thermal enbbvironment on pedestrians> behavior selecting a shaded area in a humid subtropical region. Building and Environ--ment 95:32b41.
Wong PPbY, Lai PbC, Low CbT, Chen S, Hart M (2016) The impact of environmental and human factors on urban heat and microclimate variability. Building and Environ--ment 95:199b208.
Xie YL, Huang GH, Li W, Ji L (2014) Carbon and air pollutbbants constrained energy planning for clean power genbberation with a robust optimization model: A case study of Jining City, China. Applied Energy 136:150b167.
Xu X, Culligan PJ, Taylor JE (2014) Energy Saving Alignbbment Strategy: Achieving energy efficiency in urban buildings by matching occupant temperature preferbbences with a building’s indoor thermal environment. Ap--plied Energy 123:209b219.
Yang B, Ke X (2015) Analysis on urban lake change durbbing rapid urbanization using a synergistic approach: A case study of Wuhan, China. Physics and Chemistry of the Earth, Parts A/B/C 89b90:127b135.
Yang F, Chen L (2016) Developing a thermal atlas for climatebresponsive urban design based on empirical modeling and urban morphological analysis. Energy and Buildings 111:120b130.
Yang S, Changshan W (2015) Examining the impact of urban biophysical composition and neighboring envibbronment on surface urban heat island effect. Advances in Space Research 57:96b109.
Yi W, Chan APC (2014) Erratum to: Effects of temperature on mortality in Hong Kong: a time series analysis. Inter--national Journal of Biometeorology 59:937b937.
Yoshida A, Hisabayashi T, Kashihara K, Kinoshita S, Hashibbda S (2015) Evaluation of effect of tree canopy on therbbmal environment, thermal sensation, and mental state. Urban Climate 14, Part 2:240b250.
Zeiger S, Hubbart J, Anderson S, Stambaugh M (2016) Quantifying and modelling urban stream temperature: a central US watershed study. Hydrological Processes 30:503b514.
Zhang LY, Jin LW, Wang ZN, Zhang JY, Liu X, Zhang LH (2015) Effects of wall configuration on building energy performance subject to different climatic zones of China. Applied Energy (doi:10.1016/j.apenergy.2015.10.086).
Zhang N, Du Y, Miao S (2015) A microscale model for air pollutant dispersion simulation in urban areas: Presentabbtion of the model and performance over a single buildbbing. Advances in Atmospheric Sciences 33:184b192.
Zhong S, Yang XbQ (2015) Mechanism of urbanization impact on a summer coldbfrontal rainfall process in the greater beijing metropolitan area. J. Appl. Meteor. Clima--tol. 54:1234b1247.
Zhou D, Zhang L, Hao L, Sun G, Liu Y, Zhu C (2016) Spabbtiotemporal trends of urban heat island effect along the urban development intensity gradient in China. Science of The Total Environment 544:617b626.

IAUC Board
IAUC Board Members & Terms
• Gerald Mills (UCD, Dublin, Ireland): 2007b2011; President, 2009b2013; Past President, 2014b2018 (nv)
• James Voogt (University of Western Ontario, Canada), 2000b2006; Webmaster 2007b2013; President, 2014b2018
• Andreas Christen (University of British Columbia, Canada): 2012b2016
• Rohinton Emmanuel (Glasgow Caledonian University, UK): 2006b2010; Secretary, 2009b2013; Past Secretary 2014b2018 (nv)
• David Pearlmutter (BenbGurion University of the Negev, Israel): Newsletter Editor, 2009b*
• Aude Lemonsu (CNRS, France): 2010b2014; ICUCb9 Local Orgabbnizer, 2013b2018 (nv)
• David Sailor (Arizona State University, USA): 2011b2015; Secrebbtary, 2014b2018
• Alexander Baklanov (University of Copenhagen): 2013b2017
• Curtis Wood (Finnish Meteorological Inst., Finland): 2013b2017
• Valéry Masson (Météo France, France): ICUCb9 Local Organizer, 2013b2018 (nv)
• Fei Chen (NCAR, USA): 2014b2018
• Edward Ng (Chinese University of Hong Kong, Hong Kong): 2014b2018
• Nigel Tapper (Monash University, Australia): 2014b2018
• Aya Hagishima (Kyushu University, Japan): 2015b2019
• Jorge Gonzales (CUNY, USA): ICUCb10 Local Organizer, 2016b2021
• Dev Niyogi (Purdue University, USA): ICUCb10 Local Organizer, 2016b2021
* appointed membersnv = non-voting
IAUC Committee Chairs
Editor, IAUC Newsletter: David Pearlmutter
Bibliography Committee: Matthias Demuzere
Chair Teaching Resources: Gerald Mills
Chair Awards Committee: Nigel Tapper
Webmaster: James Voogt
Newsletter ContributionsThe next edition of Urban Climate News will appear in late June. Contributions for the upcoming issue are welcome, and should be submitted by May 31, 2016.
Editor: David Pearlmutter ([email protected])
News: Paul Alexander ([email protected])
Conferences: Jamie Voogt ([email protected])
Bibliography: Matthias Demuzere ([email protected])
Projects: Sue Grimmond ([email protected])
Submissions should be concise and accessible to a wide audience. The articles in this Newsletter are unrefereed, and their appearbbance does not constitute formal publication; they should not be used or cited otherwise.
30
ISSUE NO. 59 MARCH 2016 INTERNATIONAL ASSOCIATION FOR URBAN CLIMATE
(continued from page 1)The good news (as I see it) is that IAUC/ICUC already
do quite a few of the things that are on the suggested response list: we meet less than annually, we use online infrastructure for archiving ICUC materials (see http://www.urbanbclimate.org/icuc/), and we tend to meet in major cities. What can we do better? Two of their sugbbgestions resonated with me: allow easier remote access to some or all of the conference and to strengthen rebbgional conferences associated with the association. Perbbhaps we can, in conjunction with future ICUC organizers, help facilitate online access to our conference. This can occur through member participation online, or, in a difbbferent example provided in the petition FAQ, through the selected remote plenary presentation by speakers who might otherwise not attend ICUC. And the strong interest in hosting an ICUC, as reflected in the quality and number of proposals for hosting ICUCb10, might suggest that IAUC could consider a regional level of conference to accommodate the growing interest in urban climates and climate change, while also respecting the impact our travel has on the environment. Perhaps the two can even be joined – a regional, onbline conference? An idea to contemplate perhaps? I’d welcome your thoughts and ideas. In the meantime, the IAUC Board will work with ICUCb10 organizers to ensure we work towards best practices in reducing the environmental impact of our conference.
Prof. Arieh Bitan (right), a former IAUC Board memccber and recipient of the 2006 Luke Howard Award, was recently presented with a citation for Lifetime Contribution by the president of the Israeli Meccteorological Society, Dr. Noah Wolfson (left). This distinction was given previously to Prof. yair Goldccreich, the 2013 Luke Howard Award winner.