Toward More Efficient Transport: The Inductrack Maglev System

263
4
China’s Urbanization and Land: A Framework for Reform
Introduction Land is of central importance to China’s urbanization, economic growth, and social stability. Since the late 1970s, land has been an essential element in the government’s efforts to promote more market orientation. The government gradually developed a regu-latory framework that consistently and suc-cessively strengthened individual property rights to land and promoted a more market-oriented allocation of land (box 4.1). The for-mulation of China’s urbanization strategy for the next decade now provides an opportunity to further reform and deepen the regulatory and institutional framework for land and to modernize land administration and man-agement to support efficient and inclusive growth and urbanization.
As urbanization accelerated over the past decades, the shortcomings of China’s dual-track rural-urban land tenure system became more evident, stimulating many provinces and municipalities to experiment with inno-vative land tenure arrangements. Land reform can build on these local experiences to establish the regulatory and institutional foundation that can help guarantee the long-
term and effi cient supply of land and fi nanc-ing needed for urbanization that is based on transparent and voluntary market trans-actions and taxation. Reform also should ensure that the benefits from urbanization can be shared more equitably among China’s citizens. To achieve that aim, reform has to tackle the dependency of China’s growth model on government-led rural land conver-sion and ensure the equitable treatment of rural and urban land and property holders during urbanization. This reform will require further strengthening and protecting of indi-vidual property rights to land, in particular rural land, and clarifying collective owner-ship arrangements.
Undertaking land reform, the reform of the public finance system (see supporting report 6), and the reform of the hukou system requires a carefully coordinated approach.1 Reform needs to recalibrate the use of land, improve the governance of the land, and reduce the government’s dependence on rev-enue from land conversion and land sales. Reform could also help facilitate the transition from land asset sales to modern taxation that fi ts the needs of future sustainable urbaniza-
264 U r b a n C h i n a
China’s land policy and legal framework has evolved continuously and consistently in response to eco-nomic and social changes and challenges. The broad policy directions adopted over the past decades illus-trate that tenure security, property rights, and market mechanisms are recognized as important prerequi-sites for China’s future development. The history of land policy reform shows a consistent trend of gradu-ally embodying policies into laws to achieve a com-prehensive legal and institutional framework for land.
The Household Responsibility System of 1978 introduced a rural property system whereby farm-land, though nominally remaining under collective ownership, was contracted to individual house-holds, initially for a 5-year lease period that was later extended to 15 years (1984) and 30 years (1993). By 1983, virtually all arable land had been allocated to rural households. The Household Responsibility System was the most important driving force behind China’s agricultural growth and poverty reduction during the first decade of the reform period.
Central Document No. 1 of 1984 (Notice on Rural Work for the Year 1984) established the foundation of the present Chinese rural land rights system. The document clarified the separation of collective own-ership from individual land use rights and stipulated that collective land be contracted to households for a term of 15 years. It allowed for the voluntary transfer of individual land rights between farmers within the collective. Central Document No. 11 of 1993 (Several Measures on Current Agricultural and Rural Eco-nomic Development) further strengthened the House-hold Responsibility System. It required that farmland rights be extended for another term of 30 years upon the expiration of the initial 15-year lease period. It endorsed transfers of farmland rights for value with prior consent from the collective and restricted the periodic readjustment of farmland rights through administrative means of the collective. Central Docu-ment No. 16 of 1996 (Notice on Further Stabilizing and Improving the Rural Land Contracting Relation-ship) explicitly prohibited large readjustments and restricted small readjustments by requiring approval by two-thirds of the villager assembly and the town-ship and county governments. The document pro-hibited all forms of compulsory, nonvoluntary-scale farming implemented through administrative order.
The Land Management Law of 1986/88 adopted the Hong Kong Leasehold System and legalized pri-
Box 4.1 The evolution of China’s policy framework of land, 1978–2013
vate use rights to publicly owned land. It also pro-vided the legal basis for transferring such rights between private users and thereby created the con-ditions for mobilizing capital through land trans-fers. The revised Land Management Law of 1998 mandated that collectively owned farmland be con-tracted to rural households for a term of 30 years. The revised law also set forth procedures to govern the requisition of farmland by the state but did not include provisions on prior notification, participation in determining compensation, and appeal during expropriation.
The Interim Regulations on Allocation and Granting of Urban State-Owned Land Use Rights of 1990 defined urban land rights as (a) unmarket-able allocated rights available for public use and (b) marketable granted private use rights for a term of 70 years. It also provided rules that govern these granted private use rights and thus created the conditions for the development of China’s urban land markets.
Central Document No. 18 of 2001 (Notice on Transfers of Rural Households’ Use Rights of Con-tracted Land) provided further guidance on rural land by prohibiting the compulsory taking-back of land rights by collectives and contracting to nonmem-bers for value.
The Rural Land Contracting Law of 2002 com-prehensively regulates the extent of farmers’ land rights. It provides that rural land contracting and operation, rights that are held by farmer house-holds, may be transferred to other village house-holds, leased to nonvillage households, exchanged, assigned, or transacted by other means in accordance with the law. The law also provides legal remedies for any violations.
The Property Law of 2007 is China’s first compre-hensive civil property code. It articulates that all types of property in China (state, collective, and private) are entitled to the same level of legal protection. The law clarifies that collectively owned land is owned by all members of the community rather than by the col-lective entity. It characterizes farmers’ rural land use rights as property rights, as opposed to contractual rights defined by previous laws, and provides greater protection for small farmers’ land rights. It also reaf-firms the provisions of the Rural Land Contracting Law but categorizes farmers’ 30-year land right as extendable upon expiration. Regardless of the type of land transaction, land rights transfers must adhere
C h i n a ’ s U r b a n i z a t i o n a n d l a n d : a f r a m e w o r k f o r r e f o r m 265
to the principles of voluntariness and free negotiation between the transferor and the transferee, compen-sation, freedom from compulsion, content and for-mal procedure, specification of contract terms, and a requirement that transferees possess agricultural operational capacity.
The Decision on Several Important Issues of Rural Reform of the Third Plenary Session of the 17th Central Committee of the Communist Party of China (CPC), 2008, declared that farmers’ land rights will be for “a long term without change,” setting forth the direction for upgrading the 30-year land rights into de facto perpetual rights. The decision also distin-guished between public interest use and commercial use when converting agricultural land into urban construction land, and required that conversions for commercial use outside the planned urban areas not be made through eminent domain expropriation. The decision called for affirming farmers’ land rights through registration and certification.
The Regulation on Expropriation of and Compen-sation for Buildings on State-Owned Land of 2011 (the Urban Takings Regulation) defines, explicitly and unambiguously, the needs of public interest for which the state may resort to eminent domain power to expropriate urban private property. The regulation includes three unprecedented features: a list of the purposes for which the state may take private prop-erty; a requirement that all public purpose projects must be implemented by government and for public use by a public institution, a clause that emphasizes the public interest principle; and the exclusion of local governments’ discretion to expand the list for any nonlisted public interest purposes. The scope of expropriation can be expanded only through law, stipulated by the National People’s Congress, or through administrative regulation, stipulated by the State Council in accordance with China’s Legislation Law of 2000.
Central Documents No. 1 from 2010 to 2013 reit-erated the need to affirm farmers’ property rights to
Box 4.1 (continued)
land through the registering and certifying of their farmland, forestland, and residential land rights, and the need to establish a rural land registration sys-tem. In Central Document No. 1 of 2013, the central authorities also advanced the target of registering and certifying farmers’ land rights within five years.a
Several central documents issued between 2004 and 2013 set policy guidelines for protecting farm-ers’ land rights in the process of urbanization and industrialization. The State Council’s Document No. 28 of 2004 (Decision on Deepening Reforms and Intensifying Strict Land Management) requires the state to follow the principle of restoring farmers’ original living standards and ensuring their long-term livelihoods when determining compensation for land expropriation. The State Council’s Document No. 9 of 2011 (Notice on Actively and Carefully Pushing Reforms in the Institutions for Residential Registra-tion Management) explicitly prohibits compulsory taking-back, directly or indirectly, of migrant farm-workers’ land rights, including residential land, ara-ble land, forestland, and grassland rights, when they move to cities and obtain urban residential registra-tion. In Central Document No. 1 of 2013, the Central Committee and the State Council jointly require that farmers’ living standards be raised and their long-term livelihoods be ensured when their land is taken for urbanization or industrialization.
Land policy and legal reform has progressed and deepened significantly, but ensuring fully secure, marketable, and long-term land rights for all farm-ers remains challenging. A revision of the Land Man-agement Law is expected to close important legal gaps with regard to (a) clarifying the scope of state expropriations for public purpose, (b) determining compensation approaches for rural land takings and allocating compensation between the collective and individual farmer, and (c) strengthening tenure secu-rity and extending legal protection of farmers’ rights to all types of land, including residential land and col-lective construction land.
Source: Li and Wang 2013.a. Central Document No. 1 of 2010, Several Opinions on Strengthening Integrated Urban-Rural Development and Further Solidifying the Foundation of Agricultural and Rural Development; Central Document No. 1 of 2011, Decision on Speeding Up Reform and Development of Water Conservancy; Central Document No. 1 of 2012, Several Opinions on Speeding Up Agricultural Scientific and Technological Innovation and Sustainably Increasing Capacity for Provision of Agricultural Products; and Central Document No. 1 of 2013, Several Opinions on Speeding Up Development of Modern Agriculture and Further Strengthening Rural Development Vitality.

266 U r b a n C h i n a
tion, deepens land markets, and clarifies for rural citizens their property rights and land assets at home and their opportunities and entitlements for integration into the cities.
China’s dual-track tenure system still sepa-rates collectively owned rural land and state-owned urban land, which are governed by separate regulations and institutions. Reform should aim at gradually removing the com-plexity and contradictions inherent in this dual-track tenure system, in particular, the ambiguities of China’s collective rural land ownership. The separation between rural and urban land governance contributes to the persistent disparities between rural and urban residents. Reform, therefore, needs to cut across the rural and urban spaces if dis-parity is to be reduced. Land reform should gradually reduce the role of government in the land allocation process and allow for market allocation and the integration of the rural and urban land markets.
The overhaul of China’s rural land req-uisition system could help reduce hard-ship and discontent in rural areas and bring social benefits by improving efficiency in the land allocation process. Reform will involve amending China’s land laws and regulations to clarify and define the “public purpose” for which land can be expropriated by the gov-ernment, restricting current rural land-taking practices, and introducing approaches that increase compensation standards for requi-sitioned land. Legal reform should protect farmers’ property rights to rural land through property rights confirmation and land titling. Building on international experience, the marketability of rural land and property needs strengthening to supply land for urban development more efficiently and support the consolidation of farmland that is needed for agricultural sector development and income growth in rural areas.
The integration of peri-urban collec-tive land and property, along with migrant residents, into China’s cities and the urban economy needs to be supported. Reform needs to focus on the integration of rural and urban construction land markets to allow more equitable sharing of the benefits of urbanization between rural and urban
citizens. Reform could provide the founda-tion for the redevelopment of urban fringe areas in socially acceptable ways, formalize informal housing rights in urban villages, and strengthen market-based mechanisms to promote the provision of low-cost and legally protected housing for China’s migrant population. New approaches to govern agri-cultural and nonagricultural collective assets can be considered.
In addition, China’s land administra-tion and management apparatus need to be modernized, including the development of modern institutions, skills, and professional services. This modernization will likely be a longer-term task that will involve developing regulations and institutions for the manage-ment and governance of land, such as cadas-tral systems, land use control mechanisms, land market regulations, land valuation and taxation approaches, and arbitration and appeals mechanisms.
The underlying issues that necessitate fur-ther reform of China’s land tenure frame-work and the modernization of its land management system have evolved since the 1990s. As market reforms advanced, gov-ernment-led industrialization and urbaniza-tion policies and programs capitalized on land but in distinctively different ways. Local governments successfully pursued an indus-trialization model that built on the inflow of foreign direct investment and globalization, an abundant supply of rural labor, and local competition. In promoting growth, local gov-ernments could build on a highly conducive land tenure framework that allowed them the exclusive power to acquire, convert, and sup-ply rural land for industrial use.
China successfully industrialized using this process, but it has not become an urbanized society because the integration of China’s labor supply into the urban areas and the workers’ transformation into urban citizens have remained incomplete. China’s many migrant workers are the visible outcome of this incomplete transformation process. The partial urban integration of migrants is apparent, for example, in the informal and mutual arrangements between migrants and rural collectives in peri-urban areas. Migrants

C h i n a ’ s U r b a n i z a t i o n a n d l a n d : a f r a m e w o r k f o r r e f o r m 267
in search of affordable housing have met with rural collectives that supply land and housing at the urban fringe. The informal urbaniza-tion of rural peri-urban areas and migrants and the persistent rural-urban disparities are a result of China’s land conversion–based industrial and urban development.
Local implementation of economic, land, and fiscal policy and, at times, abuse of local government power have led to unin-tended consequences that are widely viewed as unsustainable. The global financial crisis of 2008 and the subsequent stimulus policies have had a dramatic impact on China’s land-based economic growth model through accel-erated land taking and conversion, bring-ing the inefficiencies of current land tenure arrangements and the need for reform into even clearer focus.
Incentives and inefficient land allocation patterns
China’s municipalities are responsible for economic development and employment generation, in addition to more traditional responsibilities of managing municipal ser-vices. Gross domestic product (GDP) growth is an important metric by which mayors are held accountable by higher levels of govern-ment, which leads to a narrow focus on GDP growth. Because local governments are the owners of all urban land in their jurisdiction, they have strong incentives to supply cheap land for industrial use to generate economic growth. But because many local governments follow the same approach, cheap land is not a comparative advantage. Instead, excessive supply of industrial land has fueled the inef-ficient growth of urban boundaries and pro-liferation of industrial development zones. Simultaneously, the tightly controlled sup-ply of land for urban use has contributed to record prices for residential and commercial land, leading to housing price bubbles. Gov-ernments not only control land conversion and land supply but also set policies and land use planning regulations, approvals, and implementation, thereby contributing to inef-ficient urban growth patterns, violations of land-related regulations, and rent seeking.
Fiscal dependence on land-based income
The combination of China’s land tenure and public finance system, including cheap access of local governments to land, monopoly power in land supply, and unbalanced rev-enue and expenditure assignments, provides strong incentives for local governments to generate local revenue from land sales. Many governments have become reliant on rural land expropriation and land concession income. Revenue from land sales provides a significant share of local government rev-enues. They also have a widespread reliance on mortgage loans backed by future land sales, which are offered through local land banks, that help circumvent restrictions on local government borrowing. Both practices have contributed to the aggressive requisi-tioning of farmland, which contributes to unsustainable local finance and fiscal risk, unsound urban growth, and waste of land resources.
Emergence of landless farmers
Farmland expropriation and conversion to urban uses reached nearly 5,700 square kilometers in 2011. An estimated 53 million farmers have lost their land and farm-based livelihood in the process of urbanization over the past 20 years (Xu and others 2013). Low compensation for lost land and prop-erty, combined with an underdeveloped rural social security system, has made it often dif-ficult for farmers and migrants to maintain their livelihood. Those conditions—the loss of property and livelihood, lack of transpar-ency in the process of land requisition, low compensation paid to affected farmers, and the large difference between such compensa-tion and the price received by the government when the land is auctioned and sold for urban development—have resulted in widespread social unrest and a growing sense of injustice.
Incomplete urban integration
Migration is often temporary. Permanent relocation into cities is hampered by rural
268 U r b a n C h i n a
citizens’ concerns over losing farmland and residential land rights in home villages when an urban hukou is obtained. Obstacles to integration are mirrored in cities where social services are not available to migrants and local governments are reluctant or unable to provide construction land for afford-able housing. Because migrants cannot inte-grate into the city, informal settlements have emerged in the urban periphery, housing an estimated 80 million to 100 million people. Generally, such settlements are situated on residual rural construction land that has been informally and often illegally developed by rural collectives to meet demand for low-cost housing, resulting in large numbers of unreg-ulated and underserved peri-urban and urban villages. At the same time, slow rural outmi-gration and underdeveloped farmland mar-kets prevent the much-needed consolidation of agriculture, which would increase labor productivity and help narrow the urban-rural income gap.
Farmland protection and land supply for urbanization
The central government has stated a target of 120 million hectares of farmland to be protected from conversion to ensure long-term food security. The concern over the loss of farmland has led to the institution of strict land-conversion quotas, and the farm-land protection policy has sought to rein in uncontrolled land conversion, misallocation, and inefficient urban expansion. Urbaniza-tion, however, is likely to continue to demand more land into the future, and many locali-ties have devised innovative approaches to reclaim inefficiently used rural land and make it available for urban development. The chal-lenge that remains includes creating a better balance of demand for agricultural land and urban development through improved utiliza-tion, transparency, market-driven allocation, and control mechanisms for the appropriate use of land.
This report focuses on the regu latory, institutional, and policy aspects of China’s urban transformation as they pertain to land. The next section discusses how land is cur-rently being used in China’s urbanization
process. It describes recent land requisition trends, land allocation patterns and practices, and the development of land concession rev-enue, as well as how such revenue is used by local governments. It addresses issues related to land collateralization practices and risks. A subsequent section then discusses selected international approaches to the treatment of land development value and value cap-ture, city financing, rural land registration and property markets, and property taxa-tion. The section following the international approaches reviews some selected pilots for reforming local land systems in China and discusses their relevance to the national land reform efforts. These pilots include Shen-zhen’s model of integrating rural and urban construction land, Chengdu’s rural-urban integration experiments, experiences with land-trading centers in Chongqing, Beijing’s redevelopment pilots for urban villages, and Guizhou’s experiences in maintaining long-term rights to farmland going through demo-graphic change. Finally, the report closes with a land policy reform framework for the next decade, with various options for reform-ing land tenure arrangements to make them more compatible with China’s goals for social stability and efficient, sustainable economic development.
Land and urbanization in ChinaIndustrialization and urban development
The emergence of China’s land-dependent growth model in the 1990s and its prolifera-tion are an outcome of the combination of a unique regulatory regime for land, competi-tion for economic growth between locali-ties, and the fiscal centralization policy and tax reform of the mid-1990s. China’s dual-track urban-rural land ownership system and its rural land requisition regime and imple-mentation practices have played a pivotal role in promoting this pattern of economic development.
In the 1990s, land emerged as a promi-nent instrument in China’s development, in a much different way than during the pre-vious decade. In the 1980s, decollectiviza-

C h i n a ’ s U r b a n i z a t i o n a n d l a n d : a f r a m e w o r k f o r r e f o r m 269
tion and the introduction of the Household Responsibility System of 1978 marked the beginning of the economic reform period and stimulated extraordinary agricultural and rural growth, including the development of township and village enterprises on collec-tive land. In the 1990, market reforms, the restructuring of and transition to sharehold-ing systems for state enterprises, the decline of township and village enterprises, and inte-gration into the global economy, along with foreign and domestic investments and abun-dant labor supply, provided the impetus for China’s industrial growth and urbanization. Local governments assumed responsibil-ity for economic growth, industrialization, and urban development. Decentralization provided flexibility and incentives to local governments to evolve from the former rigid centralized economic management system. China’s growth performance and economic and social achievements over the past 20 years are widely recognized as the outcomes of these successful policies.
Land became a critical resource of indus-trial development and growth when the fiscal reforms of the 1990s centralized the power to collect budgetary revenue. The reforms deprived local governments of a large share of their revenue while their responsibilities for economic development and public and social service provision remained largely unchanged (Wong 2013).2 Over the past 20 years, the gap between municipal budget-ary revenue and expenditure widened con-tinuously, as the ratio of subnational revenue remained at less than 50 percent of total gov-ernment budgetary revenue and the ratio of subnational expenditure rose as high as 80 percent of total expenditure (figure 4.1).
With the market reforms and changes in the central and local fiscal relationship, land became the single most important asset under the control of local governments, which began to discriminate very effectively between industrial and urban land use and users. Governments increased the supply of industrial land to develop their local tax base: business taxes accrue exclusively to local gov-ernments, whereas value added and corporate income taxes are shared with the central gov-ernment. They simultaneously restricted the
supply of land for urban residential and com-mercial use to capture the increased value of land as demand for such land increased in the course of urban expansion. A distinct pattern of industrial and urban commercial and residential land allocation emerged that continues to shape China’s urban growth and has led to continuously decreasing densities in many cities in China.
Local governments seek to attract inves-tors by providing industrial-use land at subsi-dized prices and infrastructure at little or no cost to the investor. While governments are supplying cheap industrial land they are often incurring financial losses, because they need to pay compensation to dispossessed farmers and finance infrastructure construction. But attracting investors is important not only to meet economic growth targets but also to generate sustainable tax revenue. Enterprises generate value added taxes and corporate income taxes, of which 25 percent and 40 percent stay at the municipality or county levels, respectively. The multiplier effect of the manufacturing sector in the services and business sectors is important to local consid-erations. Because factories increase workers’ financial means, businesses and services such as markets, shops, restaurants, banks, and real estate developers establish themselves
Source: World Bank 2012.
FIgurE 4.1 revenue and expenditure of subnational governments, 1978–2008
90
80
70
60
50
40
30
20
01978 1992 1998 2003 2008
Perc
ent
10
Subnational revenue percentage
Subnational expenditure percentage

270 U r b a n C h i n a
to serve a growing consumer base. These spillover effects influence economic deci-sion making, in particular, because business taxes accrue solely to local governments (Tao 2013).
In urban commercial and residential land use, local governments pursue a different but complementary strategy. By restricting the area to be sold for urban development, local governments are able to raise the price of urban land and maximize revenues from sell-ing that land. With accelerating urbanization boosting land demand and its value, land has become a key source of revenue for local governments. The strategy of discriminat-ing between industrial and urban land also allows local governments to cross-subsidize industrial development through the urban land market and to generate the financing needed for infrastructure.
The proliferation of industrial parks throughout China and the high prices for urban residential and commercial real estate reflect the different allocative strategies for industrial and urban land. Industrial parks emerged in China’s coastal areas in the late 1990s and have expanded steadily over the past decade. Inland regions did not join the regional manufacturing competition initially because of relatively poor infrastructure endowment, but as infrastructure began to improve in the 2000s, inland regions began to compete for investments as well. By the end of 2003, China had 3,837 industrial parks and zones. By 2006, the total num-ber of such parks and zones had increased to 6,015, or an average of two industrial parks per county (Zhai and Xiang 2007). The majority of these zones are operated by local governments, with only a small number having received approval from provincial or central governments.
Continuously rising real estate prices across many cities can be attributed to this instrumental use of land, in particular the undersupply of land at times of rising demand. Depressed factor prices over the past decade, including land and labor, and weak enforcement of environmental regula-tions, resulted in excessive investments and production capacity in manufacturing that could not be absorbed domestically. At the
same time, low compensation levels for req-uisitioned land and the insufficient coverage of the social insurance system made it dif-ficult for dispossessed farmers and migrants to increase consumption levels. With little flexibility, the central government had to maintain a stable exchange rate and increase the money supply to ensure that the manu-factured goods could be exported. Boom-ing exports, increasing labor productivity, and a stable exchange rate regime attracted large amounts of speculative money, thus further increasing China’s foreign currency reserves. By 2004, these reserves had grown to US$609.9 billion and in 2006 to US$1 tril-lion. In April 2009, foreign reserves exceeded US$2 trillion, and in March 2011, reserves exceeded US$3 trillion. Excess liquidity flooded into the commercial and residen-tial land market and contributed to sharply increased real estate prices (Tao 2013).
Prior to 2004, the growth of China’s urban house prices remained below 5 percent, but house prices began to increase from early 2004, growing by nearly 10 percent annu-ally. The central government implemented a number of regulatory policies to stabilize the housing market. However, these land market control policies did not address the underly-ing problem, and house prices continued to grow at double-digit rates. Neither the more competitive land allocation policies instituted in 2006 nor interest rate increases were able to slow the growth in house prices. Only dur-ing the 2008 global financial crisis did house prices decline briefly, dropping by 1.1 percent in the first quarter of 2009. However, real estate prices have since risen steadily in many cities, fueled by demand.
rural land requisition
China’s urbanization is characterized by the continuous outward shift of urban boundar-ies and the expansion of territorial jurisdic-tions of cities, primarily through the expro-priation of surrounding rural land and its integration into urban areas. Between 2001 and 2011, urban construction land increased steadily by a total of 17,600 square kilome-ters, reaching a total area of 41,805 square kilometers in 2011, an increase of 58 percent

C h i n a ’ s U r b a n i z a t i o n a n d l a n d : a f r a m e w o r k f o r r e f o r m 271
over the decade (figure 4.2). Urban construc-tion land expanded by 1,600 square kilo-meters per year, with about 90 percent of the demand met through the expropriation of rural land; the remainder came from the existing stock of undeveloped urban con-struction land. From 2005 to 2011, 10,200 square kilometers of rural land were req-uisitioned and converted to state land for urban construction use. Annual requisition of rural land averaged 1,460 square kilome-ters, closely matching the trend of increasing urban construction land and urban built-up area during that period.
Rural land requisition overall and its conversion into state-owned land was much higher than land conversion for the more nar-row urban construction use (figure 4.3). Dur-ing 2005 to 2011, a total of 27,200 square kilometers of rural land were requisitioned and converted to state ownership. Up to 2008, approximately 3,000 square kilome-ters were requisitioned annually. Part of the difference between the two land conversion rates is explained by infrastructure construc-tion and expansion of industrial land not yet counted as urban construction land. From 2008 to 2013, however, rural land requi-sition increased sharply to around 4,460 square kilometers. Part of this sharp increase is associated with the government’s 2009–10 stimulus response to slowing growth, includ-
ing increased infrastructure investment; the expansion of industrial, urban residential, and commercial land; and relaxed land use controls.
The sharp acceleration of land requisition may indicate that the requisition and con-version of rural land is, to a certain extent, delinked from the real demand for urban and industrial land or infrastructure needs as local governments have continued to increase their reliance on land-based concession reve-nue and collateralization of land to meet their fiscal obligations. Rural land requisition rates exceeded the increase in total urban construc-tion land area by nearly 3,800 square kilome-ters. Notwithstanding infrastructure invest-ments, this difference may indicate the scale of how much land has entered land banks under the control of urban development investment corporations (UDICs; so-called land banks) since 2008 and is used in land-based finance through collateralization.
In terms of the composition of urban con-struction land, industrial land saw the largest expansion in absolute terms, with an increase of 10,800 square kilometers between 2005 and 2012, followed by residential land (6,081 square kilometers), public utilities and buildings (4,290 square kilometers), and commercial-use land (2,140 square kilome-ters). Land used for transportation infra-structure, reported only for the period from
FIgurE 4.2 urban construction land
Source: China Urban Construction Statistical Yearbook, 2002–12.
45
40
35
30
25
20
15
10
02001 2004 2007 2011
km2 (t
hous
ands
)
5
FIgurE 4.3 requisition of rural land
Source: China Urban Construction Statistical Yearbook, 2006–12; China Land and Resources Statistical Yearbook, 2006–12.
6
5
4
3
2
02005 2007 2009 2011
km2 (t
hous
ands
)
1
Total land requisition
Land requisition for urban construction
Urban construction land

272 U r b a n C h i n a
2009 to 2012, increased by 3,500 square kilometers, or about 15 percent of the total increase in state-owned construction land. Industrial land accounted for nearly half of the increase in construction land area, fol-lowed by residential (26 percent), public utili-ties and buildings (18 percent), and land for commercial use (9 percent) (figures 4.4 and 4.5). The high share of industrial land is noteworthy. Internationally, industrial land usually accounts for less than 10–15 percent of total urban land in major cities. The higher
share of industrial land in China reflects local governments’ land-based economic develop-ment model. However, when comparing China’s cities with others, one should note that other countries may not include land for industrial use located outside municipal or city boundaries in their urban land statistics.
Land price development
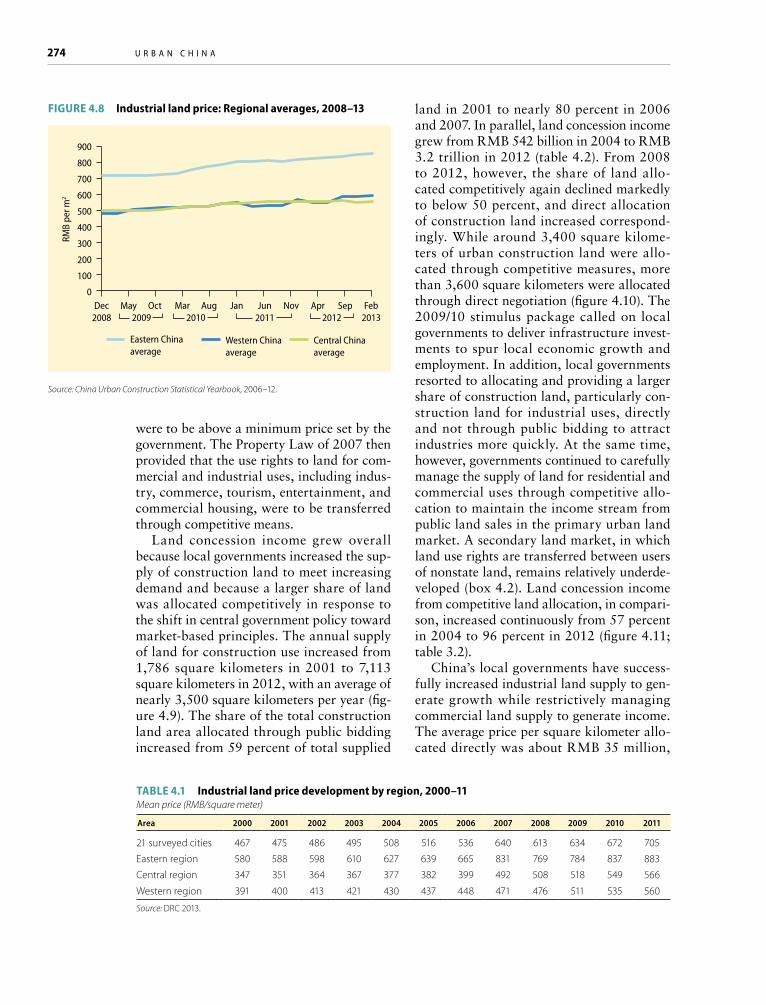
Prices for commercial- and residential-use land increased steadily over the past decade in response to rising demand, more competi-tive allocation procedures, and higher land development cost. From 2000 to 2010, the prices for commercial and residential use rose by 310 percent and 530 percent, respectively, according to a Development Research Center of the State Council, China (DRC 2013) sur-vey on urban land prices of 21 Chinese cities. In another survey across 105 selected Chinese cities, between 2006 and 2010 the average price of urban land increased from renminbi (RMB) 1,544 per square meter to RMB 2,881 per square meter, an increase of 46 percent. The average commercial land price went up by 52 percent, from RMB 2,480 to RMB 5,185 per square meter, and the residen-tial land price increased from RMB 1,681 to RMB 4,245 per square meter, or 60 percent (DRC 2013). Figure 4.6 illustrates the devel-opment of residential, commercial, and indus-trial urban land prices averaged across China. Price increases were most pronounced in the eastern region and less pronounced in the western and central regions. The 2008 global financial crisis had only a temporary impact on land prices, which was most pronounced in the eastern region (figure 4.7). In compari-son, the price for industrial-use land increased only slightly and has remained significantly below prices for commercial and residential land, even as land became scarcer and land prices were under pressure to move up, a pat-tern that can be observed across the eastern, central, and western regions (figure 4.8). The average price for industrial land increased from RMB 467 to RMB 705, or 5.5 percent annually, from 2000 to 2011 (table 4.1).
Local governments have various means to manage prices of industrial land to attract investment. Most common is the transfer
2.5
2.0
1.5
1.0
0.5
02005 2007 2009 2012
km2 (t
hous
ands
)
Industrial
TransportPublic managementand services
CommercialResidential
FIgurE 4.4 Composition of construction land use increase, 2005–12
Source: China Urban Construction Statistical Yearbook, 2006–12.
FIgurE 4.5 Shares of main urban construction land use categories, 2005–12
Source: China Urban Construction Statistical Yearbook, 2006–12.
Commercial Industrial Residential Public managementand services
100
90
70
50
30
10
0
Perc
ent
80
60
40
20
2005 2006 2007 2008 2009 2010 2011 2012

C h i n a ’ s U r b a n i z a t i o n a n d l a n d : a f r a m e w o r k f o r r e f o r m 273
of land use rights through negotiated agree-ments with an investor rather than through competitive bidding.3 Other practices include lowering the actual transfer price, giving rebates for fees already collected, or delaying payments on the transfer of land use rights. Governments have also transferred land use rights to developers prior to the completion of the requisition and resettlement process, that is, before buildings have been demol-ished and compensation has been paid to affected farmers. By implicitly transferring the responsibility of resettlement and com-pensation payments to the developer, govern-ments have allowed concession fee payments in the form of resettlement compensation and allowance payments to farmers. Price con-trol and preferential policies and practices of local governments that are in the process of industrial land allocation can hinder the shift of the manufacturing sector from the eastern to the central and western regions. These pol-icies may create disincentives for upgrading the industrial sector in the eastern region and for promoting a more intensive and economi-cal use of land.
Land allocation policies
Land concession income started to emerge prominently in the early 1990s following an amendment to China’s constitution in 1988 and the stipulation in the Land Management Law in 1989 that allowed the transfer of land use rights (DRC 2013). In the early 1990s, nearly all land use rights were transferred through direct allocation and contracts between the government and land develop-ers. Gradually, more competitive allocation procedures were introduced to establish the rights transfer process for urban land alloca-tion and use based on market principles. In 1998, Shenzhen was the first municipality to provide land use rights to state land through public tendering, with revenue generated from land auctions contributing about 3 per-cent of Shenzhen’s total land concession rev-enue in that year.
Further reforms toward market-based land use rights transfers and allocation began in 2001 when the State Council4 called for competitive tendering, auction, or bidding of
land use rights to state-owned land. In 2002, the Ministry of Land and Resources5 stipu-lated that the transfer of land use rights for commercial use, comprising commerce, tour-ism, entertainment, and real estate develop-ment, should be made through competitive tendering, auction, or bidding. In 2004, the government expanded the requirement of competitive bidding to transfers of land for industrial uses. In 2006, the State Coun-cil6 issued a policy that required use rights to industrial land to be transferred through competitive procedures, and transfer prices
FIgurE 4.6 urban land prices: National average, 2008–13
Source: China Urban Construction Statistical Yearbook, 2006–12.
Commercial Residental Industrial
6
5
3
1
0
RMB
per m
2 (tho
usan
ds)
4
2
Dec2008 2010 2012
May2009
Mar Aug Jan Jun2011
Nov Apr Sep Feb2013
FIgurE 4.7 urban land price: Eastern region, 2008–13
Source: China Urban Construction Statistical Yearbook, 2006–12.
Commercial Residental Industrial
14
12
8
2
0
RMB
per m
2 (tho
usan
ds)
4
10
6
Dec2008 2012
Jun Dec Jun Dec Jun Dec Jun Dec Jun201320102009 2011
274 U r b a n C h i n a
were to be above a minimum price set by the government. The Property Law of 2007 then provided that the use rights to land for com-mercial and industrial uses, including indus-try, commerce, tourism, entertainment, and commercial housing, were to be transferred through competitive means.
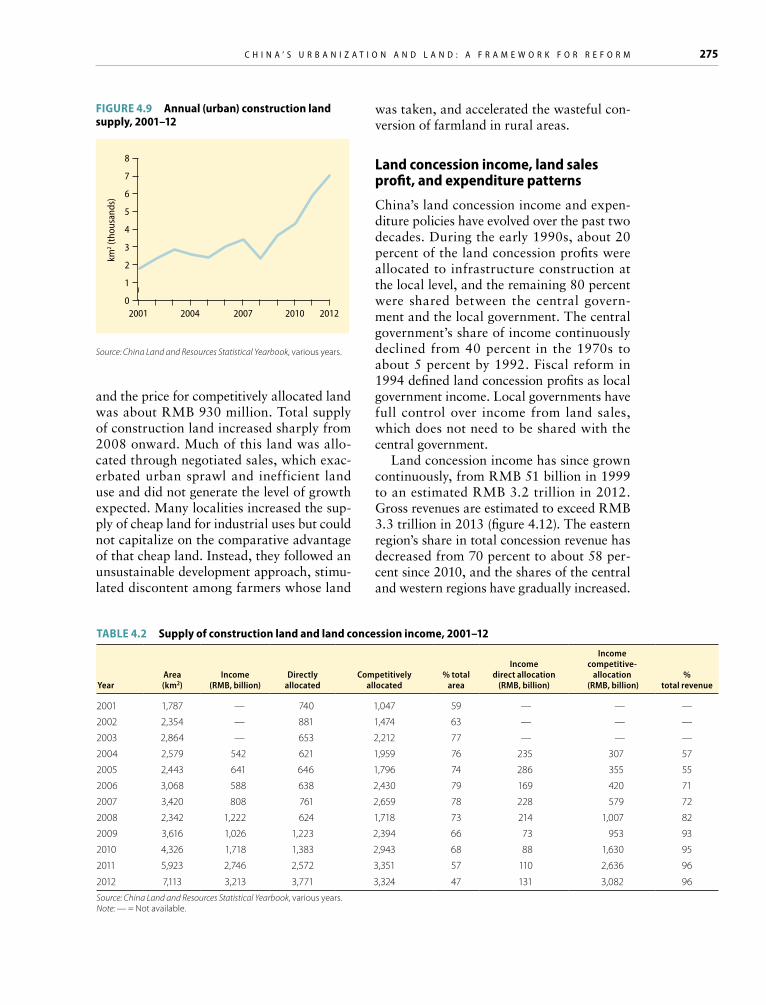
Land concession income grew overall because local governments increased the sup-ply of construction land to meet increasing demand and because a larger share of land was allocated competitively in response to the shift in central government policy toward market-based principles. The annual supply of land for construction use increased from 1,786 square kilometers in 2001 to 7,113 square kilometers in 2012, with an average of nearly 3,500 square kilometers per year (fig-ure 4.9). The share of the total construction land area allocated through public bidding increased from 59 percent of total supplied
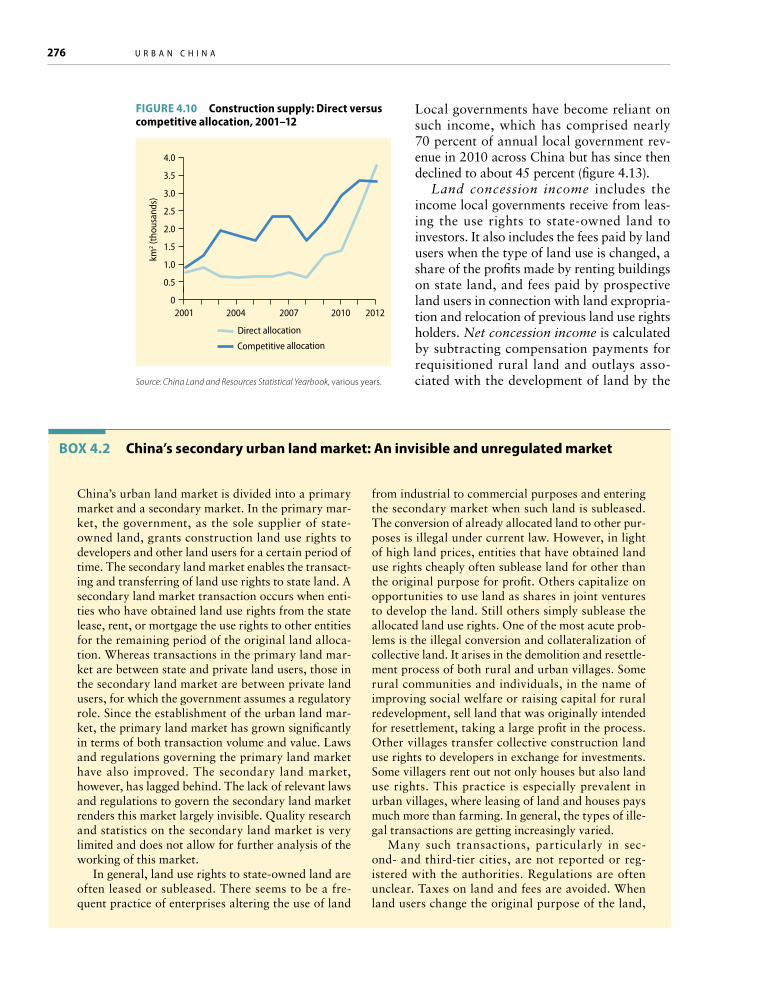
land in 2001 to nearly 80 percent in 2006 and 2007. In parallel, land concession income grew from RMB 542 billion in 2004 to RMB 3.2 trillion in 2012 (table 4.2). From 2008 to 2012, however, the share of land allo-cated competitively again declined markedly to below 50 percent, and direct allocation of construction land increased correspond-ingly. While around 3,400 square kilome-ters of urban construction land were allo-cated through competitive measures, more than 3,600 square kilometers were allocated through direct negotiation (figure 4.10). The 2009/10 stimulus package called on local governments to deliver infrastructure invest-ments to spur local economic growth and employment. In addition, local governments resorted to allocating and providing a larger share of construction land, particularly con-struction land for industrial uses, directly and not through public bidding to attract industries more quickly. At the same time, however, governments continued to carefully manage the supply of land for residential and commercial uses through competitive allo-cation to maintain the income stream from public land sales in the primary urban land market. A secondary land market, in which land use rights are transferred between users of nonstate land, remains relatively underde-veloped (box 4.2). Land concession income from competitive land allocation, in compari-son, increased continuously from 57 percent in 2004 to 96 percent in 2012 (figure 4.11; table 3.2).
China’s local governments have success-fully increased industrial land supply to gen-erate growth while restrictively managing commercial land supply to generate income. The average price per square kilometer allo-cated directly was about RMB 35 million,
FIgurE 4.8 Industrial land price: regional averages, 2008–13
Source: China Urban Construction Statistical Yearbook, 2006–12.
Eastern Chinaaverage
Western Chinaaverage
Central Chinaaverage
900
800
500
100
0
RMB
per m
2
700
300
600
200
400
Dec2008 2010 2012
May Oct Mar Aug Jan Jun2011
Nov Apr Sep Feb20132009
TaBLE 4.1 Industrial land price development by region, 2000–11Mean price (RMB/square meter)
Area 2000 2001 2002 2003 2004 2005 2006 2007 2008 2009 2010 2011
21 surveyed cities 467 475 486 495 508 516 536 640 613 634 672 705
Eastern region 580 588 598 610 627 639 665 831 769 784 837 883
Central region 347 351 364 367 377 382 399 492 508 518 549 566
Western region 391 400 413 421 430 437 448 471 476 511 535 560
Source: DRC 2013.
C h i n a ’ s U r b a n i z a t i o n a n d l a n d : a f r a m e w o r k f o r r e f o r m 275
and the price for competitively allocated land was about RMB 930 million. Total supply of construction land increased sharply from 2008 onward. Much of this land was allo-cated through negotiated sales, which exac-erbated urban sprawl and inefficient land use and did not generate the level of growth expected. Many localities increased the sup-ply of cheap land for industrial uses but could not capitalize on the comparative advantage of that cheap land. Instead, they followed an unsustainable development approach, stimu-lated discontent among farmers whose land
was taken, and accelerated the wasteful con-version of farmland in rural areas.
Land concession income, land sales profit, and expenditure patterns
China’s land concession income and expen-diture policies have evolved over the past two decades. During the early 1990s, about 20 percent of the land concession profits were allocated to infrastructure construction at the local level, and the remaining 80 percent were shared between the central govern-ment and the local government. The central government’s share of income continuously declined from 40 percent in the 1970s to about 5 percent by 1992. Fiscal reform in 1994 defined land concession profits as local government income. Local governments have full control over income from land sales, which does not need to be shared with the central government.
Land concession income has since grown continuously, from RMB 51 billion in 1999 to an estimated RMB 3.2 trillion in 2012. Gross revenues are estimated to exceed RMB 3.3 trillion in 2013 (figure 4.12). The eastern region’s share in total concession revenue has decreased from 70 percent to about 58 per-cent since 2010, and the shares of the central and western regions have gradually increased.
TaBLE 4.2 Supply of construction land and land concession income, 2001–12
YearArea (km2)
Income (RMB, billion)
Directly allocated
Competitivelyallocated
% total area
Incomedirect allocation
(RMB, billion)
Income competitive-
allocation (RMB, billion)
% total revenue
2001 1,787 — 740 1,047 59 — — —
2002 2,354 — 881 1,474 63 — — —
2003 2,864 — 653 2,212 77 — — —
2004 2,579 542 621 1,959 76 235 307 57
2005 2,443 641 646 1,796 74 286 355 55
2006 3,068 588 638 2,430 79 169 420 71
2007 3,420 808 761 2,659 78 228 579 72
2008 2,342 1,222 624 1,718 73 214 1,007 82
2009 3,616 1,026 1,223 2,394 66 73 953 93
2010 4,326 1,718 1,383 2,943 68 88 1,630 95
2011 5,923 2,746 2,572 3,351 57 110 2,636 96
2012 7,113 3,213 3,771 3,324 47 131 3,082 96
Source: China Land and Resources Statistical Yearbook, various years.Note: — = Not available.
FIgurE 4.9 annual (urban) construction land supply, 2001–12
Source: China Land and Resources Statistical Yearbook, various years.
8
6
4
3
2
02001 2004 2007 2012
km2 (t
hous
ands
)
1
7
5
2010
276 U r b a n C h i n a
China’s urban land market is divided into a primary market and a secondary market. In the primary mar-ket, the government, as the sole supplier of state-owned land, grants construction land use rights to developers and other land users for a certain period of time. The secondary land market enables the transact-ing and transferring of land use rights to state land. A secondary land market transaction occurs when enti-ties who have obtained land use rights from the state lease, rent, or mortgage the use rights to other entities for the remaining period of the original land alloca-tion. Whereas transactions in the primary land mar-ket are between state and private land users, those in the secondary land market are between private land users, for which the government assumes a regulatory role. Since the establishment of the urban land mar-ket, the primary land market has grown significantly in terms of both transaction volume and value. Laws and regulations governing the primary land market have also improved. The secondary land market, however, has lagged behind. The lack of relevant laws and regulations to govern the secondary land market renders this market largely invisible. Quality research and statistics on the secondary land market is very limited and does not allow for further analysis of the working of this market.
In general, land use rights to state-owned land are often leased or subleased. There seems to be a fre-quent practice of enterprises altering the use of land
Box 4.2 China’s secondary urban land market: an invisible and unregulated market
from industrial to commercial purposes and entering the secondary market when such land is subleased. The conversion of already allocated land to other pur-poses is illegal under current law. However, in light of high land prices, entities that have obtained land use rights cheaply often sublease land for other than the original purpose for profit. Others capitalize on opportunities to use land as shares in joint ventures to develop the land. Still others simply sublease the allocated land use rights. One of the most acute prob-lems is the illegal conversion and collateralization of collective land. It arises in the demolition and resettle-ment process of both rural and urban villages. Some rural communities and individuals, in the name of improving social welfare or raising capital for rural redevelopment, sell land that was originally intended for resettlement, taking a large profit in the process. Other villages transfer collective construction land use rights to developers in exchange for investments. Some villagers rent out not only houses but also land use rights. This practice is especially prevalent in urban villages, where leasing of land and houses pays much more than farming. In general, the types of ille-gal transactions are getting increasingly varied.
Many such transactions, particularly in sec-ond- and third-tier cities, are not reported or reg-istered with the authorities. Regulations are often unclear. Taxes on land and fees are avoided. When land users change the original purpose of the land,
FIgurE 4.10 Construction supply: Direct versus competitive allocation, 2001–12
Source: China Land and Resources Statistical Yearbook, various years.
4.0
3.0
2.0
1.5
1.0
02001 2004
Direct allocation
2007 2012
km2 (t
hous
ands
)
0.5
3.5
2.5
2010
Competitive allocation
Local governments have become reliant on such income, which has comprised nearly 70 percent of annual local government rev-enue in 2010 across China but has since then declined to about 45 percent (figure 4.13).
Land concession income includes the income local governments receive from leas-ing the use rights to state-owned land to investors. It also includes the fees paid by land users when the type of land use is changed, a share of the profits made by renting buildings on state land, and fees paid by prospective land users in connection with land expropria-tion and relocation of previous land use rights holders. Net concession income is calculated by subtracting compensation payments for requisitioned rural land and outlays asso-ciated with the development of land by the

C h i n a ’ s U r b a n i z a t i o n a n d l a n d : a f r a m e w o r k f o r r e f o r m 277
government prior to public auctions or direct contracting. Compensation costs include the costs for rural land and property requisition, resettlement, social security and subsidies to affected farmers, and allowances to affected workers of state or collective enterprises that are restructured or dissolved as part of the land requisition process. Development costs refer to government expenditures to develop and provide basic infrastructure prior to the
land transfer. The net proceeds from land sales are available for local governments to finance infrastructure development and cur-rent expenditure.
From 2008 to 2012, social security sub-sidies to farmers remained at about 3 per-cent of total land concession cost, and costs for requisition of property and resettlement decreased from 66 percent in 2008 to 60 percent in 2011. Land development costs
for example from industrial to commercial use, taxes and fees need to be paid to land resources authorities, even if no other party is involved in the transaction and the land user remains the same. The secondary land market has no registries or physical venues for transactions.
Often transactions involve not only land but also property, which creates additional disincentives for land users to register the transaction because differ-ent agencies are involved. Regulatory oversight of property falls under the responsibility of the Min-
Box 4.2 (continued)
istry of Housing and Construction, whereas land is under the Ministry of Land and Resources. Separate jurisdictions over transactions create confusion and are inconvenient for land users. Furthermore, the sec-ondary land market involves both state-owned land and collective land, making such transactions diffi-cult to regulate. Courts play a role as well. In legal disputes where land is involved, courts often order the indebted party to repay debt by auctioning off allocated land without the prior approval of the land resources authorities.
Source: Zhang and others 2012.
FIgurE 4.11 Local government income from land sales, 2003–12
Source: China Land and Resources Statistical Yearbook, various years.
3,500
2,500
1,500
1,000
500
02003 2006
Direct allocation
2009 2012
RMB
(bill
ions
)
3,000
2,000
Competitive allocation
FIgurE 4.12 revenue from land sales and associated cost, 1999–2013
Source: China Land and Resources Statistical Yearbook, 2006–12.a. estimate.
4,000
2,500
1,500
1,000
500
01999 2005
Land granting revenue
2011 2013a
RMB
(bill
ions
)
3,500
3,000
2,000
Land granting cost

278 U r b a n C h i n a
increased to about a quarter of the total land concession cost, and land administration–related costs, which include costs associated with land reconnaissance and assessments, land auctions, public notification, and so forth, remained at 1 percent (table 4.3).
Profits from land concessions averaged about 44 percent of total concession income during the period 2008 to 2010 and increased in absolute terms from RMB 436 billion to RMB 1.22 trillion. However, during 2011 to 2012, land concession profits have decreased in absolute terms, from RMB 943 billion to
RMB 627 billion, and as a share of gross income. However, despite the associated costs, land concessions remain highly prof-itable for local governments—about 44 per-cent of all land concession revenue during 2008 to 2010 was profit—although the profit share declined to 22 percent in 2012.
Local governments exercise wide discre-tion in the use of net income from land sales, and rules and regulations concerning prof-its from land sales remain vague. The Land Management Law stipulates that conces-sion income from transfers of use rights to new construction land should be allocated to arable land development. Other policies require that some share of profits be allo-cated to construction of subsidized housing. Local governments have been able to use a large share of the land concession profit for urban construction because of the absence of clear definitions of land concession costs and of specific rules on how big a share urban infrastructure construction can take from the total land concession income, and how such expenditure shall be used.
Rural areas remain particularly disadvan-taged in benefiting from concession profits. Between 60 percent and 70 percent of land-related profits are spent on urban infrastruc-ture, subsidized housing, and transfers to the state’s land profit fund (aimed at financing the acquisition of land reserves). The share of profits directed to agriculture and rural
80
50
30
20
10
01999 2004 2009 2013a
Perc
ent
70
60
40
FIgurE 4.13 revenue from land sales as a share of total local government revenue, 1999–2013
Source: China Statistical Yearbook, various years. a. estimate.
TaBLE 4.3 Cost structure of land concession, 2008–12
2008(RMB,
billion)
% oftotal land
concession income
2009(RMB,
billion)
% oftotal land
concession income
2010(RMB,
billion)
% oftotal land
concession income
2011(RMB,
billion)
% oftotal land
concession income
2012(RMB,
billion)
% oftotal land
concession income
Land concession income 994 1,424 2,940 3,348 2,889
Net income 436 44 658 46 1,222 42 943 28 627 22
Total cost 558 56 766 54 1,718 58 2,405 72 2,262 78
Total cost by item
% oftotal cost
% oftotal cost
% oftotal cost
% oftotal cost
% oftotal cost
Resettlement 366 66 499 65 1067 62 1,435 60
1,740 77Subsidies to farmers 16 3 20 3 45 4 69 3
Subsidies to workers 78 14 107 14 334 19 329 14
Land administration 7 1 9 1 16 1 22 1Land development 90 17 132 17 256 15 551 23 522 23
Source: DRC 2013.
C h i n a ’ s U r b a n i z a t i o n a n d l a n d : a f r a m e w o r k f o r r e f o r m 279
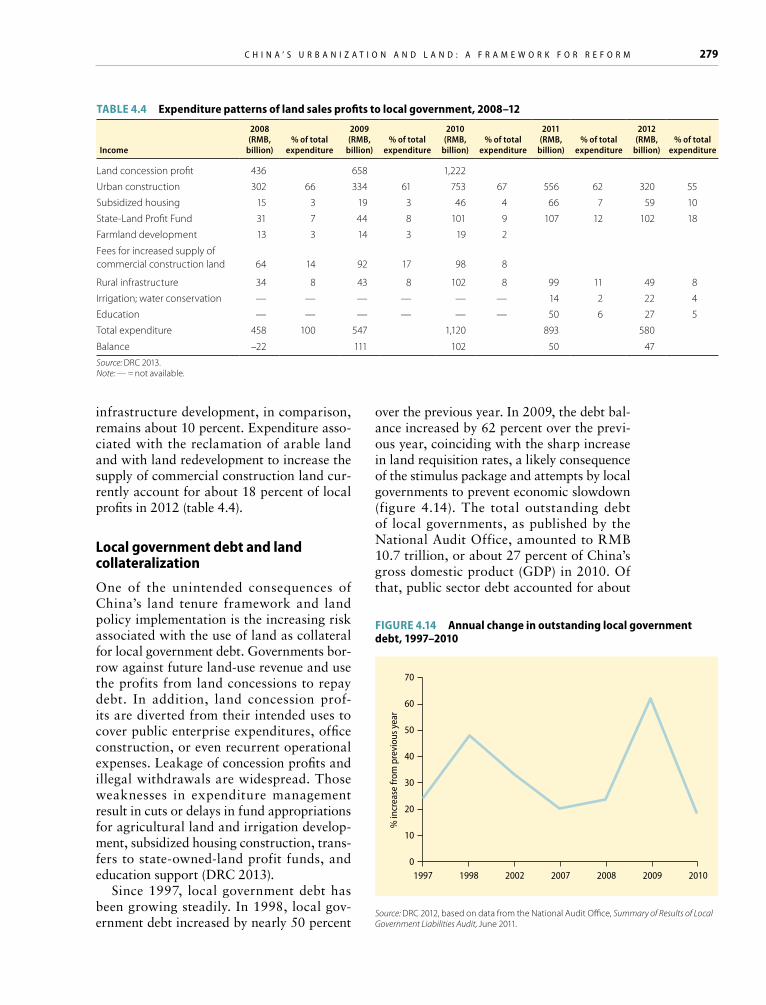
infrastructure development, in comparison, remains about 10 percent. Expenditure asso-ciated with the reclamation of arable land and with land redevelopment to increase the supply of commercial construction land cur-rently account for about 18 percent of local profits in 2012 (table 4.4).
Local government debt and land collateralization
One of the unintended consequences of China’s land tenure framework and land policy implementation is the increasing risk associated with the use of land as collateral for local government debt. Governments bor-row against future land-use revenue and use the profits from land concessions to repay debt. In addition, land concession prof-its are diverted from their intended uses to cover public enterprise expenditures, office construction, or even recurrent operational expenses. Leakage of concession profits and illegal withdrawals are widespread. Those weaknesses in expenditure management result in cuts or delays in fund appropriations for agricultural land and irrigation develop-ment, subsidized housing construction, trans-fers to state-owned-land profit funds, and education support (DRC 2013).
Since 1997, local government debt has been growing steadily. In 1998, local gov-ernment debt increased by nearly 50 percent
over the previous year. In 2009, the debt bal-ance increased by 62 percent over the previ-ous year, coinciding with the sharp increase in land requisition rates, a likely consequence of the stimulus package and attempts by local governments to prevent economic slowdown (figure 4.14). The total outstanding debt of local governments, as published by the National Audit Office, amounted to RMB 10.7 trillion, or about 27 percent of China’s gross domestic product (GDP) in 2010. Of that, public sector debt accounted for about
TaBLE 4.4 Expenditure patterns of land sales profits to local government, 2008–12
Income
2008(RMB,
billion)% of total
expenditure
2009(RMB,
billion)% of total
expenditure
2010(RMB,
billion)% of total
expenditure
2011(RMB,
billion)% of total
expenditure
2012(RMB,
billion)% of total
expenditure
Land concession profit 436 658 1,222
Urban construction 302 66 334 61 753 67 556 62 320 55
Subsidized housing 15 3 19 3 46 4 66 7 59 10
State-Land Profit Fund 31 7 44 8 101 9 107 12 102 18
Farmland development 13 3 14 3 19 2
Fees for increased supply of commercial construction land 64 14 92 17 98 8
Rural infrastructure 34 8 43 8 102 8 99 11 49 8
Irrigation; water conservation — — — — — — 14 2 22 4
Education — — — — — — 50 6 27 5
Total expenditure 458 100 547 1,120 893 580
Balance –22 111 102 50 47
Source: DRC 2013.Note: — = not available.
FIgurE 4.14 annual change in outstanding local government debt, 1997–2010
Source: DRC 2012, based on data from the National Audit Office, Summary of Results of Local Government Liabilities Audit, June 2011.
70
50
40
30
20
10
0
% in
crea
se fr
om p
revi
ous y
ear
60
1997 1998 2002 2007 2008 2009 2010
280 U r b a n C h i n a
20 percent of GDP, and bonds issued by pol-icy-based financial institutions accounted for 6 percent of GDP. Also in 2010, 78 city gov-ernments and 99 county governments held debt obligations totaling more than 100 per-cent of local GDP (DRC 2013).
Land collateralization has become an important source of debt management for local governments, which rely heavily on pro-ceeds of land sales for debt servicing. Accord-ing to the National Audit Office, at the end of 2010, provincial and city governments, and the overwhelming majority of county govern-ments, had leveraged land and committed to using land concession profits to repay up to RMB 2.55 trillion, or nearly 38 percent of all local government debt obligations (DRC 2013). If land sale proceeds fall in the future (a first indication was given in 2010, although such proceeds have increased again in 2012 and 2013) and no other revenue sources can be mobilized in time, local governments may experience larger shortfalls in land profits, creating risks to their fiscal position.
Land concession revenues have grown rap-idly for more than a decade. In the future, more fluctuation in land-based revenue, and even downward trends, can be anticipated as the overall economic environment adjusts
and reforms advance. With improvements in China’s commercial land supply system, and with more transparent allocation prac-tices and a greater role for the market, the costs of obtaining land use rights, especially obtaining use rights to the existing stock of construction-use land, are likely to increase to match the real market price. In addition, the ratio between the newly increased land supply for construction use and the exist-ing stock of construction-use land is likely to decrease. As a consequence, the price for obtaining land use rights will increase, leav-ing a smaller land-based profit margin for city governments.
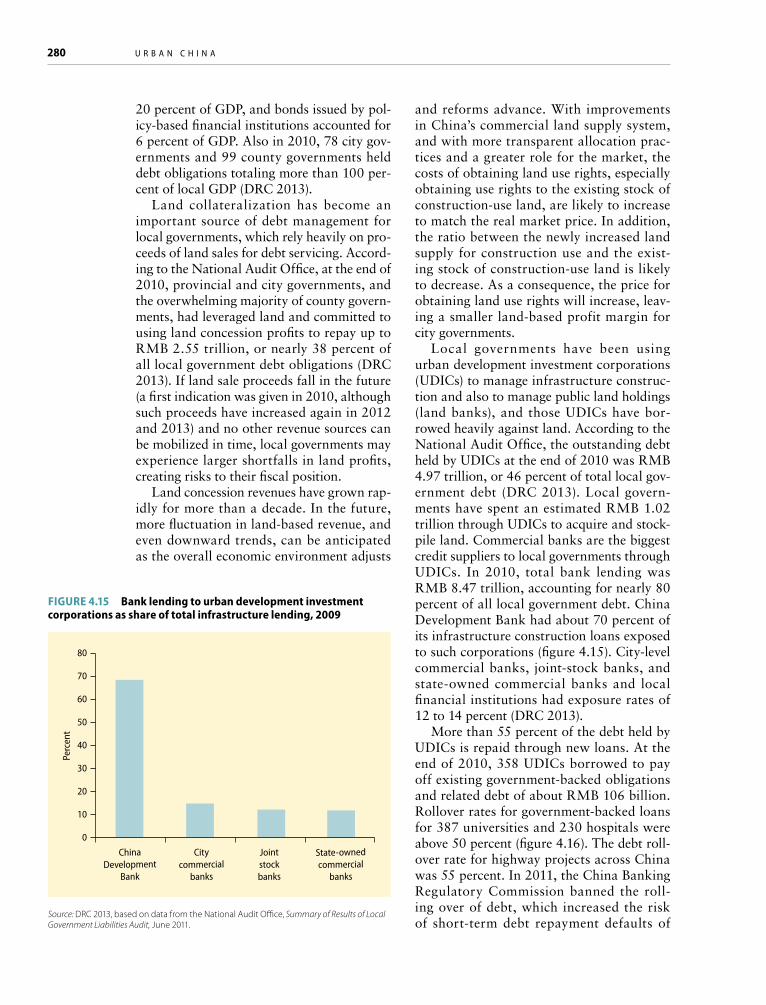
Local governments have been using urban development investment corporations (UDICs) to manage infrastructure construc-tion and also to manage public land holdings (land banks), and those UDICs have bor-rowed heavily against land. According to the National Audit Office, the outstanding debt held by UDICs at the end of 2010 was RMB 4.97 trillion, or 46 percent of total local gov-ernment debt (DRC 2013). Local govern-ments have spent an estimated RMB 1.02 trillion through UDICs to acquire and stock-pile land. Commercial banks are the biggest credit suppliers to local governments through UDICs. In 2010, total bank lending was RMB 8.47 trillion, accounting for nearly 80 percent of all local government debt. China Development Bank had about 70 percent of its infrastructure construction loans exposed to such corporations (figure 4.15). City-level commercial banks, joint-stock banks, and state-owned commercial banks and local financial institutions had exposure rates of 12 to 14 percent (DRC 2013).
More than 55 percent of the debt held by UDICs is repaid through new loans. At the end of 2010, 358 UDICs borrowed to pay off existing government-backed obligations and related debt of about RMB 106 billion. Rollover rates for government-backed loans for 387 universities and 230 hospitals were above 50 percent (figure 4.16). The debt roll-over rate for highway projects across China was 55 percent. In 2011, the China Banking Regulatory Commission banned the roll-ing over of debt, which increased the risk of short-term debt repayment defaults of
80
50
40
ChinaDevelopment
Bank
Citycommercial
banks
Jointstockbanks
State-ownedcommercial
banks
30
20
10
0
Perc
ent
60
70
FIgurE 4.15 Bank lending to urban development investment corporations as share of total infrastructure lending, 2009
Source: DRC 2013, based on data from the National Audit Office, Summary of Results of Local Government Liabilities Audit, June 2011.

C h i n a ’ s U r b a n i z a t i o n a n d l a n d : a f r a m e w o r k f o r r e f o r m 281
UDICs. Overdue debt obligations as a share of total debt of UDICs has been rising. At the end of 2010, 148 UDICs (2.3 percent of all UDICs) held RMB 8 billion in overdue debts, with an average share of overdue debt of 16.3 percent. Given the likelihood of a drop in land concession revenue and profits over the next few years, loan repayment through debt rollover is inherently unsustainable, and debt overdue rates of UDICs are likely to rise (DRC 2013).
Statistics on land sales in 2011 suggest that growth in the proceeds of land sales slowed, with a decline of 9 percent from the previous year. The decline was most obvious in eastern China. Growth in land sales proceeds slowed by 22 percent in Shanghai, 17 percent in Ningbo, 13 percent in Xiamen, and 6 percent in Zhejiang (excluding Ningbo) (DRC 2013). The slowing growth proceeds increases the risk of default on local government debt backed by land sales proceeds. During the most recent round of local government bor-rowing, 54 percent of the loans had a matu-rity of over five years. About 45 percent of local government debt in 2010 will have to be serviced between 2012 and 2015. If land sales proceeds continue to fall over the com-ing years, local governments will have a big-ger shortfall and their solvency will be tested.
About one-quarter of current local gov-ernment debt was to be repaid in 2011, and
an additional 17 percent was to be repaid in 2012. From 2013 through 2015, 11 percent, 9 percent, and 7 percent would have to be paid off. Debts maturing beyond 2016 account for 30 percent of local government debt. Because UDIC loans are mostly invested in public welfare or quasi–public welfare projects, the investment recovery period is generally long and cash flow generation is weak. By 2010, of the total UDIC loans, 1,734 (26 percent) resulted in losses (DRC 2013).
Illegal occupation of land and social tensions
Illegal land occupation and use have been widespread across China over the past decade. Illegal land use refers to the illegal purchase, sale, and transfer of land; dam-age to cultivated land; unapproved land occupancy; unlawful approval of land occu-pancy; and the granting of land at too low a price. Although the trend of illegal land use has declined since 2007 in terms of the total number of cases reported and in terms of land area, the total illegally occupied land area appears to have increased again since 2009 (figure 4.17). Approximately 10 percent of land requisitioned in 2011 was occupied or
60
50
40
Rolloverrate
Overduerate
Shareof loss
Shareof debts maturing
in 5 or more years
30
20
10
0
Perc
ent
FIgurE 4.16 Bank exposure to loans to urban development investment corporations, 2010
Source: DRC 2012.
FIgurE 4.17 Illegal land use: Number of reported cases and area affected, 2001–11
Source: China Land and Resources Statistical Yearbook, various years.
140
120
100
80
60
40
20
0
900
800
700
600
500
400
300
100
0
2001 2004 2007 2011
Case
s (th
ouan
ds)
per s
q km
200
Number of cases Land area (right axis)
Cultivated land (right axis)
282 U r b a n C h i n a
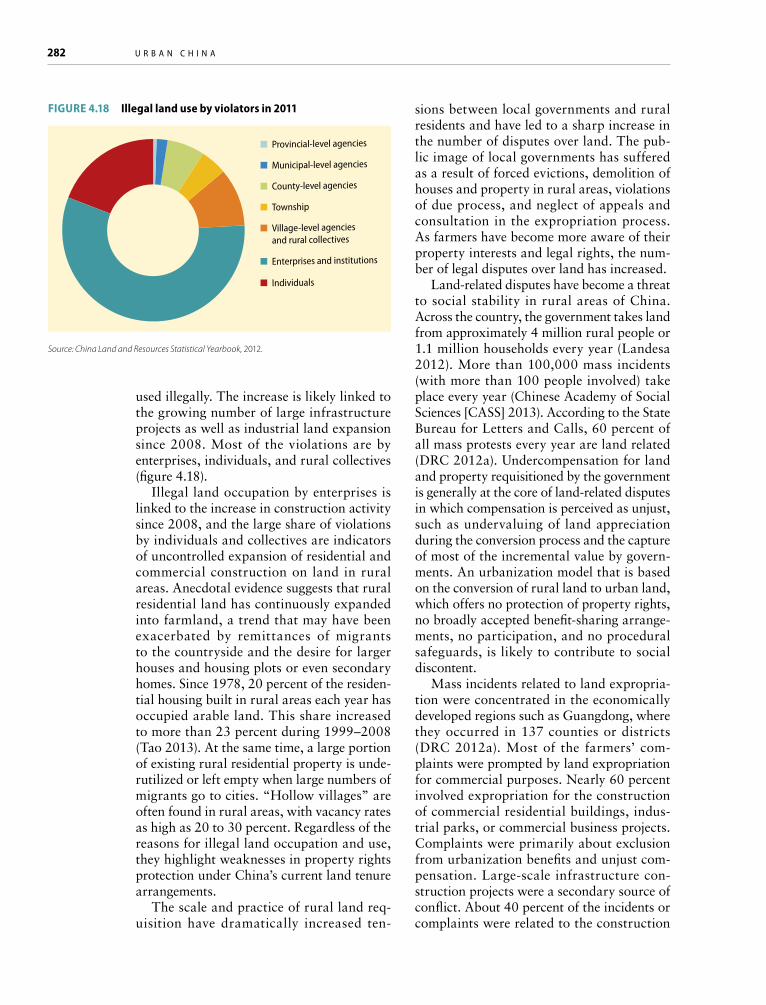
used illegally. The increase is likely linked to the growing number of large infrastructure projects as well as industrial land expansion since 2008. Most of the violations are by enterprises, individuals, and rural collectives (figure 4.18).
Illegal land occupation by enterprises is linked to the increase in construction activity since 2008, and the large share of violations by individuals and collectives are indicators of uncontrolled expansion of residential and commercial construction on land in rural areas. Anecdotal evidence suggests that rural residential land has continuously expanded into farmland, a trend that may have been exacerbated by remittances of migrants to the countryside and the desire for larger houses and housing plots or even secondary homes. Since 1978, 20 percent of the residen-tial housing built in rural areas each year has occupied arable land. This share increased to more than 23 percent during 1999–2008 (Tao 2013). At the same time, a large portion of existing rural residential property is unde-rutilized or left empty when large numbers of migrants go to cities. “Hollow villages” are often found in rural areas, with vacancy rates as high as 20 to 30 percent. Regardless of the reasons for illegal land occupation and use, they highlight weaknesses in property rights protection under China’s current land tenure arrangements.
The scale and practice of rural land req-uisition have dramatically increased ten-
sions between local governments and rural residents and have led to a sharp increase in the number of disputes over land. The pub-lic image of local governments has suffered as a result of forced evictions, demolition of houses and property in rural areas, violations of due process, and neglect of appeals and consultation in the expropriation process. As farmers have become more aware of their property interests and legal rights, the num-ber of legal disputes over land has increased.
Land-related disputes have become a threat to social stability in rural areas of China. Across the country, the government takes land from approximately 4 million rural people or 1.1 million households every year (Landesa 2012). More than 100,000 mass incidents (with more than 100 people involved) take place every year (Chinese Academy of Social Sciences [CASS] 2013). According to the State Bureau for Letters and Calls, 60 percent of all mass protests every year are land related (DRC 2012a). Undercompensation for land and property requisitioned by the government is generally at the core of land-related disputes in which compensation is perceived as unjust, such as undervaluing of land appreciation during the conversion process and the capture of most of the incremental value by govern-ments. An urbanization model that is based on the conversion of rural land to urban land, which offers no protection of property rights, no broadly accepted benefit-sharing arrange-ments, no participation, and no procedural safeguards, is likely to contribute to social discontent.
Mass incidents related to land expropria-tion were concentrated in the economically developed regions such as Guangdong, where they occurred in 137 counties or districts (DRC 2012a). Most of the farmers’ com-plaints were prompted by land expropriation for commercial purposes. Nearly 60 percent involved expropriation for the construction of commercial residential buildings, indus-trial parks, or commercial business projects. Complaints were primarily about exclusion from urbanization benefits and unjust com-pensation. Large-scale infrastructure con-struction projects were a secondary source of conflict. About 40 percent of the incidents or complaints were related to the construction
Provincial-level agencies
Municipal-level agencies
County-level agencies
Township
Village-level agenciesand rural collectives
Enterprises and institutions
Individuals
FIgurE 4.18 Illegal land use by violators in 2011
Source: China Land and Resources Statistical Yearbook, 2012.
C h i n a ’ s U r b a n i z a t i o n a n d l a n d : a f r a m e w o r k f o r r e f o r m 283
of roads, railways, airports, green spaces, and other types. Despite such projects being considered public welfare, farmers appealed or organized protests because of low com-pensation payments and nontransparent distribution of land sales proceeds. Most of farmers’ calls and protests were in response to official misconduct in the expropriation process. More than half of the cases involved insufficient compensation, below the legal requirements, and 42 percent involved the unauthorized expropriation of land. Con-flicts also resulted from perceived unfairness in the distribution of the compensation, lack of transparency in whose land was targeted for expropriation, proposed use of expropri-ated land, and government mishandling of the expropriation process.
Informal urbanization, urban villages, and migrants
Urban villages are a social and spatial phe-nomenon closely associated with China’s rural-to-urban transformation and an out-come of successful industrialization. Urban villages have emerged as cities expanded and surrounding rural areas were incorporated into urban boundaries. As vast areas of farm-land were converted to nonfarm uses under state ownership, rural settlements were left intact because compensation payments for rural residential and other rural property were generally higher than those for farm-land. Also, agreements between the local government and rural residents often could not be reached because farmers perceived their residential land as privately owned and hence more secure. Consequently, many rural settlements were not included in the requisi-tion and conversion process, and rural resi-dents remained while surrounding farmland was developed for industrial or urban uses. Legally, rural residential land and collec-tives remained classified as rural, but in real-ity they became part of the urban economy (Yuan 2013b).
With the loss of farmland, rural collectives and peri-urban farmers developed an alterna-tive livelihood strategy aided by the influx of migrants searching for low-cost housing. Because of limitations imposed by the hukou
system, migrants do not have access to formal public housing, nor are they eligible to par-ticipate in the cities’ affordable housing pro-grams that target urban residents. Although migrants have the option of purchasing urban commercial housing, they usually can-not afford the high prices. Many migrants also regard their presence in the cities as tem-porary and, accordingly, tend to minimize their expenditures. In response to the loss of farmland and the influx of migrants, farmers developed housing space on their remaining land, including collectively owned construc-tion and homestead land, or they leased the land directly to migrants or enterprises.
A large gray housing market, operated by rural collectives, has emerged in China’s urban fringe areas, where informal land and housing development has thrived. These areas have become residential enclaves for many of China’s migrants. About half of China’s 200 million migrants are estimated to live in 50,000 urban and suburban villages across the country (DRC 2012b). The gov-ernments’ monopolization of urban land sup-ply, along with sharply increased residential real estate prices in the formal urban market, means that farmers and collectives continue to have strong incentives to engage in com-mercial real estate development for profit on collectively owned land.
The informal residential land market in urban fringe areas has led to the fast growth of what is called small-property-rights hous-ing. This term refers to commodity housing units developed either by collectives on rural construction land or by individual farmers on their homesteads that have been leased to migrants. These housing units cannot be transferred legally, and landholders do not have government-issued ownership cer-tificates. Small-property-rights housing has expanded dramatically, despite the lack of legal protection and a number of prohibitive government policies and regulations. By the end of 2007, the total area of small-property-rights housing was estimated to cover 6.4 billion square meters and to account for 17 percent of China’s total urban housing stock (Tao 2013).
Urban villages play an important role in the urbanization process by providing affordable

284 U r b a n C h i n a
housing for migrants when city governments fail or are unable to provide such housing. At the same time, urban villages offer collectives new and important income sources, often off-setting the negative impacts of the requisition of farmland. Urban villages aid the two most vulnerable groups in the urbanization pro-cess: the floating migrant population and the dispossessed farmers. Depending on the suc-cess of future reforms, urban villages may be a transitional phenomenon.
Currently, however, challenges to China’s urbanization have arisen from urban villages, and many of these challenges are related to land and property issues. The redevelopment of urban village areas and their formal inte-gration into the city space pose challenges to urban developers. Municipal governments and real estate developers have realized the economic potential of redeveloping urban fringe areas. As housing prices continue to increase, there are strong incentives to demol-ish urban villages and develop these areas for profitable urban housing projects. However, because urban villages provide dispossessed farmers with considerable income through compensation payment, redevelopment and renovation projects that target these urban villages are often strongly opposed. When the compensation payments fail to material-ize or do not reflect the opportunity costs of the rental income, social unrest often follows.
Urban villages are generally rural settle-ments under the jurisdiction of collective authorities and outside the purview of city governments, which therefore cannot gen-erate revenue from informal housing con-struction and leases. Urban villages are also centers of informal economic activities that circumvent taxation and market regulations. Because urban villages are not incorporated into urban master plans, city administrations have little incentive to extend infrastructure and public services to urban village areas. Housing conditions and building quality are often substandard. Traffic conditions are generally bad as a result of congestion and uncontrolled development. Environmental conditions are usually poor because of the lack of a water supply or proper sewerage and waste disposal systems. Although rural
collectives provide some level of public ser-vices, these remain disconnected from the urban services, and many collectives do not have the capacity to serve the community properly. Urban villages are also outside the purview of formal government agencies and face social problems. For example, in Bei-jing a large number of security threats and criminal cases are reported from urban fringe areas. Social conflicts are frequent, because the migrant population often vastly exceeds the indigenous population.
International approaches and experiencesLessons from international experience
Land is a limited resource, and China’s chal-lenge is symptomatic of the global experi-ence: demographic change; rapid growth of urban populations; expansion of cities and take-up of agricultural land in urban peripheries; increasing awareness of market, environmental, and other values of land; the need for food production to keep pace with growing demand; and inadequate legal and administrative frameworks and capacities to keep pace with change and the expectations of various stakeholders.
As discussed earlier, the complex inter-linking of rural land expropriation and con-version and local public finance is a feature of China’s urbanization approach that has developed incrementally as China selectively adopted market economy principles during its transformation. This approach to urban-ization reflects China’s historical antecedents in these policy areas and how they could be most easily harnessed to enable and sustain rapid economic growth. In international com-parison, they do not represent a sustainable long-term solution. With Central Document No. 1 of 20137 giving direction to implement rural land registration nationwide, a new dimension to the issues of urbanization has been added.
A first broad conclusion from interna-tional experience is that China’s interlink-ing of local public finance, land development value and value capture, and expropriation

C h i n a ’ s U r b a n i z a t i o n a n d l a n d : a f r a m e w o r k f o r r e f o r m 285
and compensation is not a typical feature of developed market economies. The more typical approach to these policy areas is to separate the features to enable clear decisions and more predictable, sustainable outcomes. For instance, although municipalities in developed market economies may include in their balance sheet revenue generation from the disposal or sale of land and buildings, those transactions are not usually a major source of revenue, or a particularly predict-able and sustainable one. Essentially, that approach is the antithesis of what is required to finance local governments in the long term. A sustainable strategy for municipal finance involves the core elements of stability, predictability, a degree of inflation-proofing, and local accountability. In many countries, a local property tax is a significant element of such a strategy.
A second broad conclusion is that address-ing these issues as distinct policy areas and building on and adapting solutions tried and tested elsewhere are likely to lead progres-sively to positive results. The global com-munity recently agreed on and endorsed Voluntary Guidelines on the Responsible Governance of Tenure of Land, Fisheries and Forests in the Context of National Food Security,8 which provides valuable high-level guidance on responsible governance of tenure that can complement the more detailed learn-ing from other specific country experience.
A third broad conclusion is that the rollout of rural land registration is likely to enhance land rights holders’ expectations of security and accelerate expectations and understand-ing of market-based approaches. In turn, this factor may increase pressure to address some of the inherent problems associated with the current approaches to urbanization in China. International experience suggests that the following issues are likely to be significant in China’s developing strategy for urbanization:
• Policy and legal frameworks. Policy and legal frameworks should recognize the importance of land and property tenure in the urbanization process. Developed mar-ket economies have generally moved in the direction of ensuring clear definition of
rights and the security of land tenure and of the whole set of institutions within which this process takes place, including record-ing of rights, valuation, taxation, regulated spatial planning, and dispute resolution.
• Effective institutions. For land markets to work efficiently, they need to be supported by a wide range of institutions and by the data sources and information they gener-ate. Where these institutions are poorly developed, inefficient, or poorly regulated, they lead to market inefficiency, with impacts on the economy and equity. Gov-ernment institutions provide the policies, regulations, and implementation capaci-ties that govern all aspects of the use of land. Their interaction is often complex, with functions divided between ministerial departments and different levels of govern-ment. Modern land administration systems are information technology (IT) based and provide a holistic approach, encompassing land rights registration, property valua-tion, property taxation, physical planning, and development control.
• Land markets. Land markets in developed market economies rely on the availability of capital and credit and the functioning of financial institutions. In well-regulated markets, land with secure title is often a form of collateral, and access to mortgage finance allows owners to invest in proper-ties that they would otherwise be unable to afford. Banks and mortgage lenders are the main source of mortgage finance, with governments retaining oversight and influ-ence over market activity through interest rate setting and financial regulatory frame-works. Insurance companies are critical in supporting market activity by enabling effective control of insurable risks.
• Professional organizations. Competent professional institutions provide an essen-tial link between buyers and sellers and government institutions. Their specialist knowledge and skills are an integral part of well-developed land markets. Such ser-vice providers include lawyers and con-veyancers, brokers or estate agents, value assessors, land surveyors and structural surveyors, and accountants, among others.

286 U r b a n C h i n a
Land development value and value capture
In countries with formal land markets with regulated spatial planning, which restricts the development of land according to zon-ing principles, land value is determined by a range of factors of which location and land planning designation are the most impor-tant. When land in an appropriate location is designated for urban development under planning regulations, its value tends to increase substantially. There is a long history of analysis of impacts of public decisions on land use and infrastructure and who should benefit from them. Development value can be a major windfall gain in developed market economies.9 The question, however, is who should benefit from the development value of land—the difference in value between the existing agricultural use and the value with permission for development—or from infra-structure investments that improve the value of land by altering its locational qualities. The public sector commonly seeks to capture some or all of the value created by the right to develop or by the public investment.
The question of value capture is always sensitive and reflects contemporary politi-cal balances and environments. A range of approaches are used to capture the value that results from development planning decisions
or from public infrastructure development. These approaches are not mutually exclusive but are often used in conjunction with each other (table 4.5).
Approaches to capture betterment value
Government-led compulsory land acquisition involves the compulsory acquisition of land and the payment of compensation. It enables all of the incremental change in value that occurs when land use changes to be fully captured by the government. This approach is the one currently adopted by China. It is resulting in considerable dissatisfaction on the part of those whose land is being acquired, with many thousands of mass pro-tests against expropriation, eviction, and demolition-related actions every year, which suggests that an acceptable political and institutional solution has not yet been found.
An annual land and property taxation system, a typically local tax revenue system, is based on a well-administered land and property tax. The approach is based on the principle that the interest of the individual taxpayer is enhanced by the planning deci-sion or new infrastructure, thereby resulting in an increased tax liability. Regular revalu-ations of the land will capture a share of the increases in value from development planning decisions or as a result of public infrastruc-
TaBLE 4.5 Mechanisms capable of capturing betterment
Mechanism Description
Government purchase and ownership of land, with resale at developed land prices, or granting of development and use rights in the form of long-term leases
Value increments created by rezoning (or the expectation of investment in social infrastructure) can be fully captured. Substantial practical difficulties are associated with such approaches unless acceptable political and institutional precedents exist.
A uniform land tax, paid annually without discrimination
This is an effective and nondistorting approach that would also appropriate increments generated within use classes and not only at the time of upgraded development rights (as is normally proposed with betterment taxes).
A tax on income generated from the sale of land and buildings at appropriate personal and business tax rates, providing tax deductibility for the value of improvements
This tax would act as an effective betterment tax. Such a system could replace capital gains tax (at least as it applies to land and buildings).
Taxes or charges applying to the “unearned increment” of value increases only
The classic application of betterment taxation theory, this mechanism seeks to capture the difference between the unimproved value of the land at its current use and its unimproved value following rezoning.
Source: Medda and Modelewska 2011.
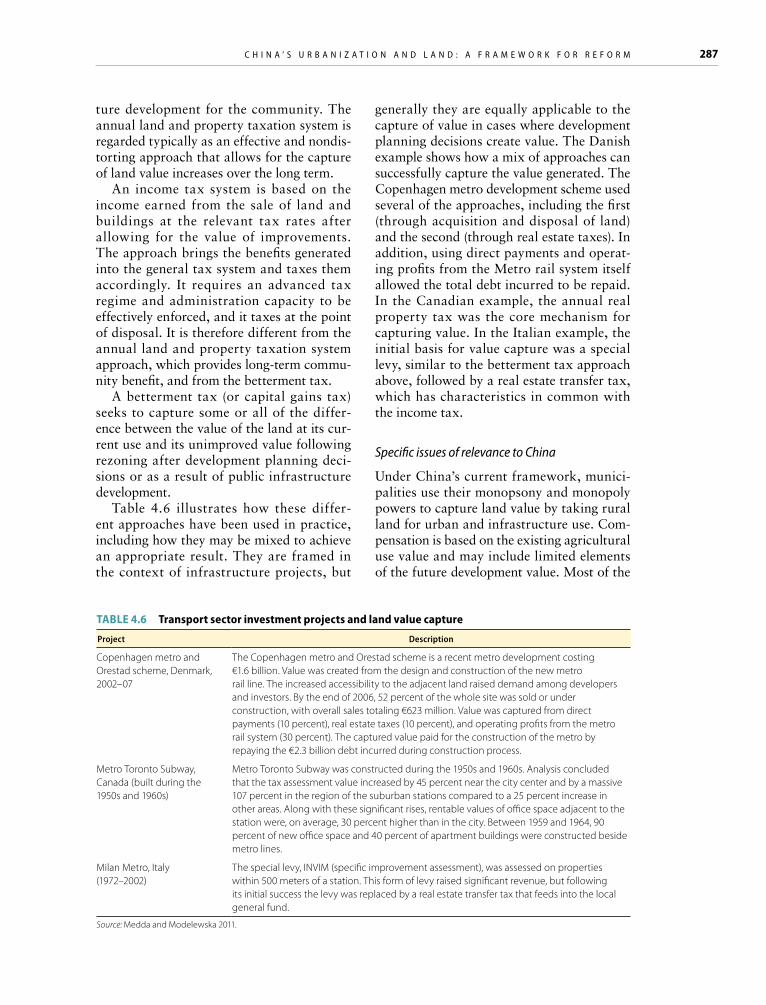
C h i n a ’ s U r b a n i z a t i o n a n d l a n d : a f r a m e w o r k f o r r e f o r m 287
ture development for the community. The annual land and property taxation system is regarded typically as an effective and nondis-torting approach that allows for the capture of land value increases over the long term.
An income tax system is based on the income earned from the sale of land and buildings at the relevant tax rates after allowing for the value of improvements. The approach brings the benefits generated into the general tax system and taxes them accordingly. It requires an advanced tax regime and administration capacity to be effectively enforced, and it taxes at the point of disposal. It is therefore different from the annual land and property taxation system approach, which provides long-term commu-nity benefit, and from the betterment tax.
A betterment tax (or capital gains tax) seeks to capture some or all of the differ-ence between the value of the land at its cur-rent use and its unimproved value following rezoning after development planning deci-sions or as a result of public infrastructure development.
Table 4.6 illustrates how these differ-ent approaches have been used in practice, including how they may be mixed to achieve an appropriate result. They are framed in the context of infrastructure projects, but
generally they are equally applicable to the capture of value in cases where development planning decisions create value. The Danish example shows how a mix of approaches can successfully capture the value generated. The Copenhagen metro development scheme used several of the approaches, including the first (through acquisition and disposal of land) and the second (through real estate taxes). In addition, using direct payments and operat-ing profits from the Metro rail system itself allowed the total debt incurred to be repaid. In the Canadian example, the annual real property tax was the core mechanism for capturing value. In the Italian example, the initial basis for value capture was a special levy, similar to the betterment tax approach above, followed by a real estate transfer tax, which has characteristics in common with the income tax.
Specific issues of relevance to China
Under China’s current framework, munici-palities use their monopsony and monopoly powers to capture land value by taking rural land for urban and infrastructure use. Com-pensation is based on the existing agricultural use value and may include limited elements of the future development value. Most of the
TaBLE 4.6 Transport sector investment projects and land value capture
Project Description
Copenhagen metro and Orestad scheme, Denmark, 2002–07
The Copenhagen metro and Orestad scheme is a recent metro development costing €1.6 billion. Value was created from the design and construction of the new metro rail line. The increased accessibility to the adjacent land raised demand among developers and investors. By the end of 2006, 52 percent of the whole site was sold or under construction, with overall sales totaling €623 million. Value was captured from direct payments (10 percent), real estate taxes (10 percent), and operating profits from the metro rail system (30 percent). The captured value paid for the construction of the metro by repaying the €2.3 billion debt incurred during construction process.
Metro Toronto Subway, Canada (built during the 1950s and 1960s)
Metro Toronto Subway was constructed during the 1950s and 1960s. Analysis concluded that the tax assessment value increased by 45 percent near the city center and by a massive 107 percent in the region of the suburban stations compared to a 25 percent increase in other areas. Along with these significant rises, rentable values of office space adjacent to the station were, on average, 30 percent higher than in the city. Between 1959 and 1964, 90 percent of new office space and 40 percent of apartment buildings were constructed beside metro lines.
Milan Metro, Italy (1972–2002)
The special levy, INVIM (specific improvement assessment), was assessed on properties within 500 meters of a station. This form of levy raised significant revenue, but following its initial success the levy was replaced by a real estate transfer tax that feeds into the local general fund.
Source: Medda and Modelewska 2011.
288 U r b a n C h i n a
development value accrues to the govern-ment. International experience raises many policy and administrative questions that are relevant to China. In particular, the follow-ing important questions need to be answered: What is a fair approach to dealing with the legitimate property interests of farmers from both an administrative and a value capture perspective when land is acquired for urban expansion or for infrastructure development? Should these legitimate interests attract a greater share of the development value? How should development value be defined and assessed? Which institutions will be respon-sible for addressing and overseeing the urban development? What type of appeals pro-cess will be available to the legitimate inter-est holder, and what will the institutional responsibility be? These questions may be expressed as three scenarios.
Modification of the current approach based on compulsory acquisition and compensa-tion. This scenario would include the con-tinuation of the current expropriation prac-tices, but compensation could more closely reflect the development (market) value of land. The development value could be shared equally between the acquiring authority and the farmers whose land was expropriated. Whereas farmers would gain significantly under this model, municipal government revenue from land development would be halved. Municipal finance reform would need to proceed in parallel to ensure sus-tainability. This approach could also create short-term municipal cash flow and solvency problems if compensation is paid at the time of acquisition, and demand for the land or land values may be reduced when the gov-ernment sells the land. Such risks could be managed by avoiding land banking and by deferring expropriation and compensa-tion payments until a buyer is in place. This scenario, though, raises sophisticated land administration and valuation issues that will demand substantial capacity, ranging from registration to real property valuation, for which there is very limited administrative provision or capacity currently available in China.
Developed-country approach. The devel-oped-country approach leaves existing ten-ure rights in place but changes the planning designation of the land and allows the gov-ernment to capture some of the development value through taxation. City planners rezone land to shape the city and guide investment. Rezoning includes defining the use, height, and density restrictions of the development area. Market forces, on the basis of exist-ing tenure rights, are then allowed to operate freely, thus allowing collective construction land to be directly sold to buyers. The mar-ket will determine the highest and best use within the planning restrictions. Purchase and development of land will take place at a time and at a price that is supported by the market, leading in principle to a more efficient allocation of resources based on market demand. The recovery of all or an appropriate part of the development value can be achieved through one or more of the range of tax or betterment levy approaches discussed above. A similar approach is the zone-taking approach practiced in Taiwan, China. This model also demands substantial capacity, ranging from registration to real property valuation, for which there is very limited administrative provision or capacity currently available in China.
Mixed approach. A possible mixed approach could give more freedom in the use of exist-ing farmer tenure rights and involve munici-pal authorities as partners through exercise of their development planning authority. The mixed approach could allow for leasing and shareholding options under which farmers would retain their property interest in the land. Private investors could deal directly with farmers to assemble larger plots of land for development. This approach also raises the above issues of site assembly, valuation, management, and governance, and municipal authorities could become involved as third-party stakeholders, for example, by rezoning, facilitating site assembly, and being party to agreements (thereby receiving part of the development gain). Recovering the develop-ment gain would be complex and could be achieved through a variety of approaches,

C h i n a ’ s U r b a n i z a t i o n a n d l a n d : a f r a m e w o r k f o r r e f o r m 289
including possible shareholdings in the enter-prise or annual or other taxation regimes.
Land and property taxes and local government finance
Countries have different approaches to financing local governments. Most countries have policies of decentralization in common. Although decentralization and subnational government policy may differ, the authority of decentralized governments to raise and spend revenue is normally related to their devolved functions and responsibilities, set forth in the constitution, laws, and admin-istrative provisions. Finding appropriate and politically acceptable bases for raising income to finance decentralized expenditure, how-ever, remains a challenge in many countries.
Most developed countries impose real property taxes of one form or another. These include property transfer taxes and capi-tal gains taxes levied on property sales, and inheritance tax or estate duty levied on inher-ited properties, both of which are usually under the jurisdiction of the central govern-ment. Annual property taxes, however, are usually imposed as a local tax, mostly to fund local administration and services. In addition, taxes can be designed to encourage socially, economically, and environmentally desirable behavior. Annual property taxes, as a source of both local and current bud-get financing, have a number of advantages: the concentration of wealth in land and real property, particularly in urban areas, pro-vides a substantial base for taxation. Annual property taxes are often widely accepted by the taxpayers because they are often consid-ered to be fair; they are stable and predictable and provide a sustainable source of revenue and a hedge against inflation over time, thus ensuring the maintenance of revenue in real terms.
Annual property taxes are particularly suitable for financing local services because real property is locationally fixed and prop-erty taxes are generally difficult to avoid. Also, a clear link exists between the types of services typically financed at the local level and the benefits received by the tax-
payer, including benefits to property values. Local annual property taxes are therefore often advocated as a means of improving the accountability of local governments to residents. Annual property taxes are also less prone to cyclical swings than other forms of tax revenue. This stability is in part the result of tax assessments, where those assessments are based on market-related property val-ues, being adjusted more slowly than actual prices of properties. Property taxes may even restrain housing booms and land banking by making it more expensive to buy and hold homes and land for purely speculative pur-poses. An Organisation for Economic Co-operation and Development study (OECD 2010) suggests that taxes on immovable property are the least harmful type of tax for economic growth, particularly for urbaniz-ing emerging economies with large informal sectors.
Despite the advantages, property tax sys-tems can be expensive to establish and are unlikely to provide sufficient funds to finance all the expenditure requirements of local governments. Revenue from such taxes is normally limited to funding public services, such as administration charges, street clean-ing, refuse collection, among others. Capital expenditure on infrastructure, education, and health and welfare services generally require funding from central government transfers, development charges, land leasing, and public-private partnerships and other sources. For the administration of prop-erty taxes, the system must be efficient and transparent, with well-trained professional staff. Assessments of valuations and taxable amounts should be made public, and govern-ment should provide taxpayers with a right to appeal against valuations.
International practice
The amount of revenue generated from recur-rent property taxes varies significantly. High-income countries tend to generate propor-tionately larger amounts than middle-income countries, whether viewed as a proportion of GDP or as a share of tax revenue. Aver-age revenue from recurrent property taxes

290 U r b a n C h i n a
in high-income countries represents gener-ally less than 5 percent of GDP (Norregaard 2013). However, this does not fully reflect the potential contribution that such taxes can make. At the upper end of the scale, prop-erty taxes account for almost 17 percent of GDP in the United States, whereas in Great Britain and Canada the figure is around 12 percent. The significance of annual taxes on land and property at the local level is often evident when viewed as a proportion of over-all revenue of local government. In the devel-oped market economies of the United States and Europe, in particular, recurrent taxes on land and property provide a varying element of municipal finance, with some jurisdictions relying more on such sources of revenue. Most land and property tax systems are tied directly or indirectly to the market value of land and immovable improvements. In most cases, this is the capital value, although, for example, the United Kingdom’s commercial property tax, the Uniform Business Rate, is tied to the rental value.
Germany
Local governments in Germany have a rela-tively modest level of dependence on recur-rent taxes on land and property and have responsibility for water supply and sewage, waste disposal, local roads maintenance, local welfare and health services, as well as construction and maintenance of primary and secondary schools. Local governments’ share of all government expenditure was 22 percent in 2005, representing 7 percent of GDP (Schlosser 2007). The German system includes a strong element of revenue sharing and redistribution between different levels and units of government. Local authorities received €151 billion in 2005, representing 24 percent of the total income of all three government levels. Of the total local tax reve-nue of €54 billion, the dominant source is the local business tax, with €23 billion, followed by €18 billion from a 15 percent share of the national income tax. The local property tax, which is much lower than in other countries, contributed €9 billion, or 17 percent of local tax revenue. Fees and rates, two-thirds of which are from water and solid waste dis-
posal, returned €16 billion, and commer-cial activities returned €9 billion. The most important single source of revenues, how-ever, is grants from higher government levels, at €49 billion. These come from established mechanisms for providing designated grants from higher levels of government for local infrastructure and urban renewal. An impor-tant complementary element for financing local infrastructure is a legal provision that enables municipalities to recover significant amounts of these expenditures—usually up to 90 percent—from property owners.
Table 4.7 highlights the challenge that the property tax needs to be designed either so it can be regularly revalued through com-puterized mass appraisals, or so revaluation is not a key element; otherwise it becomes politically difficult to update valuations. Germany’s property tax system is frequently criticized for favoring landowners by using implicitly low tax rates derived from out-of-date valuations.
Other countries
The United Kingdom, with its long history of substantial property taxation, has a higher dependency on real estate taxes at the local level than most other high-income economies. Annual property taxes account for approxi-mately 9 percent of national tax revenues and 50 percent of local government self-generated revenue. The United States has a similar pro-file, having adopted property taxes as a sig-nificant revenue source at the local level from the earliest stages of its urban development. Property taxes account for approximately 50 percent of all local government self-generated revenue. Annual taxes are based on regu-lar market-value assessments carried out by assessment offices. These offices often main-tain an open-access website that contains practical information about property values and the assessment process, providing easily accessible comparable sales data and maps, together with information on liabilities, exemptions, and so forth.
Globally, assessment methodologies have recently been greatly improved, particularly with the implementation of computer-assisted mass appraisal, which provides reasonably

C h i n a ’ s U r b a n i z a t i o n a n d l a n d : a f r a m e w o r k f o r r e f o r m 291
accurate and consistent, largely automated, assessments. Similarly, developments in IT have made electronic billing and payment a key feature of both local and central govern-ment financial management. In Japan, key features of market-based value, regular reval-uations, and significant contributions to local tax revenue are common (table 4.8).
Specific issues of relevance to China
In China, municipal authorities use their reve-nue from land conversion to fund both current and capital expenditure. This model places an undue burden on a single, unpredictable revenue source and encourages the geographi-cally extensive development of cities, which in turn requires further capital expenditure
on infrastructure, including roads, utilities, and transport networks. One of China’s main concerns in considering alternative forms of local government finance is that revenues from annual property taxation will be insuf-ficient to replace funding from the current land conversion system. China’s challenge is to convert its local government financing model to one that is sustainable, predictable, transparent, accountable, and less dependent on cyclical land conversion markets.
International experience shows that sepa-rating current and capital budgets creates a more direct link between revenue sources and local authority functions and responsi-bilities, which could be managed in different and directly relevant ways. The introduction of recurrent property taxes could provide a
TaBLE 4.7 Land and property tax in germany, 2003
Elements of the property taxation system Description
Tax authority The state tax administration is responsible for assessment of the standard tax as the basis for levying the municipal tax. The municipality applies a variable “leverage ratio” to this standard tax.
Object of taxation Agricultural land and forests; other real property Land: 61.5 million parcels; registered strata/condominium units: 14 million
Taxpayer The owner is liable to pay the tax. In addition, the user of the property (usefructor) may be rendered liable to pay the tax.
Tax base According to the valuation law, this is the price that could be realized in the case of sale. Land and buildings are supposed to be reassessed every six years, but 1964 data (price adjusted for 1974) have been used until 2003 without further update.
Tax rate The state applies a standard base rate to the value, for example, for agricultural land: 0.6 percent, and for other real estate (with/without buildings): 0.35 percent. Municipalities apply a municipal leverage factor; national averages at 2000 were:agricultural/forestry land: 278 percent, and private/commercial real estate: 367 percent.
Tax revenue Land and property taxes: €8.85 billion in 2000 (15.5 percent of total municipal taxes; 0.44 percent of GDP.
Source: Spahn 2003.
TaBLE 4.8 Land and fixed property tax in Japan
Elements of the property taxation system Description
Tax authority Municipalities (cities, towns and villages) assess, levy, and collect the tax
Object of taxation Land, buildings and tangible business assets: 177 million parcels; 59 million buildings
Taxpayer Owners of land, buildings, and depreciable property—of land: 37 million persons; of buildings: 35 million persons; of tangible business assets: 4 million persons
Tax base Value (fair market value) as of January 1; land and buildings reassessed every three years
Tax rate Standard tax rate: 1.4 percent; maximum tax rate: 2.1 percent
Tax revenue ¥9.257 trillion at 1999; 45.3 percent of total municipal taxes; 0.37 percent of GDP
Source: Kitazato 2003.

292 U r b a n C h i n a
significant contribution to annual budgetary operating costs, possibly in the region of 50 percent of locally generated revenue. None-theless, alternative sources will be needed for the balance. Alternative funding for capital investments will also need to be considered. These might include, for example, the issuing of long-term loans or bonds, central govern-ment grants, cost-recovery service charges, user fees and licenses, and greater private involvement, such as through public-private partnerships.
Although China has some experience with land-related taxes, the design and introduc-tion of a municipality-wide, equitable, and sustainable annual property tax system should be undertaken in a planned and holis-tic manner. The administrative (and political) challenges in resolving such issues and bring-ing about local government finance reforms in China should not be underestimated (box 4.3). The strategy for reform requires a strong political will, clear objectives, careful plan-
ning (including adequate resource planning), and resolute action. Important questions will arise such as: Which properties will form the taxation base and which will be excluded? What will be the basis for determining the market value of the property? What will be the level of payment—what is a reasonable amount and who will set the level? What level of technology will be required to admin-ister the taxation system? Which institutions will be responsible for administering the tax: valuing property and levying and collecting the tax? What levels of technical resources are required, and how will they be procured or trained? What changes to laws and regula-tions will be required? How will the initial setup costs be funded? How will taxpayers be sensitized to accept such a new tax? Will the tax be phased in or introduced as a one-time reform?
Introducing annual property taxes will require the development of strong institu-tional and technical expertise in land admin-
Taxes on land and real estate have become increas-ingly important in China’s cities. The share of land-based taxes in overall tax revenue has grown fast in recent years as a result of booming real estate mar-kets (Wong 2013). China currently taxes property in the form of an urban land use tax, which is levied on the land area of the property; a real estate tax for business use, which is levied on original value; a land value added tax that is levied on the appre-ciation in land value; a farmland occupation tax, which is levied on land area; and a deed tax, which is levied on the self-reported value of property at the time of transfer. Real estate is mostly taxed at the time of transfer. Land-related taxes have grown to more than 16 percent of total local tax revenue and have increased from RMB 51 billion in 2001 to more than RMB 1 trillion in 2012. The taxes on real property account for about 1.6 percent of GDP (Man 2013).
Broad-based annual property taxes and capital gains taxes have not been introduced in China, except for small-scale pilots on annual property taxes in Shanghai and Chongqing. The pilots, however, have been designed as levies with minimal coverage. The
Box 4.3 China’s property taxation
Chongqing experiment covers only very high-income residential housing and less than 3 percent of all par-cels in the city. It involves no valuation (the tax base is original purchase price less a standard deduction for area) and yields annual revenue of only about RMB 100 million. The Shanghai experiment is similarly restricted to a small segment of the residential hous-ing stock and does not generate much revenue relative to the size of the city budget. Because valuation is the core of property taxation, these pilots do not move China significantly closer to implementation of a full property tax that covers a significant portion of the urban property base.
A possible approach for China would be to pilot a comprehensive tax on property in urban areas. The existing taxes might be combined into a new prop-erty tax regime that would include the annual prop-erty tax, a capital gains tax on transfers of real prop-erty, and a set of value capture taxes on real estate. The capital gains tax is relevant in the discussion of land market integration of collective and state land markets. Valuation, cadastre, and even collections could be combined, and the revenue yield could be significant.
C h i n a ’ s U r b a n i z a t i o n a n d l a n d : a f r a m e w o r k f o r r e f o r m 293
istration, including regulatory frameworks, spatial planning, land records, valuation, financial management, and appropriate tech-nology. Those, in turn, will require academic and professional training and the develop-ment of professional associations to enforce licensing, standards, and ethics. Not least of these challenges will be the development of a functional property market to facilitate the transfer of land and property to its highest and best use and to provide appropriate evi-dence for an equitable basis of assessment.
Expropriation and compensation
Countries retain powers of compulsory acqui-sition in order to acquire land for public pur-poses, usually relating to social and economic development or the protection of the natural environment. The nature of these powers and the ways in which they are used are sensi-tive and have wide implications. Compulsory acquisition is disruptive for those who are affected and whose property is taken, and it may have serious negative impacts on people and livelihoods. Therefore, having satisfac-tory approaches in place and implemented is important, including compensation that ensures that people are placed in situations at least equivalent to those before the land acquisition. Prerequisites for compulsory acquisition include appropriate legal frame-works, capacity for implementation, good governance, and adherence to the rule of law. The expropriation of tenure rights is gener-ally governed by relevant legislation and reg-ulatory provisions, which generally address the circumstances under which expropriation may take place and for what purpose, what procedures are required, and how compensa-tion is assessed. Those provisions will deter-mine to a large extent the political accept-ability of the process. In circumstances where acquisition is accompanied by a change of use, land acquisition is likely to be particu-larly contentious when the new use is more intensive and of much higher value. Most countries have therefore developed principles dealing with three broad themes:
• Due process and fair procedure. Modern practice provides rules that ensure appro-
priate advance consultation, participa-tory planning, accessible mechanisms for appeals, and limits on administrative dis-cretion. Rules that place reasonable con-straints on the power of the government to expropriate land strengthen people’s confidence in the justice system, empower people to protect their land rights, and increase the perception of tenure security.
• Good governance. Transparency and checks and balances are features of good governance, and they reduce opportuni-ties for corruption and abuse of power. Officials who expropriate land should be accountable for the good-faith imple-mentation of the laws. Laws that are not appropriately observed by local officials undermine the legitimacy of compulsory acquisition.
• Equivalent compensation. Policies and laws should ensure that affected own-ers, occupants, and users receive fair and prompt compensation, whether in money or in alternative land. Regulations need to set clear and consistent valuation bases for achieving this.
Most developed market economies have resolved the core issues of concern and achieved a working consensus that is accepted by most stakeholders. Periodic adjustments of policy and practice happen for many reasons, but these tend to be marginal. The situation in transitional economies is often far more complex because the interrelation of evolv-ing legitimate tenure rights and municipal management and finance makes it harder to make meaningful marginal changes to fix the system. Instead, major integrated reforms are required. In China, the widespread discon-tent of those whose land is being taken is a clear indication that compulsory acquisition and compensation processes and results are not working well. China is not alone in not having found acceptable formulas for dealing with this challenge.
International practice
Compulsory land acquisition is a problem-atic area of public policy in which norms, regulations, and expectations change as (a)

294 U r b a n C h i n a
political systems transition from one set of political norms, (b) countries grow wealthier, (c) people change their views on the value of their resources, (d) technologies change, and (e) people recognize the impacts of pub-lic schemes on land values. Reviewing how other countries deal with the process and implementation of compulsory acquisition is helpful.
United Kingdom
The United Kingdom’s provisions for com-pensation have varied significantly, reflecting changing political balances, expectations, and technologies. For example, the question of how to deal with development value caused substantial oscillation of policies from the end of the Second World War to the early 1980s. Expectations and ability to afford more than basic compensation were legislated for in the 1970s in the form of supplementary home loss payments. Also in the 1970s, the adverse impact on properties near development was increasingly recognized, along with the need for compensation for the physical impacts of public schemes on properties where land was not taken, for example, air traffic noise or the impact of motorway flyovers. The principle behind compulsory purchase (expropria-tion) in the United Kingdom, embodied in existing legislation and case law, is that indi-viduals whose land is expropriated should be financially compensated so they are left in no worse a position than if the expropriation had never taken place. Equally, landowners should not make windfall gains simply as a result of public policy decisions that require substantial public investment. However, the amount of compensation for land should also reflect the prospects for its development prior to the designation of the scheme. The level of compensation to be considered is therefore not limited to the existing use. The process of acquisition is based on consultation, negotia-tion, and the right to appeal both the project and the amount of compensation.
United States
Urban development in the United States has largely been achieved through private sec-tor investment, with limited use of state
expropriation (or eminent domain) powers. The Fifth Amendment of the Constitution imposes limitations on the exercise of emi-nent domain: the taking must be for public use, and just compensation must be paid, both of which have largely been established through determination by the courts. The general premise is that public use, if left unre-stricted, could jeopardize private property rights. Courts have acknowledged the dif-ficulty of articulating a universal standard for defining public use. Historically, it was held that the definition precludes the govern-ment from seizing land from the hands of the owner and turning it over to a third party on the vague grounds of public benefit for a more profitable use. However, state courts have upheld the use of eminent domain for a variety of urban renewal programs.
American courts have also held that the preferred measure of just compensation is fair market value, that is, the price that a buyer would pay a seller in a voluntary transac-tion, with both parties fully informed of the property’s good and bad features. Also, this approach takes into account the property’s highest and best use (that is, its most profit-able use), which is not necessarily its current use or the use mandated by current zoning, if there is a reasonable probability of zone change. The courts have also held that due process must be followed, which includes consultation, negotiation, prompt payment of compensation, and the right of appeal. The property may be taken either for government use or by delegation to third parties, such as utility companies, that will devote it to public or civic use or, in some cases, economic devel-opment. The most common uses of property taken by eminent domain are for government buildings and other facilities, public utilities, highways, and railroads; however, property may also be taken for environmental reasons.
Japan
In Japan most land acquired for public pur-poses is through processes of purchase by agreement, a normal transaction under the Civil Code. Where agreement is not possible, compulsory purchase powers will be invoked under the Land Expropriation Act. The com-pensation for the loss of the land is assessed

C h i n a ’ s U r b a n i z a t i o n a n d l a n d : a f r a m e w o r k f o r r e f o r m 295
distinctly from the cost of removal or other loss associated with the buildings. Just com-pensation refers to the full compensation of the acquired property based on the fair market value that is identified as the normal transaction price that could be expected in the market. As in many other countries, land severed by the acquisition will be compen-sated by any consequent reduction in value. Where there is a leaseholder, the parties are asked to apportion the compensation value by negotiation. Compensation is also given to cover other losses, such as removal costs and loss of business goodwill or profits. Finally, since the 1960s, the Land Expropriation Act has provided for additional life-rebuilding measures where appropriate, including, for example, training for new occupations.
Specific issues of relevance to China
Local governments in China use their expro-priation powers more frequently than do those in most other countries. The degree to which China’s land expropriation system can be reformed is linked to and dependent on the wider land policy reforms, the state’s monopoly in primary land markets, and the associated dependence of local governments on income generated from land conversions. The goal of significantly reducing the need to use expropriation powers will depend on several assumptions, for example, that appro-priate alternative sources of local government funding can be developed, that broader par-ticipation in land markets will be permitted, and that land use policies will be developed to encourage the redevelopment and regenera-tion of brownfield sites to more intensive uses.
In effecting such reforms, China will need to respond to questions such as the follow-ing: For what purposes may the compulsory acquisition power be used? Which organs should hold the power of expropriation? What is the nature of the legitimate rights that exist, and how should they be compen-sated? How can appropriate compensation be assessed, and what capacities are required? What mechanisms for appeals should there be? What institutional changes, including capacity development, will be necessary? In addition to the process of developing appro-priate policies for compulsory acquisition and
compensation, the reforms will involve a sub-stantial overhaul of existing policy, legal and administrative frameworks, and capacities.
rural land registration and property markets
The call for the registration of rural land over the next five years under Central Document No. 1 of 2013 is particularly relevant and significant to China’s urbanization. Not only will the registration of rural land provide increasing certainty and confidence to rural land rights holders, but it also will affect how markets develop and how development value is treated, how local governments can be sus-tainably financed, and how expropriation and compensation will function.
International practice
Markets are one of the principal mechanisms used around the world to transfer tenure rights and duties. Urbanizing areas are vig-orous in terms of volumes of market activ-ity, yet property markets are inefficient and inequitable if not appropriately designed, regulated, and supported with the appropri-ate capacities. Developed market economies recognize the recording of tenure rights as vital to the governance of tenure. Appropriate and sustainable systems for recording tenure rights should be maintained and updated to enhance their security and underpin all forms of market transactions. Land registration has been a key policy in the transitional former socialist economies of Central and Eastern Europe and the Commonwealth of Indepen-dent States. Since 1990, these countries have invested heavily in designing appropriate systems for the administration of tenure to ensure that real property, land, and buildings become a positive contributor to economic growth, without compromising equity.
International experience shows that rural land registration programs often take decades to complete. In Thailand’s land registration program, for example, completing the pro-cess of rural land titling took about 20 years. The Thailand Land Titling Program, which commenced in 1984, was one of the world’s largest titling programs, issuing over 8.5 mil-lion new titles to landholders. Almost 19 mil-

296 U r b a n C h i n a
lion of the estimated 20 million to 30 million parcels in the country had been registered by 2001. About 4 million registered parcels were affected by some form of transaction in 2001, of which almost 2.5 million were transfers. On average, producing a certified copy of a title took 30 minutes and complet-ing the registration of a transfer took about 2.5 hours. Despite some shortcomings, Thai-land’s program is seen as a success and as a potential model for other countries. Land administration and land titling have gener-ally occurred in a fairly orderly and struc-tured manner. The program is confined to nonforest land, and the rights of those living in areas formally classified as forest remain a major unresolved land issue. England and Wales still have registered only about 80 per-cent of the land parcels in the Land Registry since the policy went into effect in the Land Registration Act of 1925.
Although each case reflects the specific circumstances, constraints, and priorities of a particular country, global experience shows that undertaking national land regis-
tration is a major policy and logistical exer-cise, requiring the mobilization of substantial resources and capacity (box 4.4). Although the volume of investment in land titling has been less in Asia than in Central and Eastern Europe and the Commonwealth of Indepen-dent States, most countries have recognized the fundamental importance of secure ten-ure and are aware of the ample evidence of increased property transactions following land registration.
Specific issues of relevance to China
The policy laid out in Central Document No. 1 of 2013 to complete rural land registra-tion over the next five years is a major new development in land registration, land market development, and urbanization, and the scale of activity envisaged is unprecedented. The timescale for implementation may be ambi-tious by international standards of achieve-ment, but the effort will have a major impact on all of the above areas. Progress in regis-tration is likely to be rapid in economically
Land and property, and their effective administration, are critical to economic growth. Urban development in the United States is typified by private sector real estate market activity, with private parties contract-ing with each other directly to transfer rights in an open market. Within the confines of the framework set forth by state agencies, such as, zoning legislation, land has tended toward its economically most valu-able use. Market information in all sectors is avail-able from many sources, both the public sector (such as the U.S. Department of Agriculture’s National Agricultural Statistics Service) and the private sector. Although interference in market activity is compara-tively low, federal, state, and local governments are responsible for significant aspects of the institutional support to real estate and its regulation and admin-istration. Those aspects include responsibilities for land use planning, recording of deeds, and the assess-ment of real estate for property tax by the assessment offices.
Urban development is regulated at the local gov-ernment level by land use and zoning laws, regula-tions, and policies that guide new development while
Box 4.4 Land markets and institutions in the united States
implementing community goals and protecting com-munity resources. At the federal level, land use con-trols provide environmental protection. For example, the National Environmental Policy Act requires fed-eral agencies to integrate environmental values into their decision-making processes by considering the environmental impacts of their proposed action. The National Historic Preservation Act requires federal agencies to act as responsible stewards when their actions affect historic properties. The Bureau of Land Management maintains a cadastral survey of all par-cels and interests on all federal lands.
Mortgage lending to finance property acquisition is the norm. Financial institutions are a fundamental element in the stability and functioning of the mar-ket system. In addition, a wide range of professional services based on specialized approaches have devel-oped in relation to real estate, which enable markets to operate more efficiently. Those services include the U.S. Appraisal Institute, National Association of Realtors, and attorneys. These entities are largely self-regulating in terms of professional ethics and stan-dards and academic and vocational training.

C h i n a ’ s U r b a n i z a t i o n a n d l a n d : a f r a m e w o r k f o r r e f o r m 297
advanced provinces, which are most subject to market pressures, and in peri-urban areas with development pressure and market activ-ity. The likely impact of large-scale registra-tion of rural tenure rights in China in rela-tion to urbanization, and land acquisition and assembly for urban development, will be a considerably greater propensity to conduct transactions, whether through sale, lease, mortgage, or other permitted transaction.
Much will depend on what transpires in other related policy areas. What will hap-pen in relation to development value and to whom will it be attributable? How will municipal finance develop? Will compul-sory acquisition and compensation laws and practices change? Areas considered for urban expansion could become both more active and more competitive, and types and levels of transactions will likely be more sophis-ticated, particularly if municipal finances are effectively addressed and development value is made more accessible to stakehold-ers, notwithstanding policies to reclaim value through various mechanisms.
Critical questions will include the follow-ing: Have the impacts of rural land registra-tion and market development on urbanization been effectively considered and, if so, how will they be managed? What implications might these developments have on the process of spatial planning? Addressing these questions and the associated political and administra-tive challenges requires major change in rela-tion to rural land registration and the develop-ment of markets. Planning at such a scale will require strong political will, a clear and prac-tical vision and clear objectives, meticulous program planning, development of resources and capacity, and sustained action. Finally, addressing these responsibilities appropriately requires the development of strong institu-tional and technical expertise in land admin-istration in the key areas identified.
China’s land pilots: guidance for the national reform agendaSynthesis of domestic reform pilot experiences
Reforming China’s land tenure system will have extensive ramifications and will likely
reshape the social structure of rural China and urban-rural relations (box 4.5). In view of the complexity of land reform and the dif-ficulty of reaching consensus on the direc-tion of reform, China’s local reform pilots and their institutional and policy innovations can provide useful guidance for the broader reform direction. The pilots discussed in this section—Shenzhen, Chengdu, Chongqing, Beijing, and Guizhou—cover issues includ-ing the clarification, confirmation, and titling of land rights; market integration of rural-urban construction land and new arrange-ments for the transfer of collective land for urban development purposes; benefit-sharing arrangements involving incremental land value between rural and urban land holders; integration of urban-rural land use planning and land allocation; and redevelopment of informal industrial areas and housing areas in urban villages.
The principal lessons from these pilot reforms include the following:
• Optimizing land use can provide more flex-ibility in the urbanization process. Despite the variability in development across Chi-na’s regions and different land demand and supply conditions in different localities, all pilot areas are exploring new institutional arrangements to increase land use effi-ciency. The experiences in Chengdu and Chongqing, for example, demonstrate new approaches to optimizing land allocation between urban and rural areas by combin-ing a reduction in the inefficient occupation of rural land in rural areas with increased land supply for urban development. By comparison, the experiments in Guang-dong, Shenzhen, and Beijing reveal that large land inventories of low use efficiency are frequent across China’ s coastal areas and big cities, resulting in great potential for better use of this land for urbanization.
• Market entry for collective land is critical for long-term land supply for urbaniza-tion. Various pilots have demonstrated new approaches that allow collective construc-tion land to enter the urban land market to increase land supply and use efficiency. These approaches have involved the restric-tion of government-driven land sales, thereby allowing collectives to generate

298 U r b a n C h i n a
Agricultural land rights. The scope of agricultural land rights is defined in the law as the right to use, profit from, and transfer land contracting and operat-ing rights; the right of autonomy over production and operation and over disposition of products; and the right to receive the compensation for the land taken by the state or collective for nonagricultural purposes. The Rural Land Contracting Law (2002) allows rights to be transferred (to other village households); leased (to nonvillage households); and exchanged, assigned, or transacted by other means in accordance with law. Land rights are for 30 years in the case of farmland, 30–50 years in the case of grassland, and 30–70 years in the case of forestland. The Property Law (2007) permits the extension of the rights when such land rights expire. The Third Plenary Session of the 17th CPC Central Committee in 2008 concluded that existing agricultural land rights should be main-tained stable “for a long term without change,” thus expressing implicitly the intent to upgrade term-spe-cific land rights into perpetual rights.
China has also made substantial progress in laws and policies designed to increase tenure security. The Rural Land Contracting Law emphasizes the princi-ples of consultation, voluntariness, and compensation to prevent compulsory land transactions and land rights violations. The Land Management Law, the Rural Land Contracting Law, and the Property Law all prohibit village-wide land readjustments while allowing small readjustments for individual house-holds in special circumstances, based on the consent of the village representatives and on approval by the township government and county line agencies.
Central policy has repeatedly expressed concerns over the potential threat of corporate land acquisition to the livelihood of farmers that rely on land as their primary income source. The central intent to tighten restrictions on corporate acquisition of rural land rights for agricultural purposes is demonstrated in Central Document No. 1 of 2013 (Several Opinions on Speeding Up Development of Modern Agricul-ture and Further Strengthening Rural Development Vitality). The document distinguishes between land transfers to farmers and farmer associations and land transfers to enterprises. While encouraging and sup-porting transfers of use rights to rural land, including forestland, to farmers, family farms, and farmer asso-ciations, Central Document No. 1 also emphasizes the need to establish rules on permitting and regulat-ing industrial and commercial enterprises’ leasing of arable land, forestland, and grassland. Land transfers
Box 4.5 China’s rural and urban land rights
should not be compulsory, nor should farmers’ inter-ests be adversely affected through such land transfers.
Rural residential land rights. Rural residential land refers to land used to build residences for farmer households. Rural residential land is categorized as construction land that may be used for nonagricul-tural development without triggering increasingly stringent control over farmland conversion; therefore, it could have much higher market value than farm-land. The total area of rural residential land reached 166,000 square kilometers, almost five times the land taken by urban construction uses (34,000 square kilometers) (Wang and others 2012). This land, vir-tually untapped for development, may become an important source of land for urban and nonagricul-tural development. The Property Law defines rights to rural residential land as usufruct property rights but treats such rights differently than agricultural land rights and urban construction land rights. Rights to rural residential land include only the right to possess and use the land, but the law is unclear as to whether these rights include the right to profit from such land. Central policies also declare transfers of rural resi-dential land rights, either to the urban transferee or for nonagricultural development, as impermissible. Mortgaging of such land rights is also explicitly pro-hibited. Existing laws also do not specify the duration of such rights, but the Central Committee’s Revised Regulations on Rural People’s Commune, promul-gated in 1962, provide that farmers should be allo-cated residential land and be permitted to use it for a long term without change, and farmers’ houses built on such land should be owned in perpetuity. Registra-tion of rural residential land rights is managed at the county level.
Urban land rights. China’s Constitution and Property Law define urban land as land owned by the state. The State Council exercises land ownership rights on behalf of the state. Similar to its laws regarding rural land, China has a dual-track tenure system under which the state assumes ownership of all urban land but permits institutional and individual holding of use rights to such land. Such use rights are also usufruct property rights. However, a different set of legal rules and policies are used to regulate rights to urban land.
Use rights to urban land are allocated directly or granted for value through contractual arrangements between the government and the user. Use rights for residential purposes are granted for 70 years; for
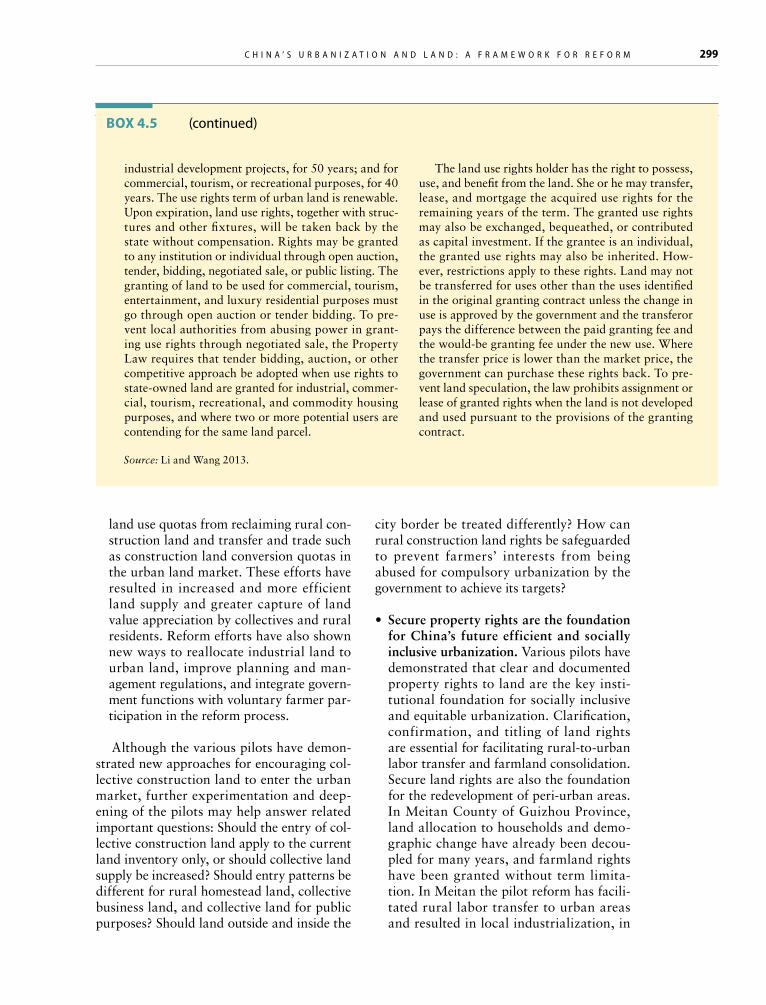
C h i n a ’ s U r b a n i z a t i o n a n d l a n d : a f r a m e w o r k f o r r e f o r m 299
land use quotas from reclaiming rural con-struction land and transfer and trade such as construction land conversion quotas in the urban land market. These efforts have resulted in increased and more efficient land supply and greater capture of land value appreciation by collectives and rural residents. Reform efforts have also shown new ways to reallocate industrial land to urban land, improve planning and man-agement regulations, and integrate govern-ment functions with voluntary farmer par-ticipation in the reform process.
Although the various pilots have demon-strated new approaches for encouraging col-lective construction land to enter the urban market, further experimentation and deep-ening of the pilots may help answer related important questions: Should the entry of col-lective construction land apply to the current land inventory only, or should collective land supply be increased? Should entry patterns be different for rural homestead land, collective business land, and collective land for public purposes? Should land outside and inside the
city border be treated differently? How can rural construction land rights be safeguarded to prevent farmers’ interests from being abused for compulsory urbanization by the government to achieve its targets?
• Secure property rights are the foundation for China’s future efficient and socially inclusive urbanization. Various pilots have demonstrated that clear and documented property rights to land are the key insti-tutional foundation for socially inclusive and equitable urbanization. Clarification, confirmation, and titling of land rights are essential for facilitating rural-to-urban labor transfer and farmland consolidation. Secure land rights are also the foundation for the redevelopment of peri-urban areas. In Meitan County of Guizhou Province, land allocation to households and demo-graphic change have already been decou-pled for many years, and farmland rights have been granted without term limita-tion. In Meitan the pilot reform has facili-tated rural labor transfer to urban areas and resulted in local industrialization, in
industrial development projects, for 50 years; and for commercial, tourism, or recreational purposes, for 40 years. The use rights term of urban land is renewable. Upon expiration, land use rights, together with struc-tures and other fixtures, will be taken back by the state without compensation. Rights may be granted to any institution or individual through open auction, tender, bidding, negotiated sale, or public listing. The granting of land to be used for commercial, tourism, entertainment, and luxury residential purposes must go through open auction or tender bidding. To pre-vent local authorities from abusing power in grant-ing use rights through negotiated sale, the Property Law requires that tender bidding, auction, or other competitive approach be adopted when use rights to state-owned land are granted for industrial, commer-cial, tourism, recreational, and commodity housing purposes, and where two or more potential users are contending for the same land parcel.
Box 4.5 (continued)
The land use rights holder has the right to possess, use, and benefit from the land. She or he may transfer, lease, and mortgage the acquired use rights for the remaining years of the term. The granted use rights may also be exchanged, bequeathed, or contributed as capital investment. If the grantee is an individual, the granted use rights may also be inherited. How-ever, restrictions apply to these rights. Land may not be transferred for uses other than the uses identified in the original granting contract unless the change in use is approved by the government and the transferor pays the difference between the paid granting fee and the would-be granting fee under the new use. Where the transfer price is lower than the market price, the government can purchase these rights back. To pre-vent land speculation, the law prohibits assignment or lease of granted rights when the land is not developed and used pursuant to the provisions of the granting contract.
Source: Li and Wang 2013.

300 U r b a n C h i n a
particular rural land consolidation, and urbanization. Chengdu municipality has mobilized local land survey results and vil-lage authorities to conduct a comprehensive campaign of land and property rights con-firmation, thereby providing a blueprint for rural-urban integration. Guangdong Province and Chongqing municipality have also used property rights confirmation as a foundation for their reconstruction pro-grams and land rights transfer approaches. Local land reform experiments have also identified the need for further experimen-tation in other aspects of property rights confirmation, such as overcoming the cur-rent separation of institutional responsibili-ties in land rights registration.
• Without the reform of the rural land expropriation and public finance systems, opportunities for collective construc-tion land to enter the market will remain limited. Local government incentives and the practice of land finance cannot be altered without addressing land finance and land collateralization through reform of the public finance system. A possible solution is to adjust the expenditure and revenue assignments and the tax-sharing ratio between the central and local govern-ments, and to accelerate the introduction of a comprehensive property taxation sys-tem. National-level legal reform can also ensure that collective land enjoys the same pricing and rights as state-owned construc-tion land. The reform of national laws is necessary for advancing the establishment of a unified rural-urban land market.
Shenzhen: Integration of collective and state construction land markets10
Shenzhen has been a forerunner in economic and land policy innovation throughout the reform process. Over the past decades, a large share of Shenzhen’s current built-up area has been developed by collectives on collectively owned rural land. Shenzhen has allowed a dual-track urbanization process whereby extralegal development by collectives coexists with the formal urban land market in which the state remains the only legal supplier of
land. In 2013, Shenzhen attracted nationwide attention when it relaxed the state’s monop-oly in the urban construction land market and allowed collectives (or succeeding collec-tive shareholding entities) to sell land directly to urban users. The challenges of this pro-cess include integrating the informal collec-tive land market into the urban development process, defining and clarifying the property rights to all land, and determining how ben-efits from urbanization will be shared fairly and transparently between rural and urban citizens. Despite Shenzhen’s specific condi-tions, the city’s policy innovation to con-solidate the collective and state construction land market is of national policy significance.
In 2004, the Shenzhen municipal govern-ment promulgated the incorporation of all remaining rural districts into the municipal urban boundary to promote urbanization. Rural residents were issued an urban hukou, village and township administrations were turned into urban subdistrict committees, and rural collectives were transformed into collective shareholding entities. About 260 square kilometers of collectively owned rural land were converted to state-owned urban land. This made Shenzhen the only munici-pality in China that owns all the land within its jurisdiction.
Across China, the taking and conversion of rural land occurs on a project-by-project basis following urban land use plans. Shen-zhen’s nationalization of land is therefore an unusual case. The government converted all rural land within its jurisdiction into urban land prior to the identification of urban con-struction projects (Wang, Wang, and Wu 2009). Remaining land for urban construc-tion had become extremely limited within the city boundaries, and extralegal construc-tion on collective land had developed uncon-trolled in response to high demand for land. Shenzhen nationalized all its land resources to avoid a situation in which the requisition of collective land and property would have become prohibitively expensive and prevented future urban development. Given Shenzhen’s status as a special economic zone and its his-tory of legal and regulatory breakthroughs in economic development, the Ministry of Land

C h i n a ’ s U r b a n i z a t i o n a n d l a n d : a f r a m e w o r k f o r r e f o r m 301
and Resources allowed the nationalization of land on an exceptional pilot basis.
In 2004, Shenzhen also began to address the illegal development and construction on former collectively owned land. It refrained from demolishing extralegal construction and penalizing collectives. Although land was converted to state ownership, the gov-ernment did not take the land but acquiesced to the collectives’ de facto land rights and allowed collective entities and their members to continue to profit from existing real estate. Although collective ownership has ceased to exist in Shenzhen with the nationalization of all rural land, new challenges over land con-trol and management in the urban develop-ment process have arisen.
In 2012, Shenzhen announced a com-prehensive plan to reform the city’s land management, backed by the Guangdong provincial government and the Ministry of Land and Resources. The guiding reform principles were to clarify property rights, allocate land through market mechanisms, promote a more efficient use of land, and regulate the city’s land market. The munici-pal government also announced a short-term plan for 2012 to 2015 to complete all out-standing land rights transfers from former collectives to the municipality, and to settle disputes over land controlled by former col-lectives with a view to remove the remaining obstacles to full marketability of land that is under the control and management of collec-tive entities.
Shenzhen outlined the city’s agenda for spatial development in Opinions on Opti-mizing the Allocation of Spatial Resources to Promote Industrial Transformation and Upgrading of 2013. The Shenzhen Commis-sion of Urban Planning and Land Resources also released supporting guidelines that detail how transactions of collective construction land are done in the market. The new policy targets industrial land under collective man-agement within the city boundary. Some of this land has been formally allocated to col-lective entities but has remained vacant for years. Other parcels have been developed by collectives, but property rights have remained unclear, are disputed, or are not legally rec-
ognized. Collective entities thus face difficul-ties in trading such land. Potential land users are concerned that their rights would not be protected after the purchase. Shenzhen’s 2012 agenda seeks to address this vacuum by allowing collective enterprises that have received legal allocations of land to sell unde-veloped land in the urban land market. In the case of extralegal construction, collectives are required to clarify property ownership, work out compensation plans, and then demolish illegal construction before listing and selling land on the market.
Shenzhen’s new policy remains consis-tent with existing Chinese law that currently does not allow the sale of collective land in the urban market. Shenzhen is the only city in China that owns all the land within its jurisdiction, which it achieved by nationaliz-ing collective land and converting rural col-lectives to shareholding companies in 2004. From a regulatory perspective, the policy deals with sales of state-owned land but not collective land and, specifically, with extra-legal construction land for industrial use (which accounts for only a small share of all extralegal urban construction). The policy is a first step toward extending property rights to extralegal property and legalizing its trans-ferability in the urban land market. A larger share of extralegal construction involves resi-dential property, for which reform is regarded as more complex.
The policy is innovative because for the first time it involves rural collective entities in the process of land sales and allows them to engage directly with potential bidders and in the land transaction. Transactions are limited to industrial-use land. Different from previ-ous requisition and compensation practices, the new policy allows collectives to benefit from the sale of land. Two schemes are cur-rently being implemented: one requires an equal sharing of proceeds from land sales between the municipality and the collective; the second requires the collective to pass on 70 percent of the proceeds to the municipal-ity and retain only 30 percent. In addition, the collective is guaranteed a 20 percent own-ership share in the property to be developed on the land under both schemes.

302 U r b a n C h i n a
Shenzhen’s policy advances are signifi-cant. Although local governments rely heav-ily on land sale proceeds and retain control over land allocation and investment plan-ning, Shenzhen has been willing to relax its monopoly power in the urban land market to respond to the need for more efficient urban development in view of limited land availabil-ity. Many other fast-growing cities in China fuel their spatial expansion by aggressively converting rural land to urban use. In Shen-zhen most of the land suitable for construc-tion has already been built up, and urban expansion land is limited. The redevelopment of existing, poorly built property and inef-ficiently used construction land is therefore an important way to ease the development constraint.
The particular challenge for Shenzhen is that the majority of sites suitable for urban redevelopment contain extralegal unregis-tered property with unclear property rights. In 2011, of the city’s 918 square kilometers of developed land area, 390 square kilometers belonged to former collectives, of which an estimated three-quarters either were illegally built up or suffered from property rights disputes. Much of the extralegal develop-ment is a legacy of Shenzhen’s bottom-up, farmer-led industrial development during the early reform era of the 1980s, when large areas of collective land were converted to nonagricultural uses and leased to inves-tors or developed by the collectives them-selves. That development contributed greatly to Shenzhen’s economic growth during the reform period as collectives provided fac-tory space and cheap housing for millions of migrants. The wave of development preceded the promulgation of the Land Management Law and the stricter enforcement of land use controls. The Shenzhen government toler-ated such development to advance its growth. The extralegal development and unregistered property is now problematic in many ways. It falls outside the purview of the city’s for-mal urban management, violates regulations of urban planning and construction, poses threats to public safety and health, and hin-ders more efficient redevelopment. However, because extralegal development has been per-
vasive and important for collective members’ livelihoods, the municipal government can-not simply dismantle and demolish the sites because such an action would likely lead to social discontent. In addition, requisition of and market-based compensation for collec-tive property would exceed the city’s finan-cial capacity.
Shenzhen’s policy of allowing collec-tive entities to sell industrial land provides a partial administrative solution to address-ing urban redevelopment challenges. How-ever, the policy does not yet entail the estab-lishment of an integrated open market for urban construction land. , in which collective and state land will be treated equally in the urbanization process. A real breakthrough in the market integration of collective and state land would allow collectives to retain own-ership of collective construction land while being able to lease use rights to urban users and renew leases upon expiration. Current policy allows the city government to take back the land upon the expiration of the first lease period. Despite limited progress, Shen-zhen’s policy change signifies a shift in the thinking of municipal governments that may guide future land market integration. This shift is relevant for many cities where redevel-opment rather than spatial expansion will be the main pattern for change. Many of China’s cities have to contend with extralegal and unregistered development sites and property. Clarifying and legalizing the property rights of peri-urban rural communities provides possibilities for more efficient redevelop-ment, equitable benefit sharing and inclusion, growth in household incomes, and reform of the municipal finance system away from con-cessions revenues and toward taxation.
Chengdu municipality: Land reform and urban-rural integration11
In 2003, Chengdu municipality started implementing a “Three Concentrations” development strategy, which promoted the concentration of industries in designated industrial zones, the consolidation of rural land to promote large-scale production in agriculture, and the resettlement of farmers

C h i n a ’ s U r b a n i z a t i o n a n d l a n d : a f r a m e w o r k f o r r e f o r m 303
in rural towns. Chengdu is the largest pro-vincial capital in western China and a grow-ing metropolis with a population of 14 mil-lion people, including an estimated 1 million migrants and 5 million registered rural resi-dents in 2010. By 2007, the problems associ-ated with the collective land ownership sys-tem had become evident. The existing system could no longer ensure the efficient allocation of land resources or the protection of farm-ers’ interests in the urbanization process. In response, Chengdu began to implement a rural-urban integration reform pilot in mid-2007 to reduce rural-urban disparities. Among other aspects, the pilot promoted the titling of all rural land and assets.
Chengdu’s Three Concentrations strategy involved the resettlement of a large number of rural residents, the construction of new houses, and the reclamation of old village sites. The relocation of people and assets also raised complex questions about farmer com-pensation and long-term economic interests and benefits. To implement an acceptable resettlement program, Chengdu needed a clear and comprehensive picture of the his-torical and current status of property rights to land and buildings. Particularly important was to prevent infringements on property rights by collective entities, individuals, or the government itself, in light of significant and fast appreciation of land values. In 2008, the Chengdu municipal government com-menced the property rights reform and the titling program in rural areas by issuing Doc-ument No. 1 of 2008, Provisional Opinion on Strengthening Protection for Arable Land and Further Reforming and Improving the Property Right System of Rural Land and Buildings. The program was completed in 2010, with issuance of 33,400 certificates of collective land ownership, 1.5 million certifi-cates of use rights to collectively owned land, and 1.8 million certificates for contracted land management rights. The strategy made significant investments in developing a uni-fied registration system for all arable, forest, and rural homestead land. The titling pro-gram was implemented under the authority of administrative villages. Village councils were give the decision power over surveys
and measurement of land plots for titling and over land adjustments prior to land titling. In some villages, the designation “long term without change” was included in the formal contract of the land management right, indi-cating that land management rights are con-tracted for an indefinite (renewable) period.
The titling program included an assess-ment of all collective construction land in each administrative village within the munic-ipal area based on the Second National Land Survey. Titles to land use rights were issued for the rural homestead land of farmers. Titles to homesteads were given on actually occupied land, although household plot size frequently exceeded the legal standard and the area documented on past certificates. This practice, in combination with close consultation within the village, helped to minimize disputes over homestead land. Use rights to other collectively owned construc-tion land, such as rural enterprises, public interest, and land for other purposes, were documented as well.
With regard to farmland, inconsistencies in the particulars of farmland plots, includ-ing the actual user, information on record with the village authorities, and migration, posed significant challenges to the titling of farmland. Land use is often adjusted, but these adjustments are rarely updated on land use certificates and contracts, and the written records do not represent actual rural land use. An approach based on “land titling on actual land use” was therefore implemented. Every parcel within the village was remeasured and recorded under the name of the actual user. Adjusted management contracts were issued for all farmland and included information on location, size, and land management and use rights holders. The land titling approach also supported a new form of village self-admin-istration and governance. An elected village council assumed responsibility for reviewing the results of the property survey, mediated disputes over land use rights, and supervised readjustments to contracted land. Village councils were also responsible for publicly disclosing the results of the land titling plan prior to submission for county government approval.

304 U r b a n C h i n a
Chengdu has now put in place a rural land–titling approach that is based on rela-tively clear operational principles and pro-cedures. It includes village mobilization, surveys and on-site measurement, public dis-closure, and statutory publication and title issuing. Land readjustments have become significantly more difficult, and as a result, a stable property-rights structure in rural areas has evolved. As part of the reform, Chengdu has also established a fund to strengthen pro-tection of farmland. The fund is replenished by the city and county governments through fees from transfers of land use rights and charges on newly developed construction land. The fund is used for covering farmers’ contribution to the old-age pension insurance and provides subsidies for land protection.
Dynamic balance approach and construction land swaps
In 2004, the Ministry of Land and Resources issued a new Construction Land Offset Policy to provide implementation guidance to the “dynamic balance” provisions of the Land Management Law. These provisions stipulate that any parcel of arable land converted to urban use needs to be offset by newly gener-ated arable land of the same quality and area. The offset policy aims to address the long-term supply of urban construction land by getting local governments to reclaim under-utilized rural construction land and convert it to arable land, thereby creating additional urban construction land conversion quota. The policy has stimulated rural land con-solidation on a much larger scale than in the past. By late 2011, Chengdu had imple-mented nearly 400 land consolidation proj-ects, thereby reclaiming 28,000 hectares of rural construction land and relocating about 900,000 rural residents into 1,400 newly constructed rural settlements. Infrastructure investments associated with the projects had exceeded RMB 20 billion by 2010.
Chengdu has applied the offset policy to allow swaps of reclaimed rural land and the construction land quotas across the munici-pality. Newly generated construction land is sold through public tendering. Income
from land sales is used to compensate farm-ers whose land is taken by the government for urban construction use as well as farm-ers whose residential land is being reclaimed to create the offset quota. The swaps allow urban construction land to be made avail-able in areas where demand and land prices are high. Detailed research results are not yet available, but the model is expected to have facilitated the transfer of capital from urban to rural areas; promoted new rural settlements with better public facilities and services; and led to better compensation and resettlement arrangements for affected farmers. Economic efficiency gains in land allocation and agglomeration effects are expected as land is sold where demand and prices are high.
Reports of government misuse in the form of forced property demolition and involun-tary resettlement in some rural localities illustrate the risks inherent in this approach. Infringements of the rights and interests of farmers ran counter to the objective of inte-grated and coordinated rural and urban development, and farmers remain vulner-able in terms of protection of their land and property rights. Local governments or other entities with administrative power are some-times dominating land transfers and land swaps. The approach also does not address the rural-urban disparity, because rural and urban communities remain segregated by separate registration. Such segregation might even be reinforced through the concentration of the rural population in exclusively rural settlements. Social impacts and risks involved in the concentration of the rural popula-tion in new settlements have not been well researched to date.
The Chengdu Rural Property Rights Exchange, established in 2008, serves as a platform for transactions of rural property rights, including transactions of contracted management rights to farmland, use rights to collective construction land, rights to forest-land, property rights of rural residences, and agricultural intellectual property rights. The exchange also allows transactions involving construction land quotas, making such quo-tas transferable objects. To some extent the

C h i n a ’ s U r b a n i z a t i o n a n d l a n d : a f r a m e w o r k f o r r e f o r m 305
establishment of the exchange responded to farmers’ increased awareness of their prop-erty rights (confirmed through land titling) and to their demand for more equal sharing of the appreciating urban land values result-ing from consolidation and offset policy projects.
The exchange aims to improve the land transaction system to become more mar-ket oriented and transparent. Governments are no longer exclusively involved in match-ing buyers with sellers of land use rights and quotas. Instead, farmers and collec-tives have gradually become involved in the implementation of offset policy projects and are allowed to auction construction land quotas through competitive bidding. As the autonomy of the collectives and farmers has increased, the government’s role has shifted to that of supervisor and service provider with responsibility for acceptance checks, quality supervision, and dispute settlement. Beginning in late 2010, the first rural com-munities started to implement consolidation and offset policy–related projects.
Market-based practices for transferring collectively owned construction land for urban business purposes have also entered a pilot stage. In 2008, Jingjiang District listed the use rights to two parcels of collectively owned construction land for public bidding by applying the procedures for land use rights transfers that are applicable to state-owned land. Several villages entrusted the develop-ment and management rights of the collec-tive construction land to a platform company under the district government. The company consolidated the land, carried out primary land development, and listed the land for pub-lic bidding. Two private enterprises obtained use rights to the collective construction land at a selling price of RMB 800,000 per mu (1/15 of a hectare) for a term of 40 years. The platform company issued certificates of use rights to collective construction land. The company received the payment for the land on behalf of the collectives, deducted prede-velopment and other costs, and distributed the remaining income to the collective enti-ties for redistribution among the collectives and villagers. In 2010, the exchange listed the
use rights to a parcel of collective construc-tion land of 34 mu for public bidding, the first-ever case of farmers initiating a transfer of use rights to collective construction land. The final transfer price was RMB 442,000 per mu. Total income received by the farmers was RMB 13 million, an amount far exceed-ing the possible benefits through the offset policy. Many similar cases followed.
The significance of Chengdu’s land reform pilot is reflected in its comprehen-sive approach to property rights protec-tion, rural land titling, and asset verifica-tion. These steps are critical in advancing the protection of rural property rights and, even more important, promoting the mar-ketability of farmers’ rural land use rights. The rural property rights reform pilot in Chengdu therefore offers valuable lessons for gradually advancing a nationwide rural land titling program but also points to the enormous challenges of getting the reforms right. The central government has long been contemplating the reform of the rural prop-erty rights system and the nationwide rural land titling program, but progress has been slow, and practical approaches have yet to be defined. Rural land titling, asset verification, and the confirmation of rural property rights will require considerable investment. Govern-ment support is essential to develop a rural property rights system; the role of the market will remain limited for the foreseeable future. In addition, Chengdu’s arable land protec-tion fund provides a model for generating the financial support for land titling but also for simultaneously advancing the rural social security system. Chengdu has also shown the feasibility of a unified registration system for all types of rural property.
In the course of urbanization, land resources will undergo continued drastic changes in the form of a reallocation of rural land to urban areas. The offset policy for arable land works well as an administratively managed control mechanism of land conver-sion that ensures, at least in theory, that total arable land neither decreases nor degrades. At the same time it allows usage swaps between lands of different value and location. The offset policy has succeeded so far because it

306 U r b a n C h i n a
exercises land use and land conversion con-trol while creating more flexibility for better spatial planning.
The Chengdu land system reform pilot has demonstrated ways to increase farmers’ income from land transactions. The transfer of farmland through leasing has left farm-ers’ land ownership unchanged and helped to increase land-related profits. In the case of collective construction land, the transfer through direct transaction rather than com-pulsory expropriation has increased collec-tive profits by up to 10 times profits from compensation. In the case of the construction land quota, the change from government-led transactions to transactions between private entities or public bidding more than doubled the average price of such quotas.
Chengdu’s pilot is also an important step in moving beyond the narrow, traditional focus on rural land management contracts between collective entities and farmers. The pilot opens up new opportunities to increase rural income by transferring rural land rights and assets. Such rights were defined for urban areas many years ago. Closing the legal and regulatory gaps between urban and rural land rights transfers is an important step toward allowing a more equal sharing of the benefits of urbanization through the flow and transfer of production land.
Chengdu’s land system reform offers an alternative approach to the current land expropriation system that may have poten-tially far-reaching consequences. Because the land-conversion quota system allows collec-tively owned construction land to be sold in the urban land market, where demand and prices are high, economic efficiency gains seem possible. In the process, rural income may increase while disputes over expropria-tion potentially decline. Further regulation also is needed to govern the private transfer of nonagricultural land between farmers.
A balance needs to be found between gov-ernment intervention and village autonomy. Land readjustments, coordination, and arbi-tration should be the responsibility of the village authorities. Governance mechanisms and transparency at the village level therefore need to be strengthened. At the same time,
the government should safeguard equitable and authoritative land titling and also assume responsibility to oversee and monitor the pro-cess of land titling.
A significant challenge will be to reform the current regulatory framework to give the transfer of collectively owned land, in particular collectively owned construction land, a sound legal basis. Current laws do not allow for such transfers, and if transactions occur, parties find themselves without legal protection. Also, collateralization of collec-tive land remains illegal. Chengdu allowed mortgaging as part of its pilot and estab-lished a trial venture capital fund financed by fiscal resources to cover any mortgage losses. Given such security, some local banks issued loans backed by collectively owned land on a pilot basis. However, because collective land is unable to play a financing role under cur-rent national law, demand for land transfers remained suppressed. These and other issues undercut the incentives for legitimate land and property transfers and indirectly lead to illegal and informal transfers.
Government-led land expropriation remains an integral part of projects under the offset quota policy. Although the pilot areas showed some signs of reduced land expro-priation and increased market-based prac-tices, the overall scale of land expropriation has not decreased nor has the scale of gov-ernment land management. In practice, con-struction land quotas generated by demolish-ing rural residences followed by subsequent resettling can be used for urban construction projects only when such quotas are assigned to a specific location in the planned construc-tion area. However, the planned construction areas will still undergo a land expropria-tion process. More land expropriation will increase demands for land quotas, which in turn will generate capital to finance rural land consolidation. The continued demand for compulsory expropriation of rural land at low prices will therefore run counter to the integrated urban-rural development approach.
The Chengdu pilot experiences, along with other local reform pilots, will remain relevant only if the quantity of transfers
C h i n a ’ s U r b a n i z a t i o n a n d l a n d : a f r a m e w o r k f o r r e f o r m 307
increases and the transfer mechanism is sup-ported by a comprehensive national legal and institutional framework. If legal reform does not follow, Chengdu’s pilot reform will remain a limited experiment, and solutions to the more fundamental issues in China’s regu-latory framework will be postponed into the future. Under China’s government-led eco-nomic development model, local governments continue to have strong incentives to manage land, despite their involvement in the reform experiment. The underdeveloped property tax system means that the sources of govern-ment income are limited, and therefore no incentives will be made available to reform the land-based local finance system. In fact, the recent macrolevel control measures have further slowed down the land system reform. In response to the global financial crisis, the central government launched a large number of state-invested projects to boost domes-tic consumption, thereby accelerating land expropriation. Without reform, urbanization will continue to advance along the course of wholesale expropriation with land-sourced fiscal revenues and land-based finance.
Specific recommendations on land system reform based on Chengdu’s pilot experiences
China’s Land Management Law should be amended to restrict land expropriation by the state to purposes furthering public interest. It should also accord equal rights to land for commercial purposes through an integrated urban-rural market of state-owned and collectively owned land. Land to be used for public interest purposes can be obtained through expropriation, provided that strict procedures are enforced and com-pensation is paid based on market prices. All land resources for purposes other than public interest should be allocated through an inte-grated urban-rural market following market principles. With the mechanism in place to control land use, governments should con-firm and recognize the rights to use, transfer, lease, and mortgage collectively owned land. Farmers should be given the right to transfer their land for building houses, both to ensure that they receive incomes from transferring
or leasing their houses in accordance with the law and to improve the living conditions of urban residents.
A nationwide cadastral survey should be carried out to support the measurement, defi-nition, registration, and titling of property rights for all types of land. Policies govern-ing compensation for protecting arable land should be developed and budgeted. Supervi-sion of land titling procedures and relevant acceptance checks should be enhanced with the aim to title land based on current actual use. As a follow-up to the completion of reg-istration of collectively owned land, govern-ment agencies should make land titling, cer-tificate issuance, and other related work part of their standard services.
Land use control mechanisms should con-trol overall quantity and quality and allow flexibility in spatial planning of land. Land quota exchanges between different localities should be allowed to both accelerate urban-ization in economically better-developed areas with higher population densities and strengthen arable land protection in areas with relatively low land prices. In implement-ing projects involving land transfers and con-centrations of rural residences, diversified resettlement arrangements should be made available to meet the different needs and demands of farmers. Centralized planning should help lower the costs of supervision over the reclamation of collectively owned rural construction land.
The scale of land expropriation should be reduced, and the current land-based finance model should be reformed. Given local gov-ernments’ high level of dependence on land-sourced fiscal revenue, alternative long-term fiscal revenue sources should be developed to replace the cycle of land expropriation to land conversion to revenue generation with a comprehensive property tax system. In the short term, a dual-track system can be put in place for a transitional period. Dur-ing the transition, the applicable tax and fee systems for state-owned land could remain unchanged, but certificates of use rights to collectively owned construction land could be issued to allow such land to be transferred and developed for urban commercial pur-

308 U r b a n C h i n a
poses. Property taxes should then be levied on such transfers and on the properties.
Chongqing municipality: Balancing rural and urban land supply12
Chongqing municipality features urban and rural areas with wide disparities in income and living standards. Large numbers of migrants originate from its rural areas. In 2007, 3.5 million migrants resided in urban Chongqing, and an additional 4 million migrants worked in other provinces. From 1997 to 2006, migration drove an increase in Chongqing’s urbanization rate, from 31 percent to 48 percent. With urban devel-opment, demand for urban construction land increased significantly. But unexpect-edly, construction land in rural areas also increased, despite a decrease in the rural population. Rural-to-urban migration did not provide exiting farmers with the incen-tive or the mechanism to effectively dispose of and benefit from their rural construction and residential land rights in the urbaniza-tion process. As migrants found settling in the cities difficult, they continued to invest in larger rural homesteads, which resulted in underutilized rural settlements and inefficient use of rural land.
Chongqing’s rural-urban integration model and land securities system
Chongqing redesigned its land management system to match the conditions of urbaniza-tion and migration and to better use its large stock of fragmented rural construction land. Chongqing needed to devise a system that allowed for the voluntary and permanent exit of migrating farmers from rural areas while protecting their land and property rights, and that promoted the integration of rural land into the urban land market, including more efficient land allocation and land use plan-ning and control, fair benefit sharing, and farmland protection. In 2007, the central government selected Chongqing to pilot a new rural-urban integration model. As part of the reform pilot, Chongqing established a Rural Land Exchange to experiment with the market-based integrated allocation of con-
struction land across urban and rural areas, transparent land use transfers, and new ways of capturing land value for migrating farm-ers. Specifically, the Chongqing pilot links urban land supply to a simultaneous, deliber-ate reduction of rural construction land and allows for more efficient allocation of con-struction land across rural and urban areas in the entire jurisdiction of Chongqing.
The Chongqing Rural Land Exchange is a market for integrated trading of urban and rural construction land rights. To foster the transfer of rural construction land rights to urban areas, Chongqing created land securi-ties, which are tradable land development and construction rights. In contrast to the gov-ernment’s quotas for rural land conversion, which are issued annually and are limited in number and scale, land securities can be created flexibly by various land rights hold-ers to supply additional urban land at market prices. Other types of land use rights, such as for arable land, forestland, collectively owned construction land, and equity shares of rural land, can also be traded or exchanged; how-ever, the Rural Land Exchange is the only trading place for the rural land securities.
Land securities quotas are created through reclamation of rural construction land out-side the urban development plan. Holders of rural land use rights can convert rural collective construction land into arable land rights anywhere in Chongqing. Reclamation is allowed for rural homestead land, land used by township enterprises, and land for rural public service facilities. Upon approval from the collective, reclamation can proceed in accordance with local procedures. Local authorities confirm the reduction in the rural construction land quota and the increase in arable land and farmland quotas. House-holds that apply for the conversion of their homestead land must prove that they have a legitimate permanent place of settlement else-where. Reclaimed rural land can be turned into a land security certificate, but rural con-struction land already located in the urban planning zone cannot be reclaimed and transformed into a security certificate.
Land security certificates can be traded at the exchange. Various stakeholders involved in urban development may bid for the cer-

C h i n a ’ s U r b a n i z a t i o n a n d l a n d : a f r a m e w o r k f o r r e f o r m 309
tificates. Trading is open, transparent, legal, fee based, and voluntary. Once the bidding process is completed and land security quotas are awarded, the Chongqing Land and Hous-ing Administration issues a land securities certificate to the winning bidder, which pro-vides the right to acquire a certain quota of urban construction land in the urban devel-opment zone. The holder of the certificate can choose land earmarked for development within the urban-rural development area and urban master plan area. Local governments are responsible for processing the application for urban construction land, for carrying out land expropriation and conversion pro-cedures in the designated urban development area, and for supplying the land rights to the user. Land used for profit purposes, such as industrial and commercial land, is usually supplied through competition, such as tender, auction, and public listing.
The land securities system provides a mechanism for rural collectives and individ-ual rural households to use rural construction land more intensively and to set aside excess construction land for reclamation, security trading, and transfer. Each land security cer-tificate contains a quota for both reclaimed construction land and newly generated arable land. Holding a security obliges the holder to supply arable land (through reclamation) and provides a tradable right to construction land in the urban construction zone. On obtain-ing a land security certificate, the holder gains the right to convert farmland to con-struction land in the designated urban-rural planning zone. Land securities can be used for construction throughout the municipal-ity as defined in the urban-rural development plans. Each security certificate can be used only once. They are not tied to any specific block of land. The value of the security is not dependent on where it was generated origi-nally, although construction land in more remote areas with poorer infrastructure gen-erally has lower land value.
After seven years of experimentation fol-lowing the initiation of the pilot in 2007, Chongqing’s land securities system has pro-gressively matured. Farmers’ land rights are better protected, market operations in land trading have improved, and property rights
are more clearly defined. The system features voluntary reclamation, open trading, gains for the farmers, direct cash payment, and governance based on more clearly defined rules. The land securities model has become an effective means for farmer households to cash in on their homestead land and provides a workable approach to satisfy the demand for land in Chongqing’s urbanization pro-cess. According to Chongqing’s master plan, during 2013 to 2020, the municipality will require an additional 700 square kilometers of urban land. Only 300 square kilometers will come from the government-issued land conversion quota. Reclamation of rural con-struction land and land securities trading will be critically important to generate sufficient land supplies to meet actual demand.
To provide the institutional foundation for the land securities system, Chongqing began to expand the systematic registration and issuance of titles to rural land and rural resi-dential property in 2010. The titling program covered the registration and certification of collective land ownership; land use rights to collective land, including homestead land and rural construction land; and farmers’ residen-tial farm properties. Chongqing also created a specialized agency to oversee the rural land consolidation program and set forth trans-parent principles and procedures for the rec-lamation, inspection, trading, and use of land securities.
Farmers or collectives can apply to the authorities to reclaim construction land and obtain rural land security quotas to engage in land trading. The government does not encourage or compel farmers to reclaim land against their will but acts primarily as a service and information provider. Farm-ers can choose to implement the reclamation individually or as a group or to recruit land consolidation agencies to help ensure that appropriate engineering codes and quality requirements are met.
Land transactions are managed centrally by the exchange, and the price for land secu-rities is determined by the market. Informa-tion is made public on the website of the Chongqing Land and Housing Administra-tion. Public notices are also displayed in townships and villages regarding land that

310 U r b a n C h i n a
has been reclaimed and is intended for trad-ing. Furthermore, the various stakeholders can select land based on their preferences. Other issues related to land expropriation, such as land hoarding and underutilization, are expected to be reduced, because prices for land securities better reflect the opportunity cost of delayed development. The distribu-tion of proceeds from land sales reflects the property rights structure in rural areas. The proceeds from land securities trading are dis-tributed between farmers (use rights holders) and collectives (land owners) at a ratio of 85 to 15. This ratio reflects the understanding that homestead land and farmhouses are the private property of the farmers, whereas the collective retains only a small stake in the land as formal landowner. Land securities have been trading at RMB 178,000 per mu on average, providing a net revenue for farm-ers of at least RMB 120,000 after deduction of reclamation costs and various fees.
Specific recommendations on land system reform based on Chongqing’s reform experience
Land securities have been demonstrated to be an effective tool in land administration, in particular for land use control. Land secu-rities provide effective protection and supple-ment arable land amid rapid urbanization. The economic leverage created by land secu-rities has reversed the trend of simultaneous urban and rural construction land expan-sion. Rural construction land is gradually diminishing as the rural population declines. Many rural settlements are being gradually consolidated and are likely to have more effi-cient delivery of public services and environ-mental improvements. With the introduction of land securities, the amount of arable land has stabilized and is increasing. The land securities model also has positively affected the quality of arable land because reclaimed construction land is generally returned to arable land. By mid-2013, land securities covering about 7,600 hectares of construc-tion land had been traded in Chongqing, cor-responding to an increase of 6,800 hectares in arable land.
Land securities directly increase farmers’ property-based income and generate benefits
from urbanization. The possibility of trad-ing rural construction land has significantly increased the value of rural properties and land. Land sales profits are in the range of RMB 120,000 to RMB 150,000 per mu, an amount substantially higher than previous sales of homestead rights within the confines of the collective. Furthermore, farmers enjoy full property rights to the newly reclaimed arable land, which can be rented out. Land securities trading has had an impact on poorer areas in particular, with about 70 percent of all land securities generated origi-nating from the less developed northeast and southeast areas of Chongqing. Land securi-ties are an integral part of the urban-rural reforms. In 2010, Chongqing also initiated a reform of the household registration sys-tem by linking rural land management and disposal of land offered by the land securi-ties model to the conversion of rural land to urban hukou. By July 2013, 85,000 house-holds had vacated their homestead land and obtained an urban hukou.
The land securities system has helped to mobilize rural financial assets and improved access to finance in rural areas. Under cur-rent national law, urban land can be collat-eralized, but rural homestead land cannot. Urban land and homes can be traded freely, whereas the trading of rural construction land, especially homestead land and farm-houses, is allowed only within the boundaries of the rural collective, generally resulting in property prices below the reasonable replace-ment cost for farmhouses or buildings. Land securities trading has increased rural prop-erty values about 10-fold (from previously estimated RMB 10,000 per farmhouse to more than RMB 100,000). Furthermore, the pilot reform has allowed financial institutions to expand access to finance into rural areas because rural assets have increased in value and can be used as collateral under the pilot. More than RMB 8.3 billion is estimated to have been provided as rural asset-backed loans during the current pilot period.
Chongqing’s pilot reform has exposed a number of shortcomings in China’s current legal and regulatory framework for land that need to be addressed through legislative reform at the national level. China’s rural

C h i n a ’ s U r b a n i z a t i o n a n d l a n d : a f r a m e w o r k f o r r e f o r m 311
property rights reform will take time, and the distinction between rural land use rights and ownership remains ambiguous. Chongqing’s model of benefit sharing between land use rights holders and owners can be interpreted as a prelude to further reform of rural prop-erty rights and a transition to stronger pri-vate property. China’s legislation concerning the protection of farmer’s land rights, how-ever, remains incomplete. Although the cen-tral government has placed great importance on protecting farmers’ land-related rights in numerous policy documents, the current laws do not yet adequately recognize farm-ers’ rights and do not offer sufficient pro-tection of property. No consensus has been found among lawmakers and policy makers with regard to the direction the revision of the Land Administration Law should take. Workable rules are still lacking regarding the use of collectively owned construction land for nonagricultural purposes, the right to use and benefit from rural homestead land, the respective roles of rural households and collective economic entities in land transfers, the expropriation of collectively owned land and its conversion into state-owned land, and compensation for expropriation. A long-awaited law on the administration of rural homestead land has not yet come into being.
Despite a clarification of the role of rural collective economic entities in relevant laws, questions of membership in collective eco-nomic organizations, their role in the market, collective ownership rights, and collective democratic decision making remain ambigu-ous and unclear. Administrative collective authorities still dominate decision making within such collective economic entities, and participation of and consultation with all members remain limited. Membership crite-ria for rural collective economic entities are not defined in any law, regulation, or judicial interpretation.
China has no unified rural land registra-tion system. Although use rights to farmland, forestland, and homesteads have been con-firmed and registered, these have been done separately by various authorities without a unified set of procedures or technical speci-fications. The lack of accurate surveys causes confusion and disputes of land parcels and
use rights, making the scaling up of success-ful pilot experiences difficult.
Despite government’s recognition of land rights to farmland and homestead land, the transfer of rural homesteads remains con-fined within the collective under current law. This constraint poses a bottleneck to asset mobilization, restricts collateralization, and encourages the prevalence of vacant or deserted homestead land. Little policy and regulatory guidance addresses the develop-ment of the rural land market. The Third Plenary Session of the 17th CPC Central Committee envisioned the establishment of a harmonized construction land market between urban and rural areas. But the limi-tations associated with rural planning and value appraisal have limited the progress toward that objective. Finally, effective gov-ernance mechanisms at the grassroots level remain underdeveloped. The protection of farmers’ rights depends to a large extent on local governance and control. But because of migration, limited knowledge of policy and regulations, and lack of participation and grassroots governance, farmers usually have little influence on rural land administration. In particular, in land expropriation and land securities trading, rural collectives have seen a rapid increase in their asset pool. An inclu-sive, transparent, and well-governed decision-making process could maximize the protec-tion of farmers’ rights and interests.
Revision and modernization of the Land Management Law, Property Law, and Regu-lations on Land Expropriation and Requisi-tion are needed. For provisions that are not yet fully compatible with the need to protect farmers’ rights and interests, immediate revi-sions are needed. Encoding and institutional-izing proven best practices from various local experiences in higher-level laws is recom-mended in the near to medium term, includ-ing those demonstrating rural land reform, land market development, and rural land asset distribution and management. Also needed are new and clear definitions and interpretation of the right to become a mem-ber of the rural collective economic entity.
A revision of the Law on the Organiza-tion of the Village Council or, alternatively, the formulation of a law on collective assets

312 U r b a n C h i n a
could be considered. As collectives see their land asset value materialize, their asset pool will grow rapidly. Asset management and profit distribution are increasingly urgent topics. The economic mandate of collectives could be defined in the Law on the Organi-zation of the Village Council. Alternatively, a law on collective assets may be formulated with reference to the Law on State-Owned Assets Held by Companies. The laws should clarify that the party to exercise the collective ownership right is the rural collective eco-nomic entity on behalf of its member own-ers. Its corresponding rights and obligations, and the management procedures and norms, should be clarified as well.
Homestead land rights and their manage-ment, including the right to profit, require further clarification in the Land Manage-ment Law. Buildings and yards should all be included in the concept of homestead land rights and be subject to approval and registra-tion as a whole. The right to profit on farmers’ homestead land should be clarified, allowing farmers to use their housing for profit without compromising their living conditions. When homestead land is allowed to be traded in the market, farmers should be able to receive the proceeds, and when they vacate homestead land, they should be compensated. It may be advisable to remove the provisions in the Regulations on Confirming Land Ownership Rights and Land Use Rights that stipulate that, on homestead land that has remained vacant or on which housing has ceased to exist for more than two years, the rural col-lective in the area of the homestead land may apply to the county-level people’s government and, with its approval, retract the land use right on the homestead land. For homestead land obtained by the farmer household based on the “one home for one household” prin-ciple, such homestead land should have its property right recognized and protected. At the same time, new administrative measures on rural homestead land should be promul-gated as soon as possible to provide the legal framework for homestead land management.
To advance the trading of rural collective–owned land for construction, land securities were created as a flexible alternative to land-
holders’ cashing out on the property right to rural construction land. These mechanisms have allowed the municipality to discover the market value of rural construction land out-side the rural construction planning area. For legally obtained, collectively owned for-profit construction land, the recommended reform would include transfer, leasing, and collater-alization under the current land market man-agement system.
Beijing: redevelopment of urban fringes13
Beijing’s urban villages emerged in the 1990s when industry and service sectors began to attract large numbers of migrant workers who sought affordable housing in the rural areas surrounding Beijing. Today, Beijing municipality has an estimated 1,700 urban villages that house 3.7 million local residents and an additional 3.5 million to 4.0 million migrants, accounting for more than half of Beijing’s total migrant population. Beijing’s urban villages stretch over 700 square kilo-meters within the fifth ring road. About two-thirds of the urban villages are located within the eight urban districts of Beijing proper, and the remainder are situated in nearby rural areas that are targeted for gradual inte-gration into Beijing’s urban area. In many places, rural migrants outnumber the native residents by a wide margin.
Since 2010, the Beijing municipal govern-ment has been implementing a comprehen-sive redevelopment and rural-urban integra-tion program in 50 selected pilot villages to address issues associated with urban villages. The program aims to rationalize urban plan-ning, address informal development within and around the city, and explore ways of integrating local rural residents into the urbanization process while protecting their property rights. Key reform elements include collective property reforms, integration of rural-urban construction land markets, and integration of the rural-urban social secu-rity systems. The redevelopment program is also integrated into Beijing’s urban develop-ment master plan framework and involves upgrading residential housing in situ and

C h i n a ’ s U r b a n i z a t i o n a n d l a n d : a f r a m e w o r k f o r r e f o r m 313
integrating redeveloped areas into the urban public infrastructure and services networks. The program, however, does not target the migrant population, nor does it address issues related to migrants in peri-urban areas. The 50 pilot villages are located between Bei-jing’s third and sixth ring road in the districts of Chaoyang, Haidian, Fengtai, Shijingshan, Fangshan, Shunyi, Daxing, Tongzhou, and Changping. As of 2013, many pilot villages had completed the demolition of old villages, including formerly illegal and informal devel-opments, and begun to move former residents back into upgraded residential housing. Con-version of local residents to urban status was also completed in most of the villages, along with the reform of rural collective property arrangements.
Rural collective property rights and urbanization
At the core of the redevelopment program are land and property issues. Beijing’s pilot approach to peri-urban development departs from the conventional approach of govern-ment-led expropriation and conversion of rural land for urban development projects. The government limits expropriation, con-version, and sale of rural land to just the amount needed to generate sufficient rev-enue to finance the redevelopment program. The new approach allows rural residents in peri-urban areas to finance their transition to urban citizenship through capitalizing on their own rural assets in various ways. Decisions on how much land needs to be converted are based on an estimation of the total redevelopment cost, including the cost of demolishing old residential areas and con-structing resettlement units, compensation payments, and costs associated with hukou conversion and access to the urban social security system. Residents are generally com-pensated with new housing for the demolition of previous residential property. The physical redevelopment allows for higher land use effi-ciencies in urban villages because residential areas are being modernized, concentrated, and integrated into the urban infrastructure networks. The transition from rural commu-nity organization to urban community man-
agement also requires developing regulations and procedures for electing village commit-tees and clarifying conditions and procedures for establishing community residents com-mittees and for managing public facilities and community services in the redeveloped areas.
The inclusion of the pilot villages in the urban development master plan requires adjusting and optimizing the urban planning process. Planning needs to consider the spe-cific conditions of rural areas that previously had been left to informal urbanization and development while traditional urban plan-ning focused narrowly on urban development projects on government-requisitioned rural land. The urban master planning process now needs to consider the extent of construc-tion land required for upgrading residential units for resettling local residents and the associated public infrastructure, including green spaces, transport infrastructure, utili-ties, schools, and health care facilities. Provi-sions need to be made for setting aside land for industrial and commercial purposes to provide resources for economic development of the remaining collective organizations. In the 50 pilot villages, new planning standards included 50 square meters of floor space per person for new residential units and 50 square meters of floor space per person for industrial or commercial development. In pilot villages where rural construction land was still abun-dant, land resources were divided into reserve land (planned for conversion and sale for rev-enue generation), land for public infrastruc-ture development, and land for future eco-nomic use by rural collective organizations. In villages with insufficient construction land stocks, the planning process needed to go beyond individual villages, to pool remaining construction land resources, and to integrate the redevelopment program across several villages or even townships.
Collectively owned construction land, which is not expropriated in the redevelop-ment process, remains with the collective organization for industrial or commercial urban investment and development. A second characteristic of Beijing’s pilot that departs from common practice across China is that rural residents no longer have to forgo their

314 U r b a n C h i n a
ownership rights to rural assets as they become urban residents. Instead, they retain their status as members of collective organi-zations and their property rights to collective land and other collective assets. When fur-ther expropriation is needed, compensation payments are shared by the members of the collective business organization, thus also benefiting those with urban hukou.
The reform of the rural collective prop-erty system toward collective sharehold-ing arrangements is an important aspect of peri-urban development and rural-urban integration. As rural residents become urban residents and peri-urban areas are integrated into the city proper, traditional rural collec-tive ownership arrangements are no longer relevant. Whereas in rural agricultural areas land-related reforms focus on confirmation and registration of farmland rights, farmland transfers and rural land market development, and agricultural sector modernization, in peri-urban areas, such issues are no longer relevant because collectives have lost their farmland resources and retain only some construction land resources and other prop-erty assets. Instead, cooperative shareholding arrangements for collective economic assets provide the opportunity not only to retain the collective ownership system in urban areas but also to make collective assets por-table in the form of transferable shares, inde-pendent of the residency status of the share-holder. Portability and transferability of rural assets are an important factor in facilitating their integration into the urban society.
In many villages, collective property reform has transformed former rural col-lective administrative entities into collective business organizations that manage collective assets based on shareholding arrangements. Although establishing a standardized valua-tion of collective assets remains challenging, collective property reform has progressed in recent years. The quantification of collective assets, including land, has created significant capital stocks for many collective business organizations. In 2012, collective business organizations in Changping District owned and managed assets with a total value of RMB 37 billion (US$5.7 billion equivalent), jointly owned by 354,000 shareholders. A
total of 278 collective business organizations paid out dividends on shares of RMB 548 million (US$84 million equivalent) or RMB 1,550 per shareholder (World Bank 2013).
Integration of collective construction land into the urban market
Beijing’s urban village program allows rural collective organizations to trade construction land in the urban land market subject to the provisions of the urban master plan. Beijing’s program is a national pilot for constructing rental units on collectively owned construc-tion land (first piloted in Tangjialing, Haid-ian District). Prior to the redevelopment program, many urban villages generated income from leasing informal housing units to migrants or engaging in illegal construc-tion projects. The redevelopment program created the possibility of converting illegal property into legally recognized commercial properties or industrial parks owned by local collective business organizations. Collective organizations can develop construction land by themselves or through leasing to private investors. The government encourages collec-tively managed urban development projects and has reduced administrative restrictions. Public agencies have intensified guidance and services to collectives, including train-ing in project application, public bidding procedures, technical supervision, and finan-cial management. The pilot experiences are encouraging for advancing the integration of the rural-urban construction land market.
Collective organizations are still subject to administrative restrictions and face chal-lenges in accessing finance for development projects despite favorite locations of collec-tive construction land close to urban centers. The urban village redevelopment program involves resettlement and large-scale develop-ment of modern housing for local residents to promote rural-urban integration. Urban vil-lage redevelopment is different from commer-cial real estate development in urban areas but is currently subject to the same restric-tions, such as a limited land conversion quota and government controls to limit the oversup-ply of commercial urban housing. Because of current legal restrictions, collective construc-

C h i n a ’ s U r b a n i z a t i o n a n d l a n d : a f r a m e w o r k f o r r e f o r m 315
tion land cannot yet be fully mortgaged, spe-cifically when land still contains buildings and has not yet been fully reclaimed. To over-come these difficulties, Beijing municipality offers loan securities for collective housing construction projects and provides preferen-tial allocation of construction land quotas to collectives to facilitate urban market entry.
Urban social security
The urban village redevelopment program also provides new avenues to integrate local residents into the urban social security sys-tem. Although conventionally farmers are enrolled in China’s rural social security sys-tem, Beijing has allowed the enrollment of local residents into the urban social security system, which is based on voluntary contri-butions. Enrollment is independent of land and property issues. Whereas under the wide-spread “land for social security” scheme, compensation from land expropriation is being used by local governments to cover farmers’ contribution to the social security system, Beijing’s urban village program does not link compensation payments with enroll-ment in the urban social security system. In reality, because enrollment is based on vol-untary contributions, entry into the urban social security system depends more on the employment and income opportunities of local residents than on compensation.
Specific recommendations on land system reform based on Beijing’s urban village program
The implementation practices and experi-ences of Beijing’s urban village redevelop-ment program provide a new direction for mobilizing rural assets for more inclusive urbanization and rural-urban integration in urban fringe areas. Urban village redevelop-ment explores options for an autonomous and self-governed urbanization process of rural residents based on more market-oriented principles. The program has provided the opportunity for urban villages to undertake resettlement and redevelopment projects for higher land use efficiency and integration into the urban infrastructure network. It has also allowed the integration of the rural construc-
tion land market into the urban land market and empowered the collective to trade or develop construction land for profits.
Restricting the scope of land expropria-tion for financing urban village redevelop-ment needs to be complemented by rural collective property rights reform. Collective ownership of assets can be protected in the urbanization process. Shareholding arrange-ments involving land and assets represent an innovative approach to securing and manag-ing economic assets as rural citizens urban-ize. Collective assets can be monetized, and collective business organizations can accu-mulate significant stocks of collective assets in the course of expropriation or of new zoning for collective industrial or commer-cial development projects and land appre-ciation. A pragmatic choice for maintain-ing and capitalizing on collective ownership is to introduce cooperative shareholding arrangements under transparent democratic management.
Social security enrollment is decoupled from land. Rural residents do not need to forgo their rights to collectively owned land to be eligible for enrollment in the urban social security system. As rural residents find employment that enables them to voluntarily contribute to social security, they are encour-aged to join the urban social security system and bridge the gap between the rural and urban systems. Social security enrollment is clearly separated from land and property issues and does not require liquidating prop-erty for enrollment.
Collectively owned construction land can be integrated into urban development within the framework of urban planning regula-tions. Owners of rural and urban construc-tion land should have equal rights to develop and participate in the market for construction land. Beijing and other cities have allowed urban construction projects to be built on rural collective construction land within the scope of urban planning, although the land is not expropriated.
Financial innovation is needed to allow rural collectives to access financing. Collec-tively managed urban development projects are hampered by restrictions to collateralize collective construction land and access to

316 U r b a n C h i n a
finance, causing many collective construction projects to seek capital investments from pri-vate developers. The lack of formal channels to access finance creates risks for collective property rights and adequate benefit-shar-ing arrangements. Comprehensive reform is needed to address access to finance and pro-tection of collective property in the urbaniza-tion process.
guizhou: Experimenting with land readjustment in Meitan County14
The introduction of the Household Respon-sibility System in 1978 stimulated unprec-edented agricultural growth in rural China. The new system of contracting farmland to individual households also created chal-lenges for rural collectives that needed to bal-ance contractual land use rights with demo-graphic change. Many collectives resorted to land readjustments. Although these adjust-ments accommodated rural population growth, they undermined tenure security, led to smaller and fragmented land holdings, and caused a drop in land investments and productivity.
Meitan’s innovations in land use contracting
In the early 1980s, Meitan, an agricultural county in Guizhou Province, began to imple-ment the Household Responsibility System, and village collectives contracted village farmland to individual households. Experi-encing strong population growth, the county experimented with land readjustments and direct grain subsidies to safeguard the liveli-hood needs of new collective members and to protect equity. From 1983 onward, read-justments became more frequent, negatively affecting the perception of tenure security under the new arrangements. In addition, land became more fragmented. Cultivated land per household decreased from 7.3 mu in 1980 to 5.9 mu in 1987, and average plot size declined from 0.7 mu to 0.6 mu because of readjustments. In some townships, house-holds had up to 15 plots, varying between 0.01 mu to 0.2 mu in size. Investments in land were affected as well. Productivity growth of land dropped from 7.0 percent per year dur-
ing 1979–84 to 3.3 percent per year during 1985–87. Land reallocation also brought an administrative and financial burden to col-lectives because it involved verification of land plots and land quality and discussions to reach consensus on land division and real-location within the village.
In 1987, following the State Council’s endorsement of innovative land policy reforms, Meitan introduced a new policy to address the challenges related to its lim-ited land supply and population changes. Although land was generally allocated based on the number of members within a household and readjusted as household size changed, Meitan decoupled land contract-ing from changes in household size, thereby providing stronger tenure security to house-holds. Land readjustments in response to demographic change were basically elimi-nated, and the Household Responsibility Sys-tem became more stable and sustainable. The pilot involved the following elements: Col-lective land ownership was confirmed to rest with the administrative village and not with townships or natural villages. The village and households entered into land use contracts, guaranteeing that land rights would remain unchanged for several decades. The scope of land rights was clarified as well, including the rights not only to manage and operate the land but also to profit from and transfer (subcontract, transfer, lease, have joint opera-tions, and exchange) the land. As a result of property rights clarification, rural land became a more meaningful and important asset for farmers. The pilot also stipulated that the collective could take back allocated land for distribution through public bidding in the event that a household converted con-tracted farmland to nonagricultural use, left the land unused, or refused to pay agricul-tural taxes or fulfill state grain procurement obligations, or when household members had passed away.
Meitan’s approach, which decouples land contracting from demographic change, rep-resented an important innovation in China’s collective ownership of rural land. Instead of allocating collectively owned land equally among village members through routine readjustment, the new system specified that

C h i n a ’ s U r b a n i z a t i o n a n d l a n d : a f r a m e w o r k f o r r e f o r m 317
only those farmers who had obtained land use rights before 1987 were eligible members of the collective with ownership rights to col-lective land, including the right to contract farmland for a 30-year term. This definition of collective membership excluded all rural residents that entered the village or were born after 1987. These newcomers no longer enjoyed collective membership rights and, more specifically, were no longer eligible to obtain 30-year property rights to land.
When the pilot started, Meitan’s total pop-ulation of 380,000 people was overwhelm-ingly rural. Per capita land resources were 1.3 mu. The total rural labor force in the country was 154,000, of which 30 percent were esti-mated to be surplus labor. Unlike the coastal areas, Meitan had very few employment opportunities in the industry and services sectors. Annual income per capita was RMB 400. From 1987 to 2012, Meitan’s rural pop-ulation grew to 500,000. With land tenure stabilized under the Household Responsibil-ity System and Meitan’s new policy, an esti-mated 25 percent of the population remains outside the local collectives and is ineligible for land contracting from the collective. The fundamental challenge now is to find new ways to address the livelihood needs of these landless village members. Structural adjust-ment within the county, labor migration to the coastal areas, and complementary new policies on rural land transfer have become important for stabilizing the new land tenure arrangements.
Initially, in the early 1990s, the majority of the surplus labor force was absorbed through the reclamation of nonarable hillsides and development of the household-based nonfarm sector. Hillsides were contracted to villagers without farmland resources and transformed into tree crop plantations. The government provided capital and subsidized loans for agricultural investments and encouraged enterprises to provide inputs, technology, and information to households. By 1993, Meitan had developed 155,000 mu of non-arable land resources managed by 15,000 households. An additional 11,000 villagers were employed at township and village enter-prises. As migration to the eastern coastal areas increased, pressure on land resources
declined. In 2011, 47 percent of Meitan’s rural residents were employed in agriculture, while the industrial and services sectors had absorbed 26 percent and 27 percent of the local labor force, respectively. Farmers’ per capita income increased from RMB 343 in 1987 to RMB 5,841 in 2011, while the share of farming income out of total rural income declined as more people engaged in nonfarm activities. About half of the rural income was derived from nonfarm employment.
Despite these structural changes, Mei-tan remained a relatively poor country and faced difficulties in addressing the so-called san nong issues: improving agricultural pro-ductivity, accelerating rural development, and increasing rural incomes. In particular, land transfers and consolidation of farmland remained slow, preventing agricultural effi-ciency and productivity increases through larger-scale farming, as well as increases in farm incomes. In response, Meitan began to promote land transfers to increase voluntary and compensation-based land consolida-tion. Implementation guidance was provided through a plan called Interim Methods for Circulating the Right to Land Contractual Management in Meitan County, which out-lined that individuals, enterprises, and eco-nomic organizations, including those from outside the village, would be allowed to par-ticipate in land transfers; that the government would provide subsidies to farmers who con-tracted more than 50 mu to support a larger scale of operations; and that the government would provide agricultural facilities to the land-leasing parties under special circum-stances. To protect the property interests and rights of the transferor and transferee, the county government also issued detailed regu-lations for land transfers, including reporting, registration, formation disclosure, filing of documents, eligibility requirements to partici-pate in transfers, annual inspection of larger-scale operations, complaint handling and dis-pute resolution, and benefit assessments.
In 2009, Meitan further deepened the local land management system by standard-izing land transfer procedures, managing land transfers based on market principles, encouraging larger-scale land transfers, and strengthening rural land and property rights.

318 U r b a n C h i n a
Meitan carried out baseline surveys of all land across the county and registered and titled all contracted farmland, residential land and buildings, and forestland. In 2010, Meitan issued the final Methods for Circu-lating the Right to Land Contractual Man-agement in Meitan County, which stipulates the principles, methodology, contract format, and management procedures for rural land transfers, thereby providing the regulatory basis for formal land transfers to support larger-scale operations in agriculture.
In 2010, Meitan established its first cen-ters for rural land transfers. These collect and manage information for households inter-ested in land transfers, establish and maintain a land transfer registry, contact enterprises interested in land acquisition, and facilitate exchanges between farmer households and enterprises. By the end of 2011, the total land area transferred to new operators reached 126,000 mu, or 26 percent of the total reg-istered cultivated land area of 480,000 mu. About half of this land was obtained by specialized farming households; 33 percent was circulated to 149 economic cooperation organizations; and 17 percent was circulated to agricultural enterprises. Meitan’s new sys-tem has increased the perception of tenure security, resulted in more rapid land consoli-dation and larger-scale farming, and stimu-lated productive investments in land and input use, resulting in a 42 percent increase in grain output, from 120,000 tons in 1987 to 170,000 tons by 2011.
The experiences from Meitan have gradu-ally been incorporated into central govern-ment policy. From 1993 onward, the policy of decoupling land contracting from demo-graphic change was promoted nationwide, which led to the stipulation of the 30-year contract term for farmland in Central Docu-ment No. 1 of 1997. The 30-year contract term was subsequently embedded in the Rural Land Contracting Law in 2002. In 2008, the Third Plenary of the 17th CPC Central Com-mittee stipulated the central policy of “long term without change,” further enhancing and protecting the property rights to rural land. This policy was further detailed in Central Document No. 1 of 2013 and reiterated by
the Third Plenary Session of the 18th CPC Central Committee in 2013.
Specific recommendations on land system reform based on Meitan’s experiences
From the perspectives of system reform and institutional change, changes in entitlement to land rights, as implemented in Meitan, have profound impacts. They fundamentally alter the rural collective economy and dem-onstrate that institutional change is needed to modernize the agricultural sector and achieve efficiency and productivity increases that can provide incomes competitive with those from off-farm employment. During the implemen-tation of Meitan’s land system experiment, various issues emerged that are of wider rel-evance for national policy formulation and require further careful assessment and con-tinued experimentation.
Clarify collective ownership arrangements. Under collective ownership, the terms owner and user of the land, and their relationship, are ambiguous. The legal status of collec-tive organizations is often not clear under current laws. Uncertainty exists with regard to where the collective authority is located. Disputes often arise between the three levels of rural collectives—townships, adminis-trative villages, and natural villages or vil-lager groups—over collective administrative authority. In reality, many collectives at the administrative village and the natural village or village group levels exist in name only, without legal status or administrative, man-agement, and fiscal capacity. In Meitan, the village collective authority is generally with the administrative village. But experience has shown that collective administration and management are often difficult at the admin-istrative village level because administrative villages cover numerous natural villages, with hundreds of households holding several thousand mu of land. By comparison, natural villages are often much smaller and are more traditionally grown communities with com-mon perceptions and values; thus manage-ment of collective assets is often easier at the natural village level. Further consideration is
C h i n a ’ s U r b a n i z a t i o n a n d l a n d : a f r a m e w o r k f o r r e f o r m 319
therefore needed to determine where collec-tive authority should be located.
Deepen collective ownership reform through strengthened membership rights. Implemen-tation of Meitan’s land system reform has shown that the approach of decoupling land contracting from demographic change can be regarded as part of the foundation of the cen-tral government policy of “long term without change,” but it requires well-developed sup-portive policies in order to be successfully implemented over a long time, especially given limited land resources and pressure from demographic change. Surveys among villages in Meitan have actually found that villagers still view land adjustments as neces-sary during demographic change, which may reflect a deep-rooted sense of community responsibility for the sharing of resources. Despite stronger tenure security, the approach in Meitan has raised concerns about new community members being treated unfairly because they are excluded from access to the village’s land resources. Migration and off-farm employment are more frequent among households that are not eligible to contract collective land. Local surveys clearly show that views differ with regard to whether land rights should be readjusted from time to time and who should be eligible for land allocation.
Deepen rural land market development. The implementation of the approach of decoupling land contracting from demo-graphic change is an important condition for agricultural-sector modernization and structural adjustment. Because employment opportunities in agriculture are decreasing as a result of rising labor costs, land trans-fers provide an opportunity to consolidate farms and achieve larger-scale operations that allow those who remain in agriculture to increase their incomes to levels competi-tive with off-farm employment. Rural farm-land markets are under development; land transfers are mostly informal and based on oral agreements, contract periods are short term, and transfer prices are relatively low. Disputes over land and contracting terms are
frequent. In addition, little information flows between those interested in transferring land and those interested in contracting land. To address these issues and deepen rural land market development, and to capitalize on the structural changes occurring in rural areas, the institutional arrangements, policies, and regulations concerning land transfers need to be developed and implemented.
Integrate migrants into urban areas and social security. In the course of Meitan’s policy innovations, conditions for land-less rural residents have emerged. How-ever, strengthening property rights of those with land has not created social problems, because outmigration has provided alterna-tive income sources of nonfarm employment. To consolidate the stronger property rights arrangements achieved in rural areas, com-plementary reforms are needed to support the permanent integration of rural migrants into the cities. The establishment of a rural social security and pension system is impor-tant for addressing the livelihood problems of rural residents that do not have access to land under Meitan’s approach of decoupling land contracting from demographic change. Deep-ening the social security system is important to address livelihood risks that will emerge as the central rural land policy of “long term without change” further develop.
a framework for land policy reformurbanization and land reform
Land is of central importance to China’s urbanization, economic growth, and social stability. Beginning with the late 1970s, land has been central to China’s early transition to greater market orientation. Decollectiviza-tion and the introduction of the Household Responsibility System beginning in 1978 laid the foundation for rural and agricultural growth and the development of a rural indus-trial and manufacturing sector, which was in the form of township and village enterprises throughout the 1980s. In the 1990s, land became a key resource when further market

320 U r b a n C h i n a
reforms, along with China’s integration into the global economy, provided the foundation for industrial growth and urbanization. Land will remain an essential factor and resource in China’s urbanization process and for its industrial and agricultural modernization agenda.
China’s economic achievement has been accompanied by the gradual development of a legal and policy framework that gov-erns property rights to land. This change has included a transformation of the previ-ously uniform public ownership system into a property regime under which public own-ership of land is maintained. At the same time, use rights to publicly owned land have been largely privatized, either through alloca-tion of land rights to individual households, in the case of rural land, or granting of land rights to entities and individuals, in the case of urban land. Unlike many former planned economies in which reforming the traditional public ownership of land was conducted through privatization, China has focused on strengthening and improving the security of individualized use rights to land while main-taining public (state and collective) owner-ship. This model has helped to maintain social stability and has greatly contributed to economic growth.
Land and property issues have become more complex over the past decades, thus requiring further comprehensive reform and modernization of China’s regulatory and institutional framework for land. The Third Plenary Session of the 18th CPC Central Committee, November 2013, has already provided a broad, forward-looking framework for future reform toward a uni-fied rural-urban construction land market, enhanced and clear property rights and enti-tlements granted to rural land rights hold-ers, and new management systems and insti-tutional arrangements for land in rural and urban areas. In addition, the formulation of the government’s urbanization strategy for the next decade provides an opportunity to build on past achievements and harmonize the existing regulatory and institutional framework for urban and rural land to sup-port more efficient and inclusive economic growth and urbanization.
The reform discussion that follows is based on the directions and guidance given by the Third Plenary Session of the 18th CPC Central Committee on how to advance reforms. The recommendations are based on selected lessons from various institutional innovations piloted in the six provinces and municipalities discussed in in this report.
Definition and protection of land and property rights
Clarify China’s current “long term without change” policy
Farmers’ 30-year farmland rights remain exposed to significant uncertainties because of involuntary transactions for agricultural and nonagricultural purposes and illegal tak-ings, violations of farmers’ rights to land, and uncertainty over whether farmland rights can be extended upon expiration of the current 30-year term. Under China’s 2007 Property Law, farmland rights may be extended when they expire. But this extension provision is weaker than the parallel provision on urban land, which allows the automatic renewal upon expiration of the present term. The different treatment of the length of tenure rights to rural and urban land conflicts with the effort to improve long-term tenure secu-rity in rural areas. Farmers’ rights are also threatened by collective entities that readjust land to accommodate population growth, a practice that is in conflict with central policy. Collectives also often take land back from farmers who move to cities, violating the pro-visions of the Property Law.
The Third Plenary Session of the 17th CPC Central Committee of 2008 stated that rights to farmland should be for “long term without change.” The Third Plenary Session of the 18th CPC Central Committee of 2013 reiterates and confirms the policy direction of strengthening farmers’ property rights to land. Given the central policy support to long-term rights to farmland, the term “long term without change” should be defined and clarified in the law through revisions of the Land Management Law, Property Law, and Rural Land Contracting Law. Contractual rights to farmland could be defined explic-

C h i n a ’ s U r b a n i z a t i o n a n d l a n d : a f r a m e w o r k f o r r e f o r m 321
itly as indefinite property rights with no con-tracting period limitation. Reallocations of farmland through the collective entity should be prohibited, clarifying that those who cur-rently hold contractual rights to farmland will continue to hold them into the future. Legal revision should also clarify the scope of the associated rights, such as the rights to occupy, profit, transfer, and inherit. The laws also need to clarify that collective land own-ership rests with the collective members and not with the collective administrative entities. Embedding these provisions in the law is an important step in harmonizing the treatment of rural and urban land rights and allow-ing rural citizens to enjoy the same property rights and tenure security on land that are accorded to urban citizens. The strengthening of property rights to farmland will also help ensure that local governments uphold these rights and give farmers the possibility to bring cases of land rights violations to the courts. Secure rights to farmland are likely to lead to higher agricultural investment and a greater value creation in the markets for farmland.
Design and implement a unified land registration system
A well-designed and functioning system of land rights registration and documenta-tion tends to strengthen farmers’ confidence about their property, enhances transparency in land transactions, and is likely to stimu-late investment and facilitate land market development. Currently, documentation of rural land rights remains weak. Boundar-ies of individual farmland parcels are often unclear and generally not well documented, making progress toward change problematic, such as enforcing use and contract rights, resolving land-related disputes, and identify-ing those whose land is affected by requisi-tion, lease arrangements, or other actions. In addition, a reliable and complete inventory of land parcels does not yet exist but is needed to provide a foundation for land tenure secu-rity, land use planning, land allocation and conversion, taxation, and monitoring of land market development. After several years of piloting various approaches, Central Docu-ment No. 1 of 2013 now calls for a program
to document and register farmers’ land rights throughout the country. Specific reforms to be considered include the following.
Develop a unified land registration system over time. A unified land registration system will require the development of unified rules, standards, and procedures in the land rights registration process. Along with the establish-ment of the land registry, unified land classi-fication standards need to be developed and applied to all types of land, including farm-land, forestland, grassland, and rural residen-tial land, and to land surveys, cadastral data management, and registration of land trans-fers. Following international best practices, the currently scattered administrative respon-sibilities for rights and property registration for various types of land should be consoli-dated within one agency responsible for the registration (box 4.6). A transitional approach could involve the requirement that various agencies follow unified procedures in land surveying and registration until a new single land registration agency has been established.
Make the transition from the current method of deed registration to title regis-tration. China’s Property Law requires a title registration under which land rights are created when they are registered. The Rural Land Contracting Law, however, stipulates a deeds registration under which land rights are established when the land contract is created, regardless of whether those rights are registered. Land title registration is gener-ally superior to systems based on the regis-tration of deeds (recordation) because it tends to make land titles more reliable and is also simpler and less costly to administer once the registry is built. For China’s rural land regis-tration system, a title registration system may be most appropriate in the longer term. How-ever, given the current de facto deeds regis-tration of rural land rights, uniformly apply-ing the rule of “no registration, no rights” to land currently held by hundreds of millions of farmers would be difficult. It is therefore necessary to recognize the legal force of rural land rights under the new system and, in addition, of those rights that remain to be registered and merged into the new system.

322 U r b a n C h i n a
Consider moving from household-based reg-istration toward parcel-based registration. Another step to consider would be how to make the transition from the current system of registering all land plots of a household on one single document (land use contract and land certificate) to a system where individual plots are registered separately. A land parcel–based registration and documentation system would simplify future land transfers and the recording of transfers of individual plots. Legal reform should also explicitly require registering both husband and wife as house-hold representatives to improve gender equity
in future land registration. Eventually, a uni-fied rural and urban land and property rights registration system could become the institu-tional basis for land and property rights pro-tection and transfers.
Reform China’s collective ownership arrangements
Under Chinese law, collectively owned land and assets are owned jointly by members of the collective (box 4.7). The Property Law authorizes the collective administrative entity, such as the administrative village, natural vil-
China’s laws recognize the benefits of documentation and registration for collective ownership. The Land Management Law provides that collectives can reg-ister their ownership with the county government. Evidence of ownership is the county-issued ownership certificate. It also requires the collective entity to issue land use contracts to farmer households.
The 2002 Rural Land Contracting Law reiterates these requirements and establishes a set of minimum requirements for all such contracts and a parallel set for contracts that involve transactions of rural land rights. The Rural Land Contracting Law also mir-rors the legal requirements for documenting collec-tive land ownership by requiring that county gov-ernments issue land rights certificates to farmers to affirm such rights. Also, the Property Law includes requirements for documenting and registering rural land rights and stipulates that the state adopt a uni-fied registration system for all real properties. The law also provides that the register guarantees the accuracy of the recorded information, and it imposes liabilities on the register if damages are caused by a registration error.
Many challenges remain in establishing a func-tional land registration system. Although the Prop-erty Law requires a unified registration system, it does not provide guidance on institutional respon-sibilities or operating rules. Currently, the Ministry of Land and Resources registers collective ownership rights and use rights to collectively owned construc-tion land. The Ministry of Agriculture is respon-sible for registering use rights to collective farmland and grassland. The State Forestry Administration is
Box 4.6 Documentation and registration of land
responsible for ownership and use rights to collective forestland. Rural houses on collective construction land are registered by the Ministry of Housing and Urban-Rural Construction.
Despite many unresolved issues, the government is addressing the registration of farmers’ land rights. In 2005, it began establishing a land registration system for farmland and conducted a land registration exper-iment in Anhui Province. In 2008, Central Document No. 1 (Fortifying the Foundation of Agriculture) stated that the local governments would enhance the administration and regulation of rural land contract-ing and expedite the establishment of registration systems for rural land use rights. Central Document No. 1 of 2009 (Achieving Steady Agricultural Devel-opment and Sustained Income Increases for Farmers) provided that the governments should carry out pilot projects for registering rural land use rights to verify size, location, and title documents of contracted land for each farm household.
Central Document No. 1 of 2010 set forth that the governments should scale up the scope of registra-tion pilots for rural land use rights, with guaranteed financial support. In 2012, Central Document No. 1 repeated the instruction on rural land use rights regis-tration and called for steadily scaling up the scope of registration pilots, with the costs to be covered by the central financial resources. In January 2013, Central Document No. 1 called for a nationwide land regis-tration initiative with a completion goal of five years. To date, land registration pilots have been conducted in 230 towns and have registered 7,936,000 mu of farmland belonging to 653,000 rural households.

C h i n a ’ s U r b a n i z a t i o n a n d l a n d : a f r a m e w o r k f o r r e f o r m 323
Under China’s Constitution, all land in rural and suburban areas, except that owned by the state, is owned by collectives. The Land Management Law (1998) authorizes collective economic entities at various levels to operate and manage collective land. Neither authority further clarifies the relationship between collective members (farmers) and the col-lective administrative entity on questions of land ownership. The Property Law (2007) provides that collectively owned property is owned by all mem-bers of the collective, namely, the households of the community.
Regarding the relationship between member owners and the collective entity, the law further prescribes that the collective entity merely exercises ownership rights on behalf of the collective. While authorizing the collective entity to exercise owner-ship rights, the Property Law specifically requires that the land contracting plan and the contracting of land to nonvillager units or individuals need to be approved by the member owners. The 2010 Organic Law of Village Committees further specifies the relationship of member owners with the collective entity with respect to land. The law provides that land contracting plans, residential land distribution plans, and use and distribution of compensation for expropriation of land shall be decided at the villager conference.
Central policies on forestland reforms reflect this definition of collective land ownership. In 2003, the Central Committee demanded either allocating col-lective forestland to individual households, if the land is suitable for household contracting, or converting all property interests in that land into shares and allo-cating such shares among the member owners. The 2008 Central Document No. 1 reiterated that prop-erty interests in collectively managed forestland must be ascertained and allocated to villager households in the form of shares of stock.
Both national law and central policy support the principle that farmers, not the collective entity, are the joint owners of collective land. These provisions assert that rural land is owned by the members of the community, not by an administrative entity, such as the village committee, villager group, or collective economic organization. Each member of the collec-
Box 4.7 China’s collective land ownership
tive has an indivisible ownership interest in all col-lectively owned land. Accordingly, as a nonowner of rural land, the collective entity should not have any property interest in the land. The collective entity exercises ownership rights that have been delegated by its member owners. The exercise of collective ownership rights must be subject to the approval of member owners, which is authorized by the villager conference.
Existing Chinese law permits all three levels of the collective—township, administrative village, and villager group—to assume ownership rights but does not identify any specific collective level as the primary owner of rural land. Recent Chinese laws are not even as precise as the 1962 Sixty-Article regulation, which clearly specified the lowest level of collective (produc-tion team, the predecessor of the present-day villager group) as the owner of the land located within its geo-graphical boundaries.
To guide the reform of laws on registering collec-tive ownership, the Office of Central Leading Group on Rural Work, Ministry of Land and Resources, Ministry of Finance, and Ministry of Agriculture jointly issued the Several Opinions on Reconfirm-ing and Registering Collectively Owned Rural Land, requiring that collective land ownership be ascer-tained at the villager group level and that ownership certificates be issued to the villager group. Only when village boundaries are no longer existent can the land ownership be ascertained at the administrative village level.
The CPC Central Committee Decision on Issues Regarding the Improvement of the Socialist Market Economic System, adopted in 2003, suggested new property structures and arrangements for rural col-lective assets that facilitate the transition to a mar-ket economic system and strengthen the role of col-lectively owned assets in economic development. The document asked for the clarifying and strengthening of property rights and the interests of collectives. Central Document No. 1 of 2010 encouraged regions with suitable conditions to carry out pilot reforms of the collective property rights system and empha-sized the importance of collectively owned assets for developing the rural economy and increasing rural incomes.
Source: Li and Wang 2013.

324 U r b a n C h i n a
lage, or villager group, to exercise ownership rights on behalf of the collective members. However, collective ownership has become ambiguous since decollectivization because the introduction of the Household Responsi-bility System in 1978 and subsequent policy changes continuously strengthened house-hold-based land rights. Collective ownership is often mistakenly regarded as ownership by the collective administrative entity. Although the Property Law has sought to clarify the relationship between collective members and the collective administrative entity in terms of ownership of collective assets, ambiguities remain in that collective administrative enti-ties often retain control of farmland contract-ing, exercise power to take farmers’ land, and often manage collective assets, including land and nonland assets, to generate profits for the collective entity itself rather than the collec-tive members they represent.
Reform of collective ownership of collec-tive assets should complement the reform for strengthening property rights to farmland, which was discussed earlier. In particular, reform should strengthen the ownership arrangements and governance of assets by the collective members; clarify the rights to col-lective assets, particularly assets other than land that has been contracted to households; and clarify the arrangements for collective shareholding organizations that will manage collective assets.
Clarify collective ownership arrangements. Many pilots for collective property reform, particularly reforms for transforming collec-tives into collective business organizations and farmers into shareholders of collective property assets, show that collective admin-istrative entities often retain a large portion of the shares of collective assets. Legal reform should clarify that all collective assets belong to the members of the collective business organization. The collective administrative entity is not entitled to such property interest in collective land and assets. Where collective property is converted into shares, such shares should be distributed to the members. As an entity that is authorized only to exercise own-ership on behalf of its members, the collective entity should not retain any share of the col-lective property.
Clarify collective membership arrange-ments. Membership, qualifications for becoming a collective member, and termi-nation of collective membership need to be clarified in the law. Currently, entitlements of collective members to collective assets are only generically defined, and guidance is needed for ongoing collective property reform efforts across the country. Because no legal code clarifies the criteria under which a person becomes a member of a collective, approving or disapproving the membership application is currently subject to the collec-tive’s discretion. One approach to clarifying collective membership and protecting collec-tive members’ ownership rights would be to define a cutoff date after which a rural citizen moving into a community is no longer eligible to become a collective member. This measure would prevent the dilution of collective assets under conditions of demographic change.
Clarify rights to collective assets. Legal reform should clarify the members’ rights associated with collective property. Rights to collective assets include the rights to occupy, use, profit, transfer, mortgage, guarantee, and inherit property. The transfer (sale) of shares of collective property would allow members of the collective to exit the col-lective permanently. But reforms should, in particular, clarify questions about the inheri-tance of shares of collective assets. Currently women who married into households after the reform, and the children born subse-quently, cannot inherit shares and therefore cannot receive dividends when the sharehold-ing household member dies. This issue will become increasingly critical when members of shareholding households die or move their residential registration outside the collective. Their shares would eventually return to the collective instead of being retained within the household. Legal reform should also consider broadening the bundle of rights to collective land by including the right to obtain a mort-gage, that is, to allow the collateralization of assets to mobilize finance in rural areas.
Make a transition toward corporate gover-nance in collective management. Collective property reform pilots have introduced a cor-porate governance approach to replace tradi-

C h i n a ’ s U r b a n i z a t i o n a n d l a n d : a f r a m e w o r k f o r r e f o r m 325
tional collective management. Reforms have promoted a governance arrangement that includes a shareholder representative board, a board of directors, and a supervisory board. The introduction of modern corporate gov-ernance has diminished the previous control of the village committees over a village’s eco-nomic activities. Reforms have also provided institutional mechanisms to hold local cadres accountable and reduce the potential for rent seeking and malpractice of collective prop-erty. Reforms should further seek to reduce administrative intervention by the collective administrative entity in the operation of col-lective business organizations, separate the political and administrative functions from the economic functions of collective business organizations, and strengthen transparency in the distribution of profits made by the col-lective business organization.
reform of the rural land expropriation system
Define legal limits for rural land taking for public purposes by local governments
Defining the “public interest” for which the state can exercise its power of eminent domain requires balancing the legitimate but often competing policy goals and interests of various stakeholders. Preserving farmland and narrowing the rural-urban income gap are important policy priorities. At the same time, local governments depend on revenue generation from land conversions and land sales, and urbanization would require more land to proceed. The reform of the rural land expropriation regime, and more generally the harmonization of the takings approaches used for urban and rural land in China, could help rebalance these interests and reduce the systemic disadvantages of rural citizens in the urbanization process.
The “needs of public interest” should be defined by listing those interests as part of the law. The reform of the rural land expropria-tion regime could follow the precedent of the Urban Takings Regulation of 2011 and its principles that define public interest by listing all foreseeable categories of public interest. For rural land, defining public interest in the same way as in the Urban Takings Regula-
tion would remove the current legal dualism and inconsistency that discriminate against China’s rural citizens. A meaningful defini-tion of public interest, both for urban and for rural takings, should ideally be included in the new Land Management Law. Because it is not possible for the legislature to envision all permissible public interests at the time of the legislation, a provision under an inclusive list could leave room for future expansion at the legislature’s discretion.
Land for public infrastructure develop-ment could still be acquired through expro-priation channels, but controls need to ensure that conversion is conducted more prudently than in the past. Complementary reform is needed to fine-tune the political incentives structure at the local government level. For example, a current mayor would face reduced incentives to convert excess quantities of land and promote investment if the revenues gen-erated from such land conversion could only be invested several years later, and the mayor would be able to gain credit for the growth years later.
Increase compensation for rural land conversion for commercial purposes
Compensation for rural land conversion for commercial (non–public interest) purposes should be increased up to the amount of the commercial value of the land, with deductions for the costs incurred by local governments for preparing the land for nonagricultural use. Under the current regime, compensation packages are capped at 30 times the land’s average annual agricultural output value. Such a maximum ceiling is often insufficient for expropriated farmers to sustain their live-lihoods. Again, the reform of the rural expro-priation regime could follow the principles of the Urban Takings Regulation, which have been applied in several provinces.
Because urban housing markets are well developed, the practical method to determine the level of compensation is based on market prices. Under the Urban Takings Regulation, the expropriating agency is required to pay compensation “no less” than a defined stan-dard that is based on comparable market prices. But given the lack of a functional rural land market, the regulation’s standard of no

326 U r b a n C h i n a
less than market price may not work for rural land takings. Thus, a benchmark tailored to fit the specific circumstances in rural areas could be developed. Currently, under the regulation local governments are encouraged to formulate a “unified annual output value” and a “comprehensive regional price” for determining compensation for expropriation in traditional agricultural and peri-urban areas, respectively. These approaches may be used as the benchmark or the minimum standards.
Improve the resettlement subsidy to sustain farmers’ livelihoods
The Land Management Law created a resettlement subsidy to account for the fact that compensation payments for the loss of assets during land expropriations alone are often insufficient for restoring rural liveli-hoods. The current practice of determin-ing the amount of the resettlement subsidy is based on the amount of land expropri-ated. Considering the small landholding per household and the resulting small amount of resettlement subsidy per dispossessed farmer, the current system disadvantages small farm households in particular.
To achieve the objective of raising dispos-sessed farmers’ original living standard and ensuring their long-term livelihood, reform should consider resettlement subsidies sepa-rately from compensation. Several provincial jurisdictions have already set the minimum resettlement standards per affected farmer. For example, in Jiangsu, such a subsidy is between RMB 14,000 and RMB 26,000 per dispossessed farmer, depending on the loca-tion of the expropriated land. In Chongqing, the subsidy is RMB 28,000 regardless of the location. In Beijing municipality, a farmer is entitled to 48 to 60 months of the city’s mini-mum wage per dispossessed household farm labor in Beijing.
Clarify and define rural social security coverage as a government financial obligation independent of compensation for rural land expropriation
China’s approach to compensation seeks to compensate farmers for the loss of property rights to land and to provide (among other
benefits) social security to ensure long-term livelihood security. From the mid-2000s, the central government began to enroll farmers in a rural social security (pension) system with the objective of covering all farmers under the rural social security system by 2020. The government called for contributions from var-ious levels of government, collective entities, and farmers to individual pension accounts. Recent implementation practices, in particu-lar a “land for social security” scheme that was pioneered in the Yangtze Delta and has spread to many locales, link farmers’ entitle-ment to compensation with their entitlement to social security.
The “land for social security” scheme has emerged as a result of ambiguous provi-sions in China’s regulatory framework with respect to the relationship between compen-sation and social security. According to the Property Law, the state should pay compen-sation for the loss of land, provide resettle-ment subsidies and compensation for fixtures on the land and for standing crops, make arrangements for the cost of social security for the farmers losing their land, and pro-tect farmers’ livelihood and their rights and interests. The law does not expressly require government to pay for social security as it does for the compensation package, and the law remains unclear as to who should pay for farmers’ social security. The Social Secu-rity Law (2011) reiterates the need to make arrangements for the full cost of social secu-rity of farmers who are being dispossessed but fails to specify who should pay for that cost.
Probably because of this legal ambiguity, line agencies promulgated regulations that favor channeling compensation packages into the social security fund. The Ministry of Labor and Social Security in 2006 permitted local governments to pay for social security by using resettlement subsidies and compen-sation payments owed to dispossessed farm-ers. The Ministry of Land and Resources in 2007 added a requirement that only when these two compensation items are not suf-ficient to cover the dispossessed farmers’ social security costs would local governments have to provide social security coverage. The “land for social security” scheme was quickly adopted by local governments as an instru-

C h i n a ’ s U r b a n i z a t i o n a n d l a n d : a f r a m e w o r k f o r r e f o r m 327
ment to lower the cost of rural land expro-priation and accelerate urbanization.
In Chongqing, although a dispossessed farmer is entitled to 80 percent of the total compensation payment for lost land (with the remaining 20 percent due to the collective) and 100 percent of the resettlement subsidy, all of the compensation and half of the reset-tlement subsidy were required to be paid into pension accounts, leaving the farmer with only 50 percent of the resettlement subsidy at the time of land expropriation. Sichuan required the resettlement subsidy to be chan-neled into the social security fund. Compen-sation for lost land was paid to the collective entity. In some cities in Liaoning Province, the government provided 30 percent of the social security contributions, and 70 percent was contributed from the compensation pay-ment and resettlement subsidy.
Legal reform should clarify current ambi-guities by explicitly requiring social security coverage as a supplement to the compensation package. The rural social security system is a public welfare program unrelated to farmers’ land rights or their entitlement to compensa-tion when their land is expropriated. Legal reform should clarify that social security cov-erage is a government obligation to all farm-ers, including dispossessed farmers.
Embody in law the protection of farmers’ procedural rights during land expropriation
China’s procedural laws for rural land expro-priation need improvement. The central poli-cies on farmers’ procedural rights and the Urban Takings Regulation already provide guidance for developing relevant provisions on procedural rights that should be embed-ded in the law, as follows:
Establish the right to receive notice. Central policies require that farmers be notified of all relevant information concerning the pro-posed land expropriation before the expro-priation plan is approved. Planned expropria-tions should be publicized and made known to each household that will be affected by the proposed expropriation. The Urban Takings Regulation prescribes a three-stage notifica-tion: predecision notification, in-decision notification, and postdecision notification.
This articulation should be followed in any revisions of notice laws for rural takings. Provisions for periods for public comment should also be included.
Establish the right to participate. New pro-cedural laws for rural expropriation should include a mandatory public hearing in the expropriation process, as already stipulated in central policies and the Urban Takings Regulation. The right to participation is even more important if China adopts a “no less than benchmark” standard in determining the compensation package. Procedural laws should empower farmers to negotiate the compensation package with the expropriat-ing agency in good faith, starting from the benchmark standard. Central policies also require farmers’ confirmation of govern-ment’s land assessment as a necessary sup-porting document for reviewing and approv-ing the expropriation plan.
Establish the right to appeal. Like urban property owners, rural citizens affected by expropriation should be given the right to seek administrative hearings or judicial reviews when they dispute a compensa-tion decision. Existing laws on appealing decisions permit expropriation to continue despite disputes over compensation and should be replaced with new rules permit-ting farmers to file an injunction when there is a dispute over the compensation package. Provisions prohibiting violent force under the Urban Takings Regulation should also be incorporated into rural procedural laws.
Developing the construction land markets in urban and rural areas
Construction land markets in rural and urban areas are developed to different degrees and remain incomplete and ineffi-cient. In urban areas, the government retains the monopoly in the primary land market, while the market for subsequent transactions, the secondary land market, is underdevel-oped and nontransparent. Local governments are poorly equipped to monitor transactions in the secondary market, collect proceeds from land transactions, or capture value as land is being converted to higher-value uses.

328 U r b a n C h i n a
In the industrial land segment, land is often allocated directly rather than in accordance with national policy, which requires the com-petitive allocation of land for industrial pur-poses, as given in Central Document No. 28 of 2004 (Decision on Deepening Reforms and Intensifying Strict Land Management). In rural areas, collective organizations can use land for nonagricultural industrial and commercial activities only within the con-fines of the collective, or they can use land use rights as shareholding rights. However, collective construction land cannot be leased to noncollective entities for commercial or industrial development. Furthermore, rights to rural homestead land are limited: trans-fer and lease is allowed only between mem-bers of the collective. Quotas for convert-ing farmland to collective construction land are limited as well, constraining collectives’ opportunities for commercial and industrial development and resulting in widespread ille-gal use of rural construction land.
Land market development and deepening in urban and rural areas, and the integra-tion of rural and urban construction land markets, are important to increase land sup-ply for urban development and to gradually replace current practices of government-led land requisition and conversion toward more efficient market-based allocation of land. This section discusses a number of reform opportunities to promote the integration of the rural and urban construction land mar-kets toward more equal benefit sharing and more efficient land use.
Deepen the urban land market
Strengthen transparency and efficiency in the secondary urban land market. Reform should enable local land administration authorities to strengthen efficiency in the urban land market with increased transpar-ency in the secondary land market transac-tions. Reform also should introduce regula-tions that require all urban land transactions to register with local land transaction cen-ters. Furthermore, transfers and leases of urban land should be transacted and recorded through land transaction centers to curb direct transactions between sellers
and buyers that circumvent the registration requirements. Compulsory transactions or urban land transfers through the land trans-action centers would allow local governments not only to collect fees from transactions but also to capture a share of the value increase in urban land, which currently provides no public value capture.
Develop the industrial construction land market. Reforming the industrial land mar-ket will involve reducing the share of indus-trial land in urban areas and pushing indus-trial land to higher-value commercial and residential uses. With the expiration of the first 40-year term for industrial land, local governments should be positioned through new regulation to buy back inefficiently used industrial land from industrial land users at current market prices for industrial land, allowing the government and industrial users to share the increase in value of such industrial land. The repurchased land would then be available for competitive auctioning for other than industrial purposes. Further-more, land allocated to public service entities, which covers large areas within cities (such as public spaces) and is often used inefficiently, should be reclaimed by local governments and be allowed to enter the market.
Develop and integrate collective construction land into the urban land market
Large amounts of collective construction land have entered the urban market illegally, particularly in China’s eastern coastal areas and large cities. At the same time, several provinces, including Guangdong, Chongq-ing, Anhui, Zhejiang, and Jiangsu, have experimented with innovative measures to let collective construction land be leased, trans-ferred, and mortgaged. However, because current legal prohibitions prevent collective construction land from entering the urban land market formally, such efforts remain at the pilot and experimentation level.
The Third Plenary Session of the 18th CPC Central Committee in 2013 provided a clear policy foundation and direction for collective construction land to enter the urban market. These policy decisions provide the opportu-

C h i n a ’ s U r b a n i z a t i o n a n d l a n d : a f r a m e w o r k f o r r e f o r m 329
nity to adjust the legal framework and legal-ize the entry of collective construction land into the urban market. Therefore the recom-mended actions are to revise and amend the Land Management Law, the Property Law, and other relevant laws to clarify and formal-ize the legality of such market entry. In addi-tion, new implementation regulations need to clarify which rural land will be allowed to enter the urban construction land market as well as define the mechanisms for legalizing collective construction land that has already entered the urban market.
Clarify and strengthen property rights to rural residential (homestead) land
Rural residential land management practice has created de facto property rights dating back to the 1960s. However, these rights remain largely undefined, and the Property Law does not allow transferring or leasing of rural residential land. In reality, however, homestead land has been dynamically leased and transferred in many regions; therefore, reform needs to address how conditions have evolved in practice. Legalizing de facto prop-erty rights to rural homestead land is impor-tant for promoting rural-to-urban mobility as well as integrating construction land markets.
The decisions of the Third Plenary Session of the 18th CPC Central Committee of 2013 call for clarifying and strengthening home-stead rights, and they provide more flexibil-ity in developing new methods to transfer homestead land and in promoting market entry of rural residential land. Previous cen-tral policies intended to restrict transfers of homestead land because of concerns that full transferability of farmers’ residential land rights may trigger uncontrolled conversion of farmland to construction land. Such conver-sions were considered to pose risks to farm-ers’ livelihoods when they dispose of their homesteads through transfers without hav-ing adequate income sources and a residence elsewhere. Existing laws also preclude rural households from getting a new foundation plot once they have transferred their origi-nally allocated plot. Once a rural household has transferred its residential land rights, it would not be allocated a new foundation plot
by the collective even if it ultimately fails to adapt to urban life.
The following are more specific recom-mendations for reforms to strengthen and clarify rights to homestead land: Rural resi-dential land rights should be defined as indef-inite usufruct property rights, harmonizing urban and rural property rights to residen-tial property. This definition of rights would include rights to use, operate, mortgage, transfer, and profit from residential land use rights. Given the cautionary approach to homestead land transfers stipulated by the Third Plenary Session, new regulations to guide this process should ensure that trans-fers of rural residential land rights are volun-tary and contingent on the household’s ability to meet certain qualifications, such as reloca-tion of all household members to cities, stable employment, or an urban residential permit.
Land use control mechanisms should also prohibit villages from extending the existing scale of homestead land, ensure that land rights transfers are legal, and prevent uncon-trolled farmland conversion. Furthermore, to curb the spatial expansion of residential land in rural areas, collective entities should no longer be allowed to allocate homestead land for free to new community members. New arrivals in rural villages should buy home-stead land through market-based transfers based on market prices.
Allow conversion of rural construction land, including homestead land, into transferable quotas to be traded in the urban land market
Provincial jurisdictions such as Chongqing and Guangdong have started to permit the transfer of rural residential land rights in rec-ognition of the migration momentum created by urbanization, as discussed in the sections on Chongqing and Chengdu. Such experi-ments could be adopted nationally through further legislative reforms, while ensuring that land use control mechanisms prevent uncontrolled conversion to industrial or com-mercial use. Specifically, the Chongqing prop-erty exchange experiment demonstrates effi-cient market-driven land conversion. Rural residents can convert their construction land into agricultural land and obtain a tradable

330 U r b a n C h i n a
right for the opposite conversion. This right can be sold on the exchange, and developers, with the agreement of the owners, can use it to convert agricultural land zoned for devel-opment in urban areas where demand is high. By unlocking construction land away from the city, this method allows cities to optimize their spatial design and avoid inefficient city expansion that relies solely on available con-struction land near the existing city bound-aries. This approach is of particular interest because it allows the efficient, market-driven transfer of construction land quotas from remote rural areas to urban areas while ben-efiting rural citizens through the mobiliza-tion of dormant rural construction land to generate income, flexibility in decisions about migration, and recurrent income from leasing of newly created farmland in the home vil-lages. This approach could help unlock large amounts of currently remote and underuti-lized rural construction land for city devel-opment in a market-driven way and reduce current social tensions that arise from com-pulsory land requisition in rural areas.
Innovation in land institutions in peri-urban areas
The proliferation of urban villages, or infor-mal development of urban fringe areas, in many cities across China has created many land- and property-related challenges. Local governments and real estate developers have discovered the economic potential of rede-veloping urban fringe areas. But the redevel-opment of urban villages and their formal integration into the city space pose serious difficulties to city governments and devel-opers, as discussed earlier. Reform should address those informal developments, along with underdeveloped public services, the legal vacuum around collective construction land in peri-urban areas, and the financial chal-lenges of municipalities related to compensa-tion and to resettlement as peri-urban areas.
Integrate urban villages into urban master plans
Integrating urban villages into the formal urban development process, based on inte-grated urban master planning and rural-urban integration of construction land mar-
kets, could increase land supplies for urban development. Integration would also provide opportunities for boosting low-income hous-ing availability and allow collective orga-nizations and rural residents in peri-urban areas to benefit economically from urbaniza-tion, because construction land markets are allowed to develop based on strengthened land rights. As discussed earlier, revisions of the Land Management Law and other laws should proceed quickly, based on the deci-sions of the Third Plenary Session of the 18th CPC Central Committee of 2013. At the same time the reform should include the formulation of implementation guidelines to allow rural collective organizations in peri-urban areas to develop or lease collective construction land to developers for urban commercial and residential development within the framework of urban master plans.
Through appropriate zoning, local govern-ments could provide incentives to build low-income housing in those areas while avoiding resettlement and related costs, because collec-tive construction land remains under collec-tive ownership. Furthermore, formal recog-nition and legal protection of small-property rights to housing units on collective land could provide rural migrants currently resid-ing in informal housing with stronger incen-tives to settle permanently in urban areas.
Consider a zone takings law, following the model of Taiwan, China
China’s advancing urban development will be largely commercial. Negotiating with indi-vidual landowners to assemble land for urban cluster development may be impractical and delay the urbanization process. To address this dilemma, the government may consider introducing the experiences from Taiwan, China (box 4.8), where the legal framework provides local governments with the option to rezone agricultural land for urban devel-opment and allows commercial developers to conduct land transactions directly with rural property rights holders. Transactions are sub-ject to the provisions of urban master plans, including transparent public consultation. China’s Ministry of Land and Resources has already planned to permit the reserving of part of the expropriated (and thus converted

C h i n a ’ s U r b a n i z a t i o n a n d l a n d : a f r a m e w o r k f o r r e f o r m 331
In 1953, the Land to the Tiller Act abolished the tenancy system in Taiwan, China, through compul-sory government purchase of land from landlords and resale to the tenants. By 1956, the total area of owner-operator farming had increased from less than 50 percent of total farmland in 1948 to over 85 per-cent. The government protected private tenure fol-lowing the land reform using legal protection, a broad publicity campaign to improve farmers’ awareness of laws and government policies, and a government-led annual survey to closely monitor the implementation of the land reform program. In the subsequent urban-ization, authorities took measures to control the use of land for urban purposes and to facilitate nonfarm development by farmers themselves.
General and zone taking. Taiwan, China, takes an approach of listing the circumstances under which private land can be expropriated. General taking refers to expropriation for the public interest. Zone taking refers to the expropriation and conversion of private farmland to nonfarm use for the purpose of (a) development of new urban areas; (b) renovation of old urban areas; (c) farmland conversion in planned urban zones into construction land, or conversion of industrial areas into residential and commercial areas; (d) development of nonurban land; (e) rural develop-ment for improving rural public facilities and public health; and (f) other uses in accordance with relevant laws. General and zone taking are subject to different procedural and compensation laws.
For general taking, a compensation standard is the agricultural land value that has been assessed for taxation purposes. Each year, the local land admin-istration bureaus publish the assessed values for farmland throughout Taiwan, China. That present-value standard has recently been replaced with a market-value standard that is based on recent com-parable agricultural land market transactions. The relatively simple procedures include public hearing, public announcement of the taking decision for 30 days, written notification of the affected landowner, filing period with the local land administration within 30 days in case of dispute over compensation, appeal of the local decision to a land price review committee, and filing of administrative litigation with a court.
Zone taking, in contrast, represents the de facto permission of the government to take private prop-
Box 4.8 general and zone takings in Taiwan, China
erty for commercial purposes, with landowners being entitled to higher compensation and better procedural safeguards. Landowners can claim a monetary com-pensation based on the market value of the land’s agricultural use or, alternatively, take back 40 to 50 percent of the expropriated land as offset land. Such offset land is the previous farmland that has been con-verted into higher-value urban construction land. The landowner may also select a compensation scheme in which one part of the compensation is paid in cash and one part is given in offset land.
Procedurally, the government is required to pur-chase land from landowners through negotiation before launching zone taking. If negotiations fail, the government may resort to zone taking. Prior to the taking, the government must conduct public hearings to explain compensation modalities to the affected landowners. Landowners who choose to take com-pensation in the form of offset land are given the opportunity to choose the location of the offset land within the designated construction area. Landowners are also given the opportunity to negotiate the exact compensation ratio (40–50 percent) to be applied.
Infrastructure financing under zone taking. The government is required to set aside a portion of the expropriated land for public facilities such as schools, roads, and public utilities. Although there is no legal requirement with respect to the ratio of such public facility land, in practice, 40–50 percent is for pub-lic use. After setting aside 40–50 percent of land as offset land and 40–50 percent as public use land, the government retains 10–20 percent of the expropriated land for sale to developers.
To prevent irrational urbanization, the law requires balancing the budget for the development using funds from the sale of the land acquired through zone tak-ing and prohibits the use of other local revenues to finance such development. The government therefore needs to rely on the proceeds from selling the 10–20 percent share of taken land to finance the construc-tion of all public facilities within the zone.
Expropriated land is first converted and registered as state owned upon the completion of zone taking. After offset land selection, such offset land will be reregistered as privately owned land. The remaining construction land sold to developers will also be reg-istered as developer-owned land. In the end, only the land used for public facilities remains state owned.
Source: P. Li 2013.

332 U r b a n C h i n a
use) land for compensating affected farmers in planned urban areas.
The Taiwan, China, model may provide an approach to balancing the property inter-ests of collectives and farmers in peri-urban areas with the need for the government to provide and finance public infrastructure. A new zone taking and city redevelopment law could permit urban commercial development whereby farmers affected by the change in land use will be able to share the benefits of such development through compensation in the form of land for urban development and greater procedural safeguards.
If forthcoming reforms could permit farm-ers to retain part of the expropriated land as resettlement land zoned for nonagricultural purposes, the legal nature of the ownership of such land and the use rights to such land must be determined. Because the expropri-ated land was collectively owned in perpetu-ity before it was taken by the state, the rec-ommendation is to allocate the use rights of the expropriated land being retained by the rural citizens as allocated urban land rights without term limitation.
Consider introducing property taxation for new construction land
In line with the reform recommendations on the introduction of an annual property tax discussed in Supporting Pillar Report 6, Financing Urbanization, collective construc-tion land that enters the urban land market could be made subject to a capital gains tax. Doing so would allow local governments to capture a share of the value increase when such land enters the urban market for com-mercial purposes as well as to collect an annual property tax. The introduction of such property taxes on new construction land would be gradual and depend on the development of the various elements of a tax administration system, including land regis-tration, valuation, and documentation.
Land reform and agricultural sector modernization
Migration, land rights transfers, and farm-land consolidation, as well as mechaniza-tion and technological change, are reshaping
China’s household-based farming model, thus creating new challenges to the traditional arrangements of land contracting under the Household Responsibility System of 1978. From 1996 to 2009, the total agricultural labor force decreased from 317 million to 259 million people, with an estimated 250 million farmers working in cities for more than six months every year. In 2011, about 1.28 billion mu of farmland (out of the 1.38 billion mu of total collectively owned farm-land) was contracted to nearly 230 million households. About 200 million households (85 percent of all rural households) owned less than 10 mu (Xu and others 2013). Large-scale migration has resulted in the gradual separation of contractual and management rights to farmland, which traditionally were fully integrated in China’s smallholder farm operations under the Household Responsibil-ity System. Migrating farmers have retained their contractual (property) rights to farm-land but are increasingly transferring the management or operating rights to others because they no longer work on the farm themselves.
Transfers of management rights to farm-land have rapidly increased in recent years, in peri-urban areas as well as in many agri-cultural regions. By 2011, about 20 percent of all farmland was subject to transfers, with shares as high as 41 percent in Jiangsu, 40 percent in Zhejiang, and 26 percent in Guangdong (Xu and others 2013). More than two-thirds of land transfers take place between rural households, although spe-cialized cooperatives and enterprises have become more prominent in acquiring farm-land through transfers. Most of the land transfers are between 10 and 50 mu, allowing individual rural households to achieve some level of large-scale operation and specializa-tion commensurate with labor and technical capacity and generating incomes competitive with off-farm incomes from migration. In 2011, only about half a million households operated farms of 100 to 200 mu (7 to 13 hectares).
Land transfers and consolidation of small farms face challenges. Small farm size, land fragmentation, and the lack of regulated, transparent markets for farmland are con-sidered to be some of the challenges imped-
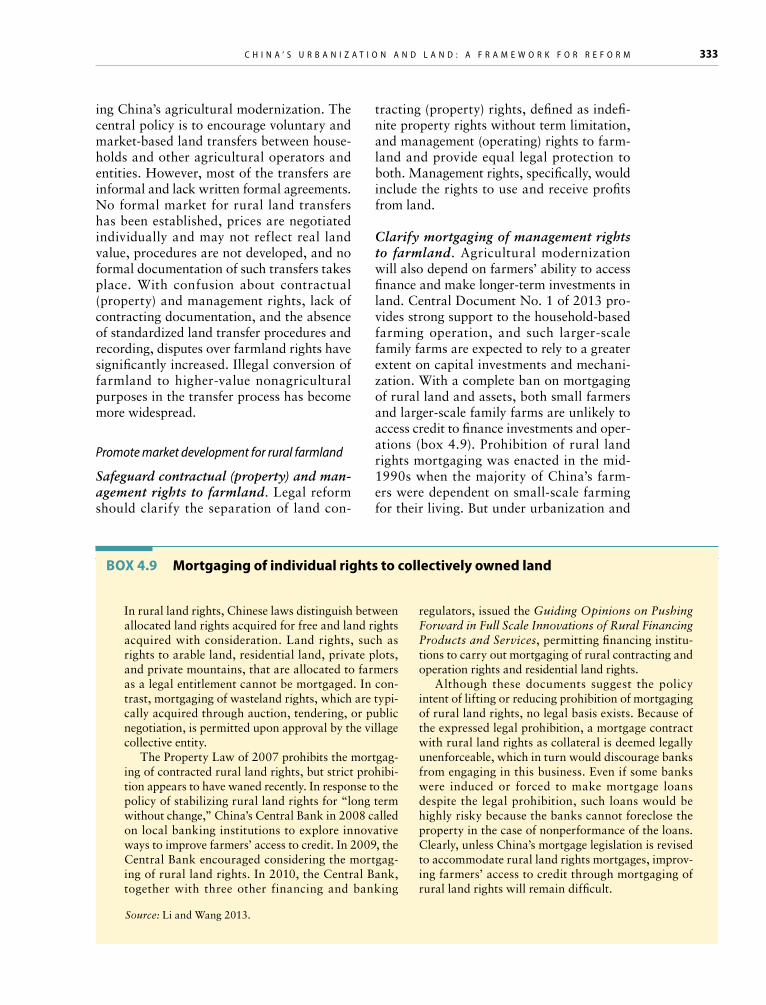
C h i n a ’ s U r b a n i z a t i o n a n d l a n d : a f r a m e w o r k f o r r e f o r m 333
ing China’s agricultural modernization. The central policy is to encourage voluntary and market-based land transfers between house-holds and other agricultural operators and entities. However, most of the transfers are informal and lack written formal agreements. No formal market for rural land transfers has been established, prices are negotiated individually and may not reflect real land value, procedures are not developed, and no formal documentation of such transfers takes place. With confusion about contractual (property) and management rights, lack of contracting documentation, and the absence of standardized land transfer procedures and recording, disputes over farmland rights have significantly increased. Illegal conversion of farmland to higher-value nonagricultural purposes in the transfer process has become more widespread.
Promote market development for rural farmland
Safeguard contractual (property) and man-agement rights to farmland. Legal reform should clarify the separation of land con-
tracting (property) rights, defined as indefi-nite property rights without term limitation, and management (operating) rights to farm-land and provide equal legal protection to both. Management rights, specifically, would include the rights to use and receive profits from land.
Clarify mortgaging of management rights to farmland. Agricultural modernization will also depend on farmers’ ability to access finance and make longer-term investments in land. Central Document No. 1 of 2013 pro-vides strong support to the household-based farming operation, and such larger-scale family farms are expected to rely to a greater extent on capital investments and mechani-zation. With a complete ban on mortgaging of rural land and assets, both small farmers and larger-scale family farms are unlikely to access credit to finance investments and oper-ations (box 4.9). Prohibition of rural land rights mortgaging was enacted in the mid-1990s when the majority of China’s farm-ers were dependent on small-scale farming for their living. But under urbanization and
In rural land rights, Chinese laws distinguish between allocated land rights acquired for free and land rights acquired with consideration. Land rights, such as rights to arable land, residential land, private plots, and private mountains, that are allocated to farmers as a legal entitlement cannot be mortgaged. In con-trast, mortgaging of wasteland rights, which are typi-cally acquired through auction, tendering, or public negotiation, is permitted upon approval by the village collective entity.
The Property Law of 2007 prohibits the mortgag-ing of contracted rural land rights, but strict prohibi-tion appears to have waned recently. In response to the policy of stabilizing rural land rights for “long term without change,” China’s Central Bank in 2008 called on local banking institutions to explore innovative ways to improve farmers’ access to credit. In 2009, the Central Bank encouraged considering the mortgag-ing of rural land rights. In 2010, the Central Bank, together with three other financing and banking
Box 4.9 Mortgaging of individual rights to collectively owned land
regulators, issued the Guiding Opinions on Pushing Forward in Full Scale Innovations of Rural Financing Products and Services, permitting financing institu-tions to carry out mortgaging of rural contracting and operation rights and residential land rights.
Although these documents suggest the policy intent of lifting or reducing prohibition of mortgaging of rural land rights, no legal basis exists. Because of the expressed legal prohibition, a mortgage contract with rural land rights as collateral is deemed legally unenforceable, which in turn would discourage banks from engaging in this business. Even if some banks were induced or forced to make mortgage loans despite the legal prohibition, such loans would be highly risky because the banks cannot foreclose the property in the case of nonperformance of the loans. Clearly, unless China’s mortgage legislation is revised to accommodate rural land rights mortgages, improv-ing farmers’ access to credit through mortgaging of rural land rights will remain difficult.
Source: Li and Wang 2013.

334 U r b a n C h i n a
with migration accelerating, there is scope for consolidation in the agricultural sector in many regions across China. The current prohibition of mortgaging effectively pre-cludes the remaining farmers from financing their acquisition of additional land rights. Developed economies show that access to credit is critical for long-term, productivity-enhancing, and income-generating farmland investments, and such conditions increasingly apply to China as it modernizes its agricul-tural sector. Maintaining the restrictions on rural land rights mortgaging may no longer be advisable.
Mortgaging can cause foreclosure if the debtor defaults on the loan for which the land rights are pledged as collateral. Existing legal prohibition of mortgaging of farmers’ land rights evolved from concerns over farmers’ loss of land rights due to foreclosure. Such concerns can be addressed through additional legal restrictions as well as improved banking practices, such as the requirement that the borrower produce business plans subject to the mortgage holder’s review and approval, credit and risk assessment, and so forth. Measures to reduce potential risks of foreclo-sure could include a homestead exemption to foreclosure on certain farmland to guarantee farmers’ need for livelihood; advance notice informing the defaulting mortgager regard-ing possible consequences of default, and judicial sale of land in case of foreclosure to prevent banks from accumulating holdings of foreclosed land rights.
Strengthen service functions of collective organizations and promote cooperative development
Collective organizations should be strength-ened to oversee and monitor farmland trans-fers and to provide members with services in the land transfer process, including land rights confirmation, registration, and certi-fication, as well as ensure that agricultural operators adhere to certain qualification stan-dards in agricultural production (box 4.9). Although enterprises would also be allowed to acquire farmland through transfers, such land acquisition needs to comply with land administration provisions, thus preventing or
penalizing illegal conversion of farmland to nonagricultural uses. Farmer-driven volun-tary cooperative development should be sup-ported to allow farm households to integrate production, access technology and unify product standards, improve market access, and achieve higher efficiency in the use of machinery and other inputs.
Notes 1. The hukou system is China’s household regis-
tration system, which distinguishes between rural and urban citizens and imposes restric-tions on rural residents’ mobility to settle in urban areas and gain access to urban social security and public service (see Supporting Pillar Report 3).
2. For a discussion of China’s fiscal system, see Wong 2013.
3. Open auction is competitive bidding for land in which the grantor (the county or city land and resource administration) issues a public notice of land auction. Interested grantees can participate in competitive bidding at a desig-nated time and place. The winning bid goes to the highest bidder. Under a tender bidding process, also called silent auction, the grantor invites the interested grantees to make their tender offer for the land parcel pursuant to a set of criteria announced in public. Negoti-ated sale is a process whereby the would-be grantee negotiates the deal with the govern-ment grantor to reach an agreement on the level of granting fee (Ministry of Land and Resources, Rules on Granting Use Rights to State Owned Land through Tender Bidding, Auction and Public Listing (Decree No. 11), 2002.
4. DRC 2013, Notice on Strengthening Land Asset Administration, 2001.
5. Ministry of Land and Resources, Rules on Land Concession through Tendering, Auc-tion or Competitive Bidding, Decree No. 11, 2002.
6. DRC 2013, Notice on Relevant Issues Con-cerning the Strengthening of Land Control, 2006.
7. Central Document No. 1 of 2013, Several Opinions on Speeding Up Development of Modern Agriculture and Further Strengthen-ing Rural Development Vitality.
8. China participated in the negotiations of the Voluntary Guidelines on the Responsible Governance of Tenure of Land, Fisheries

C h i n a ’ s U r b a n i z a t i o n a n d l a n d : a f r a m e w o r k f o r r e f o r m 335
and Forests in the Context of National Food Security (Food and Agriculture Organization of the United Nations [FAO] 2011). The vol-untary guidelines have been endorsed, and their implementation has been promoted, by the following meetings since their initial adoption by the Committee on World Food Security on May 11, 2012: Group of Twenty, Rio + 20, the United Nations General Assem-bly, and Group of Eight.
9. The value of unequipped agricultural land in the southwest region averaged around £15,000 per hectare in January 2011. The value of land with permission for residential development was around £1,500,000 per hectare for the average-size regional city of Plymouth and around £2,100,000 for the major regional city of Bristol, United King-dom. Valuation Office Agency, Property Market Report 2011, http://www.voa.gov.uk /dvs/_down loads/pmr_2011.pdf.
10. This was based on Yuan (2013a).11. This was based on L. Li (2013). 12. This was based on Wang (2013).13. This was based on Hu (2013). 14. This was based on Shao (2013).
referencesCASS (Chinese Academy of Social Sciences). 2013.
Blue Book on CSR, 2013. Beijing: CASS.China Land and Resources Statistical Yearbook.
2001–13. Ministry of Land. Beijing: China Geological Press.
China Statistical Yearbook. 2000–12. National Bureau of Statistics of China. Beijing: China Statistical Press.
China Urban Construction Statistical Yearbook. 2001–12. Ministry of Housing and Urban-Rural Development. Beijing: China Planning Press.
DRC (Development Research Center of the State Council). 2012. “The Current Model of Land Expropriation: Risks and Reforms.” Working paper prepared by S. Liu for the DRC, Beijing.
———. 2013. “Land Concession in China: Rev-enue and Expenditure and Recommendations for Improvement.” Working paper prepared by S. Liu for the DRC, Beijing.
FAO (Food and Agriculture Organization of the United Nations). 2011. Voluntary Guidelines on the Responsible Governance of Tenure of Land, Fisheries and Forests in the Context of National Food Security. Rome: FAO.
Hu, R. 2013. “Beijing Redevelopment of Urban Fringes: Experiences and Implications.” Back-
ground paper prepared for the World Bank and Development Research Center Urbaniza-tion Study, World Bank, Washington, DC.
Kitazato, T. 2003. “Japan: Fixed Property Tax.” Case study presented at the seminar “Innova-tions in Local Revenue Mobilization,” World Bank, Washington, DC, June 23–24.
Landesa. 2012. “Summary of 2011 17-Province Survey’s Findings: Insecure Land Rights: The Single Greatest Challenge Facing China’s Sustainable Development and Continued Sta-bility.” Landesa, Seattle, WA. http://www .landesa.org/china-survey-6/.
Li, L. 2013. “Chengdu’s Experiments on Land System Reform and Urban-Rural Integration.” Background paper prepared for the World Bank and DRC Urbanization Study, World Bank, Washington, DC.
Li, P. 2013. “Letting Farmers Share in the Ben-efits of Land Value Increment in the Urbaniza-tion Process of Taiwan, China. Practices and Experiences.” Background paper prepared for the World Bank and DRC Urbanization Study, World Bank, Washington, DC.
Li, P., and X. Wang. 2013. “Legal Review of China’s Property Rights Regime.” Background paper prepared for the World Bank and DRC Urbanization Study, World Bank, Washington, DC.
Man, J. 2013. “Evaluation of Property Tax Reform and Experiments in China.” Back-ground paper prepared for the World Bank and DRC Urbanization Study, World Bank, Washington, DC.
Medda, F. R., and M. Modelewska. 2011. Land Value Capture as a Funding Source for Urban Investment: The Warsaw Metro System. War-saw, Poland: Ernst & Young.
Norregaard, J. 2013. “Taxing Immovable Prop-erty. Revenue Potential and Implementation Challenges.” IMF Working Paper WP/13/129, International Monetary Fund, Washington, DC, May 2013.
OECD (Organisat ion for Economic Co-operation and Development). 2010. Tax Policy Reform and Economic Growth. Paris: OECD. http://www.oecd-ilibrary.org /taxation/tax-policy-reform-and-economic-growth_9789264091085-en.
Schlosser, C. 2007. “Case Study: The Municipal Finance System in Germany,” 21st Session of the Governing Council, UN-Habitat, Nairobi, Kenya.
Shao, X. 2013. “Guizhou–Meitan: Population Growth without Land Increase, Population Decline without Land Decrease. Approaches and Implications.” Background paper prepared

336 U r b a n C h i n a
for the World Bank and DRC Urbanization Study, World Bank, Washington, DC.
Spahn, P. B. 2003. “Land Taxation in Germany.” Case study prepared for the World Bank semi-nar “Innovations in Local Revenue Mobiliza-tion,” Washington, DC, June 23–24.
Tao, R. 2013. “China: Land Policy Reform for Rural-Urban Integration and Sustainable Urbanization.” Background paper prepared for the World Bank and DRC Urbanization Study, World Bank, Washington, DC.
Wang, H., L. Wang, F. Su, and R. Tao. 2012. “Rural Residential Properties in China: Land Use Patterns, Efficiency, and Prospects for Reform.” Habitat International 36: 201–09.
Wang, X. 2013. “Role of Rural Land Exchange in Chongqing and Its Effects.” Background paper prepared for World Bank and DRC Urbaniza-tion Study, World Bank, Washington, DC.
Wang, Y., Y. Wang, and J. Wu. 2009. “Urban-ization and Informal Development in China: Urban Villages in Shenzhen.” International Journal of Urban and Regional Research 33 (4): 957–73.
Wong, C. 2013. “Paying for Urbanization in China: Challenges of Municipal Finance in the Twenty-First Century.” In Financing Met-ropolitan Governments in Developing Coun-tries, edited by Roy W. Bahl, Johannes F. Linn, and Deborah L. Wetzel. Cambridge, MA: Lin-coln Institute of Land Policy.
World Bank. 2012. “China’s System of Munici-pal Finance: Origins, Impacts, and Agenda for Reform.” Technical note, World Bank, Wash-ington, DC.
———. 2013. Collective Property Institutions and Policies under Urbanization, Reform Pilots in Beijing’s Changping District: Obser-vations and Recommendations for Deepening Collective Reform. Technical assistance report for the World Bank, Washington, DC.
Xu, X., S. Liu, X. Fan, Q. Li, Z. Wu, M. Tan, Y. Li, and J. Yang. 2013. “Study on Adhering To and Improving the Basic Operation System for Rural Areas.” Development Research Cen-ter of the State Council, Beijing.
Yuan, X. 2013a. “Case Study on Shenzhen’s Land Policy Innovation.” Background paper pre-pared for the World Bank and DRC Urbaniza-tion Study, World Bank, Washington, DC.
———. 2013b. “Urban Villages in Beijing, China: Challenges and Solutions.” Background Paper prepared for the World Bank and DRC Urban-ization Study, World Bank, Washington, DC.
Zhai, N., and G. Xiang. 2007. “An Analysis of China’s Current Land Acquisition System and Policy Implications.” China Administration 3.
Zhang, N., W. Pan, S. Li, Z. Meng, and C. Yang. 2012. “Improving the Regulatory Basis for Strengthening the Secondary Urban Land Market.” China Land and Resources News Network, January 31.

337
5
China’s Urbanization and Food Security
introduction China’s urbanization and the accompanying structural changes demand a new look at China’s domestic food self-suffi ciency objec-tives. Urbanization is a reflection of and a contributing factor to economic growth and development. In this process, overall out-put and average incomes rise. Demographic change, change in diets and food consump-tion patterns, emergence of environmental constraints (such as land or water concerns and environmental pollution), transforma-tion of rural factor markets, food supply-chain development, market and distribution systems transformation, and agricultural technology and farm scale changes are linked in various ways. These factors will affect China’s food production capacity and food availability over the coming decades. Under-standing how the balance between China’s domestic demand and domestic production of food will evolve will be important in for-mulating appropriate and effective policies.
China has achieved tremendous results in agriculture over the past 30 years. From 1978 to 2011, China’s agricultural gross domestic product (GDP) at constant prices grew at an annual rate of 4.6 percent, four times the rate of population growth. Main-
taining such a high average growth rate in agriculture for more than 30 years, while allowing many people to move from agricul-ture to other sectors, is a truly extraordinary achievement. China’s agricultural produc-tion structure has also shifted gradually from relatively low-value to higher-value products, largely consistent with resource endowments and comparative advantage. Although still important, cereal crop production no longer dominates but is matched by the develop-ment and expansion of higher-value crops and livestock. In 1980, crops, livestock, and aquaculture products accounted for 75.6 per-cent, 18.4 percent, and 1.7 percent of total output value, respectively. By 2011, the share of crops in total output value had dropped to 54 percent, while animal husbandry and aquaculture had increased to 33 percent and 10 percent, respectively (NSBC 2012).
Growth in agricultural output was first achieved through institutional and mar-ket reforms, such as the introduction of the Household Responsibility System and the subsequent lifting of food price and procure-ment regulations. Later, growth was achieved through agricultural intensification and technological progress. From 1980 to 2012, China’s grain production rose from 320.56 million tons to 589.57 million tons, an

338 U r b a n C h i n a
increase of 84 percent. Rice production grew by 46 percent, and wheat and corn grew by 118 percent and 232 percent, respectively. Since 2004, China’s grain production has continuously increased; since 2007, annual grain output has exceeded 500 million tons. Farmer per capita income also continued to grow, reaching RMB 7,917 in 2012, with an inflation-adjusted real increase of 8.8 percent per year since 2003.
China’s food security, as measured both by the aggregate availability of food and by the access of vulnerable individuals and households to food, has improved dramati-cally over the past 30 years. Food security problems at the level of households and in dividuals—the problem of subsistence and vulnerability—have been substantially reduced. Consumption patterns have diver-sified, and nutritional status has improved. Market integration has addressed the prob-lem of regional food insecurity resulting from unequal spatial distribution of resources (J. Huang and Rozelle 1998). At the national level, China has maintained food self- sufficiency and even sustained a net export balance during the period of the 11th Five-Year Plan (2006–10).
China has been able to meet the objective of domestic self-sufficiency in the two major food grains, rice and wheat, with limited dependence on global food markets so far. But concerns about China’s future food self-sufficiency—in particular its future grain self-sufficiency—have drawn wide attention both at home and abroad in recent years. As the income of urban and rural households has increased, aggregate food demand in China has also been increasing, along with demand for higher-quality agricultural products (Bai and others 2010; X. Chen 2011; J. Huang, Yang, and Rozelle 2010). At the same time, supply constraints have become more pro-nounced, particularly because of decreasing land and water resources for agriculture, increasing environmental pollution, and increasing labor and production costs (Han 2010; Ma and Niu 2009).
Strong growth in demand and increas-ing supply constraints potentially pose chal-lenges for China’s future aggregate food self-
sufficiency. Aggregate food self-sufficiency fell below 98 percent in 2010. Grain self-sufficiency fell to 92 percent in 2010 and to 88 percent in 2012 because of imports of soybeans and maize used as animal feed. Although domestic self-sufficiency in rice and wheat remained at nearly 100 percent, soybean imports reached 58.3 million tons in 2012. China has also shifted from being a net exporter of corn in the early 2000s to an importer in 2010, with net imports of 5.2 million tons in 2012. The driving factors behind increasing demand (and domestic sup-ply shortfalls) for soybeans and corn are the growing demand for animal products and the development of China’s livestock industries. Imports of other products have also grown: sugar (to 3.7 million tons in 2012); edible oil (to 9.6 million tons); dairy products (to 6.2 million tons for fresh milk); and pork, beef, and mutton (to 0.7 million tons).
Concerns about constraints on sustainable food production as a result of urbanization are increasing. Domestic production patterns have already shifted from naturally rain-fed coastal areas to irrigated areas in the North China Plain and the Northeast as farmland has been converted to urban use in the central and southern coastal provinces. Urbaniza-tion is likely to further increase the amount of water needed for domestic and industrial uses, thereby increasing intersectoral com-petition for water and reducing China’s total irrigation area and crop yield (Du and others 2005; Wang and others 2008; Wen and Ding 2011).
Urbanization will also result in continued conversion of farmland to nonagricultural uses. However, although China’s agricul-tural production may decrease with the con-tinuing reduction in farmland area (F. Chen and others 2010; Z. Chen and others 2010; M. Huang, M. Chen, and Zhang 2011) and grain production potential may be threatened (Shu and Chen 2012), urbanization may also stimulate the intensification of land use and thus counteract the decrease in farmland through more efficient use of land for housing in rural and urban areas (Huang and others 2005). The comparative advantage of labor-intensive farming of grains has greatly dimin-

C h i n a ’ s U r b a n i z a t i o n a n d f o o d s e C U r i t y 339
ished. Growing labor constraints and rising input prices (labor, diesel, pesticide, farming tools) have increased the cost of food produc-tion. Land transfer costs and farm overhead costs are also rising quickly. With urbaniza-tion, rural labor will continue to move to the cities, and migration will further drive up labor and production costs in agriculture (Hu and Ni 2010; S. Li and H. Li 2012; Mu and others 2013). How these shifts will impact China’s domestic food production capacity requires careful analysis. Urbanization will also affect food demand and consumption through income growth. Overall demand for food is likely to increase with income-driven urbanization because the demand for higher-cost foods such as fruits, vegetables, and ani-mal products rises much more rapidly with income growth than demand for basic food staples such as rice and wheat. These goods require much higher levels of intermediate and factor inputs than basic staples, particu-larly for livestock products, given the ineffi-ciencies of feed conversion. China’s gradual alignment of trading patterns with compara-tive advantage following its accession to the World Trade Organization (WTO) and the surge in imports of soybeans and of corn is a reflection of these changes.
Food consumption patterns differ between China’s urban and rural residents, even at the same level of income. The aggregate impact of the change in consumption patterns on indirect grain consumption in the course of urbanization has not been well documented. Several studies have suggested that the con-sumption of staple foods decreases as people move to cities, whereas their consumption of edible oil, sugar, fruits, and animal and aquatic products increases (Huang 1999; Huang and Bouis 2001; Huang and David 1993). Food consumption surveys also show that rural migrant workers in cities consume more grain and more livestock products than rural households. Migration thus may increase grain consumption significantly as both direct demand and indirect demand for animal feed increase (Wu 2013).
The transformation from an agricultural society to an urban society has potentially important implications for access to food
because most urban households and migrat-ing rural residents tend to rely on food pur-chases rather than their own household pro-duction. Decreased reliance on agricultural income reduces the exposure of households previously engaged in farming to adverse output shocks, such as those resulting from droughts or floods, to agricultural output and incomes. However, as people move to cit-ies, households become completely dependent on purchased food. At low levels of income, they spend a large share of their incomes on food and can be very vulnerable to increases in the prices of staple foods. The food secu-rity of a household that spends 60 percent of its income on food is seriously threatened when food prices rise.
Trade can allow China to meet the rising demand for particular types of agricultural goods. Increased imports to meet domes-tic demand are well within the capacity of China’s existing trade partners in North America and South America for maize and soybeans and in Australia and New Zealand for dairy products. But policy makers have understandable concerns about large-scale reliance on imports of basic staples, particu-larly rice and wheat. Meeting the demand for basic staples will remain a strategic focus but is likely to be relatively easy for China both because per capita demand for basic staples is falling and because China’s yields continue to grow because of investments in research and development to increase productivity. Invest-ments in research and development also help to raise farmers’ incomes.
Providing adequate access to food in rural areas remains an important policy objective, but threats to food access may also increase for urban residents. There are varying levels of food security across regions within China, with some regions still facing food security issues, particularly in western poor rural areas (Nie, Bi, and Zhang 2010). Urban residents that depend on the market for all of their food needs may face risks in access-ing affordable food as food supply chains are becoming longer through regional integra-tion and more vulnerable because of fluctua-tions in transportation and energy costs. As China continues to urbanize, the implica-

340 U r b a n C h i n a
tions of urbanization on disadvantaged seg-ments of the population need to be carefully assessed with regard to food price stabiliza-tion policies and social protection programs.
Methodology
This report provides an overall assessment of the projected effects of China’s urbaniza-tion on domestic food production capacity and food demand over the next two decades. The analysis builds on extensive empirical work carried out for this study in 2013, work that built on the China Agricultural Policy Simulation Model (CAPSiM) of the Cen-ter for Chinese Agricultural Policy (CCAP). CAPSiM is a sectoral equilibrium model that covers a wide range of agricultural crops and livestock products and forecasts China’s demand for and supply of agricultural prod-ucts for the 2012–30 period. The model uses the underlying macroeconomic and demo-graphic assumptions included in supporting report 1 on urbanization and growth.
The CAPSiM simulations build on sepa-rate empirical analyses of the effects of urbanization on the markets for water, land, and labor. Impacts on agricultural water con-sumption and agricultural production are analyzed based on (a) historic trends of water usage across the agricultural, industrial, and domestic sectors; (b) quantitative analysis of the relationship between urbanization and agricultural water availability; and (c) appli-cation of the China Water Simulation Model (CWSM) to estimate changes in cropping areas and output per unit at the national and individual river basin levels. J. Huang and others (2013) describe the research approach and methodology in their background paper. The effects of urbanization on arable land conversion and agricultural bioproductiv-ity are estimated using remote sensing and econometric analyses (Deng, Huang, and Rozelle 2013). China’s rural labor market transformation and its impacts on the agri-cultural sector are described in X. Wang, Huang, and Rozelle (2013). Urbanization and its impacts on agricultural water are discussed in J. Wang, Huang, and Rozelle (2013). This report also builds on analytical work on income growth and demand for and
supply of food in China that Emiko Fukase and Will Martin (2013) of the World Bank conducted for this study.
Structure of the chapter
The chapter first provides a retrospective and outlook on China’s food demand and sup-ply in an international perspective. It then discusses the supply constraints on domes-tic agricultural production: water, land, and labor. Next it reviews the quantitative impacts of urbanization on aggregate food supply and demand and discusses the likely supply shortfalls. It concludes with a set of recommendations for China’s future food security and social protection policies.
China’s food demand and supply projection in international comparison China’s rapid economic growth since market-oriented reforms began in 1978 has con-tributed greatly to improvements in Chinese diets both in quantity and in composition. Total calorie intake per capita per day in China has grown substantially, from 2,163 kilocalories (kcal) in 1980 to 3,036 kcal in 2009. China’s growth in calorie intake has been much faster than the world average, which grew from 2,490 kcal in 1980 to 2,831 kcal in 2009. Calorie consumption levels are now reported to be approximately equal to those in Japan and in the Republic of Korea but remain lower than levels observed in the United States and in the European Union. Protein intake nearly doubled from 54 grams (g) per capita per day in 1980 to 94 g per cap-ita in 2009, with about three quarters of this growth from increased consumption of live-stock products. Fat intake nearly tripled from 34 g per capita per day in 1980 to 96 g per capita in 2009, with about two-thirds of this growth coming from increases in livestock product consumption. Calorie intake among high-income countries, namely the United States and Japan, has declined somewhat in recent years (figure 5.1).
A breakdown of the proportion of calo-ries sourced from crop and livestock prod-
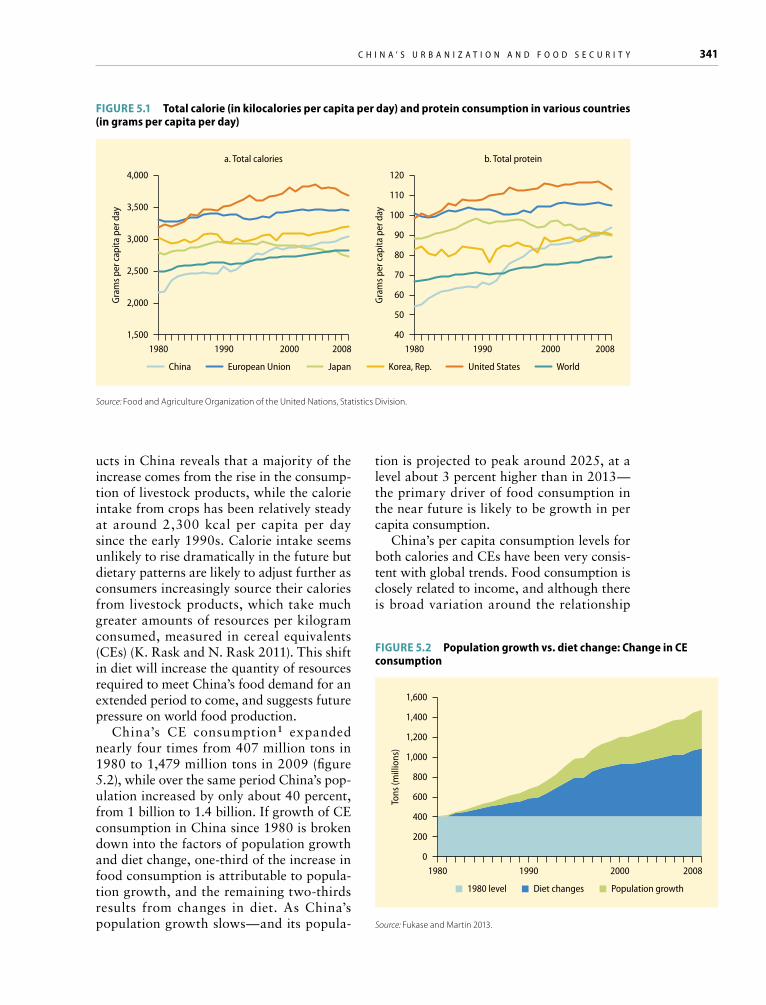
C h i n a ’ s U r b a n i z a t i o n a n d f o o d s e C U r i t y 341
ucts in China reveals that a majority of the increase comes from the rise in the consump-tion of livestock products, while the calorie intake from crops has been relatively steady at around 2,300 kcal per capita per day since the early 1990s. Calorie intake seems unlikely to rise dramatically in the future but dietary patterns are likely to adjust further as consumers increasingly source their calories from livestock products, which take much greater amounts of resources per kilogram consumed, measured in cereal equivalents (CEs) (K. Rask and N. Rask 2011). This shift in diet will increase the quantity of resources required to meet China’s food demand for an extended period to come, and suggests future pressure on world food production.
China’s CE consumption1 expanded nearly four times from 407 million tons in 1980 to 1,479 million tons in 2009 (figure 5.2), while over the same period China’s pop-ulation increased by only about 40 percent, from 1 billion to 1.4 billion. If growth of CE consumption in China since 1980 is broken down into the factors of population growth and diet change, one-third of the increase in food consumption is attributable to popula-tion growth, and the remaining two-thirds results from changes in diet. As China’s population growth slows—and its popula-
tion is projected to peak around 2025, at a level about 3 percent higher than in 2013—the primary driver of food consumption in the near future is likely to be growth in per capita consumption.
China’s per capita consumption levels for both calories and CEs have been very consis-tent with global trends. Food consumption is closely related to income, and although there is broad variation around the relationship
Source: Food and Agriculture Organization of the United Nations, Statistics Division.
Figure 5.1 Total calorie (in kilocalories per capita per day) and protein consumption in various countries (in grams per capita per day)
China European Union Japan Korea, Rep. United States World
4,000
Gram
s per
cap
ita p
er d
ay
a. Total calories
3,500
3,000
2,500
2,000
1,5001980 1990 2000 2008
120
Gram
s per
cap
ita p
er d
ay
b. Total protein
90
80
110
100
70
60
50
401980 1990 2000 2008
Figure 5.2 Population growth vs. diet change: Change in Ce consumption
Source: Fukase and Martin 2013.
1980 level Diet changes Population growth
1,600
Tons
(mill
ions
)
1,200
1,400
1,000
800
600
400
200
01980 1990 2000 2008

342 U r b a n C h i n a
between food consumption in CEs and real income levels, China’s food consumption is likely to increase substantially for some time as income levels continue to rise (figure 5.3). Consumption of calories tends to level off
much earlier and at a much lower level than consumption of CEs (figure 5.4).
China has out-performed most countries in terms of agricultural output. Output, which is only slightly below consumption levels, is substantially above the global trend level given China’s land endowment and income level. This may reflect the relatively high quality of much of China’s agricultural land and almost certainly reflects the extraor-dinary efforts made in China to increase productivity in recent decades. Agricultural output is likely to continue to increase in response to the productivity growth that is driving increases in national output. Figure 5.5 compares CE consumption with the esti-mated relationship between income levels and production. To allow for the comparison between countries, the estimated produc-tion schedule is adjusted so that each coun-try has the same per capita land endowment as China (0.21 hectares per person). This relationship implies that production rises in line with income, although less rapidly than income because of the secular decline in agri-culture’s share of national income.
Growth rates of consumption and growth rates of output are likely to be broadly com-parable as incomes grow to levels around $20,000 in purchasing power parity terms. After that level, it seems likely that the con-sumption growth will slow down relative to production and the gap between supply and demand will begin to close. This is, however, a tentative scenario. If, for instance, China reduced investments in agricultural produc-tivity, or climate change reduced productiv-ity, then the gap between supply and demand might increase.
China is also in a very different situa-tion from neighboring economies, such as Japan or Korea, where the much smaller land endowments per person require that continu-ing large net food imports are likely to be required. International comparisons reveal striking differences between countries in the extent to which food imports as a share of total consumption have changed. When rice, wheat, maize, and soybeans are consid-ered together, most lower-income countries have maintained close to 100 percent self- sufficiency, but this ratio has declined sharply
Figure 5.3 relationship between Ce food consumption and income
Source: Fukase and Martin 2013.Note: Data are based on 2005–09 averages.PPP = purchasing power parity.
Korea, Rep.
France
Thailand
JapanMalaysia
Australia
Italy
India
United Kingdom
.5
1
1.5
2
2.5
0 10,000 20,000 30,000 40,000 50,000
GDP per capita (PPP, constant 2005 int’l $)
Tonn
es p
er c
apita
per
yea
r
0
Brazil
United States
GermanySpain
China
Philippines
HungaryMexico
Indonesia
Figure 5.4 Calorie and Ce consumption trends against income in China, 1980–2009
Source: Fukase and Martin 2013.
0
5,000
10,000
20,000
15,000
0 10,000 20,000 30,000 40,000 50,000
Real GDP per capita (PPP, 2005 int’l $)
China’s calorie consumptionFitted calorie consumption
China CE consumptionFitted CE consumption
Calo
ries p
er c
apita
per
day
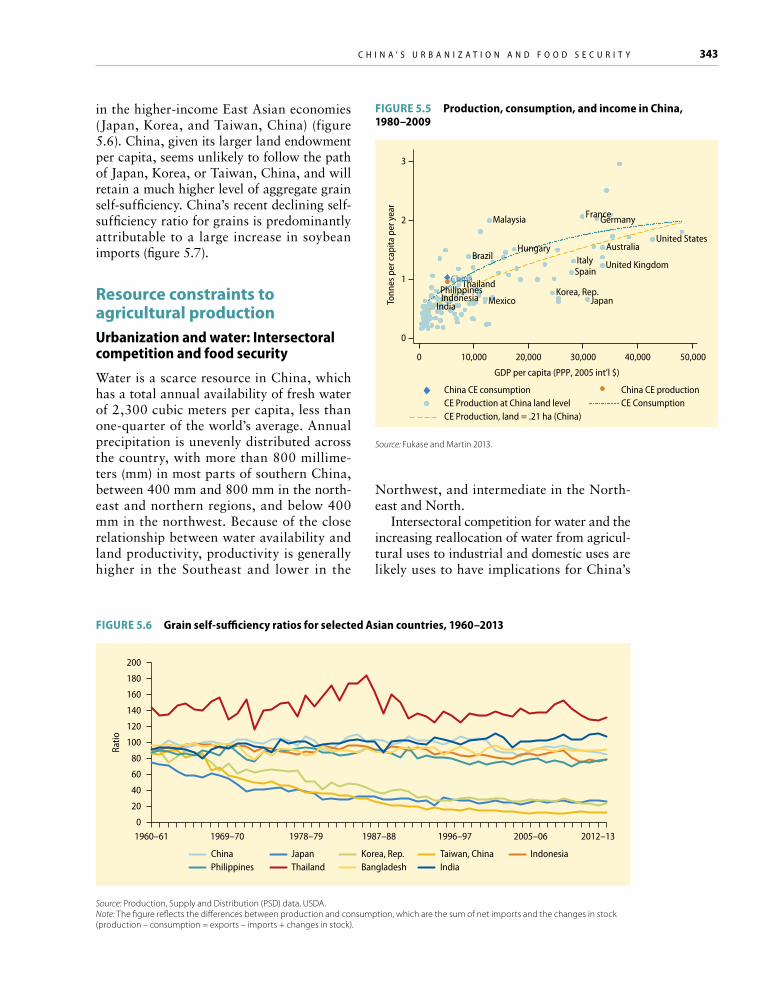
C h i n a ’ s U r b a n i z a t i o n a n d f o o d s e C U r i t y 343
in the higher-income East Asian economies (Japan, Korea, and Taiwan, China) (figure 5.6). China, given its larger land endowment per capita, seems unlikely to follow the path of Japan, Korea, or Taiwan, China, and will retain a much higher level of aggregate grain self-sufficiency. China’s recent declining self-sufficiency ratio for grains is predominantly attributable to a large increase in soybean imports (figure 5.7).
resource constraints to agricultural productionurbanization and water: intersectoral competition and food security
Water is a scarce resource in China, which has a total annual availability of fresh water of 2,300 cubic meters per capita, less than one-quarter of the world’s average. Annual precipitation is unevenly distributed across the country, with more than 800 millime-ters (mm) in most parts of southern China, between 400 mm and 800 mm in the north-east and northern regions, and below 400 mm in the northwest. Because of the close relationship between water availability and land productivity, productivity is generally higher in the Southeast and lower in the
Northwest, and intermediate in the North-east and North.
Intersectoral competition for water and the increasing reallocation of water from agricul-tural uses to industrial and domestic uses are likely uses to have implications for China’s
Figure 5.5 Production, consumption, and income in China, 1980–2009
Source: Fukase and Martin 2013.
Figure 5.6 grain self-sufficiency ratios for selected Asian countries, 1960–2013
Source: Production, Supply and Distribution (PSD) data, USDA.Note: The figure reflects the differences between production and consumption, which are the sum of net imports and the changes in stock (production – consumption = exports – imports + changes in stock).
China JapanThailand
Korea, Rep.Bangladesh
Taiwan, ChinaIndia
IndonesiaPhilippines
200
Ratio
160
180
140
100
120
60
80
40
20
01960–61 2012–131969–70 1978–79 1987–88 1996–97 2005–06
Malaysia Germany
0
1
2
3
0 10,000 20,000 30,000 40,000 50,000
GDP per capita (PPP, 2005 int’l $)
China CE consumption China CE productionCE Production at China land levelCE Production, land = .21 ha (China)
CE ConsumptionTo
nnes
per
cap
ita p
er y
ear
Korea, Rep.PhilippinesThailand
United States
JapanMexicoIndonesia
AustraliaItaly
India
United KingdomSpain
BrazilHungary
France
China

344 U r b a n C h i n a
food production capacity. Total water con-sumption in China increased from 103 billion cubic meters in 1949 to nearly 600 billion cubic meters in 2011, or by 3 percent annu-ally. The periods from 1949–65 and 1965–80 saw the biggest percentage increases. After 1993, despite further increased total demand, the rate of increase slowed (table 5.1).
Water consumption in industry and for domestic use has increased significantly faster than in the agricultural sector. In fact, dur-ing the past 20 years, water consumption in agriculture has remained constant while industrial and domestic water usage has continued to increase (figure 5.8). However, agriculture remains the biggest consumer of China’s water, accounting for 62 percent
of the country’s total water consumption in 2011 (figure 5.9). Urbanization is the driving factor contributing to rising water consump-tion through the industrial and domestic sec-tors. As China’s urban population increased from 28 percent to 51 percent from 1993 to 2011, the share of agricultural water use to total use declined from 73 percent to 62 percent (figure 5.10). As rural residents con-tinue move to cities and as living standards increase, domestic water use is likely to fur-ther increase. From 2006 to 2010, per capita
Figure 5.7 Contribution of major grains to China’s supply-demand gap, 1960–2013
Source: U.S. Department of Agriculture, Production, Supply and Distribution (PSD) data.Note: The figures reflect the differences between production and consumption, which are the sum of net imports and the changes in stock (production – consumption = exports – imports + changes in stock).
Corn Soybeans Rice Wheat
3M
etric
tons
(tho
usan
ds) 1
2
0
–2–1
–5–4–3
–6–7–81960–61 2012–131969–70 1978–79 1987–88 1996–97 2005–06
TAble 5.1 Total increase rate of water use in China by sector, 1949–2011
Period
Total increase rate (percent)
Total Agriculture Industry Domestic
1949–65 166 154 654 200
1965–80 62 45 152 1,456
1980–93 17 3 98 70
1993–2000 6 −1 26 21
2000–11 9 −1 28 37
1949–2011 481 274 5,991 13,065
Source: Ministry of Water Resources 2006–10.
Industry AgricultureDomestic
Perc
ent
0
20
4062
88
1111
2
97
24
13100
80
60
1949 1978 2011
Figure 5.8 Water use in China: Total and by sector
Source: J. Wang and others 2013.

C h i n a ’ s U r b a n i z a t i o n a n d f o o d s e C U r i t y 345
water use for urban residents was 208 liters, already three times that for rural residents (Ministry of Water Resources 2006–10). Based on the CWSM projection results,2 a 1 percentage point increase in China’s urban population will result in a 0.47 percent decline in the share of agricultural water con-sumption because of intersectoral realloca-tion. By 2030, according to the CWSM, agri-culture’s share of total water consumption will have decreased to 52 percent.
China’s total water shortage is estimated to have reached 48.7 billion cubic meters, indicating that 8 percent of China’s total water demand cannot be satisfied by the country’s water supply, given current water resource management policies. Water scar-city is more pronounced in China’s northern river basins, including the Hai, Huai, Liao, Songhua, and Yellow rivers. Water scarcity is expected to increase significantly in China; the overall water supply gap is projected to increase from today’s 8 percent to 38 percent in 2030. Water demand increases are pro-jected for all river basins in response to urban and industrial growth, population growth, and planned expansion of irrigated areas. China’s major rivers basins are displayed in map 5.1. Water supply and water balance data for the 10 major river basins in China are summarized in table 5.2.
Through domestic food trade and the expansion of irrigated areas in northern and northeastern China, about 52 billion cubic meters of water are transferred annually, in virtual form, through agricultural products to the southern provinces. If the amount of water lost through evapotranspiration is not replenished, crop water use will result in a localized net water loss and will become unsustainable. Overuse of available water resources has resulted in severe groundwater depletion, with the deep water aquifer under the North China plain, for example, already dropping at about 3 meters per year. About half of the communities using ground water in the northern plains reported a decline in ground water levels between the mid-1990s and mid-2000s (Lohmar and Hansen 2007; J. Wang, Huang, and Yang 2009).
Agricultural water demand will increase in all 10 river basins between 2010 and 2030,
from an estimated 11 percent in the Huai river basin to as high as 30 percent in the Yellow river basin. Particularly large supply short-falls are projected for the Hai, Yellow, Yang-tze, and Southeast river basins. Water con-sumption in the industry sector is projected to grow by 170 percent over current consump-tion, nearly 10 times faster than water con-sumption growth in the domestic and agricul-tural sectors. In the Yangtze and Southeast river basins, total water demand will increase by 70 percent and 82 percent, respectively
Total Agriculture Industry Domestic
7,000
Cubi
c m
eter
s (m
illio
ns)
6,000
5,000
4,000
3,000
2,000
1,000
01949 1993 2000 2004 2010
Figure 5.9 Sectoral shares of China’s total water consumption
Source: J. Wang and others 2013.
Figure 5.10 Trends in agricultural sector water consumption and urbanization
Source: J. Wang and others 2013.
Agriculturalwater use
Urbanizationrate
60
80
70
100
90
50
Perc
ent
40
30
20
10
01993 1996 1999 2002 20082005 2011
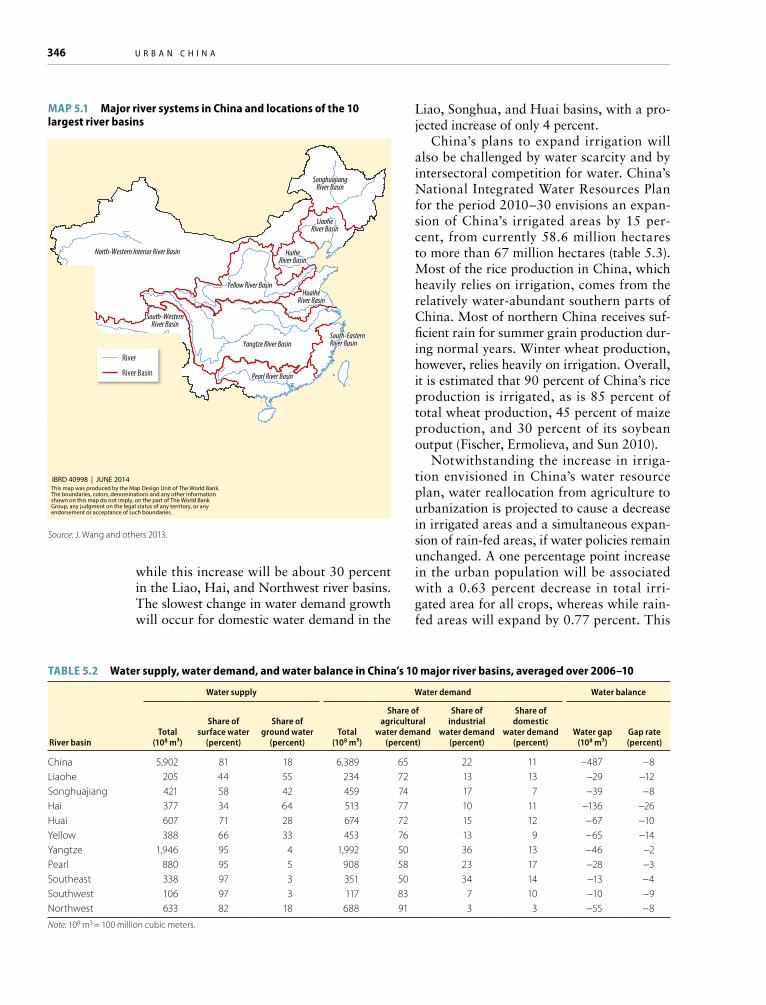
346 U r b a n C h i n a
while this increase will be about 30 percent in the Liao, Hai, and Northwest river basins. The slowest change in water demand growth will occur for domestic water demand in the
Liao, Songhua, and Huai basins, with a pro-jected increase of only 4 percent.
China’s plans to expand irrigation will also be challenged by water scarcity and by intersectoral competition for water. China’s National Integrated Water Resources Plan for the period 2010–30 envisions an expan-sion of China’s irrigated areas by 15 per-cent, from currently 58.6 million hectares to more than 67 million hectares (table 5.3). Most of the rice production in China, which heavily relies on irrigation, comes from the relatively water-abundant southern parts of China. Most of northern China receives suf-fi cient rain for summer grain production dur-ing normal years. Winter wheat production, however, relies heavily on irrigation. Overall, it is estimated that 90 percent of China’s rice production is irrigated, as is 85 percent of total wheat production, 45 percent of maize production, and 30 percent of its soybean output (Fischer, Ermolieva, and Sun 2010).
Notwithstanding the increase in irriga-tion envisioned in China’s water resource plan, water reallocation from agriculture to urbanization is projected to cause a decrease in irrigated areas and a simultaneous expan-sion of rain-fed areas, if water policies remain unchanged. A one percentage point increase in the urban population will be associated with a 0.63 percent decrease in total irri-gated area for all crops, whereas while rain-fed areas will expand by 0.77 percent. This
MAP 5.1 Major river systems in China and locations of the 10 largest river basins
Source: J. Wang and others 2013.
TAble 5.2 Water supply, water demand, and water balance in China’s 10 major river basins, averaged over 2006–10
River basin
Water supply Water demand Water balance
Total (108 m³)
Share ofsurface water
(percent)
Share ofground water
(percent)Total
(108 m³)
Share of agricultural
water demand (percent)
Share of industrial
water demand (percent)
Share of domestic
water demand (percent)
Water gap (108 m³)
Gap rate (percent)
China 5,902 81 18 6,389 65 22 11 −487 −8 Liaohe 205 44 55 234 72 13 13 −29 −12 Songhuajiang 421 58 42 459 74 17 7 −39 −8 Hai 377 34 64 513 77 10 11 −136 −26 Huai 607 71 28 674 72 15 12 −67 −10 Yellow 388 66 33 453 76 13 9 −65 −14 Yangtze 1,946 95 4 1,992 50 36 13 −46 −2 Pearl 880 95 5 908 58 23 17 −28 −3 Southeast 338 97 3 351 50 34 14 −13 −4 Southwest 106 97 3 117 83 7 10 −10 −9 Northwest 633 82 18 688 91 3 3 −55 −8
Note: 108 m3 = 100 million cubic meters.
North-Western Interior River Basin
South-WesternRiver Basin
Pearl River Basin
Yangtze River Basin
Yellow River BasinHuaihe
River Basin
HaiheRiver Basin
LiaoheRiver Basin
SonghuajiangRiver Basin
South-EasternRiver Basin
North-Western Interior River Basin
South-WesternRiver Basin
Pearl River Basin
Yangtze River Basin
Yellow River BasinHuaihe
River Basin
HaiheRiver Basin
LiaoheRiver Basin
SonghuajiangRiver Basin
South-EasternRiver Basin
IBRD 40998 | JUNE 2014This map was produced by the Map Design Unit of The World Bank.The boundaries, colors, denominations and any other informationshown on this map do not imply, on the part of The World BankGroup, any judgment on the legal status of any territory, or anyendorsement or acceptance of such boundaries.
River
River Basin

C h i n a ’ s U r b a n i z a t i o n a n d f o o d s e C U r i t y 347
trend is projected across all river basin areas but would be most pronounced in the Song-hua River Basin, where the respective change will be a decrease of 2.04 percent of irrigated areas and an expansion of rain-fed areas by 0.56 percent is projected. Irrigation area expansion targets may be difficult to achieve.
For China as a whole, average crop yield is projected to decrease by 0.09 percent per 1 percentage point increase in China’s urban population, but the effects of urbanization on irrigated and rain-fed areas will differ between regions. Generally, productivity of irrigated areas is greater than that of rain-fed areas. Wheat will face the sharpest decline trend for its irrigated areas, with a projected decrease of as much as 2.61 percent, while its rain-fed areas will increase by 4.37 percent, resulting in an estimated net yield reduction of 0.6 percent. The other important crops whose irrigated areas will be reduced are oil crops and rice. Their irrigated areas will be reduced by 1.61 percent and 0.68 percent, respectively. In contrast, irrigated areas of soybean crops may increase by 3.56 percent, probably resulting from economic incentives for soybean production on irrigated land in view of an overall reduction in water avail-able for agriculture.
China’s urbanization will significantly reduce agricultural water use, all other things being equal. Every 2 percentage point increase in the urbanization rate is accom-panied by a 1 percentage point drop in the availability of water for agricultural use. Improving water resources management in the agricultural sector will therefore become even more important in the coming decade. Wang and others (2005) estimate that only 40 percent of the water allocated to irrigation in China is actually used. And the potential for improvement is even greater given that much of this 40 percent is used very inten-sively, such as for flood irrigation. During the 2000s, the amount of irrigation water—0.96 cubic meters—used to produce 1 kilogram (kg) of grain was twice the amount used in developed countries (Zhao and others 2008). Given the great potential for improved water use efficiency in China, there may actually be no need for the increased competition for water from the expanding urban sec-
tor to result in any reduction in agricultural output.
However, to really use water more effi-ciently, it is not sufficient to identify changes in water use technology, such as moving from flood to spray or drip irrigation, or to advo-cate a move toward greater use of those tech-nologies. Unless farmers have an incentive to move toward more efficient, and typically more costly, forms of irrigation, they will be extremely reluctant to do so. However, inter-national experience has shown that introduc-ing the right management system can allow a large expansion in irrigated area with the same water supply (Easter and Liu 2005).
One way to increase water use efficiency is to introduce pricing schemes that reduce the gap between what agricultural and nonagri-cultural users pay for water, as well as reduce the costs associated with the distribution of water to its point of use. The reallocation of water from low-valued uses to high-valued uses is the key to achieving greater output from the available water. While retaining these advantages, water pricing schemes can be modified to avoid creating large redis-tributions of income—and particularly to avoid hurting poor users—by policies such as charging much less on an initial block of water.
If introducing water pricing is not politi-cally feasible, alternative arrangements, such as water users’ associations, can be used to improve the efficiency of water use within
TAble 5.3 Planned expansion of irrigation areas
River basin 2010
(million hectares)2030
(million hectares)Planned expansion
(percent)
China 58.6 67.2 15
Liao River 2.6 3.0 13
Songhua River 5.2 6.1 17
Hai River 7.6 8.6 14
Huai River 11.1 11.9 7
Yellow River 5.3 6.8 28
Yangtze River 15.0 17.2 14
Pearl River 4.3 5.0 14
Southeast River 2.1 2.3 13
Southwest River 0.9 1.1 18
Northwest River 4.4 5.3 20
Sources: Ministry of Water Resources 2006–10, National Integrated Water Resources Plan 2010–30.

348 U r b a n C h i n a
irrigation districts. Wang and others (2005) find that these have been effective in reduc-ing irrigation water consumption where they have been implemented in ways that pro-vide incentives for reductions in water use. Further progress on water use reform could substantially reduce water consumption and potentially allow significant increases in agri-cultural output by allowing expansion of irri-gation in some areas.
Migration and rural labor, wages, and mechanization
Urbanization affects agricultural labor avail-ability and agricultural production in com-plex ways. Labor costs in agriculture rise because of growing demand for rural labor. Movement of labor out of agriculture is an inherent and unavoidable part of the process of economic growth and urbanization. Con-sumption patterns within the country shift, and the share of spending on food drops precipitately. Increased investment in the nonagricultural sector creates jobs and cre-ates incentives for workers to move. Migra-tion out of rural areas into China’s cities may also be stimulated by progress on reform of the hukou system3 and of land titling, which would provide more flexibility for migrants to integrate into cities permanently. At the same time, rural township development may help offset or balance increases in rural labor costs. Rising wages also accelerate the process of mechanization of agriculture. If machines can replace farmers that are leav-ing the agricultural sector, production need not be affected. In many areas across China, however, mechanization will remain a sig-nificant challenge and its potential may be limited because of topographical conditions, such as small farmland plot size and inac-cessibility in mountainous areas. Such con-straints to mechanization will likely have negative impacts on agricultural production as rural people move to the cities.
Migration and off-farm employment
Rural to urban migration and the emergence of off-farm employment have been important in China’s transformation over the past two decades. The rise of off-farm employment
has been a particularly prominent feature of China, emerging in the 1980s and 1990s. In the early 1980s, only 15 percent of China’s rural labor force had a job off the farm (NSBC 2000). By 2000, the share of farmers working off the farm had reached 45 percent. Another decade later, by 2011, more than 60 percent of China’s rural labor force worked off the farm (figure 5.11). In absolute terms, of China’s 500 million rural laborers, more than 218 million worked off the farm, full or part-time, in 2000. Nearly 320 million worked off-farm in 2011.
Many of these farmers found employment in the wage-earning sector. They also found or created off-farm jobs in the nonfarm self-employed sector (Zhang and others 2006). Between 1980 and 2000, the number of rural workers that left home and found a wage-earning job rose from 9.3 million to 56.0 million (de Brauw and others 2002). An esti-mated 60 million rural workers remained at home working in township and village enter-prises for a wage during this time (NSBC 1990, 2000). The number of farmers who started nonfarm self-employed enterprises rose from 26 million to nearly 80 million between 1980 and 2000. By 2000, there were far more self-employed migrants than migrant wage earners. Migration expanded steadily and accelerated throughout the 2000s. Although the global economic crisis of 2008 had some effect on migration, the
Figure 5.11 Percentage of rural labor employed off the farm, 1995–2011
Source: X. Wang, Huang, and Rozelle 2013.
Complete sample
50
60
70
40
% o
f wor
kfor
ce
30
20
10
01995 1999 2003 2007 2011
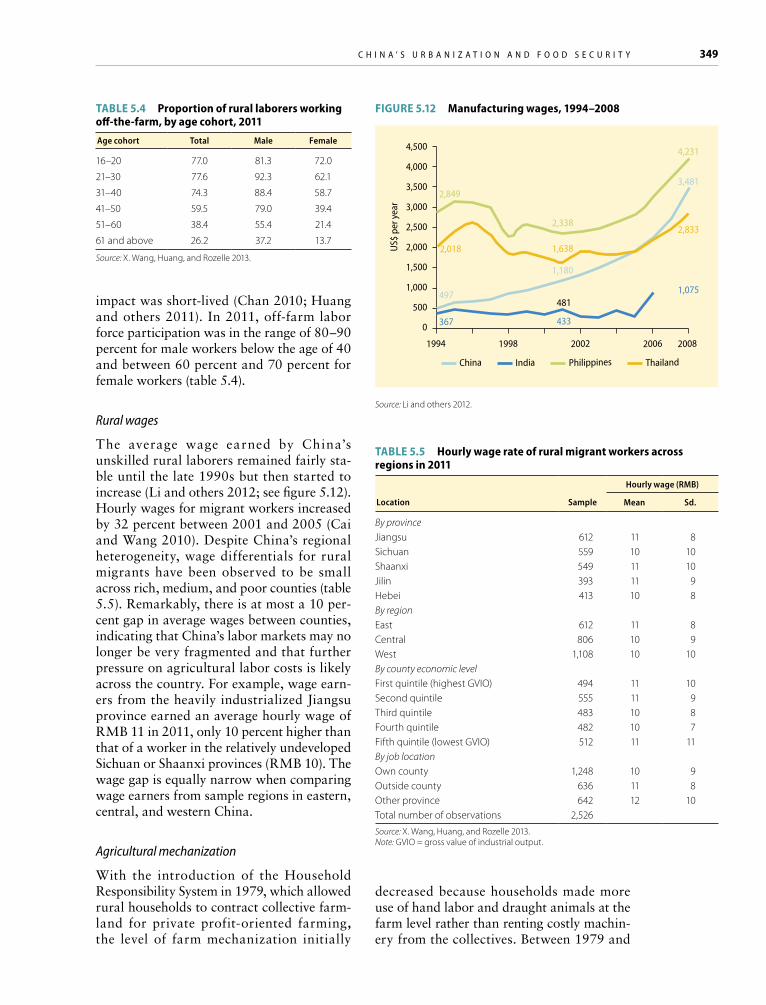
C h i n a ’ s U r b a n i z a t i o n a n d f o o d s e C U r i t y 349
impact was short-lived (Chan 2010; Huang and others 2011). In 2011, off-farm labor force participation was in the range of 80–90 percent for male workers below the age of 40 and between 60 percent and 70 percent for female workers (table 5.4).
Rural wages
The average wage earned by China’s unskilled rural laborers remained fairly sta-ble until the late 1990s but then started to increase (Li and others 2012; see figure 5.12). Hourly wages for migrant workers increased by 32 percent between 2001 and 2005 (Cai and Wang 2010). Despite China’s regional heterogeneity, wage differentials for rural migrants have been observed to be small across rich, medium, and poor counties (table 5.5). Remarkably, there is at most a 10 per-cent gap in average wages between counties, indicating that China’s labor markets may no longer be very fragmented and that further pressure on agricultural labor costs is likely across the country. For example, wage earn-ers from the heavily industrialized Jiangsu province earned an average hourly wage of RMB 11 in 2011, only 10 percent higher than that of a worker in the relatively undeveloped Sichuan or Shaanxi provinces (RMB 10). The wage gap is equally narrow when comparing wage earners from sample regions in eastern, central, and western China.
Agricultural mechanization
With the introduction of the Household Responsibility System in 1979, which allowed rural households to contract collective farm-land for private profit-oriented farming, the level of farm mechanization initially
TAble 5.4 Proportion of rural laborers working off-the-farm, by age cohort, 2011Age cohort Total Male Female
16–20 77.0 81.3 72.0
21–30 77.6 92.3 62.1
31–40 74.3 88.4 58.7
41–50 59.5 79.0 39.4
51–60 38.4 55.4 21.4
61 and above 26.2 37.2 13.7
Source: X. Wang, Huang, and Rozelle 2013.
TAble 5.5 Hourly wage rate of rural migrant workers across regions in 2011
Hourly wage (RMB)
Location Sample Mean Sd.
By provinceJiangsu 612 11 8Sichuan 559 10 10Shaanxi 549 11 10Jilin 393 11 9Hebei 413 10 8By regionEast 612 11 8Central 806 10 9West 1,108 10 10By county economic levelFirst quintile (highest GVIO) 494 11 10Second quintile 555 11 9Third quintile 483 10 8Fourth quintile 482 10 7Fifth quintile (lowest GVIO) 512 11 11By job location Own county 1,248 10 9 Outside county 636 11 8 Other province 642 12 10 Total number of observations 2,526
Source: X. Wang, Huang, and Rozelle 2013.Note: GVIO = gross value of industrial output.
Figure 5.12 Manufacturing wages, 1994–2008
Source: Li and others 2012.
4,500
367
497
2,018
2,849
481
433
1,180
1,638
2,338
4,231
3,481
2,833
1,075
4,000
3,500
3,000
2,500
2,000
1,500
1,000
500
0
1994 1998
China India Philippines Thailand
2002 2006 2008
US$
per y
ear
decreased because households made more use of hand labor and draught animals at the farm level rather than renting costly machin-ery from the collectives. Between 1979 and

350 U r b a n C h i n a
1983, the area of mechanically plowed land declined by around 8 million hectares. But as off-farm employment become promi-nent in the 1990s, China’s farmers restarted mechanization. Over the past two decades, the area of land mechanically plowed has doubled, growing at an annual rate of more than 3 percent. In 2011 more than 72 percent of cultivated land was plowed mechanically. Mechanically sown areas doubled during the 1990s while those with mechanical harvest-ing almost tripled. In 2011, more than 40 percent of cultivated land was mechanically sown and harvested (figure 5.13).
The process of mechanization is driven by changes in relative prices, particularly the wage rate of off-farm labor. Average on-farm labor cost grew by 8 percent annually between 1997 and 2008, and wage growth has since accelerated to more than 10 percent (figure 5.14). Wage growth in the manufac-turing sector and expansion of mechaniza-tion in agriculture have been on similar trend paths, in line with findings for developed countries, such as Japan and Korea (Otsuka 2013). Investments in agricultural machin-ery and migration are also closely related (de Brauw and Rozelle 2008; Li and others 2012; Taylor, Rozelle, and de Brauw 2003).
Labor-saving technology allows labor to be used for nonfarm activities and to access new sources of income. It also changes the
Figure 5.13 Trends in mechanical operation, 1970–2011
Source: X. Wang, Huang, and Rozelle 2013.
Mechanically plowing area(left axis)
The share of mechanically plowingarea to total cultivated area (right axis)
Mechanically sowing area(left axis)
The share of mechanically sowingarea to total sown area (right axis)
Mechanically reaping area(left axis)
The share of mechanically reapingarea to total sown area (right axis)
1985 1995
Year
2005
1985 1995
Year
2005
1985 1995
Year
2005
80
Ha (m
illio
ns)
60
70
50
40
30
20
10
0
40
45
50
Perc
ent30
35
25
20
15
10
5
01980 1990 2000 2010
b. Mechanical sowing
80
Ha (m
illio
ns)
6070
110
90100
5040302010
0
80
Perc
ent
60
70
50
40
30
20
10
0198019751970 1990 2000 2010
a. Mechanical plowing
Ha (m
illio
ns)
60
70
50
40
30
20
10
0
40
45
Perc
ent
30
35
25
20
15
10
5
01980 1990 2000 2010
c. Mechanical harvestingFigure 5.14 Average daily cost of on-farm labor, 1997–2012
Source: National Development and Reform Commission (NDRC) Cost and Revenue in Agricultural Production database.
50
40
RMB
per d
ay (c
onst
ant 2
005
pric
es)
30
20
10
01997 2000 2003 20092006 2012

C h i n a ’ s U r b a n i z a t i o n a n d f o o d s e C U r i t y 351
composition of the labor input in produc-tion. Under pressure from on-farm labor costs, the number of days that China’s farm-ers have devoted to on-farm work has fallen substantially. By the mid-2000s, the aver-age labor days per hectare had fallen to less than 100 days per hectare, less than half the amount used in the 1990s (de Brauw and others 2013). In grain production, the labor input in 2012 was less than half of that in 1997. In soybean production, the number of total working days on one unit of land (mu, a Chinese unit equivalent to about 667 square meters) was only three days in 2012. Even for labor-intensive crops, such as cotton, veg-etables, and fruit, on-farm work days have declined at an annual rate of 2–4 percent (figure 5.15). Mechanization has increased rapidly across all crops, particularly after 2003. Measured by expense per mu (RMB/mu) and as a share of expenses on machin-ery to total input (excluding labor and land), China’s smallholders are increasingly sub-stituting agricultural machinery for labor to organize farm production (figures 5.16 and 5.17). Small-size machinery generally domi-nates current mechanization trends, as a con-sequence of small farm sizes, land fragmen-tation, and weak land rental markets that slow down consolidation. Privately operated machinery services, so-called specialized cus-tom plowers, planters and harvesters teams, have emerged widely across China.
In some areas, mechanization and tech-nological improvements that raise yields will allow agriculture to retain labor. In other areas, where mechanization is more difficult, it will be difficult to adjust to higher wage rates.
The shift in labor input in agricultural pro-duction also shows clear gender traits. Female labor on average dominated in both rice and wheat production from 2002 to 2010, except 2010 (in wheat production). Female farmers work more days on-farm than male farm-ers across all farm activities, including sow-ing, spraying pesticide, and weeding. Despite the overall reduction in on-farm labor input, there are clear signs that China’s smallholder agricultural production has become more dominated by female farmers since the early 2000s (de Brauw and others 2013).
Under the government’s agricultural mechanization policy, subsidies for agricul-tural machinery increased dramatically from RMB 0.07 billion in 2004 to RMB 21.5 bil-lion in 2012. On average, 7.3 percent of the total purchase price of farm machinery is covered by government subsidies (table 5.6). However, machinery purchase is motivated less by government subsidies and more by
Figure 5.15 Trends in labor input by commodity, 1997–2012
Source: NDRC Cost and Revenue in Agricultural Production database.
Rice Wheat CornSoybean Rapeseed CottonSugarcane Apple Vegetable
70
80
day/
mu
60
50
40
30
20
10
01997 2000 2003 2006 2009 2012
Figure 5.16 expenditures on mechanization by commodity, 1997–2012
Source: NDRC Cost and Revenue in Agricultural Production database.
Rice Wheat CornSoybean Rapeseed CottonSugarcane Apple Vegetable
140
RMB/
mu
120
100
80
60
40
20
01997 2000 2003 2006 2009 2012

352 U r b a n C h i n a
the need to save labor and to allow house-hold members remaining in the countryside to transfer their labor to other activities.
urbanization, arable land, and land productivity
One of the links between urbanization and agriculture that has received the most atten-tion is the conversion of agricultural into urban land. This process is very complex, involving higher-density urban living areas replacing lower density rural living areas, the transfer of land from agricultural to urban uses, and even new land entering agriculture. A key issue in making an assessment is the need to compare the productivity of different
types of land. China has succeeded in retain-ing sufficient arable land for agricultural production and in supplying land for urban-ization at the same time. But China has also experienced significant changes in its arable land over the past two decades, with both the conversion of agricultural land to urban and industrial uses and the conversion of nonfarmland into arable land, which requires careful analysis of the aggregate combined effects. Overall, the changes in total arable land area have slightly reduced China’s agri-cultural production potential (or bioproduc-tivity), as high-value farmland in eastern coastal provinces was converted to nonagri-cultural use while other land, often of lower quality, was reclaimed for farming in other regions of China.
Between 1988 and 2000, China recorded a net increase of cultivated land of 1.9 per-cent, which almost offset the decrease of 2.2 percent in agricultural production potential (bioproductivity) through land conversion. During this period, 3.06 million hectares of farmland were converted to nonfarm uses, accounting for 2.2 percent of China’s total cultivated land (figure 5.18). The annual aver-age conversion rate was 0.16 percent over this period. About 38 percent (or 1.2 million hect-ares; 0.08 percent of total cultivated land) of this land was converted to built-up areas, 17 percent was converted to forestland, 30 per-cent to grassland, and 16 percent to other types of land. At the same time, 5.7 million hectares of new farmland was created, a gross expansion of 4.1 percent. Grassland conver-sion accounted for 55 percent of the newly created cultivated land, forestland for 28 per-cent, and reclaimed wetland or wasteland for around 17 percent. Overall, China’s agricul-
Figure 5.17 Share of mechanization expenditure to total expenditure on physical input by different crops, 1997–2012
Source: NDRC Cost and Revenue in Agricultural Production database.
Rice Wheat CornSoybean Rapeseed CottonSugarcane Apple Vegetable
35
40
Perc
ent
30
25
20
15
10
5
01997 2000 2003 2006 2009 2012
TAble 5.6 Machinery subsidies in China, 2008
Categories
Householdsthat
purchasedmachinery
Averageexpenditure
on machinery(RMB)
Number ofhouseholds with
machinerySubsidies
Machinerysubsidy (RMB)
Proportion of subsidy
to total expense (%)
Lower quartile (< RMB 60 ) 59 42.9 0 0.0 0.0
Median (RMB 60–400 ) 50 176.6 0 0.0 0.0
3rd quartile (RMB 400–2,055 ) 53 1,078.9 1 400.0 44.4
Upper quartile (> RMB 2,055) 54 8,366.5 6 3,313.3 24.4Overall 216 2,408.9 7 2,897.1 7.3
Source: X. Wang, Huang, and Rozelle 2013.

C h i n a ’ s U r b a n i z a t i o n a n d f o o d s e C U r i t y 353
tural production potential declined slightly by 0.3 percent between 1988 and 2000.
In comparison, from 2000 to 2008, total cultivated land area decreased by 0.47 per-cent, and agricultural production potential declined by 1.70 percent. A total of 1.24 mil-lion hectares of farmland was converted to nonagricultural use, at an annual rate of 0.16 million hectares. At the same time, 0.66 mil-lion hectares of farmland was newly created, resulting in a net loss of 0.58 million hectares of cultivated land (figure 5.19). Compared to the previous period, the share of cultivated land converted into built-up areas to total land conversion increased significantly.
A large share of the conversion of farm-land to nonfarm uses, particularly in built-up areas, has occurred in China’s coastal prov-inces and around large cities. The munici-palities of Beijing and Shanghai and Zhejiang province saw conversion rates above 5 percent during 1986–2000. But since these jurisdic-tions are small in comparison to other prov-inces, the loss of farmland represented less than 0.2 percent of China’s total cultivated area. During 2000–08, Shanghai and Shan-dong experienced the highest conversion rates and net loss in farmland. Chengdu, Chongq-ing, Xian, and other provincial capitals also
saw high conversion rates to urban industrial, infrastructure, and residential uses. During the same period, large areas of farmland, often farmland of marginal productivity in upland areas, was converted to forested areas in the course of the government’s National Slopeland Conversion Program.
During 1988–2000, large tracts of wet-lands and other noncultivated lands were converted to farmland in northeast China, especially in Heilongjiang province. Com-pared to this period, fewer tracts of land were converted to cultivated land during 2000–08, as maps 5.2 through 5.5 show. Such conver-sion slowed considerably although additional farmland was still created in northwestern China, the western parts of Xinjiang, and Heilongjiang.
Overall, China’s agricultural production potential has changed as a result of the con-version of various types of land of varying soil quality conditions into and out of cultivation across the different regions of China (box 5.1). During 1988–2000, the impact of land conversion on China’s agricultural produc-tion potential was negligible but after 2000, the net change in potential agricultural pro-ductivity became more important. Between 2000 and 2008, aggregated for China’s total
Figure 5.18 land conversion trends, 1988–2000 Figure 5.19 land conversion trends, 2000–08
Source: Deng, Huang, and Rozelle 2013.
Total
Forestry area
Grassland
Water area
Built-up area
Unused land
Ha (millions)
0–2 –1 21 3 54 6 7
Cultivated land being converted to:Cultivated land being converted from:Net change
Source: Deng, Huang, and Rozelle 2013.
Total
Forestry area
Grassland
Water area
Built-up area
Unused land
Ha (millions)
0–1.0 –0.5 1.00.5 1.5
Cultivated land being converted to:Cultivated land being converted from:Net change

354 U r b a n C h i n a
cultivated area, the total production potential fell by 32.9 billion kcal, or by around 1.7 per-cent, as compared to only 5.8 billion kcal (or 0.3 percent) during 1988–2000) (table 5.7).
About 97 percent of the decrease in agri-cultural production potential between 2000 and 2008 was due to the conversion of high-quality cultivated land to built-up areas. This high percentage is because mostly high qual-ity (plain) farmland was being converted to nonfarming uses. The decline in production potential was also because much of this land is located in southeastern and eastern prov-inces where climatic conditions allow for two planting seasons per year. Land in the south and east is also less steep and receives more precipitation. Developed areas in the North China Plain, including Beijing and Tianjin municipalities, also experienced large declines in production potential (fi gure 5.20).
The recent conversion of cultivated land into built-up areas has not compromised China’s ability to feed itself. China has also retained its capacity to improve agricultural production through conversion of nonfarm-land into farmland and through increasing yields and productivity on existing culti-vated land. From the perspective of China’s national food security, a ban on land con-version is not warranted. However, rural land conversions rates have continued and even accelerated during the past five years (2008–12) and pressure on China’s farmland resources will inevitably continue as the con-version of cultivated land to other uses con-tinues in the urbanization process. Simula-tion results indicate that a 1 percentage point increase in China’s urbanization rate will cause a decline of 0.065 percent of China’s cultivated area and a 0.067 percent decline in China’s agricultural production potential.
In general, the conversion of land for pur-poses of higher economic value than agri-culture is a natural element of the urbaniza-tion process. China therefore needs careful management and planning to facilitate more rational land use in both the short and long term, given the likely pressures to continue to convert land. Good development policy, in general, and food policy, in particular, will not demand halting the conversion of culti-vated land but rather require that the process
MAP 5.2 land conversion: From cultivated land to other uses, 1988–2008
MAP 5.3 land conversion: From cultivated land to other uses, 2000–08
BEIJINGNei Mongol
Tianjin
Shanghai
Xinjiang
Qinghai
XizangSichuan
GansuShaanxi
Shanxi
Henan
Guizhou
YunnanGuangxi
Hunan
Hubei
Guangdong
Hebei
Shandong
Jiangsu
Anhui
Zhejiang
JiangxiFujian
Taiwan
Hainan
Liaoning
Jilin
Heilongjiang
Ningxia
Chongqing
BEIJINGNei Mongol
Tianjin
Shanghai
Xinjiang
Qinghai
XizangSichuan
GansuShaanxi
Shanxi
Henan
Guizhou
YunnanGuangxi
Hunan
Hubei
Guangdong
Hebei
Shandong
Jiangsu
Anhui
Zhejiang
Jiangxi
Hong Kong SAR
Fujian
Taiwan
Hainan
Liaoning
Jilin
Heilongjiang
Macao SAR
Ningxia
Chongqing
IBRD 40999 | JUNE 2014This map was produced by the Map Design Unit of The World Bank.The boundaries, colors, denominations and any other informationshown on this map do not imply, on the part of The World BankGroup, any judgment on the legal status of any territory, or anyendorsement or acceptance of such boundaries.
Cultivated land converted to:
Forestry area
Grassland
Water area
Built-up area
Unused land
no data
BEIJINGNei Mongol
Tianjin
Shanghai
Xinjiang
Qinghai
XizangSichuan
GansuShaanxi
Shanxi
Henan
Guizhou
YunnanGuangxi
Hunan
Hubei
Guangdong
Hebei
Shandong
Jiangsu
Anhui
Zhejiang
JiangxiFujian
Taiwan
Hainan
Liaoning
Jilin
Heilongjiang
Ningxia
Chongqing
BEIJINGNei Mongol
Tianjin
Shanghai
Xinjiang
Qinghai
XizangSichuan
GansuShaanxi
Shanxi
Henan
Guizhou
YunnanGuangxi
Hunan
Hubei
Guangdong
Hebei
Shandong
Jiangsu
Anhui
Zhejiang
Jiangxi
Hong Kong SAR
Fujian
Taiwan
Hainan
Liaoning
Jilin
Heilongjiang
Macao SAR
Ningxia
Chongqing
IBRD 41000 | JUNE 2014This map was produced by the Map Design Unit of The World Bank.The boundaries, colors, denominations and any other informationshown on this map do not imply, on the part of The World BankGroup, any judgment on the legal status of any territory, or anyendorsement or acceptance of such boundaries.
Cultivated land converted to:
Forestry area
Grassland
Water area
Built-up area
Unused land
no data

C h i n a ’ s U r b a n i z a t i o n a n d f o o d s e C U r i t y 355
of conversion is done rationally and that the productivity of the remaining resources in the agricultural sector is improved.
Supply, changing consumption, and demandProjecting agricultural production, output, and supply under urbanization
Despite resource constraints, the aggregate effects of China’s urbanization on the domes-tic production of major agricultural products are projected to be modest. China’s urban population is projected to reach 67 percent of the total population by 2030, increasing by roughly 1 percentage point per year. Urban-ization will affect the availability of agri-cultural production factors, such as water, land, and labor and will have an impact on agricultural production, in various ways, as discussed in the previous section. China’s agriculture will also face challenges asso-ciated with high environmental pollution levels. A one percentage point increase in China’s urban population—after taking into account the combined effects of urbaniza-tion on agricultural water distribution and availability, arable land loss through conver-sion and changes in bioproductivity, rising rural wages, and other factors—is projected to result in a 0.18 percent decrease in total domestic grain output to 2020 (table 5.8). Water redistribution between sectors, farm-land conversion, and rising labor costs will contribute equally to this decrease in grain output. As China’s urban population rises to 67 percent by 2030 (from 52 percent in 2012) total domestic grain output is pro-jected to decline by about 2.7 percent from 2012 levels.
The impact of resource constraints will vary from crop to crop. Domestic rice production will suffer most, with output declining by 0.34 percent to 2020 for each 1 percentage point increase in the urban population, mainly because of the change in water distribution, which contributes nearly three quarters to the fall in output. Outputs of wheat and corn are projected to decrease slightly, by 0.17 percent and 0.18 percent respectively, by 2020 against the 2012 base-
MAP 5.4 land conversion: From other uses to cultivated land, 1988–2000
MAP 5.5 land conversion: From other uses to cultivated land, 2000–08
BEIJINGNei Mongol
Tianjin
Shanghai
Xinjiang
Qinghai
XizangSichuan
GansuShaanxi
Shanxi
Henan
Guizhou
YunnanGuangxi
Hunan
Hubei
Guangdong
Hebei
Shandong
Jiangsu
Anhui
Zhejiang
JiangxiFujian
Taiwan
Hainan
Liaoning
Jilin
Heilongjiang
Ningxia
Chongqing
BEIJINGNei Mongol
Tianjin
Shanghai
Xinjiang
Qinghai
XizangSichuan
GansuShaanxi
Shanxi
Henan
Guizhou
YunnanGuangxi
Hunan
Hubei
Guangdong
Hebei
Shandong
Jiangsu
Anhui
Zhejiang
Jiangxi
Hong Kong SAR
Fujian
Taiwan
Hainan
Liaoning
Jilin
Heilongjiang
Macao SAR
Ningxia
Chongqing
IBRD 41001 | JUNE 2014This map was produced by the Map Design Unit of The World Bank.The boundaries, colors, denominations and any other informationshown on this map do not imply, on the part of The World BankGroup, any judgment on the legal status of any territory, or anyendorsement or acceptance of such boundaries.
Cultivated land converted from:
Forestry area
Grassland
Water area
Built-up area
Unused land
no data
BEIJINGNei Mongol
Tianjin
Shanghai
Xinjiang
Qinghai
XizangSichuan
GansuShaanxi
Shanxi
Henan
Guizhou
YunnanGuangxi
Hunan
Hubei
Guangdong
Hebei
Shandong
Jiangsu
Anhui
Zhejiang
JiangxiFujian
Taiwan
Hainan
Liaoning
Jilin
Heilongjiang
Ningxia
Chongqing
BEIJINGNei Mongol
Tianjin
Shanghai
Xinjiang
Qinghai
XizangSichuan
GansuShaanxi
Shanxi
Henan
Guizhou
YunnanGuangxi
Hunan
Hubei
Guangdong
Hebei
Shandong
Jiangsu
Anhui
Zhejiang
Jiangxi
Hong Kong SAR
Fujian
Taiwan
Hainan
Liaoning
Jilin
Heilongjiang
Macao SAR
Ningxia
Chongqing
IBRD 41002 | JUNE 2014This map was produced by the Map Design Unit of The World Bank.The boundaries, colors, denominations and any other informationshown on this map do not imply, on the part of The World BankGroup, any judgment on the legal status of any territory, or anyendorsement or acceptance of such boundaries.
Cultivated land converted to:
Forestry area
Grassland
Water area
Built-up area
Unused land
no data

356 U r b a n C h i n a
In addition to estimates of the quantity of the cul-tivated land conversion, another technique is to estimate changes in the potential productivity of cultivated land. The Agro-Ecological Zones (AEZ) methodology is a commonly used method of calculat-ing potential productivity. As with any of the alterna-tive methods for estimating potential productivity, a number of assumptions are needed about the crops or mix of crops that can be produced on each plot of land.
In this study, the following classification system of land use categories was used:
• Cultivated land. Original data include both paddy and nonirrigated uplands, which is aggregated into total cultivated land for this study.
• Forestry area. Natural or planted forests with canopy covers greater than 30 percent; land cov-ered by trees less than 2 meters high with a canopy cover greater than 40 percent; land covered by trees with canopy cover between 10 percent and 30 per-cent; and land used for tea gardens, orchards, and nurseries.
box 5.1 Agro-ecological zones methodology
• Grassland. Lands covered by herbaceous plants with coverage greater than 5 percent and mixed rangeland with coverage of shrub canopies of less than 10 percent.
• Water area. Land covered by natural water bodies or land with facilities for irrigation and water res-ervation, including rivers, canals, lakes, permanent glaciers, beaches and shorelines, and others.
• Built-up area. Land used for urban and rural settle-ments, industry, and transportation.
• Unused land. All remaining land.
Data inconsistencies should be expected because dur-ing the past three decades a number of different agen-cies have had responsibility for managing China’s land. Without access to quality data from traditional statistical databases, this study relies on methods that use Landsat Thematic Mapper/Enhanced Thematic Mapper (TM/ETM) data to generate estimates of changes in land quantity and quality.
Province
Totalproduction
potentialin 2000
Increase (billion
kcal)
Decrease (billion
kcal)
Netchange (billion
kcal)Percentage
change
Beijing 3,306 3.4 280.8 −277.3 −8.39
Tianjin 6,029 1.9 139.7 −137.8 −2.29
Hebei 7,1046 122.6 914.9 −792.3 −1.12
Shanxi 34,631 1.4 798.4 −797.0 −2.30
Inner Mongolia 39,410 460.6 118.8 341.7 0.87
Liaoning 34,965 40.6 221.4 −180.9 −0.52
Jilin 32,929 71.9 155.8 −83.9 −0.25
Heilongjiang 58,986 1,380.2 802.8 577.4 0.98
Shanghai 8,160 0.0 1,993.9 −1,993.9 −24.43
Jiangsu 109,240 28.0 8,319.2 −8,291.2 −7.59
Zhejiang 66,373 15.7 1,673.6 −1,657.9 −2.50
Anhui 135,361 535.9 3,594.5 −3,058.6 −2.26
Fujian 47,871 18.0 1,220.3 −1,202.3 −2.51
Jiangxi 105,507 633.2 1,060.9 −427.6 −0.41
Shandong 96,332 166.4 2,967.0 −2,800.6 −2.91
Henan 111,160 99.3 1,243.1 −1,143.8 −1.03
Hubei 147,401 31.9 2,371.1 −2,339.3 −1.59
Province
Totalproduction
potentialin 2000
Increase (billion
kcal)
Decrease (billion
kcal)
Netchange(billion
kcal)Percentage
change
Hunan 140,173 2.0 1,215.1 −1,213.0 −0.87
Guangdong 87,407 37.5 2,164.7 −2,127.2 −2.43
Guangxi 113,488 31.5 787.1 −755.7 −0.67
Hainan 15,939 23.0 131.1 −108.1 −0.68
Chongqing 55,991 23.7 2,111.1 −2,087.3 −3.73
Sichuan 175,027 68.9 1,553.0 −1,484.1 −0.85
Guizhou 63,814 27.6 1,103.9 −1,076.3 −1.69
Yunnan 67,706 94.4 981.6 −887.2 −1.31
Tibet 1,937 0.0 1.3 −1.3 −0.07
Shaanxi 40,855 170.1 550.1 −380.1 −0.93
Gansu 32,379 316.6 408.1 −91.5 −0.28
Qinghai 2,854 4.6 21.6 −17.0 −0.59
Ningxia 9,632 249.4 215.2 34.2 0.35
Xinjiang 30,567 1,781.6 46.1 1,735.6 5.68
Taiwan, China 13,437 69.0 181.8 −174.9 −1.30
Total 1,959,913 6,449 39,348 −32,899 −1.68
TAble 5.7 Change in total production potential by province, 2000–08

C h i n a ’ s U r b a n i z a t i o n a n d f o o d s e C U r i t y 357
line. Soybean output, in contrast, is expected to increase by 1.63 percent. Negative effects on total soybean output caused by decreas-ing arable land availability and escalating labor costs (−0.33 percent) are expected to be offset by water redistribution to soybean production, in response to high returns from soy production.
Vegetable oil, sugar, vegetable, and fruit output will also be affected, but output declines are projected to be modest. For every 1 percentage point increase in the urban population, domestic output will decline by 0.36 percent for vegetable oil, 0.30 percent for sugar, 0.13 percent for vege-tables, and 0.1 percent for fruit. Vegetable oil and sugar will suffer more than vegetables and fruit mainly because of water redistri-bution away from agriculture. Lower water availability will drive vegetable oil and sugar outputs down by 0.19 percent and 0.13 per-cent, respectively, while the impact on veg-etables and fruit will be small. By 2030, the cumulative impact of urbanization on these agricultural goods will be between 1.5 per-cent and 5.4 percent. Animal production and aquaculture will experience relatively little impact. Urbanization will cause livestock and aquaculture production to decrease by 0.11 percent and 0.14 percent respectively, for every 1 percentage point increase in China’s urban population. From 2012 to 2030, the total impact of urbanization on animal and aquaculture products will be a decrease in output of between 1.7 percent and 2.0 percent. The main driver of declin-ing output in the livestock sector will be ris-ing labor costs. The structural and quanti-tative changes in China’s food production will require additional food imports, driven mainly by imports of feed grains, especially corn. Imports of rice and wheat are projected to be modest given the decline in overall per person demand for these grains by 2030. China’s needs for imports of agricultural products are within the capacity of China’s existing trade partners for maize, soybeans, and dairy products.
Urbanization impacts on agriculture will lead to slightly higher imports of agricul-ture products and reduce China’s food self-sufficiency. However, overall reliance on
imports will be small and serious concerns about China’s food self-sufficiency do not seem warranted (table 5.9). Urbanization leads to lower domestic output of many agri-cultural products, as well as to higher prices and decreased international competitiveness.
Figure 5.20 Changes in agricultural production potential, 2000–08
Source: Deng and others 2013.
Forestryarea
Grassland
Waterarea
Built-uparea
Unusedland
kcal (billions)–45,000
–40,000
–35,000
–30,000
–25,000
–20,000
–15,000
–10,000
–5,000 010,000
5,000
Decrease due to cultivatedland being converted to:
Increase due to cultivatedland being converted from:
Netchanges
TAble 5.8 impact of a 1 percentage point increase in China’s urbanization rate on China’s domestic food production to 2020
Food Total impacts
Decomposition of impacts of urbanization
Water resource constraints
usageFarmland
conversionRising
labor cost
Grains −0.18 −0.06 −0.06 −0.07
Rice −0.34 −0.25 −0.04 −0.05
Wheat −0.17 −0.09 −0.04 −0.04
Corn −0.18 −0.02 −0.07 −0.09
Soybeans 1.31 1.64 −0.20 −0.13
Vegetable oils −0.36 −0.19 −0.10 −0.07
Sugar −0.30 −0.13 −0.09 −0.08
Vegetables −0.13 −0.03 −0.06 −0.05
Fruits −0.10 0.00 −0.06 −0.04
Pork −0.11 −0.01 −0.02 −0.09
Beef −0.11 0.00 −0.01 −0.09
Poultry −0.12 −0.01 −0.03 −0.09
Dairy products −0.14 −0.01 −0.02 −0.12
Fishery products −0.11 0.00 −0.01 −0.10
Source: CAPSiM results.

358 U r b a n C h i n a
As a result, China’s agricultural imports will increase, and exports will decrease. However, the projected increases in imports for rice, wheat, and other products (except soybeans) will be small (table 5.10). Grain import vol-
ume is projected to increase by 275,000 tons for each percentage point increase in China’s urban population, which is small relative to the current total imports of 105.8 million tons, annually.
TAble 5.9 China’s supply and demand of agricultural products in 2012, 2020, and 2030 Thousands of tons
Indicator Graina
Major grains
Rice Wheat Corn Soybeanb
2012Sown area 111,267 30,244 24,421 33,842 7,407Production 589,570 142,965 120,580 208,190 13,600Inventory change 72,152 27,683 11,595 14,863 7,027Import 86,890 2,369 3,701 5,208 67,530Export 2,830 279 0 257 385Net import 84,060 2,090 3,701 4,951 67,145Total demand 601,477 117,372 112,686 198,278 73,718Food demand 316,804 95,727 72,648 15,791 71,560Per capita food demand (kg/person) 445.3 70.9 53.8 11.7 53.0Fodder grain demand 158,048 6,283 18,398 119,986 656Seed demand 12,517 2,219 5,757 1640 688Industrial demand 90,202 7,055 11,318 53,000 719Waste 23,907 6,088 4,564 7861 94Self-sufficiency rate (percent) 87.5 98.6 97.0 97.7 16.82020Sown area 101,968 24,953 21,536 33,561 7,424Production 568,122 120,449 110,339 224,070 14,966Import 108,918 1,244 2,628 19,794 79,536Export 3,086 531 0 140 327Net import 105,832 712 2,628 19,654 79,209Total demand 673,954 121,161 112,967 243,724 94,175Food demand 337,018 99,656 71,090 10,857 91,800Per capita food demand (kg/person) 479.3 70.9 50.6 7.7 65.3Fodder grain demand 191,754 5,525 18,503 155,896 738Seed demand 12,324 2,184 5,666 1,627 677Industrial demand 109,875 7,947 13,323 67,791 868Waste 22,983 5,849 4,385 7,552 92Self-sufficiency rate (percent) 84.3 99.4 97.7 91.9 15.92030Sown area 94,939 21,874 19,355 33,642 6,858Production 563,021 109,314 102,729 243,298 14,972Import 140,413 1,079 2,459 42,096 89,472Export 3,168 613 0 97 290Net import 137,245 466 2,459 41,999 89,181Total demand 700,267 109,781 105,188 285,296 104,153Food demand 318,224 88,844 63,072 6,629 101,613Per capita food demand (kg/person) 491.0 62.3 44.2 4.7 71.3Fodder grain demand 208,466 4,010 16,929 178,769 729Seed demand 12,086 2,140 5,554 1,611 664Industrial demand 139,612 9,223 15,462 91,105 1,058Waste 21,879 5,563 4,171 7,183 89Self-sufficiency rate (percent) 80.4 99.6 97.7 85.3 14.4
Source: CAPSiM results.Note: kg/person = kilograms per person.

C h i n a ’ s U r b a n i z a t i o n a n d f o o d s e C U r i t y 359
rural-to-urban migration: Changing per capita food consumption patterns
China’s urbanization will affect food demand through income growth resulting from economic growth and development, as discussed earlier. Urbanization will also, of course, involve the migration of rural resi-dents to urban areas. How will consumption patterns of rural residents change as they enter the cities? What effects will rural-to-urban migration have on food consumption? Food consumption patterns differ between urban and rural residents in China. Food grain consumption (at home) in rural areas is higher than in urban areas at the same level of income. Urban residents consume less rice, wheat, and other grains but consume substantially more dairy products, eggs, edible oils, fruit, and vegetables than rural residents. But food consumption data does not show marked differences in consump-tion of poultry, beef, mutton, and aquacul-ture products between rural and urban areas (figure 5.21).
Food consumption per capita in both rural and urban areas is generally underes-timated because current data4 describe only consumption patterns at home but do not reflect consumption away from home. From 2000 to 2010, consumption data indicate that per capita food grain consumption of urban residents decreased by 1 percent, from 82.3 kg to 81.5 kg. Per capita grain consump-tion of rural residents decreased by a much greater amount over the same period, from 250 kg to 181 kg, or by 28 percent. Accord-ing to national statistics, per capita pork consumption of urban residents remained nearly constant from 2005 (20 kg) to 2011 (21 kg), whereas consumption in rural areas decreased by nearly 8 percent from 16 kg (2005) to 14 kg (NSBC 2011). Notwithstand-ing population growth, such decreases in consumption, however, contrast with China’s continuously increasing grain (rice, wheat) output and imports over the past decade. Domestic pork production, however, grew by 11 percent, while imports grew from 295,000 tons in 2005 to 387,000 tons in 2011. When comparing consumption with supply (pro-duction plus import), China’s pork consump-
tion has increased by 12.5 percent during 2005–11. Such inconsistencies—constant or slightly increasing consumption per capita against fast output growth and imports—also exist for other agricultural commodities.
Analyzing food consumption away from home helps explain these inconsistencies. Food consumption of urban residents has increased substantially over the past 10 years, if consumption away from home is taken in account. Expenditure on consumption away from home has risen markedly with increasing urban incomes, and consumption away from home has become an important component of consumption of urban residents. Accord-ing to survey data on food consumption in six large cities during 2007–11,5 expendi-ture on urban residents’ food consumption away from home accounts for 35 percent of total food expenditure, whereas consump-tion away from home accounts for between 20 and 30 percent of total food consumption. Food consumption also clearly differs accord-ing to whether an urban resident is at home or away from home. Urban residents con-sume more meat and beverages at home, but fewer fruits and vegetables when they eat out (figure 5.22). Similar shares can be expected for rural areas, possibly confirming that real consumption has been underestimated.
TAble 5.10 impact of a 1 percentage point increase in China’s urban population on China’s international trade to 2020
Export ImportNet import(1,000 tons)Percent 1,000 tons Percent 1,000 tons
Grains −0.93 −26.69 0.23 248.58 275.3
Rice −2.83 −14.6 2.75 35.2 49.8
Wheat −1.94 0.0 1.89 50.9 50.9
Corn −0.57 −0.8 1.18 233.5 234.3
Soybean 0.12 0.4 –0.11 −95.8 −96.2
Vegetable oils −0.87 −0.2 0.88 17.8 18.0
Sugar −0.90 −0.6 0.87 26.3 26.9
Vegetables −0.69 −44.5 0.70 4.5 49.1
Fruits −0.58 −21.2 0.60 25.3 46.5
Pork −0.46 −0.3 0.46 3.4 3.7
Beef −1.00 0.0 0.95 1.6 1.6
Poultry −0.48 −0.9 0.50 0.3 1.2
Dairy products −0.23 −0.1 0.20 23.6 23.7
Fishery products −0.30 −9.2 0.27 8.1 17.3
Source: CAPSiM results.

360 U r b a n C h i n a
Figure 5.21 Per capita consumption of various agricultural products in response to income growth
Source: J. Huang and others 2013. Note: Rural family population—live more than six months.
Rural Urban
200
250
Per c
apita
con
sum
ptio
n (k
g)a. Cereal
150
100
50
00 5 10 15
Per capita income (1,000/RMB) Per capita income (1,000/RMB)
Per capita income (1,000/RMB) Per capita income (1,000/RMB)
20 25 30
3035
Per c
apita
con
sum
ptio
n (k
g)
b. Pork
25201510
05
302520151050
30
35
Per c
apita
con
sum
ptio
n (k
g)
c. Poultry
25
20
15
10
0
5
30
35
25
20
15
10
0
5
302520151050
Per c
apita
con
sum
ptio
n (k
g)
d. Beef
302520151050
Per capita income (1,000/RMB) Per capita income (1,000/RMB)
1416
Per c
apita
con
sum
ptio
n (k
g)
e. Edible oil
1210
864
02
30
40
20
10
0302520151050
Per c
apita
con
sum
ptio
n (k
g)
f. Milk
302520151050
Per capita income (1,000/RMB) Per capita income (1,000/RMB)
15
Per c
apita
con
sum
ptio
n (k
g)
g. Egg
12
9
6
3
0
30
40
20
10
0302520151050
Per c
apita
con
sum
ptio
n (k
g)
h. Aquatic product
302520151050

C h i n a ’ s U r b a n i z a t i o n a n d f o o d s e C U r i t y 361
Figure 5.22 Food consumption at home and away from home for urban residents by income
Source: Bai and others 2013.Note: The poorest quintile is Q1; the richest quintile is Q5.
Food consumed at homeFood consumed away from home
200
RMB/
pers
on
a. Expenditure
150
50
100
0Q1 Q2 Q3 Q4
Per capita income by quintile Per capita income by quintile
Q5 Q1 Q2 Q3 Q4 Q5
14
kg/p
erso
n
b. Quantity
12
8
10
4
0
2
2
3.0
kg/p
erso
n/w
eek
c. Grain
2.0
2.5
1.0
1.5
0.5
0Q1 Q2 Q3 Q4
Per capita income by quintile Per capita income by quintile
Q5 Q1 Q2 Q3 Q4 Q5
1.4
1.6
kg/p
erso
n/w
eek
d. Meat
1.2
0.8
0.4
0.2
1.0
0.6
0
0.6
0.4
0.2
0.5
0.5
0.1
0
RMB/
pers
on
e. Aquatic
Q1 Q2 Q3 Q4
Per capita income by quintile Per capita income by quintile
Q5 Q1 Q2 Q3 Q4 Q5
1.6
1.8
kg/p
erso
n/w
eek
f. Vegetables
1.2
0.8
0.4
0

362 U r b a n C h i n a
Projecting aggregate food demand and supply gaps under urbanization
China’s food consumption and production are projected to stabilize after 2030 (box 5.2). By 2030, China’s aggregate food self-sufficiency will remain at above 90 percent. Per capita food consumption will continue to grow rap-idly over the next two decades, with relatively faster growth during the coming decade, driven by income growth. Per capita consump-tion of food grains such as rice and wheat will continue to decline, while consumption of edible oils, sugar, vegetables, fruit, and ani-mal and aquaculture products will increase markedly with increasing incomes. Grow-ing demand for higher-value meat, eggs, and dairy products present challenges for the domestic supply of animal feed, in particular feed grains. The rising demand for feed grains
will put pressure on China’s aggregate food demand and supply balance. Domestic pro-duction shortages of soybeans, corn, edible oils, sugar, and dairy products will increase further because of demand growth and resource constraints in the next 20 years.
Grains
China’s aggregate demand for grain is expected to grow significantly faster than domestic production. Total demand for grains is projected to increase from 600 mil-lion tons per year currently to 670 million tons in 2020 and 700 million tons in 2030. Annual grain production, in comparison, will grow at a much slower pace than demand, reaching 568 million tons by 2020 and 563 million tons by 2030. Per capita annual grain consumption is projected to grow from 445
This study uses the China Agricultural Policy Simula-tion Model (CAPSiM), developed by the Center for Chinese Agricultural Policy of the Chinese Acad-emy of Sciences, to analyze the effects of China’s urbanization on domestic food production and food demand and forecast a supply-demand balance for major agricultural products for the next two decades, until 2030. CAPSiM covers 14 crops (rice, wheat, corn, sweet potatoes, potatoes, other coarse grains, soybeans, cotton, oil crops, sugar crops, vegetables, fruit, squash, and others); and nine categories of live-stock products (pork, beef, mutton, poultry, eggs, milk, fish, shrimp, and others). The model builds on the analyses of the effects of urbanization on water for agriculture, land conversion and arable land, labor, migration and rural wages, and technological change. Model simulations are based on the following assumptions:
• GDP. China’s economic growth is expected to slow but to maintain comparatively high rates of GDP growth. Assumptions are: 7.5 percent growth for 2012–15); 7 percent for 2016–20; 5.9 percent for 2021–25), and 5.0 percent for 2026–30.
• Rural-urban income gap. The rural-urban income gap will gradually narrow. Rural incomes may grow faster than urban incomes. During 2010–12, rural income grew by 11 percent annually, while
box 5.2 China Agricultural Policy Simulation Model (CAPSiM)
urban income grew by 8.6 percent annually. For the 2013–30 period, rural incomes are assumed to maintain an average annual growth rate of 8.3 per-cent while urban income will grow more slowly, at an assumed average annual rate of 6.8 percent.
• Population. China’s population growth rate is assumed to be is 0.61 percent from 2012 to 2015, 0.44 percent for 2016–20), 0.22 percent for 2021–25, and 0.06 percent for 2026–30.
• Urbanization. China’s urban population will increase from 52 percent of the total population in 2012 to 56 percent in 2015, 60 percent in 2020, 64 percent in 2025, and 67 percent in 2030.
• Rural labor wage and land rent. Average annual growth of the actual wage of rural labor from 2012 to 2030 is assumed to be 6 percent, while cost of land rental will grow by 2.5 percent.
• Technological change. It is expected that the gov-ernment will continue to invest in agricultural research and development. Rising marginal cost for increasing unit production will imply a lower contri-bution rate of scientific and technological progress.
The Organisation for Economic Co-operation and Development-Food and Agriculture Organisation Agricultural Outlook (2013–20) and U.S. Depart-ment of Agriculture estimates (2013–22) are the main sources for international agricultural prices.

C h i n a ’ s U r b a n i z a t i o n a n d f o o d s e C U r i t y 363
kg in 2012 to 479 kilograms in 2020 and 491 kilograms in 2030 (table 5.11).
China will maintain high domestic self-sufficiency levels for rice and wheat, the most important food grains, but not for feed grains. For rice, self-sufficiency is predicted to remain above 99 percent up to 2030. For wheat, self-sufficiency will remain above 97 percent in 2030. In contrast, China’s self-sufficiency in corn is projected to decrease to 85 percent by 2030 from 98 percent in 2012. Corn production is predicted to reach 220 million tons by 2020 and 243 million tons by 2030 while demand will increase to 240 million tons in 2020 and 285 million tons in 2030, opening a demand-supply gap of 20 million tons by 2020 and 42 million tons by 2030. The domestic supply gap in soybeans (including soybean oil) is projected to grow
further. Imports may reach 80 million tons in 2020 and 90 million tons in 2030, resulting in a self-sufficiency rate for soybeans of only 14 percent (figure 5.23).
Livestock products and fishery products
China will be able to balance domestic demand and supply of pork, the most impor-tant animal product. It will also remain self-sufficient in poultry and eggs. In con-trast, self-sufficiency levels for beef, mutton, and dairy products will drop significantly. Dairy imports will increase rapidly and self- sufficiency will drop to 76 percent by 2030. As consumption increases, livestock produc-tion in China will also see rapid growth.
China’s demand for fishery and aquacul-ture products is expected to surge, but will
TAble 5.11 China’s current and projected supply and demand of livestock products in 2012, 2020, and 2030 Thousands of tons
Pork Beef Mutton Poultry EggsDairy
productsFishery
products
2012Production 46,159 5,296 3,409 17,319 19,998 38,680 33,178
Import 522 49 119 49 0 6,181 2,208
Export 66 12 0 181 61 105 3,253
Net import 456 37 119 −131 −61 6,076 −1,045
Total consumption 46,615 5,333 3,528 17,187 19,937 44,756 32,132
Food consumption 44,046 4,919 3,295 16,294 19,136 44,008 29,761
Per capita food consumption (kg/person) 32.6 3.6 2.4 12.1 14.2 32.6 22.0
Self-sufficiency rate (percent) 99.0 99.3 96.6 100.8 100.3 86.4 103.3
2020
Production 56,194 7,272 4,384 22,379 23,462 56,906 43,808
Import 728 165 328 67 0 11,725 2,975
Export 65 4 0 180 47 51 3,298
Net import 664 161 328 -113 -47 11674 -323
Total consumption 56,858 7,433 4,711 22,266 23,416 68,580 43,485
Food consumption 54,289 7,019 4,479 21,373 22,615 67,832 41,113
Per capita food consumption (kg/person) 38.6 5.0 3.2 15.2 16.1 48.2 29.2
Self-sufficiency rate (percent) 98.8 97.8 93.1 100.5 100.2 83.0 100.7
2030
Production 61794 9046 5133 25477 24803 68889 51618
Import 897 520 801 87 0 21734 3648
Export 52 1 0 139 38 25 2705
Net import 845 518 801 -52 -38 21709 942
Total consumption 62638 9564 5934 25425 24765 90598 52560
Food consumption 60070 9150 5702 24532 23964 89850 50188
Per capita food consumption (kg/person) 42.1 6.4 4.0 17.2 16.8 63.0 35.2
Self-sufficiency rate (percent) 98.7 94.6 86.5 100.2 100.2 76.0 98.2
Source: CAPSiM results.Note: kg/person = kilograms per person.

364 U r b a n C h i n a
be largely met by increasing domestic pro-duction. Per capita annual consumption of aquaculture products, including fish, shrimp, crab and shellfish, will grow from 22 kg today to 29 kg by 2020 and 35 kg by 2030. Domestic production will grow substantially from 33.2 million tons in 2012 to 43.8 mil-lion tons in 2020 and 51.6 million tons in 2030. Since the demand for aquaculture will grow slightly faster than production, export growth for aquacultural products will remain small while imports will continue to grow. It is worth noting that low-price fish meal accounts for a significant share of China’s fishery imports. While imports and exports of fish and aquaculture products are of similar quantity, China’s exports have much higher value than its imports.
Vegetables and fruit. China has a compara-tive advantage in fruit and vegetable produc-tion, which has grown steadily over the past
decade. It will meet its demand for both and will even be able to increase exports. While rising labor costs will reduce its comparative advantage, China is likely to satisfy its ris-ing domestic demand on vegetables and fruit by further adjusting and expanding domes-tic production. Vegetable production is pro-jected to grow further, from currently 308 million tons in 2012 to 349 million tons by 2020 and 372 million tons by 2030. Vegeta-ble consumption will also be on an upward trajectory, and increase from 236 million tons in 2012 to 277 million tons by 2020 and 298 million tons by 2030. China will remain a major exporter of vegetables with exports projected to increase from 6.1 million tons to 8.6 million tons by 2030.
China’s production and consumption of fruit will also grow significantly, and imports and exports will both increase. Production is predicted to increase from 162 million tons in 2012 to 193 million tons by 2020 to 219 million tons by 2030. Fruit consumption will grow from 163 million tons in 2012 to 194 million tons by 2020 and 218 million tons by 2030. China’s imports of fruit, mainly tropi-cal fruits, are expected to grow from 4 mil-lion tons in 2012 to 4.3 million tons in 2020, and then decrease to 3.7 million tons by 2030. Fruit exports, mainly temperate fruits (apples, pears, and citrus fruits) are projected to grow from 3.4 million tons in 2012 to 3.5 million tons in 2020 to 5 million tons in 2030. After 2020, fruit consumption growth will slow down, while production will maintain rapid growth, making China an exporter with a net export of 1.29 million tons of fruits by 2030.
Sugar. China’s sugar production is expected to grow slowly against a rapid consumption increase, resulting in a bigger supply short-age. Production is projected to increase from 16 million tons in 2012 to 17 million tons in 2020 and 19 million tons in 2030. Per capita sugar consumption is projected to increase significantly, resulting in a total demand of 20 million tons by 2020 and 23 million tons by 2030, up from 16 million tons in 2012. Imports of sugar are expected to increase from 2.8 million tons in 2012 to 2.9 million tons in 2020 and 4.25 million tons in 2030. By 2030, China is projected to produce 82 percent of its sugar demand domestically.
Figure 5.23 Projected supply shortages for various food items
Source: Huang and others 2014.
Rice
Wheat
Corn
Soybean
Edible oil
Sugar
Vegetables
Fruits
Pork
Beef
Mutton
Poultry
Egg
Milk
Fish
Percent
200–20–40–60–80–100
2012 2020 2030
C h i n a ’ s U r b a n i z a t i o n a n d f o o d s e C U r i t y 365
Oil Crops. The production of and demand for oil crops (other than soybeans) are expected to grow in parallel, although China will face some domestic supply shortage, which will need to be met by imports. Total production of oil crops is expected to rise from 8.7 mil-lion tons in 2012 to 10.2 million tons in 2020 and 10.8 million tons in 2030. Domestic demand will continue to grow at a relatively rapid speed, increasing from 10.4 million tons in 2012 to 12.2 million tons in 2020 and 13.1 million tons in 2030. Imports are predicted to increase from 1.4 million tons in 2012 to 2 million tons in 2020 and 2.4 million tons in 2030. China’s self-sufficiency rate in oil crops will decline from 86 percent in 2012 to 82 percent in 2030.
Cotton. China’s cotton demand has been growing much faster than its cotton produc-tion, with much of this demand being for production of clothing for export, and supply continues to fall short of demand. Demand for cotton will continue to grow rapidly. Total demand is expected to increase from 8 million tons in 2012 to 10 million tons in 2020 and to nearly 13 million tons in 2030. Domestic cotton production and imports in 2020 are both expected to be lower than those of 2012, mainly because of government purchase and stockpiling of cotton in 2012, which contrib-uted to higher prices, higher domestic produc-tion, and strong import growth. These effects are expected to dissipate.
Policy recommendations China has established a comprehensive food policy framework with minimum grain purchasing prices at the core, supported by temporary grain reserves, direct food sub-sidies, grain stock adjustments, and inter-national trade. This framework, along with China’s institutional reforms and produc-tivity growth in the agricultural sector over the past decades, has been critical to China’s food grain security. But these policies have not addressed problems related to distortions in grain prices, policy inefficiencies, obsolete grain circulation and reserve systems, and weak food safety nets, and they therefore need further improvement to meet the chal-lenges of urbanization.
Setting China’s food security objectives
Food self-sufficiency may be desirable for a country with a population of 1.3 billion people, but in view of the structural changes in agricultural production and in food con-sumption that have taken place over the past decades, as well as escalating environmental and resource constraints, China’s current objective of food security in all food catego-ries is neither possible nor necessary. Instead, China should redefine its food security objec-tives based on the principles of efficiency, openness, and sustainability. Taking envi-ronmental capacity and resource constraints into account, China should strive to unlock the potential for increased grain production by improving productivity and market effi-ciency, thereby projecting a clear and trans-parent picture of China’s needs for grain imports and exports. China should moder-ately adapt its food security objective towards maintaining self-sufficiency in food grains while allowing for more imports of nonfood grains and other agricultural products. More emphasis should be placed on food quality and safety, agricultural sustainability, and protection policies for low-income groups. Stronger emphasis should also be placed on improving the environmental sustainability of China’s domestic livestock sector through better protection and management of China’s grassland resources. The fine-tuning of China’s food security objectives needs to be complemented by policy reforms, investments in agricultural water resources management, and rural land and labor market reforms.
enhancing domestic grain production capacity
China has raised agricultural productivity successfully in the past. From 2004 to 2011, total factor productivity grew at a rate of 2 percent annually for all major grain crops and at 3 percent annually for the major veg-etable crops. If China is to increase domestic grain production capacity, ensuring continu-ous productivity growth in agriculture is a priority. Compared to many other countries, China’s potential for increasing labor and land productivity is significant. The poten-tial of productivity growth can be captured

366 U r b a n C h i n a
through promoting economies of scale in agriculture, primarily by increasing the scale of farming operations, and through contin-ued investments in research and development.
The process through which labor and land productivity can grow and farmland can be consolidated needs to be carefully coordi-nated, and the pace of change needs to be carefully controlled. Specifically, the gov-ernment’s role will be to (a) improve policies that allow rural migrants to become urban citizens, thereby stimulating more perma-nent migration to urban areas, and (b) create the conditions for consolidated agricultural operations and improved labor productiv-ity in rural areas. The government will need to rationalize the rural land rights system and develop rural land markets and create incentives for a market-based consolidation of farmland to allow modern medium- and large-scale entities, such as commercial grain producers, larger family farms, and special-ized cooperatives, to emerge.
Steady productivity growth in grain pro-duction requires continued technological advancements in agriculture. The key driv-ers for technological progress are increased public spending on agricultural research and development, integrated programs to promote advanced yield-enhancement technologies, mechanization in grain production, capacity building of farm producers, adoption of mod-ern biotechnology, and expedited breeding of new, improved crop varieties. Investments will also be needed for transforming low- and medium-yield farmland into land of higher productivity and for the expansion or reha-bilitation of irrigation infrastructure, and for the development of water users’ associations that can help improve water use efficiency in irrigation areas. Investments in improving on-farm water use efficiency through better technology are needed and should be com-bined with better water pricing policies.
improving agricultural sustainability
Current practices of overfertilization need to be changed to reduce environmental costs and ensure that agricultural resources and the environment are managed in more sustain-able ways. Audits on heavy metal contami-
nation in major grain-producing regions can provide the necessary baseline information, while environmental risk assessments can help identify key target regions for action. The classification of key regions according to function can be used to determine poten-tial treatments based on the severity of con-tamination and crop mixes can be adjusted accordingly. China should set sound, science-based criteria for tillage on land contami-nated by heavy metals. For areas where con-tamination is severe and tillage should not continue in the future, ecological compensa-tion schemes can be considered to support farmers’ jobs and incomes. The progress that has been made on reverting farmland back to forests should be carefully managed in order to prevent the reclamation of already retired farmland. The scope of the slopeland conver-sion program should be further expanded to also include severely desertified areas. A special subsidy program for land quality pro-tection should be implemented to support farmers who opt to leave their land fallow, readjust their land mix, or limit the use of pesticides and chemical fertilizers.
enhancing international cooperation and trade
Following China’s WTO accession, progres-sive and predictable import growth has been shown to create win-win results. For exam-ple, China’s growth of soybean imports has driven global soybean production, particu-larly in the Americas, and promoted global trade. The benefits for China include meeting growing domestic demand and saving land and water resources. Building on these expe-riences, China should strengthen cooperation with major grain-producing nations by sign-ing medium- and long-term grain trade agree-ments with such countries, and creating stable and diversified import avenues. China should also leverage its comparative advantages and expand agricultural development aid and investments in neighboring countries and in South America and Africa, and actively par-ticipate in global and regional food security governance. China should focus on agricul-tural technology transfer, and investments in processing, storage, transportation, and

C h i n a ’ s U r b a n i z a t i o n a n d f o o d s e C U r i t y 367
trade, ensuring socially responsible and sus-tainable investments. While such investments may not result immediately in agricultural products flowing to China, they will increase other countries’ grain production capacity and improve global supply, which in turn will improve the external environment of food security for China.
reforming grain price formation mechanisms
China’s grain price mechanism has resulted in market distortions and a heavy fiscal bur-den for the government, and requires reform. China should allow grain prices to fluctuate freely during normal periods and secure food supply for low-income groups through food subsidy programs. Only in times of natural disaster or external shocks should the govern-ment intervene and release the state’s emer-gency grain reserves. China’s grain producer price should be replaced by a target price sys-tem. Moving away from direct government buying in the market to price subsidies linked to a target price (price benchmark) should be considered. This would separate price forma-tion from government subsidies, the benefits of which would include gains to farmers and less market distortion. Such a policy has been adopted by many countries in their transi-tion from price support to direct subsidies. While conducting price reform, China needs to quicken the pace of building a food safety net for vulnerable income groups. Food price inflation and benchmarks for social relief and benefits need to be better linked. For specifi-cally vulnerable groups, such as households in extreme poverty, a direct food supply sys-tem should be established.
improving the efficiency of grain producer subsidies
China’s existing grain subsidy policy should be maintained to help stabilize farmer’s income expectations. Subsidy levels should be adjusted regularly to counter the erosion of farmers’ gains because of rising produc-tion costs. Current agricultural subsidies are still comfortably below the WTO-mandated caps, and there is room to grow further. But
China’s subsidy policy also needs reform to meet the new food security objectives. Subsi-dies should be better linked to yields of grain crops and incremental subsidies should favor the main grain-producing regions and pro-ducers. China may also create a special sub-sidy program linked to environmental protec-tion to create incentives for farmers to opt for retiring farmland or reducing input levels.
reforming China’s grain reserves and circulation system
The government should carefully distinguish between strategic grain reserves and grain buffer stocks. Strategic reserves are built pri-marily to withstand systemic grain supply shocks, and such reserves should be mod-est. Buffer stocks would be used mainly to balance grain supply and demand between seasons and different regions and should be concentrated in major grain consumption regions, especially city clusters. The share of processed grains should be increased, and the role of local governments in building grain reserves should be strengthened. China may also create incentives for grain processing and circulation enterprises to contribute to grain reserves. And finally, China needs to improve its network of modern grain logistics, which runs through major interprovincial corridors and connects major grain-producing regions, distribution centers, and transportation hubs to cities and city clusters. The focus should be on consolidating existing grain logistics resources, creating a network of critical grain logistics hubs, and strengthening the connec-tions between such hubs and railway, water-way, and highway transportation infrastruc-ture. Warehousing services should be made more specialized and market based, and grain warehousing could be professionalized and privatized.
Notes1. To assess food consumption, production,
and self-sufficiency issues for China, differ-ent food types are converted into CEs, taking into account the higher costs of producing live-stock products relative to producing an equiv-alent weight of cereal products (K. Rask and

368 U r b a n C h i n a
N. Rask 2011). The coefficients used in this report reflect the high costs of producing live-stock products relative to cereals and the sharp differences between different animal products. The coefficients used are as follows: beef, 19.8; mutton and goat meat,19.8; offal, 12.8; other meat, 12.0; pork, 8.5; poultry, 4.7; fish and seafood, 3.3; other aquatic products, 0.1; eggs, 3.8; milk, 1.2; butter, 2.1; cream, 10; other animal fat, 12.0.
2. Modeling and simulation exercises, using the CWSM, were applied to quantify the relation-ship between urbanization and water con-sumption in the agricultural sector in China. Simulations were conducted for overall water balance, intersectoral water allocation, and their impacts on agricultural production for China’s 10 major river basins, including the Liao, Songhua, Hai, Huai, Yellow, Yangtze, Pearl, Southeast, Southwest and Northwest rivers (see map 5.1). For a detailed treatment of the CSWM model used for this study, see J. Wang and others (2013).
3. Hukou is China’s household registration sys-tem. It separates rural and urban citizens and imposes restrictions on rural residents’ mobil-ity to settle in urban areas and gain access to urban social security and public services.
4. The National Statistics Bureau of China cal-culates rural food consumption per capita as total household consumption divided by per-manent household members. These members include the following: people living at home all year, people living at home at least for 6 months, and people living at home for less than 6 months per year but remitting income to the household.
5. Data are from Chinese Center for Agricultural Policy surveys on food consumption at home and away from home for 1,340 families in Bei-jing, Chengdu, Nanjing, Shanghai, Shenyang, Xiamen, and Xi’an during 2007–11.
referencesBai, Junfei, Huanguang Qiu, and Jikun Huang.
2013. “Changes of China’s Food Consump-tion.” Project report submitted to World Bank and Development Research Center of the State Council, Center for Chinese Agricultural Policy, Beijing.
Bai, Junfei, Thomas I. Wahl, Bryan T. Lohmar, and Jikun Huang. 2010. “Food away from Home in Beijing: Effects of Wealth, Time, and ‘Free’ Meals.” China Economic Review 21 (3): 432–41.
Cai, Fang, and Meiyan Wang. 2010. “Growth and Structural Changes in Employment in Transition China.” Journal of Comparative Economics 38 (1): 71–81.
Chan, Kam Wing. 2010. “The Global Financial Crisis and Migrant Workers in China: ‘There Is No Future as a Labourer; Returning to the Village Has No Meaning.’” International Journal of Urban and Regional Research 34 (3): 659–77.
Chen, Feng-gui, Hong-ou Zhang, Qi-tao Wu, and others. 2010. “A Study on Coordinate Devel-opment between Population Urbanization and Land Urbanization in China. Human Geogra-phy 25 (5): 53–58.
Chen, Xi-wen. 2011. “Some Issues in the Rural Development of China.” Journal of Nanjing Agricultural University (Social Sciences Edi-tion) 11 (1): 1–6.
Chen, Zhigang, Fu-tian Qu, Li Han, and others. 2010. “The Rural Land Issues in the Process of the Industrialization and the Urbanization: Features, Incentives, and Resolution Path.” Reform of Economic System, 5: 93–98.
de Brauw, Alan, Jikun Huang, Scott Rozelle, Linxiu Zhang, and Yigang Zhang. 2002. “The Evolution of China’s Rural Labor Markets during the Reforms.” Journal of Comparative Economics 30 (2): 329–53.
de Brauw, Alan, and Scott Rozelle. 2008. “Rec-onciling the Returns to Education in Off-Farm Wage Employment in Rural China.” Review of Development Economics 12 (1): 57–71.
de Brauw, Alan, Jikun Huang, Linxiu Zhang, and Scott Rozelle. 2013. “The Feminisation of Agriculture with Chinese Characteris-tics.” Journal of Development Studies 49 (5): 689–704.
Deng, Xiangzheng, Jikun Huang, and Scott Rozelle. 2013. “Impact of Urbanization on Land Productivity and Cultivated Land Area in China.” Project report submitted to the World Bank and Development Research Cen-ter of the State Council, Center for Chinese Agricultural Policy, Beijing.
Du, Ying, Gaihe Yang, Liping Xu, and others. 2005. “Analysis of Ecological Effects in Urbanization Process.” Journal of Northwest A&F University (Social Science Edition) 5 (2): 97–101.
Easter, K. William, and Yang Liu. 2005. “Cost Recovery and Water Pricing for Irrigation and Drainage: What Works?” Washington, DC: World Bank.
Fischer, Günther, Tatiana Ermolieva, and Laixi-ang Sun. 2010. “Environmental Pressure from

C h i n a ’ s U r b a n i z a t i o n a n d f o o d s e C U r i t y 369
Intensification of Livestock and Crop Produc-tion in China: Plausible Trends towards 2030.” CATSEI Project Report D22, Center for Chi-nese Agricultural Policy, Beijing.
Fukase, Emiko, and Will Martin. 2013. “Who Will Feed China in the 21st Century? Income Growth and the Demand and Supply for Food in China.” Draft report, Montesquieu University–Bordeaux IV, Bordeaux, France.
Han, Jun. 2010. Strategic Research on China’s Food Production Capacity and Balancing Supply and Demand. Beijing: Capital Univer-sity of Economics & Business Press.
Hu, Mu, and Hejin Ni. 2010. “Research on Rela-tionship between Urbanization and the New Rural Construction Based on Dynamic Per-spective.” Chinese Agricultural Science Bulle-tin 26 (7): 364–69.
Huang, Jikun. 1999. “Social Development, Urbanization and Food Consumption.” Social Sciences in China 4: 102–16.
Huang, Jikun and Howarth Bouis. “Structural Changes in the Demand for Food in Asia: Empirical Evidence from Taiwan.” Agricul-tural Economics 26 (2001): 57–69.
Huang, Jikun, and Cristina David. 1993. “Demand for Cereal Grains in Asia: The Effect of Urbanization.” Agricultural Economics 8: 107–24.
Huang, Jikun, and Scott Rozelle. 1998. “Market Development and Food Consumption in Rural China.” China Economic Review 9 (1): 25–45.
Huang, Jikun, Jun Yang, Zhurong Huang, Huaiju Liu, Junfei Bai. 2013. “Analysis on Impacts of Urbanization on Food Consumption and Grain Demand.” Report, Center for Chinese Agricultural Policy, Beijing.
———. 2014. “Urbanization and Food Con-sumption.” A project report submitted to the World Bank and Development Research Cen-ter of the State Council, Center for Chinese Agricultural Policy, Beijing.
Huang, Jikun, Jun Yang, and Scott Rozelle. 2010. “China’s Agriculture: Drivers of Change and Implications for China and the Rest of World.” Agricultural Economics 41: 47–55.
———. 2014. “Urbanization and Food Security in China.” A project report submitted to World Bank and Development Research Center of the State Council. Center for Chinese Agricultural Policy, Beijing.
Huang, Jikun, Lifen Zhu, Xiangzheng Deng, and Scott Rozelle. 2005. “Cultivated Land Changes in China: The Impacts of Urbanization and Industrialization.” Society of Photo-Optical Instrumentation Engineer 5884: 135–49.
Huang, Ming-hua, Mo Chen, and Jing-wen Zhang. 2011. “The Linkage Plan of Urban-Rural Construction Land-Use Necessity and Must of Urbanization and Farmland Protec-tion.” Urban Planning and Design 1: 61–65.
Li, Hongbin, Lei Li, Binzhen Wu, and Yanyan Xiong. 2012. “The End of Cheap Chinese Labor.” Journal of Economic Perspectives 26 (4): 57–74.
Li, Suqin, and Hengyi Li. 2012. “Resource Endowment Advantage Reversion and Coun-termeasures in the Construction of Henan Grain Core Area.” Chinese Journal of Agricul-tural Resources and Regional Planning 33 (3): 3–44.
Lohmar, Brian, and James Hansen. 2007. “Inter-actions Between Resource Scarcity and Trade Policy: The Potential Effects of Water Scarcity on China’s Agricultural Economy under the Current TRQ Regime.” Paper presented at the International Agricultural Trade Research Consortium Summer Symposium, Beijing, China, July 8–9.
Ma, Yong-huan, and Wen-yuan Niu. 2009. “Fore-casting on Grain Demand and Availability of Cultivated Land: Use Resources Based on Grain Safety in China. China Soft Science 3: 11–16.
Ministry of Water Resources. 2006–10. Water Resources Bulletin. Beijing: China Water Power Press.
Mu, Guangzong, Changbao Mao, Jinjing Wu, and others. 2013. “Study on the Popula-tion Vulnerability and Optimization in Rural China.” Journal of China Agricultural Univer-sity (Social Sciences Edition) 30 (3).
Nie Fengying, Jieying Bi, and Xuebiao Zhang. “Study on China’s Food Security Status.” Pro-ceedings of the International Conference on Agricultural Risk and Food Security 2010 1: 301–10.
NSBC (National Statistical Bureau of China). 2012. China Statistical Yearbook. Beijing: Statistical Press.
———. 2011. China Statistical Yearbook. Bei-jing: Statistical Press.
———. 2000. National Rural Household Survey. Beijing: China Statistical Press.
———. 1990. China Statistical Yearbook. Bei-jing: China Statistical Press.
Otsuka, Keijiro. 2013. “Food Insecurity, Income Inequality, and the Changing Comparative Advantage in World Agriculture.” Agricultural Economics 44 (s1): 7–18.
Rask, Kolleen, and Norman Rask. 2011. “Eco-nomic Development and Food Production-

370 U r b a n C h i n a
Consumption Balance: A Growing Global Challenge.” Food Policy 36 (2): 186–96.
Shu, Jian-ling, and Quan Chen. 2012. “Dynamic Relationship between China’s Urbanization and the Food Security. Journal of Xi’an Uni-versity of Finance and Economics 25 (3): 11–15.
Taylor, J. Edward, Scott Rozelle, and Alan de Brauw. 2003. “Migration and Incomes in Source Communities: A New Economics of Migration Perspective from China.” Economic Development and Cultural Change 52 (1): 75–101.
Wang, Jinxia, Jikun Huang, and Scott Rozelle. 2013. “Urbanization, Agricultural Water Use and Crop Production in China.” Project report submitted to the World Bank and Development Research Center of the State Council, Center for Chinese Agricultural Policy, Beijing.
Wang, Jinxia, Jikun Huang, and J. Yang. 2009. “Climate Change, Water and Agricultural Development in the 3H Region and Overall China.” Project report submitted to the World Bank, Center for Chinese Agricultural Policy, Beijing.
Wang Jinxia, Zhigang Xu, Jikun Huang, and Scott Rozelle. 2005. “Incentives in Water Management Reform: Assessing Effect on Water Use, Production and Poverty in the
Yellow River Basin.” Environment and Devel-opment Economics 10: 769–99.
Wang, Xiahui, Huiyuan Zhang, Wang, Bo, and others. 2008. “Research on Environmental Safety in Rapid Urbanization Process. Urban Problems 5 (3): 11–15.
Wang, Xiaobing, Jikun Huang, and Scott Rozelle. 2013. “Wage Growth and Mechanical Opera-tion: Evidence from Rural China.” Project report submitted to the World Bank and Devel-opment Research Center of the State Council, Center for Chinese Agricultural Policy, Beijing.
Wen, Qi, and Ding Jin-mei. 2011. “Optimal Path and Strategy of Regional Industrial Structure under Water Resources Intimidation: A Case Study of Yulin.” Research of Agricultural Modernization 32 (1): 91–96.
Wu, Laping. 2013. “A Study of Impacts of Urban-ization on China’s Demand for Grains.” Report, China Agricultural University, Beijing.
Zhang, Linxiu, Renfu Luo, Chengfang Liu, and Scott Rozelle. 2006. “Investing in Rural China-Tracking China’s Commitment to Mod-ernization.” Chinese Economy 39 (4): 57–84.
Zhao, Jingzhu, Qishan Luo, Hongbin Deng, and Yan Yan. 2008. “Opportunities and Chal-lenges of Sustainable Agricultural Develop-ment in China.” Philosophical Transactions of the Royal Society 363: 893–904.

371
6
Financing Urbanization
introductionChina’s current approach to fi nancing urban-ization has been reasonably successful in mobilizing the resources that cities have needed to grow their economies, build the infrastructure required by the economy, and deliver services to the expanding urban popu-lation. China has experienced a high growth of urbanization for three decades, and the way China has proceeded with urbanization has been pro-growth, with resources being effectively mobilized and geared toward industries and productive infrastructure. In turn, the high economic growth has contrib-uted to improvements in household welfare through higher income and better public ser-vices and infrastructure. This approach has served China’s interest fairly well.
As China enters a new stage of develop-ment, the downsides of this old pro-growth urbanization model have become more apparent. The existing urbanization model has relied heavily on land conversion and land financing, and on production-based derivative taxation, which has caused urban sprawl and, on occasion, ghost towns and wasteful development of industrial parks and real estate. In addition, China now faces dual dualism—a “new dualism” between local
hukou and migrant populations and the “old dualism” of urban and rural disparities. This dual dualism, along with its accompanying unequal access to public services between people with and without urban hukou, has acted as a barrier to labor mobility, which has kept China’s urbanization rate too low. At the same time, the large infl ux of migrants puts pressures on urban services, and urban citizens perceive an erosion of service quality. Further, despite progress in environmental standards and policies, the cost of pollution to the nation’s health is rising as China’s pop-ulation is increasingly concentrated in cities. At the same time, land-intensive urbanization has reduced availability of farm land, increas-ing competition for scarce water resources and adding to pollution that undermines agricultural productivity.
China’s shift to a new urbanization path—one that is efficient, inclusive, and sustainable—to support its transformation into an innovative, modern, and harmoni-ous economy in the next decades will require adjustments in the fi nancing system. Given the expected economic and social trends, as well as the policy goals pursued by the politi-cal leadership, maintaining past financing policies without change is neither feasible nor desirable. First, the cities—now hosting

372 U r b a n C h i n a
more than 700 million people—can expect up to 300 million more migrants over the next two decades. Second, the disparities between original and new urban residents, and the backlogs in the quantity and qual-ity of public services in rural regions, must be addressed. Third, economic growth will slow as the economy matures. These changes will have significant impacts on the demand for public services, on the cost and ways of delivering them, and on revenue mobiliza-tion. Many are concerned about the budget implications of such changes and wonder which public finance reforms are needed to ensure that China can afford urbanization in the next decades.
This report first reviews the main features of the new urbanization, measures the costs of urbanization, and evaluates its affordabil-ity. It then explores how well suited the exist-ing urbanization finance system is to the chal-lenges posed by the new urbanization. The diagnosis is focused on three sectors—public social services, infrastructure investment, and affordable housing. It concludes that the existing finance system that has worked well in leading an investment-driven economic growth strategy will work less well in a new, more urban China. In fact, some fundamen-tal weaknesses in the existing system have already emerged, causing significant effi-ciency, equity, and environmental costs and threatening financial sustainability. The chal-lenges for financing urbanization are, there-fore, more about addressing these underlying weaknesses than filling the financing gap for public services and infrastructure spending.
As the main part of the report discusses, the centerpiece of the reforms in urban finances will be a move toward a system that more clearly separates the traditional function of government—the provision of equitable and efficient levels of basic public services—from commercial investment and production functions. The emphasis of subnational gov-ernments will be on the delivery of local pub-lic services, and the rewards for local leaders should depend on how well they perform this responsibility. The fiscal system will need to encourage people and enterprises to move to the places where they are most productive, not to where they get the best tax or land deal from a local government. Revenues from land
conversion are likely to taper off, so new local revenue sources are needed to replace lost revenue, whereas properly regulated access to borrowing will be needed to finance infra-structure investment. The financial sector will need to intermediate capital efficiently to meet local governments’ needs for infrastruc-ture finance, while at the same time imposing financial discipline on local governments and avoiding financial sector disruption. The pri-vate sector will need to play a larger role in financing and delivering infrastructure invest-ment and other public services.
To move in this direction, government will need to make important decisions about numerous key features of the financing sys-tem, including the following:
Aligning public finance with functions. Functions need to be appropriately assigned to either the central government or local gov-ernments; functions with strong externalities such as funding social security could be cen-tralized; the tax base could be shifted from production based to consumption based; revenue responsibilities between the central and local governments could be reassigned to follow the functions; local governments need to be given revenue-raising powers; and the budget system needs to be reformed in a way that will give subnational governments the ability to effectively plan and control the allocation of fiscal resources. Also, a stron-ger interprovincial and intraprovincial equal-ization program needs to be put in place to ensure sufficient funding for basic public service packages, and the transparency and accountability of local governments should be strengthened. This would be no small reform.
Abandoning the monopoly on land leases. The increments in land value that emanate from better infrastructure services must be captured in a less distorted way (through property taxes, for example), and these funds must be used to subsidize investment in infra-structure. Government should also develop regulatory rules to mitigate the fiscal risks emanating from land market volatility while obtaining the best economic value of land assets that local governments have already acquired.

f i n a n C i n g U r b a n i z a t i o n 373
Developing stable and sustainable debt finance. Local government financing vehi-cles (LGFVs) should be either absorbed by government or converted to special purpose vehicles (SPVs); local governments should be allowed to borrow on budget; a rigorous regulatory framework needs to be developed to better manage the debt risks; the sources of long-term financing for local governments and SPVs need to be diversified; and the incentives for local governments, SPVs, and their lenders should be aligned so that all of them pursue creditworthy financing.
Promoting the involvement of the private sector in broader urban development. China may consider shifting the focus of PPP con-tracts from capital financing toward service provision by bundling investments for asset creation with operation and maintenance requirements over a long period of time. This requires improving policies and incentives for the private provision of public services. And careful risk assessment and proper risk shar-ing are needed to manage contingent liabili-ties related to PPP contracts. To strengthen institutional capacity, special PPP units may be established at the local level.
Clarifying the role of housing provident funds (HPFs) in the affordable housing program. Alternative means of financing the program need to be explored, including direct subsidies from government revenues, contributions from employers, and partner-ships with the private sector.
Urbanization in transition and its implication for financingCan China afford the new urbanization path? Provided a major structural reform of its financial model is implemented, the answer is an emphatic yes. Managing the government sector, especially the urban local governments, will present a serious public policy challenge. The government will need to decide whether public financing policy in the next two decades is dictated by find-ing quick fixes for the problems, or whether a major structural reform should be under-taken to get ahead of the problems.
Financing challenges from the new urbanization path
Urbanization will challenge government expenditures and the capacity to deliver social services. The next two decades will see 300 million more people living in urban areas. The urban population will increase to about two-thirds of the total population by 2030, from slightly more than half currently.1 Along with the expected rebalancing of the growth pattern and increasing income levels, new demands from urban households and business will have to be met. Families living in metropolitan areas, especially the hoped-for emerging middle class, will be looking to upgrade their housing and access better urban amenities and social services. New service industries will be asking for loca-tions closer to population centers and for a different package of infrastructure and social services from that sought by manufacturing industries (Yusuf 2013). Compliance with the environmental protection standards set by the central government also will be an issue (see supporting report 7: Green Urban-ization). Against this backdrop, significant additions to the existing urban infrastructure and improvements in service delivery will be required to ensure that cities can accommo-date new residents and meet new demands. Local governments in particular will feel the budget pressures associated with capital and operation and maintenance expenditures.
For urbanization to be inclusive and to avoid social fragmentation, cities must pro-vide equal access to public services to both original and new urban residents. For most public services such as compulsory education and health, a national residence-based sys-tem is now in effect.2 In practice, however, some cities offer better entitlements to public services and easier access to resident worker permits than do others. Disparities in access to affordable housing are already a concern, with only 10 percent of migrants owning their urban residence compared with 84 per-cent of hukou residents. Equalization policies, therefore, will have to address the existing duality between urban residents with hukou and those without. In addition, equalization policies will have to manage the additional economic and social pressures that further

374 U r b a n C h i n a
migration to cities potentially could bring. Only 20 percent of migrants now move to cit-ies with their entire family, but this pattern will change in the future as adequate educa-tion, health services, and affordable housing become available to them (Wang, Shen, and Li 2008). Because of the large gaps in the quantity and quality of public services across provinces and between rural and urban areas, any policy change facilitating the access of migrant workers to urban services should go hand in hand with improvements in rural services, lest rural residents be encouraged to migrate to cities solely to access better social services.3 Finally, local resentment toward the migrant worker community may arise from the fear that larger demands will cause overall service levels to deteriorate or that migrants will receive preferential treatment without paying their fair share of the costs. China will have to manage integration chal-lenges of this kind, which the United States and Europe also have experienced.
Expenditure management needs to be adapted to the new urbanization path. Annual economic growth in China is pro-jected to remain at around 7 percent for the next few years, gradually declining to about 6 percent by 2020 and to 5.5 percent by 2030. Even though that is healthy economic growth by world standards, it will not generate the fast-growing fiscal revenues of the past two decades. If government officials in charge of expenditure programs were to make budget plans based on a growth rate extrapolated from the past trend, they would risk planned expenditures growing much faster than actual revenues, which ultimately would raise public financing concerns. In addition, gov-ernment officials should plan for new spend-ing pressures, notably an aging population demanding higher pension and health outlays and a society more concerned with environ-mental sustainability, which requires actions to cope with congestion and pollution. As revenue growth slows and new spending pressures arise, the expansion of some gov-ernment spending programs will have to be contained and more emphasis given to cost rationalization and control.
Structural reform is necessary to man-age the expenditure pressures from the new
urbanization path, particularly as the hukou system is removed and urban-rural dispari-ties are narrowed. The immediate financing problem is to absorb and service the new residents and workers in cities without harm-ing the quality of life of the existing urban population.4 New financing policies that address resource constraints and insufficient service delivery capacity, especially among local governments, must be formulated to ensure that expenditures and revenues grow hand in hand, thus avoiding a buildup of unsustainable fiscal pressures. Incentives for government officials to implement these policies effectively will have to be in place as well. In this regard, urbanization in China is less efficient, inclusive, and sustainable than the central government would like it to be. Local governments have not fully complied with many goodwill policies that have been issued by the central government, suggesting that incentive is a major issue to consider in designing a reform.
Structural reform is also indispensable to mobilizing additional resources to finance increasing urbanization costs, especially at the local government level. Urbaniza-tion potentially can generate sufficient fiscal resources to cope with the increasing expen-ditures. Migrant workers can reduce the labor shortage that constrains the expansion of private sector output and thus help attract more capital and exploit economies of scale and agglomeration effects. That should lead to an increase in value added and incomes, therefore also raising revenue from major tax sources. Migrant workers also can add to the government revenues with their taxable con-sumption and their contributions to social security schemes.5 Yet the potential revenues from urbanization will materialize only to the extent that the right incentives to local officials are in place. Incentives to promote manufacturing and generate land revenues in sprawling cities must be replaced by incen-tives to promote services and mobilize new revenue sources in dense cities (see support-ing report 1 on Urbanization and Economic Growth). In addition, incentives facing the local cadre system should include a longer-time horizon and place more weight on pro-viding the particular bundle of services that

f i n a n C i n g U r b a n i z a t i o n 375
the local economy needs to support an effi-cient, inclusive, and sustainable urbanization (Zhou 2007; Li and Zhou 2005).
Structural reform will have to deal with heterogeneity of urbanization across China. The budgetary impacts of urbanization will be anything but uniform across cities. Needs, resources, goals, and social values differ widely throughout China. Residents and businesses in some cities will demand higher levels of service, the cost of service provision will be greater in others, and the backlog of infrastructure needs will be larger in yet oth-ers. Even if the additional fiscal revenues from urbanization turns out to be large enough at the aggregate level to cover the incremental cost of providing basic services in all urban areas, they will not be large enough for every individual urban area. To accommodate these differences in preferences and expenditure needs, local governments should be given more control over the amount of revenues that they can raise to meet their responsibili-ties. In addition, the net cost to the govern-ment budget would be significantly reduced if fiscal resources were distributed based on serviced population; for example, transfers and subsidies for education, pensions, and health insurance benefiting the rural popula-tion can be reallocated to cities if and when workers migrate to there.6
Can China afford the new urbanization path?
How much will urbanization cost the Chi-nese economy? A quantitative model devel-oped by World Bank staff estimates the total costs of all urban public services, infrastruc-ture, and social housing. Significant invest-ments would be necessary to meet demands arising from the current pattern of urbaniza-tion and the government policies in place. Consistent with the macroeconomic and demographic projections obtained from Chi-na’s Development Research Center (DRC) model for the period 2013–30, the model projects capital, operation, and maintenance expenditures required to erect urban infra-structure (including roads, subways, drain-ing, sewage, landscaping, garbage treatment,
water, and heating) and to supply social housing, education, and health to urban-ites, covering both the capital expenditure (CAPEX) and the current expenditures such as the operation and maintenance expendi-ture (OM), as well as the labor cost of urban education). Simulations focus on the gross cost of delivering infrastructure and social services to migrants at urban standards, without deducting savings (if any) that may be attained by eased spending pressures in the rural areas from which the migrants orig-inate. Annex 6A provides a technical annota-tion to the modeling methodology.
In the costing model, the volume of physi-cal investment in the selected sectors that is required to support urbanization responds to fundamentals (such as the size and density of the population living in cities, the number of students, the number of households benefit-ing from social housing) as well as to public policies determining coverage of social ser-vices and eligibility criteria to access them. The unit cost of investing in physical capital is calibrated using historical data and pro-jections that follow trends in urban incomes and prices. Public policies regulating quality and generousness of social services also affect unit costs.
Simulations from the model suggest that overall costs of urbanization will gradually decline as a share of gross domestic product (GDP). The total annual costs of all urban public services, infrastructure and social housing would average 6.1 percent of GDP in 2013–30, with a peak of 7.3 percent in the early period (2013–17) due to migrant inte-gration and the government’s ambitious social housing program (table 6.1; figure 6.1). As a consequence of the policy stimulus pursued in 2009–12 to cope with the global crisis, the projected investment bulge in the next few years reflects the ongoing construction plans to extend social housing programs. Long-term cost estimates phase out these temporary phe-nomena and acknowledge that the urbaniza-tion process will persist, but at a slower pace than in the past. For 2013–30, the annual capital, operation, and maintenance expen-ditures related to urban infrastructure would reach 2.5 percent of GDP, on average; those costs associated with education and health

376 U r b a n C h i n a
would be 2.8 percent of GDP; and social housing would amount to 0.7 percent of GDP.
How much of the estimated capital, opera-tion, and maintenance expenditures would central and local governments bear? Public and private sectors will share these increased costs of urbanization. The model assumes that the proportion taken by the public sec-tor remains at the historic level, around three-fourths. For instance, the public sector finances 62 percent of all urban infrastruc-ture; 100 percent of social housing, health (hospitals), and compulsory education (pri-mary and junior-middle schools); and 29 per-cent of noncompulsory education (vocational and senior high schools). Operation and maintenance expenditures are fully funded
by the government in all urban infrastructure sectors, social housing, and health. The gov-ernment also funds all of these costs for com-pulsory education, but only about 75 percent of the recurrent costs of noncompulsory edu-cation, with tuitions and donations covering the remaining amount. 7
Will the fiscal space be sufficient to finance the investments required by urbanization in its current form, under the existing pub-lic policies? The resource envelope avail-able to fund expenditures, also referred to as the fiscal space, comprises two financing sources: government revenues resulting from fiscal policies, and government borrow-ings (both on- and off-budget), whose level is consistent with preserving debt sustain-
Table 6.1 Urbanization costs and fiscal space: baseline scenarioShare of GDP
2008–12 2013–17 2018–30 2013–30
Urbanization costs (CAPEX and OM) 8.6 7.3 5.6 6.1 Infrastructure investment 3.5 2.7 2.5 2.5 Roads 1.9 1.4 1.2 1.3 Subways 0.5 0.6 0.6 0.6 Draining 0.1 0.1 0.1 0.1 Sewage 0.2 0.1 0.1 0.1 Landscaping 0.4 0.3 0.2 0.2 Garbage treatment 0.1 0.1 0.1 0.1 Water 0.2 0.1 0.1 0.1 Heating 0.1 0.1 0.1 0.1 Social services 5.1 4.6 3.1 3.6 Social housing 2.0 1.4 0.5 0.7 Education (includes labor costs) 3.1 3.2 2.6 2.8 Health 0.0 0.0 0.0 0.0
Central and local governmentsUnchanged land and debt financing policies
Fiscal space 33.3 31.8 30.4 30.8 Fiscal revenues 25.0 26.5 25.9 26.0 Net borrowings 8.3 5.3 4.5 4.7 Total expenditure 31.9 31.1 29.6 30.0 Recurrent primary expenditures 23.6 23.6 23.3 23.4 Capital expenditures 6.0 4.7 3.4 3.8 Interests 2.3 2.9 2.9 2.9
Central and local governmentsAbandoning land and debt financing policies
Fiscal space 33.3 29.5 27.3 27.9 Fiscal revenues 25.0 25.8 25.2 25.4 Net borrowings 8.3 3.7 2.1 2.5 Total expenditure 31.9 30.9 28.7 29.3 Recurrent primary expenditures 23.6 23.6 23.3 23.4 Capital expenditures 6.0 4.7 3.4 3.8 Interests 2.3 2.7 2.0 2.2
Source: Staff estimation.Note: Figures are annual averages for selected periods. CAPEX = capital expenditure; OM = operation maintenance expenditure.

f i n a n C i n g U r b a n i z a t i o n 377
ability and financial stability. Whether the prospective fiscal space would be enough to accommodate urbanization costs and other public expenditures responsibilities is a key question.
The costing model assesses the afford-ability of urbanization costs (or lack thereof) by confronting estimates of fiscal space and total expenditure, for which it projects fis-cal revenues, government net borrowings, and public expenditures other than urban-ization costs. Fiscal revenues include taxes, nontax receipts, and land-leasing receipts (net of land acquisition and relocation compensation costs). They are driven by the DRC macroeconomic projections and assumptions on land financing policies. Bor-rowings include all direct government debts and the indirect debts of local governments contracted through their financial vehicles. Net borrowings are projected assuming a target level of public debt relative to GDP, with the target summarizing outcomes pur-sued by debt-financing policies. Expendi-tures other than urbanization costs are pro-jected consistently with the DRC model and the prospective nominal GDP rate. These expenditures are added to the estimated urbanization costs to obtain the projection of total expenditure.
If the current policies concerning land and debt financing were continued into the future, the fiscal space would just cover the total inclusive expenditures of urbanization costs. With unchanged policies, the annual net land-leasing receipts would be 0.8 per-cent of GDP in 2013–30, whereas the annual net borrowings would amount to 4.7 percent of GDP, maintaining the public debt-to-GDP ratio at 53 percent (which was the level reached in 2012, after large borrowings by local governments to fund fiscal stimulus and cope with the global crisis). Model simula-tions suggest that fiscal space could afford the costs of urbanization borne by the govern-ment: in 2013–30, on average, the estimated annual fiscal space is 30.8 percent of GDP and the total expenditure is 30 percent of GDP (figures 6.2a, 6.3a). Even the expected investment bulge in the next few years would be affordable within the projected fiscal reve-nues and net borrowings. But the fiscal space leaves very little margin to cope with unfore-seen, unfavorable events, and thus public finances would be in a fragile position and lack flexibility. More important, a continu-ation of the current policies governing land and debt financing would mean that inef-ficiencies would persist in the urbanization process, including excessive urban sprawl,
FigUre 6.1 Cost of urbanization as a share of gDP
Data source: Staff estimation.Note: CAPEX = capital expenditure; OM = operation maintenance expenditure.
10
9
8
7
6
5
4
3
2
1
02008 2009 2010 2011 2012 2013 2014 2015 2016 2017 2018 2019 2020 2021 2022 2023 2024 2025 2026 2027 2028 2029 2030
Perc
ent o
f GD
P
Urban public housing OM Urban public housing CAPEX Urban health CAPEX
Urban education CAPEX, OM, and labor Urban infrastructure OM Urban infrastructure CAPEX

378 U r b a n C h i n a
social problems related to land conversion and compensation to displaced farmers, and risks associated with off-budget borrowing.
Abandoning the current policies con-cerning land and debt financing altogether, rather than reforming them properly, would significantly reduce the fiscal space and risk derailment of the new urbanization path. Alternative model simulations assume that farmers are given full compensation, which causes net land-leasing receipts to drop in 2015–30 (yet continuing with land leases and urban sprawl), and that the local gov-ernments’ net borrowings (most notably the
off-budget debts) are severely restricted to reduce the public debt-to-GDP ratio from 53 percent in 2012 to 30 percent in 2030. With these radical policy changes, the annual net land-leasing receipts are zero after 2015 and the annual net borrowings would amount to 2.5 percent of GDP on average. Costs of urbanization would no longer be affordable: in 2013–30, on average, the estimated annual fiscal space is 27.9 percent of GDP and the total expenditure is 29.3 percent of GDP (fig-ures 6.2b, 6.3b). Proper structural reform, therefore, should guide the revision of financ-ing policies.
Would structural reform leading to a more efficient, inclusive, and sustainable urban-ization path ensure that such an urban-ization path is also affordable? The high-quality urbanization scenario envisions an ambitious (yet feasible) structural reform package to achieve a higher urbanization rate, a faster real GDP growth, a rebalanced economy with more consumption expendi-ture and service output, and smaller urban-rural income disparities compared with the baseline scenario. In addition, policies con-cerning land and debt financing are properly reformed in two directions. First, land pol-icy reform aims at transforming local gov-ernment revenues from a land-transaction basis to a real estate-property basis, creat-ing incentives to rationalize the use of land resources and to redirect the urbanization pattern from a horizontal expansion of cities toward a vertical expansion with higher pop-ulation density. Second, debt policy reform seeks to establish a sound legal and opera-tional framework for local governments to borrow on-budget and in a sustainable man-ner, as well as to significantly slow down the rapid pace of indebtedness incurred by local governments.
Given fewer incentives to seek a horizon-tal urban expansion (that is, sprawling cit-ies), the built-up urban area is assumed under the model to stabilize at the current level, and thus urban population density increases going forward. Higher density reduces the required capital, operation, and maintenance expenditures related to urban infrastructure by 0.7 percentage points of GDP vis-à-vis the baseline scenario (table 6.2; figure 6.4).
FigUre 6.2 government expenditures as a share of gDP
Source: Staff estimation. Note: CAPEX = capital expenditure.
35
30
25
20
15
10
5
0
20082009201020112012201320142015201620172018201920202021202220232024202520262027202820292030
Perc
ent
a. Unchanged land and debt-financing policies
b. Abandoning land and debt-financing policies
35
30
25
20
15
10
5
0
20082009201020112012201320142015201620172018201920202021202220232024202520262027202820292030
Perc
ent
Recurrent expenditures, others CAPEX, othersRecurrent expenditures, urbanization costCAPEX, urbanization cost Interests
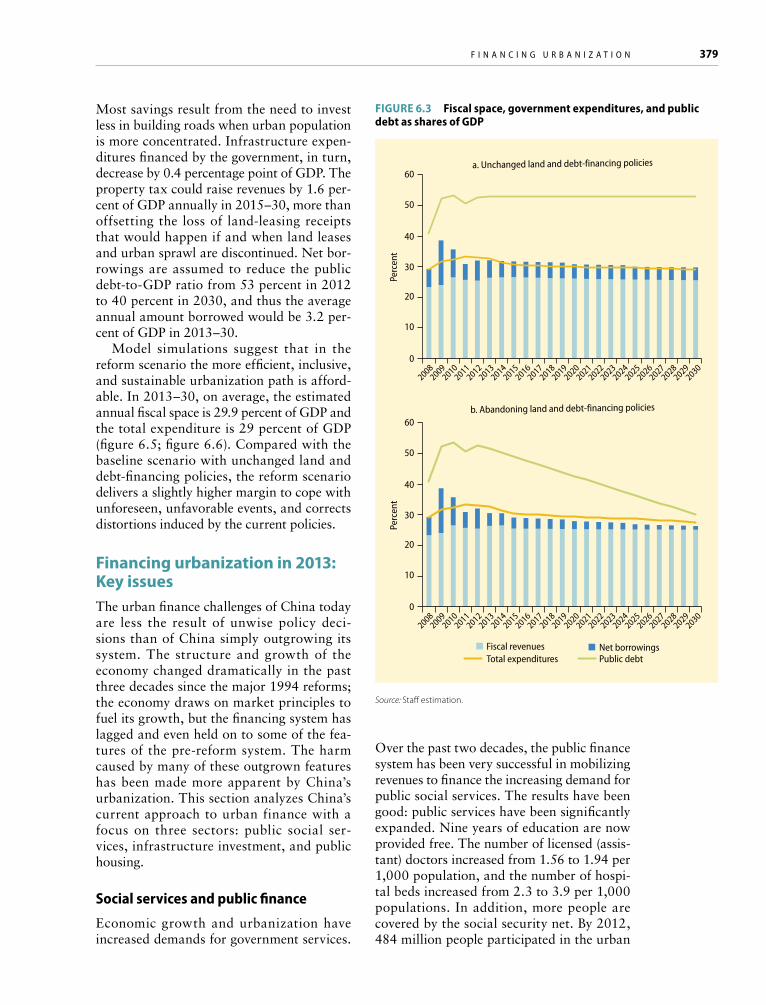
f i n a n C i n g U r b a n i z a t i o n 379
Most savings result from the need to invest less in building roads when urban population is more concentrated. Infrastructure expen-ditures financed by the government, in turn, decrease by 0.4 percentage point of GDP. The property tax could raise revenues by 1.6 per-cent of GDP annually in 2015–30, more than offsetting the loss of land-leasing receipts that would happen if and when land leases and urban sprawl are discontinued. Net bor-rowings are assumed to reduce the public debt-to-GDP ratio from 53 percent in 2012 to 40 percent in 2030, and thus the average annual amount borrowed would be 3.2 per-cent of GDP in 2013–30.
Model simulations suggest that in the reform scenario the more efficient, inclusive, and sustainable urbanization path is afford-able. In 2013–30, on average, the estimated annual fiscal space is 29.9 percent of GDP and the total expenditure is 29 percent of GDP (figure 6.5; figure 6.6). Compared with the baseline scenario with unchanged land and debt-financing policies, the reform scenario delivers a slightly higher margin to cope with unforeseen, unfavorable events, and corrects distortions induced by the current policies.
Financing urbanization in 2013: Key issuesThe urban finance challenges of China today are less the result of unwise policy deci-sions than of China simply outgrowing its system. The structure and growth of the economy changed dramatically in the past three decades since the major 1994 reforms; the economy draws on market principles to fuel its growth, but the financing system has lagged and even held on to some of the fea-tures of the pre-reform system. The harm caused by many of these outgrown features has been made more apparent by China’s urbanization. This section analyzes China’s current approach to urban finance with a focus on three sectors: public social ser-vices, infrastructure investment, and public housing.
Social services and public finance
Economic growth and urbanization have increased demands for government services.
Over the past two decades, the public finance system has been very successful in mobilizing revenues to finance the increasing demand for public social services. The results have been good: public services have been significantly expanded. Nine years of education are now provided free. The number of licensed (assis-tant) doctors increased from 1.56 to 1.94 per 1,000 population, and the number of hospi-tal beds increased from 2.3 to 3.9 per 1,000 populations. In addition, more people are covered by the social security net. By 2012, 484 million people participated in the urban
FigUre 6.3 Fiscal space, government expenditures, and public debt as shares of gDP
Source: Staff estimation.
a. Unchanged land and debt-financing policies
b. Abandoning land and debt-financing policies
Fiscal revenuesTotal expenditures Public debt
Net borrowings
60
50
40
30
20
10
0
Perc
ent
20082009201020112012201320142015201620172018201920202021202220232024202520262027202820292030
60
50
40
30
20
10
0
Perc
ent
20082009201020112012201320142015201620172018201920202021202220232024202520262027202820292030

380 U r b a n C h i n a
Table 6.2 Urbanization costs and fiscal space: reform scenarioPercent of GDP
2008–12 2013–17 2018–30 2013–30
Urbanization costs (CAPEX and OM) 8.5 6.8 4.9 5.4 Infrastructure investment 3.4 2.1 1.7 1.8 Roads 1.8 0.9 0.7 0.7 Subways 0.5 0.6 0.6 0.6 Draining 0.1 0.1 0.0 0.0 Sewage 0.2 0.1 0.1 0.1 Landscaping 0.4 0.2 0.1 0.1 Garbage treatment 0.1 0.1 0.1 0.1 Water 0.2 0.1 0.1 0.1 Heating 0.1 0.1 0.1 0.1 Social services 5.1 4.8 3.2 3.6 Social housing 2.0 1.4 0.5 0.7 Education (includes labor costs) 3.1 3.3 2.7 2.8 Health 0.0 0.0 0.0 0.0
Central and local governmentsReform scenario
Fiscal space 33.3 29.8 29.9 29.9 Fiscal revenues 25.0 26.7 26.7 26.7 Net borrowings 8.3 3.1 3.3 3.2 Total expenditure 31.8 30.5 28.3 28.9 Recurrent primary expenditures 23.6 23.6 23.2 23.3 Capital expenditures 5.9 4.3 3.0 3.4 Interests 2.3 2.6 2.1 2.2
Source: Staff estimation.Note: Figures are annual averages for selected periods. CAPEX = capital expenditure; GDP = gross domestic product; OM = operation maintenance expenditure.
or rural residents’ pension program, 304 mil-lion were in the employee pension program, and 265 million were in the employee health insurance program. (See supporting report
3: Inclusive Urbanization and Rural-Urban Integration for detailed discussion.)
Most of China’s public services, such as education, health care, social security, envi-
FigUre 6.4 Cost of urbanization in the reform scenario, as a share of gDP
Source: Staff estimation.Note: CAPEX = capital expenditure; GDP = gross domestic product; OM = operation maintenance expenditure.
10
9
8
7
6
5
4
3
2
1
02008 2009 2010 2011 2012 2013 2014 2015 2016 2017 2018 2019 2020 2021 2022 2023 2024 2025 2026 2027 2028 2029 2030
Perc
ent
Urban public housing OM Urban public housing CAPEX Urban health CAPEX
Urban education CAPEX, OM, and labor Urban infrastructure OM Urban infrastructure CAPEX

f i n a n C i n g U r b a n i z a t i o n 381
ronmental protection, transportation, and community affairs, are provided and financed by local governments.8 Education (94 percent local) and health (95 percent local) are the fastest-growing public expenditure categories. The result is that China’s local governments account for more than 80 percent of all gen-eral government expenditures. This high share
does not include local government spending on social security or infrastructure (figure 6.7). As a result, China is an extreme outlier in terms of the subnational share of govern-ment expenditures. The local government share of government spending is 41 percent in such decentralized countries as Canada and Germany and 48 percent in the United States.
FigUre 6.5 government expenditures in reform scenario as a share of gDP
Source: Staff estimation. Note: CAPEX = capital expenditure; GDP = gross domestic product.
2008 2009 2010 2011 2012 2013 2014 2015 2016 2017 2018 2019 2020 2021 2022 2023 2024 2025 2026 2027 2028 2029 2030
35
30
25
20
15
10
5
0
Perc
ent
Recurrent expenditures, others CAPEX, others Recurrent expenditures, urbanization cost CAPEX, urbanization cost Interest
FigUre 6.6 Fiscal space, government expenditures, and public debt in reform scenario as shares of gDP
Source: Staff estimation.
Fiscal revenues Total expendituresNet borrowings Public debt
60
50
40
30
20
10
0
Perc
ent
2008 2009 2010 2011 2012 2013 2014 2015 2016 2017 2018 2019 2020 2021 2022 2023 2024 2025 2026 2027 2028 2029 2030
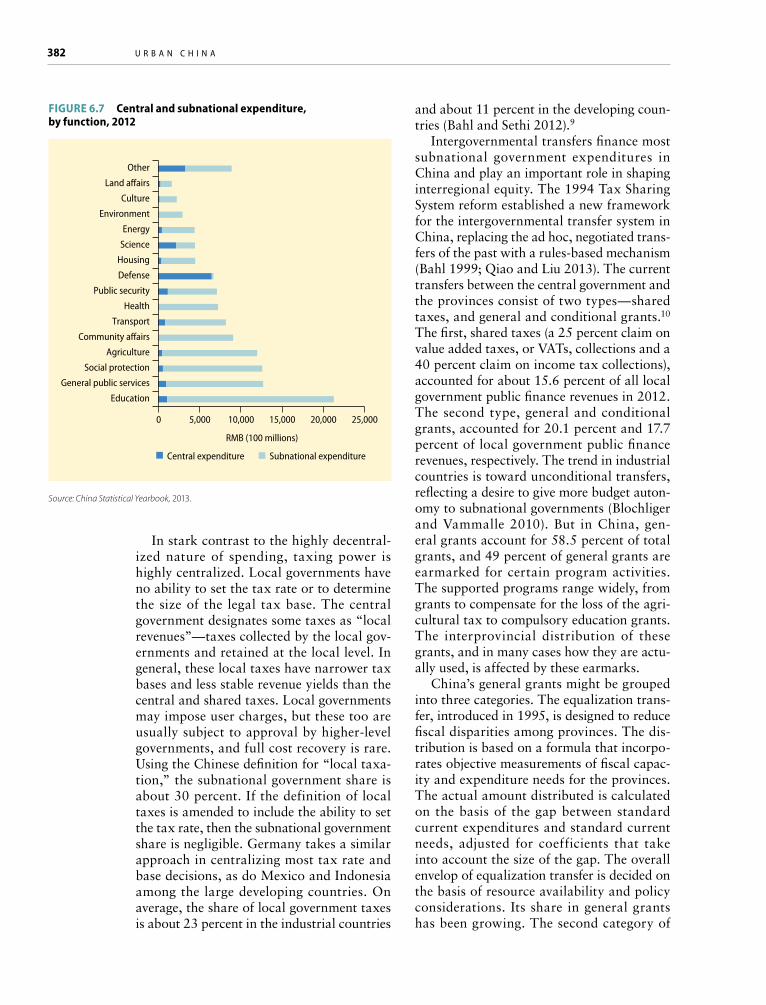
382 U r b a n C h i n a
In stark contrast to the highly decentral-ized nature of spending, taxing power is highly centralized. Local governments have no ability to set the tax rate or to determine the size of the legal tax base. The central government designates some taxes as “local revenues”—taxes collected by the local gov-ernments and retained at the local level. In general, these local taxes have narrower tax bases and less stable revenue yields than the central and shared taxes. Local governments may impose user charges, but these too are usually subject to approval by higher-level governments, and full cost recovery is rare. Using the Chinese definition for “local taxa-tion,” the subnational government share is about 30 percent. If the definition of local taxes is amended to include the ability to set the tax rate, then the subnational government share is negligible. Germany takes a similar approach in centralizing most tax rate and base decisions, as do Mexico and Indonesia among the large developing countries. On average, the share of local government taxes is about 23 percent in the industrial countries
and about 11 percent in the developing coun-tries (Bahl and Sethi 2012).9
Intergovernmental transfers finance most subnational government expenditures in China and play an important role in shaping interregional equity. The 1994 Tax Sharing System reform established a new framework for the intergovernmental transfer system in China, replacing the ad hoc, negotiated trans-fers of the past with a rules-based mechanism (Bahl 1999; Qiao and Liu 2013). The current transfers between the central government and the provinces consist of two types—shared taxes, and general and conditional grants.10 The first, shared taxes (a 25 percent claim on value added taxes, or VATs, collections and a 40 percent claim on income tax collections), accounted for about 15.6 percent of all local government public finance revenues in 2012. The second type, general and conditional grants, accounted for 20.1 percent and 17.7 percent of local government public finance revenues, respectively. The trend in industrial countries is toward unconditional transfers, reflecting a desire to give more budget auton-omy to subnational governments (Blochliger and Vammalle 2010). But in China, gen-eral grants account for 58.5 percent of total grants, and 49 percent of general grants are earmarked for certain program activities. The supported programs range widely, from grants to compensate for the loss of the agri-cultural tax to compulsory education grants. The interprovincial distribution of these grants, and in many cases how they are actu-ally used, is affected by these earmarks.
China’s general grants might be grouped into three categories. The equalization trans-fer, introduced in 1995, is designed to reduce fiscal disparities among provinces. The dis-tribution is based on a formula that incorpo-rates objective measurements of fiscal capac-ity and expenditure needs for the provinces. The actual amount distributed is calculated on the basis of the gap between standard current expenditures and standard current needs, adjusted for coefficients that take into account the size of the gap. The overall envelop of equalization transfer is decided on the basis of resource availability and policy considerations. Its share in general grants has been growing. The second category of
FigUre 6.7 Central and subnational expenditure, by function, 2012
Source: China Statistical Yearbook, 2013.
Other
Culture
Land a�airs
Environment
Science
Energy
Housing
Public security
Defense
Health
Community a�airs
Transport
Agriculture
General public services
Social protection
Education
0 5,000 10,000
RMB (100 millions)
15,000 20,000 25,000
Central expenditure Subnational expenditure

f i n a n C i n g U r b a n i z a t i o n 383
general grants is the “tax rebate,” a return of some additional share of tax collections to richer provinces to lower resistance to tax reforms. Third, the resource shortfall at the subnational level arising from vertical imbal-ance is addressed with gap-filling transfers to local governments (Bahl and Qiao 2013).
The conditional grants carry conditions about the purposes for which the funds will be used and in some cases about the stan-dards of service to be provided; the grants also often require a copayment from local governments. Hundreds of specific-purpose grants are associated with a variety of pro-grams at the central level. An example is the “compulsory education transfer,” intro-duced by the central government in support of the rural compulsory education program. Another example is the transfer introduced to subsidize the issuing of state bonds. Among the most important targets of specific trans-fers are transportation, affordable housing, and education. Many of the conditional transfers were introduced to address specific, immediate needs. Most of these transfers are monitored by a controlling central line minis-try or its provincial counterpart.
With a few exceptions, the transfers from provincial governments to subprovincial gov-ernments are at the discretion of the provin-cial governments. Provincial governments have considerable latitude in deciding expen-diture assignments to subprovincial govern-ments, how much of the intergovernmental transfers received from the central govern-ment they will retain for their own uses, and how they will allocate transfers among their cities and counties. This “federal” financing approach preserves provincial-level auton-omy and allows the use of local information advantages. The result is a good deal of varia-tion across provinces in how the allocations are made to the lower level city and county governments. In some cases, taxes are shared on a derivation basis—with the localities from which they are collected. Formula allo-cations, specific grants, and mandated pass-through of the funds also are used. Provinces have the authority to issue special grants on a project-by-project basis. With respect to the public finance budget, provincial govern-ments have more autonomy in determining
the size of their revenue envelope than do either cities or counties. On average, county governments account for about half of all subnational government spending. Counties are financed more heavily by grants than by shared taxes. For example, in 2009, grants represented 53 percent of all revenues of county-level governments and below, but just 29 percent of prefecture revenue and 23 per-cent of provincial revenue. The land-leasing program has changed things, shifting more revenues to the lower-level governments, par-ticularly to cities.
China’s highly asymmetric public finance system, with its highly decentralized expen-diture assignment and centralized revenues, implies that subnational governments have some control over what services they can deliver but relatively little control over the level of financing. Arguably, such an arrange-ment was the right approach during the past 30 years when the goal was to reward areas that were developing fast by giving them investment money to continue the growth. The strategy to “let some get rich first,” as noted by Deng Xiaoping, was an important part of the early development of the indus-trial economy. This approach has advan-tages—it allows the central government to set the size of the total resource envelope and therefore to control the level of local govern-ment expenditures (importantly, spending from land-lease revenues is not directly con-trolled by the central government). Revenue centralization also has the advantages of allowing central control of the distribution of tax burdens and a capturing of economies of scale in tax administration. Finally, there is an inducement for increased tax effort. Local governments can directly encourage a higher effective tax rate by improving assessment and collection rates. The shared revenues provide an incentive for these revenue mobili-zation efforts. (Bahl 1999; Bahl and Wallich 1992).
Equity and inclusiveness in access to pub-lic services remain major concerns, how-ever. Newcomers to the cities have limited access to urban services because they do not have urban hukou, even though they now account for more than one-third of the urban labor force. This discrimination means

384 U r b a n C h i n a
that migrants often are forced to leave their families in rural areas where access to qual-ity public services may be limited compared with those in urban areas. These challenges to equality in the delivery of public services are intertwined. Reforms such as the elimi-nation of the hukou constraints on access to public services and better portability of pen-sion and health benefits will equalize access to services, encourage labor mobility, and promote household consumption by reducing the need for precautionary savings (see sup-porting report 3: Inclusive Urbanization and Rural-Urban Integration).
The size of general government has grown significantly since 1994 and is roughly in line with the size of government in upper-middle-income countries. China’s expen-diture structure differs from the industrial countries in two important aspects: the gov-ernment spends a relatively larger share on economic activities including subsidies to firms, and a relatively smaller share on health and social protection services (World Bank and DRC 2013); and subnational govern-ments deliver a very high share of services. These two observations suggest that the equity and inclusiveness problem stems less from a financing constraint and more from the incentives and capacity of local govern-ments and from distribution of resources across China. A comprehensive analysis of the public finance system reveals that expen-diture assignments, revenue structure and assignments, and intergovernmental relations all play a role in shaping the incentives and capacity of local governments in delivering equitable and sustainable public services.
Expenditures
The high decentralization of expenditure responsibilities may be explained by China’s size to some extent, but with the new urban-ization pattern, decentralization is raising concern about allocative efficiency losses. Most of the concern centers on three areas: what government should do and what the private sector should do, which level of gov-ernment should be responsible for financ-ing social insurance programs, and whether urbanization has made the case for central-
ization of more responsibility. All three con-cerns have profound implications for the cost of urbanization and for its financing.
With increasing urbanization, cities are better connected, and externalities are less able to be localized, making the fallout from expenditure assignment more appar-ent. If subnational governments are assigned responsibility for services where they cannot internalize externalities, or where they cannot capture economies of scale, the result will be an underprovision of the service or delivery at a higher unit cost. The classic example of spatial externalities is air pollution. Dust and particulates produced in one province can easily reach cities in a neighboring province, and emissions caused by agricultural activi-ties can worsen urban pollution problems. The same result occurs in the case of compe-tition for the use of water. A city government with responsibility for regulating water pollu-tion may choose not to impose costly inspec-tion measures, and this decision could have a negative impact on the national welfare. Or a city government might offer the children of migrant workers a lower-quality primary education, which could lead to undesirable equity effects now and lower labor productiv-ity in the future. In some cases, these interur-ban effects call for direct regional or central government participation in service delivery, and in other cases it requires upper-level gov-ernments to play a strong coordination role, for example, in ensuring everyone benefits from universal public health and education services, and consumer safety. (Lou 2013; Bahl, Linn, and Wetzel 2013; Rojas 2008).
Fiscal subsidies to industries have led to an inefficient pattern of industrial allocation and inefficient land use. Subnational governments frequently use tax exemptions, rebates, and subsidized land to attract industries to their provinces or cities. In the early phase of eco-nomic development when domestic savings were insufficient to finance industrial invest-ment, competition among cities to attract foreign direct investment encouraged subna-tional governments to improve the business environment and infrastructure services. That is one of China’s success stories. As China developed to be upper-middle-income country with abundant domestic savings and

f i n a n C i n g U r b a n i z a t i o n 385
a vibrant private sector, the downside of local governments’ role in industrial promotion has become apparent. Rather than increas-ing investments, the subsidies merely relocate investment from one city to the next, without national gains. In the absence of a subsidy, market forces would drive the location deci-sion of the enterprise. This type of competi-tion among cities also favors local govern-ments, typically in rich regions with more discretionary revenues, and this “beggar thy neighbor” approach can affect another’s suc-cess. Industrial subsidies also can lead to a siphoning of funds away from mainstream government functions and to a horizontal inequality with unsubsidized firms. (Keen and Marchand 1997; Boadway and Shah 2009). Industrial subsidies may have merit when they are targeted at pioneer industries or technology development industries, but in these cases, the granting of the subsidies should be the function of central government.
Fragmented social insurance programs (pensions and health insurance) in China increasingly become a barrier to labor mobil-ity and inclusiveness. These programs are the responsibility of the city and county govern-ments, are managed in a separate local gov-ernment fund for social security, and are financed by payroll tax contributions and government subsidies. The national guide-lines for combined employer and employee contributions are equivalent to about 40 per-cent of wages, but there is considerable varia-tion among the provinces. The new urban-ization model will require increased labor mobility to promote economic growth. The need to support this mobility with portability of benefits, the national nature of the benefits from these programs, and the need to focus more heavily on equalizing real incomes in the population will all push in the direction of increased central financing.
China’s decentralized management and financing of pensions is a significant depar-ture from international practice. Most industrial and developing countries have centralized or largely centralized their old-age pension insurance financing programs. In general, the reasoning is that uniformity in benefits and some guaranteed minimum funding of these programs is in the national
interest. A further problem with the decen-tralized delivery in China is that county and some city governments cannot do the neces-sary risk pooling to finance these programs at mandated national levels. That has led to pooling at the prefecture or provincial level in some provinces. Although this broader base has reduced the risk, there still have been pension arrears and defaults that have forced continuing central and provincial government subsidies (Martinez-Vazquez and Qiao 2011).
The health insurance program, being managed at the county and district level of government in China, is highly fragmented. Effective reimbursement rates vary across counties and districts, due to differences in deductibles, copayments, and ceilings. These rates in turn are a function of disparities in the levels of contributions and local govern-ment subsidies. Besides the equity concerns associated with these disparities, overall risk is higher because of the small size of these insurance pools. In addition, migrants face significant challenges in accessing health care, and there is overlap in registration in the rural and urban programs (Zheng 2012). The international practice on the centralization of health care financing is mixed. The infor-mation advantages give state or provincial governments a comparative edge in program management, and there may be a demand for local tailoring of some services. A not uncom-mon model is to use conditional grants from the national government to finance a signifi-cant share of subnational government expen-ditures on health care. In the United States, the federal government finances and delivers pensions and medical care for retirees but shares the cost of financing medical care for the poor with the state governments. Prov-inces have exclusive responsibility for health care provision in Canada and are supported by federal grants.
The provision of public services within China’s urban areas is also more interrelated and increasingly calls for more intergovern-mental cooperation in planning and service delivery. The need for better coordination is most clear in the case of transportation. Each component of the public transport system is usually of good quality, but door-to-door trips by public transport are inconvenient

386 U r b a n C h i n a
because of poor physical and service integra-tion, often characterized by excessive dis-tances between transfer points, mismatched schedules, separate ticketing systems, and lack of easily accessible transfer facilities. These problems stem mostly from institu-tional fragmentation at the city level, where different agencies (metros, buses, road con-struction, traffic management, and land use) are responsible for different aspects of urban transportation (see supporting report 2: Planning and Connecting Cities for Greater Diversity and Livability).
In addition, ambiguous assignment for expenditure responsibilities undermines the accountability of local governments. Many industrial countries assign expenditure responsibilities to their subnational govern-ments and provide a list of who is respon-sible for what, although some countries do not specify these responsibilities in a central place but rather work them out in sector laws (de Mello 2010). Unlike many countries, China has no exclusive list of functions that is reserved for either the central or the sub-national governments. Rather, a very general description of responsibilities in the Constitu-tion leaves much latitude for interpreting the division of functions. Responsibility is del-egated by administrative decision and varies from province to province, leading to a lack of clarity about exactly who is responsible for what. The result can be a costly duplication in service delivery, a failure to deliver some services, or an inability to identify the level of government responsible for a public service failure. More generally, lack of clear defini-tion and assignment of responsibilities can become a hotbed for either intergovernmen-tal turf wars or buck-passing, and account-ability is in no way guaranteed (Lou 2013).
Revenues
Highly centralized revenue assignment also raises some important public financing prob-lems. First, it means that subnational govern-ments have no way to adjust the tax rate or tax base to pursue new initiatives that require resources above what they are allocated by the transfer system. These shortcomings, and the pressing needs related to urbanization,
explain some of the appeal of land-based financing in recent years.
Second, the existing system leaves subna-tional governments vulnerable to discretion-ary tax policy or revenue-sharing changes by the central government. This set of vertical arrangements not only makes local revenue budgets vulnerable, but it also weakens the accountability of local government officials to both the local constituency and to the upper-level authority.
Third, the absence of formal local govern-ment taxing powers has encouraged subna-tional governments to find creative backdoor approaches to financing service delivery. The relatively unregulated sale of land leases with retention of most revenues, and local govern-ment borrowing through intermediaries such as the LGFVs are cases in point (Bahl 1999; Wong 1997; Liu and Qiao, 2013).
These problems notwithstanding, revenue centralization has worked reasonably well in China. Tax revenues and subnational govern-ment expenditures more than doubled as a share of GDP between 1994 and 2012. That explains how the central government could safely increase the income tax retention rates, and abolish some local taxes, without fear of local government budget shortfalls. But this situation may change. Increased urbaniza-tion will bring significant new expenditure pressures, and a slowdown in the economy will slow revenue growth. The land-leasing bonanza also may slow down with stronger property rights for farmers and better use of existing urban land (see supporting report 3). The absence of a way for local governments to mobilize more of their own budgetary resources may compromise their ability to deliver adequate local services and certainly will compromise their ability to deliver dis-cretionary services of their own choosing.
In addition, several issues concerning the tax structure remain. The tax structure has been further modernized since 1994. The changes have been gradual rather than the result of a “big bang” reform, but they have been effective. The general direction has been toward a more simplified system with broader tax bases, lower tax rates, and improved collection practices, and toward a heavier use of indirect taxes. The value added

f i n a n C i n g U r b a n i z a t i o n 387
tax was converted from a production to a consumption basis beginning in 2009, the differential rates between domestic and for-eign companies under the enterprise income tax were removed in 2008, the coverage of the excise tax has been expanded in recent years, resource taxes on some selected items have been shifted to an ad valorem basis, and most recently, the business tax is being absorbed into the VAT to better cover the service sector and provide relief to companies that make heavy use of service inputs.
The general structure of the individual income tax has not been changed since 1994, but the threshold for payment has been con-tinuously increased. As a result, the number of income taxpayers decreased and the rate of coverage is relatively low as compared to Organisation for Economic Co-operation and Development (OECD) countries. With China’s unequal distribution of income, one might expect a more intensive use of the tax that is designed to address this issue.
At the same time, China imposes a high tax rate on labor income, largely to help finance social insurance schemes (pensions, health, and unemployment compensation). The current level of contributions (employee and employer) is equivalent to about 40 per-cent of wages, which is high by international standards. There are prospects for lower-ing this rate by moving some noninsurance costs and pension “legacy costs” to general revenue financing (see supporting report 3). Social security contributions impose perhaps the major constraint on developing a more broadly based individual income tax.
Property taxation has been much dis-cussed as an option for a major local gov-ernment tax in China. Under the existing regime, China levies five taxes on property: the urban land use tax, which is levied on the physical area of the property, the real estate tax for business use, which is levied on original value, the land value added tax, which is levied on appreciation in property value, the farmland occupation tax, which is levied on area, and the deed tax, which is levied on the self-reported value of prop-erty at the time of transfer. Together, these taxes on real property account for more than 8 percent of national tax revenues (Man
2013). The current levies total 1.6 percent of GDP, well above the rate for developing countries (although below the average rate of 2.2 percent for industrial countries). The problem with the current structure is that it is a hodgepodge of taxes on the physical area and transaction values of properties with no provision for taxing updated values on an annual basis. As a result, the property tax is not used to help shape more efficient land use, to capture value created by public invest-ments, or to provide significant support to local government budgets.
Chongqing and Shanghai municipalities are implementing an experimental annual tax on residential property. The pilot is in its third year in Chongqing. Some progress has been made: the compliance rate is good, and an identification system for all properties has been completed. Shanghai authorized a prop-erty tax on owner-occupied property in 2011. However, both of the pilot projects introduce property taxation with limited coverage of properties and with a very low effective rate of taxation. The pilots do not attempt to inte-grate the property tax with the other forms of property taxation, and the issues of valua-tion and revaluation have been bypassed.
The environmental levy is a “green taxa-tion” approach (Merk and others 2012). Most resource use and pollution occurs in cit-ies or is caused by demand from cities, which also bear some of the greatest impacts. While China has removed many environmentally harmful subsidies and other distortions in the production of energy, it has not yet fully accounted for the costs imposed on health, ecosystems, and the climate that result from resource production and use. The simplest way to impose such a charge is an energy or resource tax on water use to encourage con-servation and carbon taxes that specifically place a charge on greenhouse emissions (see supporting report 7: Green Urbanization)
Intergovernmental transfers
Several important problems arise with the shift of development objectives toward build-ing a harmonious society, and the menu of issues to be addressed by intergovernmental transfers is formidable: Is the vertical alloca-

388 U r b a n C h i n a
tion (between the central and local govern-ments) of central taxes used to support local government spending still “right,” especially given the need to cope with significant urban-ization costs? Has the central government achieved the right level of equalization across local governments and is it using the right instruments to achieve this? Has the transfer system become too complicated to administer effectively? Finally, are the arrangements for sub-provincial revenue sharing in step with government objectives?
Fiscal incentives. China’s version of inter-governmental transfers is different from the mainstream practice in other industrial and developing countries, largely because of its emphasis on derivation-based revenue shar-ing. The major shared taxes (VAT and the corporate and personal income taxes) are shared with the local governments based on the location of collection. This arrange-ment distorts the allocation of resources in two ways: it encourages local governments to hold on to enterprises that should move to new locations because the government derives taxes from them. In addition, the derivation-sharing arrangement dispropor-tionally benefits large cities, because these are often the location of a firm’s headquarters and frequently the place where it pays taxes. This fiscal incentive reinforces the politi-cal incentive for industrial promotion and encourages local governments to place more emphasis on serving firms and industries and less on its core role of providing public ser-vices to residents. This pattern can easily be seen in the composition of the government’s expenditures as well as in land use.
Equalization. In more recent years, the grant component of the transfer system has grown and has done a better job of reduc-ing fiscal disparities. Wang and Herd (2013) find that grants have generated equalization effects both within and between provinces. Persson and Eriksson (2006) report a simi-lar finding based on an empirical study of the 1998–2003 period. Hofman and Guerra (2007) find that interprovincial disparities in the Human Development Index—indicators of service levels—are less than disparities in
per capita GDP. Nevertheless, the interpro-vincial fiscal disparities remain large and are only slightly less dispersed than those in per capita GDP.
These disparities are not surprising given the wide disparities in the natural advantages of some provinces. They also suggest that the public finance system could do more to reduce them. The tax rebate grants and the general tax sharing components are decidedly coun-terequalizing. The latter are based on where taxes are collected rather than on where expenditure needs are greatest. Currently, the tax sharing and tax rebates together account for about 60 percent of all transfers to local governments. The higher-income provinces, where most taxes are collected, are favored under the shared tax system. The simple cor-relation between per capita revenue sharing transfers and per capita GDP is 0.89, indicat-ing a systematic favoring of higher-income provinces. Equalization grants have played some role in reducing fiscal disparities. The simple correlation between per capita equal-ization grants and per capita GDP is –0.41, suggesting that, on average, lower-income provinces receive larger equalization grants. The equalization grants represent only 19 percent of all intergovernmental transfers, however, and therefore have not been effec-tive in significantly reducing fiscal disparities across provinces.
Complexity. The earmarked grants are extremely complicated, and this complication comes with cost. There are about 200 condi-tional grant programs, each of which should be monitored by higher-level governments to insure proper compliance. Conditional grants in essence are (partially) funded man-dates, and unless they are properly designed to stimulate spending to capture a spillover benefit, they will compromise local govern-ment budget autonomy and may not enhance efficiency. These conditional grants also impose an administration cost on the central government and a compliance cost on the subnational government. Finally, conditional grants usually lead to strong bureaucratic and ministry interest in maintaining these programs, as well as a local government con-stituency, creating a formidable resistance to

f i n a n C i n g U r b a n i z a t i o n 389
abolishing these programs when they are no longer necessary (Blom-Hansen 2010).
Subprovincial transfers. Provincial govern-ments have considerable discretion to place revenues where they are seen as most needed. A provincial government might decide to adopt equalizing distributions across local governments or choose an investment stimu-lation strategy. China is too large a country to govern effectively without this provincial discretion. But this hierarchical arrangement for revenue sharing also presents some prob-lems. The provincial government may pick off too great a share for itself, at least in the eyes of the lower-level governments, or it may not make the subprovincial allocations on a needs basis. In particular, provincial governments may not adequately recognize the needs of city and county governments to deal with financing problems associated with urbanization. Yet the information advantages concerning expenditure delivery and tax col-lection may well be greatest at the lowest lev-els of government. And, more generally, the problems that come with delivering services to accommodate urbanization and financing them will fall heavily on the cities, but equal-ization objectives of a province might tend to redirect funding away from cities.
Another problem with this hierarchical approach is that subprovincial allocations may compromise central government policy objectives. For example, the central gov-ernment might adopt a program of allocat-ing revenues among provinces according to expenditure needs indicators. But the pro-vincial government might decide to distribute them among cities and counties according to where revenues are collected. This possi-bility opens the door for a discussion about whether central grants to provinces ought to contain more mandates about how the cen-tral funds should be passed through to pro-vincial governments.
Financing infrastructure investment
China’s infrastructure financing model is astounding, given how much revenue has been mobilized to finance infrastructure over the past 20 years. China spent around
10 percent of GDP a year on infrastructure investment, far higher than 3–4 percent average of other developing countries, or 2 percent average in developed countries. In addition, China’s investments in schools, hospitals, cultural centers, and public hous-ing have gained momentum with the shift of government development strategy to ward building a harmonious society. Remark-ably, the urbanization of new territories on urban-rural fringes proceeded mainly with physical infrastructure being built ahead of or in sync with demand for land from devel-opers, through an urban “big push.” China’s cities not only successfully accommodated 500 million new residents between 1980 and 2010 but also achieved significant improve-ments in basic infrastructure and living stan-dards. For instance, access to piped water in China urban areas doubled in three decades, the wastewater treatment rate increased from almost none in 1981 to 84 percent by 2011, and the road surface area per capita increased seven times during the same period.
Local governments in China take almost exclusive responsibility for urban infrastruc-ture investments and financing. As table 6.3 shows, China invested RMB 5.9 trillion in fixed assets for public utilities, infrastructure, and facilities in 2011, equivalent to 12.5 per-cent of GDP. More than 80 percent of this investment was sponsored by local govern-ments and their entities. The central govern-ment played a dominant role in financing railway investment (85 percent) and a rela-tively large role in gas supply (37 percent), but it played a negligible role in urban infrastruc-ture. The investments in city connections (railways and expressways) are generally the responsibilities of the central and provincial governments.11
Regarding the sources of infrastructure financing, the Chinese model shows several salient features:
· User charges in China, including tolls, water tariffs, and garbage collection fees, are widely applied to finance infrastruc-ture services. But they often achieve low rates of cost recovery, despite the central government’s policies and guidance that encourage utilities to be self-financing. For

390 U r b a n C h i n a
example, a recent study of approximately 600 urban water utilities showed that only 44 percent generated positive net margins, even though real tariffs had grown 3.7 per-cent annually over the previous five years (World Bank n.d.). Continued government subsidies provided the necessary financing in most cases.
· Only a fraction of infrastructure invest-ment is financed directly from government budget. Government expenditures on fixed assets were equivalent to roughly 5 percent of GDP in 2009; about 1.5 percent of GDP was spent on investments in utilities and infrastructure, accounting for 11.6 percent of total investments in these sectors (see table 6.3).
· Land lease revenues have emerged as an indispensable source of capital financing for China’s city infrastructure investment. During 1996–2012, a total of 50,000 square kilometers were converted from rural to urban use (and from collective to state ownership). An estimated 40 percent of these lands were for industrial use, and local governments often charge low rent for industrial land. The majority of the land for commercial and residential use is auctioned in a competitive bidding, and revenues
from the auction are used for infrastructure investment. In 2012 alone, China acquired RMB 2.85 trillion from land auctions, equivalent to 46.7 percent of total public finance revenues of local governments.12 The net revenue, after deducting compensa-tion to farmers and land development costs, is much smaller, however, only around 20 percent of gross revenues.
· China imposes strict restrictions on the borrowing powers of local governments.13 To circumvent this regulation, local gov-ernments have set up around 10,000 LGFVs to borrow and finance infrastruc-ture investments.14 Local government bor-rowing proliferated to finance stimulus packages amid the 2008–09 global finan-cial crisis. By end-June 2013, the explicit debts of local governments amounted to RMB 10.9 trillion; local government guar-anteed debts, RMB 2.67 trillion; and other contingent debts, RMB 4.3 trillion, with the total around 33 percent of GDP.
· Private participation in infrastructure ser-vices is still limited compared with other developing countries, despite encour-agement from the central government. Since 1990, while China had over 1,000 public-private partnership (PPP) transac-
Table 6.3 China’s investment in public utilities, infrastructure and facilities, 2011
Percentage of total investment
Total volume(RMB, billions)
By investment By source of funding
Central Local Budget Bank loans Others
Public utilities 1465.9 30.5 69.5 6.3 31.3 62.4
Power 1160.3 37.2 62.8 5.5 35.9 58.6
Gas 124.4 11.3 88.7 2.0 15.5 82.5
Water 181.1 1.2 98.8 14.9 11.8 73.3
Transportation 2490.2 24.7 75.3 13.6 34.8 51.6
Railway 591.5 85.3 14.7 11.5 44.9 43.7
Roads 1385.6 3.5 96.5 17.0 30.0 53.0
City transport 222.5 1.9 98.1 8.4 52.5 39.1
Public facilities 1950.6 1.0 99.0 13.3 15.2 71.5
Subtotal: utilities and infrastructure 5906.7 18.3 81.7 11.6 27.5 60.9
Irrigation and environment 501.5 11.6 88.4 25.2 10.6 64.1
Education, health, cultural, and sports facilities 790.0 3.9 96.1 19.1 7.8 73.1
Public administration 564.8 5.6 94.4 23.5 4.5 72.1
Total 7763.0 15.5 84.5 14.1 22.7 63.2
Data Source: China Statistic Yearbook, 2012.

f i n a n C i n g U r b a n i z a t i o n 391
tions in infrastructure (transport, water, energy) for a total value of $166 billion (Private Participation in Infrastructure, or PPI Database), Brazil and India had much larger private investment in infrastructure during the same period, $325 billion and $273 billion respectively.
Notwithstanding the success, a number of important problems have arisen, ranging from concerns about poor investment choices made by some local governments to overin-vestment in infrastructure compared with other urban services, urban sprawl, social and equity issues surrounding the practices in transferring farmland to urban use, and the level of land-based debt that is implicitly guaranteed by local governments.15
The first concern relates to the role of financing in shaping local governments’ incentives and capacity for selecting, design-ing, and providing infrastructure projects. Enormous infrastructure investment in China is generally justified by the rapid rate of urbanization and high growth of income; however, some of these infrastructure invest-ments are driven by distorted incentives of government officials. Because their tenure is short—often less than five years, local gov-ernment and party officials depends largely on achieving short-term economic develop-ment targets and visible results to advance their career. Short of alternative revenues, local governments resorted to land-conces-sion revenue and unregulated borrowing from LGFVs. While the use of land-based revenues for capital finance should reduce overall capital financing risk, overreliance on land finance, together with distorted incen-tives, contributes to inefficient use of land, corruption, and abuse of government power in land acquisition. Municipal governments may even act like profit-maximizing land monopolists, by acquiring as much land as possible as cheaply as possible at the urban fringe, converting it into municipally owned urban land, and selling the land use rights to developers at the highest price the mar-ket will bear, potentially contributing to a land asset bubble. Economic distortions are compounded by deliberate government poli-cies that assign zero or low values to land as
an incentive to attract industrial investments and that then heavily invest in infrastructure to service these newly developed lands. This urban development strategy led to a pat-tern of urban sprawl that is costly and has channeled interest away from more compact, infilling strategies for urban growth. The strategy also can increase carbon emissions because it generates longer commutes and less use of mass transit, increases living space per person and therefore more emissions from home heating and general power consump-tion, and leads to less intensively used infra-structure, which in turn raises emission levels (Baeumler, Ijjasz-Vasquez, and Mehndiratta 2012; Z. Liu and Salzberg 2012).
Local governments’ capacity in selecting and designing good and appropriate infra-structure is also handicapped by a frag-mented budget and lack of a medium-term perspective in financial management. City governments tend to spend more on new infrastructure and less on maintenance and operation; more on above-ground infrastruc-ture such as roads, transportation, and public gardens and less on underground infrastruc-ture like sewage systems and flood protec-tion. Chronic underinvestment in mainte-nance and repair shortens the lifetime of assets, which, in turn, increases long-term costs, which can threaten the long-term sus-tainability of cities. Capital finance is con-ducted ad hoc, on a project-by-project basis, and through multiple intertwined channels including many government bureaus, LGFVs and their subsidiaries, and many other public utilities firms. Not all investments in property and infrastructure are accounted for and reported on the government books (box 6.1). Economic classification is not introduced in budget management, and the budget is managed on an annual basis. The lack of a multiyear and integrated budget prevents local governments from more effective pub-lic investment planning. If investment plans were supplemented with a full-cost budgeting plan over the life span of the project (cost of construction plus future costs of operation and maintenance and asset renewal), some of the investments would not be justified from a cost-effectiveness basis (Mikesell and Mullins 2011; Kaganova and Windolph 2012).

392 U r b a n C h i n a
The second concern with China’s financ-ing model is equity. The policy on how to pay for the infrastructure investments—from general budget revenue, user charges and connection fees, or debt finance—has direct implications about who will ultimately bear the cost of infrastructure. Subsidies to utili-ties of a private goods nature, such as water and electricity, not only come at the cost of lower economic efficiency but also tend to be regressive, as wealthier households, who consume disproportionately more, receive the largest share of the benefit.
When infrastructure services are financed from land-concession revenues, those who use the services benefit at the expense of the previous owners of the land use rights, who were forced to sell at a rate well below mar-ket price, or of citizens in general who are the ultimate owners of the land, depending on how one looks at it. In addition, neither the collective nor the farmers may sell land to end users, and the user rights of farmland own-ers are only weakly guarded. Only the local government can convert farmland to urban use. Local governments use their monopoly powers to claim farmland at a value reflect-ing agricultural use, which is well below the
market value of urban land. In many cases, the land is expropriated, further raising the level of unrest among those with user rights over farmland (see supporting report 4, China’s Urbanization and Land: A Frame-work for Reform).
If infrastructure investment were financed only from savings on the general budget, cities would not be able to meet the rising demand from urbanization. In addition, financing only from savings would raise intergenerational equity problems, because the infrastructure investment benefits future generations while the costs would be borne by the current generation of taxpayers. With urban migrants likely to make up a large por-tion of future generations, financing totally from savings further raises the social unrest between existing residents and migrants.16
The third concern is the potentially seri-ous risk to fiscal sustainability. The absence of a strong regulatory regime governing bor-rowers, land finance, debt finance, and PPP entails fiscal risks.
Land-based revenues for capital finance complement borrowing by reducing the uncertainty surrounding future debt repay-ment capacity and the need to generate future
Government budgets have four separate compo-nents. The largest is the “public finance budget”—the general fund that is reported in most statistical compilations. The recurrent expenditures of gov-ernment (other than social security) are recorded in this account, as are the ordinary revenues raised by the local government. Most expenditure on urban infrastructure facilities is made through the “Gov-ernment Fund budget.” The main financing source for this budget is land revenues. The “state-owned enterprise operating fund budget” is for transfers of dividends from enterprises owned by governments to the general budget. Finally, the social security budget includes the pension, health, and worker protection programs and the payroll contributions and subsidies that finance these programs.
These four budgets are managed by many dif-ferent departments, an arrangement that presents a
box 6.1 reporting and budgeting of infrastructure finance
challenge to efficient public financial management. In particular, current and capital expenditures appear in all of the accounts, but government departments do not record or report their activities by economic clas-sification not separating current and capital expendi-tures), making it difficult to track the overall budget health of the local government.
Moreover, the local government budget is inter-twined with the budgets of local government financ-ing vehicles and public utilities enterprises, and a substantial portion of capital investment made with public funding might not be reflected in the municipal budget as such. Thus, capital construction by state-owned enterprises themselves is not shown in the municipal budget, even though it is funded, at least partly, by subsidies and transfers from the municipal budget. Furthermore, the private sector’s contribution through various channels is impossible to estimate.

f i n a n C i n g U r b a n i z a t i o n 393
revenue streams to meet future debt service. Thus the use of land-based revenues for capital finance should reduce overall capi-tal financing risk. Because, however, urban land values are highly volatile, land financing creates volatility in capital budgets and debt repayment funds. Land prices can swing as much as 50 percent in either direction, and in times of crisis even more, as demonstrated during the Asian financial crisis of the 1990s and again during the market collapse starting in 2008. Systemic risks are increased when the entire subnational sector relies heavily on land values to provide security for borrowing (L. Liu and Peterson 2013).
China’s overall public debt, including sov-ereign and local government debt, is low by international standards. The sovereign debt remained at around 18 percent of GDP at the end of June 2013 (or 22.7 percent if all con-tingent debts are included). By including an estimate of the local government debt based on a report by the National Audit Office, the overall direct and contingent public debt was about 55.6 percent of GDP, far below the most conservative warning line—60 per-cent of GDP (table 6.4). In addition, several factors will work to improve China’s debt dynamics in the future. China’s large growth potential creates the foundation for further growth of real revenues and favorable debt dynamics. China’s government commands a large portion of assets including shares in state-owned enterprises (SOEs) and land, which represent a source of potential rev-enues going forward. Large national savings coupled with investment-grade sovereign risk ratings imply a relatively low cost of borrow-ing (L. Liu and Pradelli 2013).
Concerns, however, remain with local government borrowing. The audit in 2013
found that local government direct debts continued to grow fast, at a yearly rate around 20 percent from 2010 to 2013, and the refinancing ratio exceeded 20 percent in 2 provinces, 31 municipals, 29 counties, and 148 townships. The overdue debt ratio was 1.01 percent on average, but it exceeded 10 percent in some cities and reached 16.36 percent in the worst local government. Inter-national experience suggests that subnational debt risk is triggered by the sheer size of the debts but also is more broadly associated with local governments’ capacity in manag-ing their debt portfolio and formulating fiscal policies in a sustainable manner.
In China, under the current system, the separation of subnational government debt from its budget undermines the accountabil-ity of local governments for debt sustainabil-ity, especially when debt is used to finance expenditures mandated by the central gov-ernment such as the post-2008 stimulus package and affordable housing. The frag-mented budgeting and indirect borrowing also prevent local governments from estab-lishing proper debt management and control. To improve their access to credit and lower financing costs, some local governments have taken measures to reinforce the perception of an implicit guarantee on LGFV debt and have tapped into less regulated credit markets, known as “shadow banking.” Some local governments resorted to PPPs as a source of capital financing and built up substantial risks emanating from these commitments.
Meanwhile, creditors, including bank and others, fail to impose hard budget constraints on local governments. There appears to be little market scrutiny of underlying financial conditions of LGFVs or local governments and little information upon which to base
Table 6.4 China public debt, June 2013RMB, billions
Direct debt
Contingent debt
Subtotal Share of GDPGuaranteed debt Other contingent debt
Central 9,813 260 2,311 12,384 22.7%
Local 10,886 2,666 4,339 17,891 32.8%
Total 20,699 2,926 6,650 30,275 55.6%
Data Source: National Audit Office, 2013.

394 U r b a n C h i n a
such judgment. Most urban infrastructure lending by banks and others is based on the reputation of the LGFV and an implied guar-antee that the local government will not let the borrower fail. As a result, there is a lack of transparency and objectivity in the financ-ing process. In the absence of credit ratings for borrowers, it is difficult to see how regu-lators can reasonably assess the portfolio risk profile of the banks and institutional inves-tors. In such a situation, lenders and investors have no expectation of negative consequences for lending to poor credit risk borrowers and poor credit decisions predominate in an atmosphere of moral hazard.
Overreliance on bank loans as an instru-ment for local government borrowing has
intensified the debt-refinancing risk. By the end of June 2013, banks had financed about 56.6 percent of local governments’ debt, and bond issuance in the capital markets had financed only 10.3 percent (box 6.2). Because the repayment period for bank loans tends to be shorter (two to five years) than that for bonds, the debt cannot be fully amortized in such short time spans and must be rolled over (refinanced) when it matures. Debt manage-ment that relies on continuous refinancing when principal payments come due is danger-ous, especially in a market setting. The will-ingness of banks or other lenders to roll over existing debt at maturity depends on multiple factors, many of which are beyond a local government’s ability to control. An inability
Local governments in China have been very innova-tive in exploring a variety of debt instruments:
• Medium-term loans from the China Development
Bank (CDB), which derives some of its funding from the capital market using Policy Financial (“F”) Bonds that have a 5- to 10-year maturity. The CDB has provided a significant volume of financ-ing for urban infrastructure. According to an arti-cle in May 2013 by the president of the CDB, the bank has already made RMB 6 trillion in loans to finance China’s urbanization process.a More than half of those loans—RMB 3.4 trillion—were out-standing at the end of 2012 and represented 71 per-cent of the bank’s total outstanding loans.
• Commercial medium-term bank loans to local gov-ernment financing vehicles (LGFVs) (mostly 3- to 5-year loans) that carry an implicit guarantee from the local government.
• Bonds issued by the Ministry of Finance on behalf of provinces (mostly 3- to 5-year bonds).
• Bonds issued by LGFVs (implicitly guaranteed by the local government). In some cases LGFVs bor-row solely for the purpose of de facto relending to the local government. Expansion and diversifica-tion of the domestic bond market is already taking place in a tentative manner.
box 6.2 local governments’ debt instruments
• Bonds issued directly by city governments in a very limited number of cases (mostly 3- to 5-year bonds). Since 2011, four local governments (Guangdong, Shanghai, Shenzhen, and Zhejiang) have been allowed to issue their own bonds and two more provinces (Jiangsu and Shandong) were expected to enter the bond market in 2013. So far, the market entry and volume of bond issuance has been care-fully controlled by the Ministry of Finance, and that has increased in 2013 to RMB 70 billion, up from RMB 28.9 billion in 2012.
• Public-private partnerships ranging from concessions to joint ventures and build-own-operate schemes.
• Funds raised through shadow banking vehicles such as wealth management products, trust funds, and other collective investment schemes.
Despite this array of financing sources, the Chi-nese financial markets continue to be both bank- dominated (accounting for 56.6 percent of local gov-ernment debts in June 2013) and restricted in scope, with few long-term financing instruments and a limited number of large institutional investors. The magnitude of capital market financing for urban infrastructure remains small relative to bank financing even as bonds issued by urban development investment corporations have become a growing portion of the bond market.
Source: Painter 2013.a. As reported in “China Development Bank Says $8.1 Trillion Needed for Urban Shift,” Bloomberg News, May 20, 2013.

f i n a n C i n g U r b a n i z a t i o n 395
to roll over debt, in turn, can precipitate a local government budget crisis, or in some cases even a financial crisis such as Brazil experienced in the 1980s. Such liquidity risk is also related to the scarcity of long-term financing instruments and the underdevelop-ment of the Chinese capital market.
China’s authorities recognize the poten-tial risks arising from local government debt if liabilities are left hidden and uncontained. In June 2010, the State Council issued a cir-cular (Guo Fa 19) on enhancing the control over LGFVs. A joint task force was estab-lished to verify and catalogue the LGFVs and their debts. The Ministry of Finance, the National Development and Reform Commission, the People’s Bank of China, and the China Bank Regulation Commis-sion have all issued a series of regulations and guidelines to regulate local govern-ment and LGFV borrowing behavior. Many local governments have also launched pilot reforms to improve their debt manage-ment framework. Much more remains to be done, however, to improve the financial intermediation process for long-term debt financing and put local government financ-ing on a sustainable foundation.
The fourth concern relates to the impact of the existing financing model on market and private sector developments. The cen-tral government has signaled that it wants to promote greater market orientation in infrastructure finance, using market-rate debt financing where appropriate as well as encouraging private investment in infrastruc-ture facilities. Both domestic private and foreign investment would be permitted for nearly all forms of infrastructure, particu-larly in water supply and wastewater treat-ment, through sole investment, cooperative enterprises, joint ventures, share purchase, or franchise. In particular, nonpublic capital is encouraged in building, operating, and man-aging public utilities.17
Local governments, however, with easy access to borrowing through LGFVs, are less keen to use PPPs. To improve their access to borrowing, some local governments even combine public investment projects that gen-erate insufficient cash inflows with profit-making activities. Such practices blur the
division between the government and the market and create distortions that may do more harm to overall economic efficiency than is gained from the public infrastructure financed. These practices encourage LGFVs and public utility enterprises to manipulate their relationships with government to secure their monopoly power in an otherwise com-petitive market. They also create distorted incentives for local governments to protect their entities from competition from private firms.
Local governments generally lack the needed capacity to manage PPP contracts. These contracts require identifying the true cost of infrastructure and utilities, but, as discussed, the current reporting of and budgeting for infrastructure finance are deficient and unable to reveal the true cost of infrastructure projects. The cost of traditional publicly financed projects is often underrecorded, which may create an illusion about the efficiency of public utility firms. Managing the bidding process is another challenge. Open bidding could mitigate the information disadvantage of a local government, but it sometimes fails to reveal the true cost of infrastructure projects owing to the moral hazard of private partners; for example, a private partner may offer a low price on expectation that it will be able to renegotiate the tariff or subsidies after win-ning a PPP contract.
The absence of a clear legal and regula-tory framework for PPP management also discourages private investors. There are 54 policy acts related to PPP in China’s legal system, each dealing with different aspects of a single project such as finance, foreign investment, tendering, and bidding processes. This multiplicity of laws causes a multitude of regulations and a complex legal environ-ment for PPP projects even within a single sector.18 The disconnection between central and local policies further aggravates this fragmented approach,19 leading not only to different ways of implementing PPPs in dif-ferent places but also to an array of different ministries and bureaus that may be involved in PPP implementation and ultimately dis-couraging participation by private companies (Wu 2013).

396 U r b a n C h i n a
Financing affordable housing
China’s policies have been successful in increasing the per capita housing space even as China’s urban population increased to more than 50 percent of the total. Between 1985 and 2007, urban residential space per capita had risen to 28.3 square meters from 7 square meters. The larger size is greater than the averages in Europe and Japan (Man, Zheng, and Ren 2011).
Housing prices have escalated dramati-cally, however, making it difficult for low- and middle-income households, those mov-ing from rural areas to urban areas, and young workers to buy a home. Housing prices in China’s cities became very high in relationship to incomes. Internationally, a price-income ratio of 5:1 or more is consid-ered unaffordable. While the average price-income average in 600 Chinese cities was 5:1, in major cities it was much higher. In Shang-hai, for instance, the ratio was 28.4:1 and in Beijing, over 30.1:1.20 The lack of affordable housing for low- and middle-income urban households in China, particularly in big cit-ies, poses risks and challenges to a stable and harmonious society and impedes labor mobil-ity. Therefore, the development of affordable housing programs became a central focus on the government reform agenda.
China is in the midst of an ambitious pro-gram of affordable housing construction. Under the 12th Five-Year Plan (2011–15), the central government mandated that 36 million units of affordable housing be built, with the objective of reaching 20 percent of the total urban population. It then developed a formula through which each municipality was required to build a certain number of units to standards set by the central government, which provided very little funding for this effort.
China’s construction effort contains both rental and owned housing in five broad cat-egories to accommodate the diverse urban population (box 6.3). Affordable rental hous-ing is particularly needed in major cities where owning a house is out of the reach of most families. The definition of what types of housing qualify as affordable is very broad and without clear policy objectives except for growth. The target markets range from
very low income workers to young profes-sionals with technology skills to middle-income families. The housing is variously called “low-income” housing, “affordable” or “subsidized” housing, or “social” hous-ing, conflating the difference between social housing and more broadly based govern-ment-assisted housing. The categorization of qualifying units is so broad that providing a unit that is 10 percent below market value to a high-skilled technical employee and a low-rent unit to a migrant worker both count as affordable housing.
Housing with price caps is making a resur-gence in high-cost cities, such as Beijing, but the practice raises the question of subsidy capture. The concept seems simple: auction land to developers with a pre-defined price cap on the sales price of the housing units. Unfortunately, international experience has shown that developers can build out the units to a lower-quality standard and, therefore, can capture most of the subsidies, defeat-ing the purpose of the subsidy. A lack of a strong appraisal industry indicates that the land price could be artificially inflated over the true market price before the discount is applied.
The formula for housing construction allocation is driven by the central govern-ment, not market conditions. The central government provides the range and level of coverage, the means of allocation and admin-istration, and access and exit mechanisms, and it also contains stipulations concerning the planning, design, size, quality and safety requirements of low-income housing projects. Market studies are not required, and munici-palities are judged on their progress in meet-ing the quantitative goals, not on the success of the projects. (Gao and Wang 2012).
New housing construction may have a negative impact on labor mobility. Since the municipalities are responsible for the cost of construction, much of the new housing built is on the periphery of the cities where land prices are much lower, but where residents are farther from transportation and jobs. In Mexico City, commuting costs from newly constructed housing on the outskirts of the city have caused an estimated 20 percent of the housing to be abandoned.

f i n a n C i n g U r b a n i z a t i o n 397
Housing policies may also have a negative impact on social cohesion. Those who can afford the housing prices will have housing options in the center cities. Those who do not will find their housing further away. In the United States, the model of tall towers in low-cost and often isolated locations led to such physical and safety problems that many had to be demolished.
The affordable housing construction sys-tem is a type of unfunded mandate. While the central government sets the goal for afford-able housing construction, the responsibility for financing these projects rests primarily on the municipalities and on the local housing provident funds. According to a JP Morgan study, of the RMB 1.4 trillion needed to meet the policy goals for 2011, the central govern-
Economically affordable housing. Economically affordable housing refers to a special category of housing sold to lower-income families at subsidized prices. Qualified purchasers must meet several requirements, including income level, hukou registra-tion, and certain housing conditions. Units are limited to 60 square meters and are sold to qualified families at below-market price, often 25 percent to 40 percent below the price of comparable ordinary commodity housing. The government generally provides land for affordable housing construction, allowing such units to be sold at a discounted price relative to the market price. Owing to heavy subsidies by the government, homeowners are permitted to sell the unit only under certain conditions: they usually cannot sell for the first five years they own the home, and they may be required to sell the house back to the local housing authority with joint share of the increase in value.
Price-capped commodity housing. Housing prices are so high that even middle-income families could hardly afford to buy their own dwelling. Thus, some cities initiated a housing assistance program targeted at urban middle-income families. In this program, the housing price is higher than that in economic commodity housing but lower than that in ordinary commodity housing. Units are limited to 90 square meters. Similar to economic commodity housing, homeowners have to meet certain conditions before they are allowed to sell their units.
Low-income rental housing. Such housing is owned by the government and leased to very poor urban hukou residents at below-market rates. This low-rent public housing program is part of the official social security program and is primarily financed using the budget of the local government. In recent years, direct financial transfer from the central government
box 6.3 basic concept and categories of affordable housing in China
has increased. After several years of implementa-tion, the program now covers most of these poor urban residents (with hukou registration), especially families with elderly or disabled members. Some low-income families can rent housing in the market with government subsidies, as part of the low-rental hous-ing program.
Public rental housing. This new form of affordable housing started in 2009 to cater to the demands of households with income levels falling between the required thresholds for economic housing and low-rent housing. Public rental housing mostly serves low- and moderate-income families and has lower-than-market rent for the houses of the same quality. This scheme is the first attempt to use rental housing to solve the housing problem of families. It focuses on relieving the stress of finding housing from local young staff and migrant workers who have relatively low incomes. Unlike low-rent housing, public-rent housing in some cities can be sold to the tenants after they satisfy certain requirements, such as a resi-dency period, income cap, and compensation to the government.
Shanty-town resettlement. The resettlement of shanty town residents constitutes a major component of China’s affordable housing construction plan. This form of affordable housing is aimed at improv-ing the well-being of low- and middle-income house-holds living in areas considered shanty towns. Reset-tlement occurs when the government needs land for a development and plans to tear down the existing housing. Relocated families may be offered afford-able housing, price-capped commodity housing, or a cash settlement. In cases where the existing property is of significant value, the current residents are some-times given more than one housing unit.
Source: World Bank 2013b.

398 U r b a n C h i n a
ment provided only RMP 170.5 billion in 2011, including RMB 28 billion carried for-ward from 2010.
The municipalities’ provision of land at discounted prices or of net income from land transfers for the construction of affordable housing projects is both an opportunity and a challenge. On the one hand, current reve-nues increased. Between 1999 and 2007, the amount of land sold for development grew by 23 percent a year and fees for leasing by municipalities rose by nearly one-third annu-ally (Ministry of Land and Resources 2008). On the other hand, land is a limited resource, so land sales cannot continue indefinitely, creating vulnerabilities for the cities, par-ticularly if the projects ultimately fail or cost more than anticipated.
The use of housing provident funds for project finance has grown rapidly. HPFs—mandatory long-term savings funds estab-lished to help fund members finance hous-ing—are permitted to use up to 50 percent of their “surplus funds” for social housing construction. The interest rates on the con-struction loans are set 10 percent higher than five-year mortgages used for individual home purchases, which is far below the develop-ment lending interest rate of commercial banks. The use of these funds has grown from a pilot project in 2009 with 29 HPFs providing project financing, to 93 HPFs that had pledged RMB 41.2 billion for affordable housing development and had used RMB 31.2 billion by the end of 2012. The calcula-tion of the provident fund “surplus” is based on the HPF’s current financial status, and is not subject to any type of stress test, creat-ing potential vulnerabilities in the funds and in the real estate markets. The “surplus” is determined by the current surplus, deduct-ing for loan risk reserves and administrative expenses. A project that fails will decrease the liquidity of the fund, which, in turn, will decrease the amount of funds available for mortgage loans. The amortization period for many HPF project loans is greater than 10 years, adding additional liquidity pressure.
Financing the construction of rental hous-ing is more akin to project finance than it is to mortgage lending. A lender must evaluate the business applying for the loan, including
its management, its track record, the financial position of the owners or of the corporation, the market, the potential risks, and the com-petition. Evaluating the market is particularly critical because the lending institution must look at vacancy rates in the target market, local laws and regulations, and the overall economy in the areas served. It must assess potential developments that could affect the market, such as a factory closing, which would have a negative effect on the evalua-tion, or a new commercial and retail devel-opment, which would have a positive effect. Housing provident funds and governmental entities rarely have the training to perform these evaluations and are therefore dependent on the developer’s information.
The current approach to financing afford-able housing in China carries great risks, particularly to the cities and to the hous-ing provident funds. In countries with high housing costs, it is nearly impossible for low-rent housing to be sustained without deep demand-side subsidies. Even if land and infrastructure are provided, the cash flows from the rents are highly unlikely to cover all of the costs, particularly in low-cost rent-als. Cost savings on the front end can lead to faster deterioration, creating a downward spiral of lower occupancy and higher mainte-nance costs.
Municipalities are given little incentive to build low-rent housing that can be sustain-able over time. They are responsible for all of the costs of building, managing, and main-taining housing. They can charge higher rents for slightly-below-market public rental hous-ing than they can for low-rent housing, cre-ating a much greater possibility for positive cash flow. Conversely, they will have to find additional sources of revenue to cover any losses on low-rent housing projects. There-fore, it is in their economic interests to build fewer low-rent units than public rental units.
Expenses for the operation of publicly sup-ported rental housing are underestimated, as they are in many countries. While analy-ses have been performed on the cost of con-structing subsidized rental housing, managers of rental housing interviewed for an earlier study believed that the rents would be suffi-cient to cover all expenses. While that might

f i n a n C i n g U r b a n i z a t i o n 399
possibly be true for units whose rent is close to market price, it is almost never true for lower-income rental housing. In either case, the only way to determine the sufficiency of rent projections is to have detailed finan-cial statements prepared based on projected income, less an estimate for vacancies, less expenses including all maintenance, opera-tional, and management costs and reserves for replacements of capital items. In Dalian, the rent revenue is expected to cover only loan payments, but not property manage-ment and maintenance costs. The gap will have to be filled by HPF annual supplements for low-rent housing.
While China does indeed have standards for new construction, there is no system for monitoring the physical conditions over time or for correcting any deficiencies that exist. Moreover, the pressure to keep costs down during construction can lead to faster dete-rioration than with market rate housing. Les-sons learned in the United States are appli-cable here. Tall towers in isolated locations with too little capital or staff to manage and maintain them deteriorated into slum hous-ing with unsafe and unhealthy conditions. Eventually, properties in Baltimore, Chicago, Newark, Philadelphia, San Francisco, and other cities were demolished.
reform considerations for ChinaTo support the new urbanization model, urban finance needs to be reformed. The cen-terpiece of the reform will be moving toward a system that more clearly separates the tra-ditional function of government—the provi-sion of equitable and efficient levels of public services and regulation—from the investment and production functions of other sectors. The local government leadership evaluation system would need to be altered to reflect this change in the government role. And China needs to move from benign neglect of local borrowing to a rule-based system that is strictly enforced.
A modernization of the approach to financing will require changes in both financ-ing and regulation. The public finance system will need to support the movement of people
and enterprises to the places where they are most productive, not to where they get the best tax or land deal from local government. It will also need to accommodate the integra-tion of migrants and their families into urban areas. Revenues from land conversion are likely to taper off, requiring replacement with new sources of local revenue, whereas prop-erly regulated access to borrowing will be needed to finance infrastructure investment. The financial sector will need to intermediate capital efficiently to meet local governments’ needs for infrastructure finance, and at the same time impose financial discipline on local governments and avoid financial sector dis-ruption. The private sector can play a larger role in financing and delivering infrastructure investment and other public services.
Aligning the urban finance system with the changing development objectives involves reforms across a variety of interrelated sys-tems, including the public finance regime, land finance, financial intermediaries, and private sector development. For example, changing expenditure assignments is impor-tant but will call for changes in the distribu-tion of intergovernmental transfers because local governments might end up with more or less budget responsibility. In turn, losses from the redistribution of transfers might need to be compensated by increased local taxing powers or the ability to increase user charges. Reform of the land conversion pro-gram raises the question of whether local governments should be allowed to borrow directly. Should local government be allowed to borrow, the demand for credit needs must be met by supply, which leads to question whether intermediaries can play such a role. These examples suggest that the right long-run goal is not to address a single issue but to implement a comprehensive reform agenda. Some elements of the reform—such as the reassignment of some expenditure responsi-bilities—might be accomplished in the short run. Others might be phased in beginning in the provincial cities and moving later to other cities, and yet others may be implemented only over the longer run. In this way, the comprehensive reform package proposed in this report could be introduced gradually and over time.

400 U r b a n C h i n a
To manage the process of comprehensive reform, China needs a stronger, more trans-parent and streamlined public finance man-agement and governance system. To get the best value out of public money, this improved system would need to bring a medium-term perspective to financing, link budgets with development plans, and allow government to strategically allocate resources and improve the efficiency and effectiveness of public expenditures. This transparent system could allow the government to communicate the reform agenda to citizens and gain their sup-port; the government’s credibility and trust with citizens could also be improved through linking the budget with performance. The government structure could be streamlined by removing the prefecture level as a tier of regional government.
This section elaborates on the key com-ponents of the comprehensive reform pack-age. These components are organized by the sources of funding, namely public finance, land finance, housing provident funds, pub-lic-private partnerships, and debt finance. Financial management and governance issues are also discussed. All these components are integrated, so it is important to understand how they fit together, as well as the joint impact they might have on the economy.
rationalizing public finance
The reform agenda of public finance system should be centered on three major tasks: reassigning the expenditure responsibilities to better manage the externalities in a more urbanized economy; rationalizing revenues to correct the distortion of fiscal incentives and finance expenditure needs related to urban-ization; and building a rule-based tax-shar-ing and transfer system to address the dispar-ity concern.
Reassign the expenditure responsibilities
A first priority for the fiscal system is to achieve greater clarity in the division of func-tional responsibility among the various levels of government. In China, most of the ambi-guity in expenditure assignments under the existing system derives from a “concurrent”
responsibility list, that is, functions that are the responsibility of more than one level of government. While concurrency is to some extent inevitable, because some functions do require shared responsibility, the goal of this reform will be to minimize it in service deliv-ery. Reducing overlap in government func-tions could reduce costs as well as unpro-ductive coordination efforts. More broadly, clarity on expenditure assignment is required for a better design of the intergovernmental fiscal system, to ensure that resources are available at the level of government that has the responsibility for delivering a specific ser-vice. There is wisdom in the old adage that “finance follows function.” Until expenditure responsibilities are sorted out, it is not pos-sible to put a rational financing plan in place (Bahl and Martinez-Vazquez 2006).
In getting the expenditure assignment right, China may need to weigh the gains from local control against the gains from technical efficiency, and from internaliz-ing external costs and benefits. A task force supported by considerable staff should be charged to analyze all functions of govern-ment. Each subfunction of government func-tion might be subjected to the same test: do the gains from decentralization—better ser-vicing of local needs and circumstances—outweigh the advantages from centraliza-tion—the ability to capture economies of scale and internalize interjurisdictional externalities? Even with this principle to fol-low, the work of dividing the competencies between the levels of government will be as much art and politics as science. Factors such as preferences of individuals for services, externalities resulting from local decisions or imposed on local areas, and even econo-mies of scale are not easily measured, if they are measureable at all. The effects on equity must be defined and weighted, administrative questions must be considered, and culture will play a role. And always, there is poli-tics. Based on the analysis, the policy maker should rethink needed changes in the division of expenditure responsibilities between levels of government to come up with the exclusive lists. Finally, the responsibilities for each sub-function of government should be laid out in a new law, perhaps a revised budget law. That

f i n a n C i n g U r b a n i z a t i o n 401
law will specify those functions that will be the exclusive responsibility of the central gov-ernment and those that will be the exclusive responsibility of the local governments.
In China, local governments perform some functions that would be better administered by the central government. Three areas are of particular concern. First, governments should continue to divest themselves of responsibili-ties for private sector activities, such as the management of industrial parks, the develop-ment of land for commercial purposes, and the ownership or partial ownership of enter-prises that produce purely private goods. Whether local governments should maintain their role in industrial policy through tax and subsidy policies aimed at attracting indus-try is a more difficult issue. Many industrial countries allow this practice, even though its problems are well known.
If the central government decides against allowing local governments to subsidize industry locations, it could shift to a policy of making such competitive subsidies the exclu-sive responsibility of the central government. That is, every subsidy to attract economic development would require central govern-ment approval. Under this regime, local gov-ernments would continue to compete with one another without central approval, but the main instrument of their competition would be the quality of services offered. If subsidies are required, as in the case for technology advancements or pioneer industries, these are more appropriately a responsibility function of the central government. The idea of central-izing the power to grant industrial subsidies in China is raised in Lou (2013). Certainly the administration of such an approval process would be difficult and costly and would invite heavy lobbying efforts. In most countries, the problem would be finding a way to prevent local subsidies, but in China where no local government taxation powers are in place, the policing job could be much less difficult. Irrespective of the policy choice made, the central government should clarify the policy and define what is and what is not allowed by local governments in their conduct of indus-trial policy. The European Union rules on support for industry (see box O.11 in the over-view report) could serve as a useful example.
Second, responsibility for the financing and administration of social security func-tions should be rethought. An especially good case can be made for more centralization on the financing side, and for a clearer shar-ing arrangement between the center and the provinces on the management and financing sides. Centralizing the administration of pen-sions would improve the mobility of labor, allow the imposition of national standards, and address important problems related to risk pooling.
Old age pensions are a national function in most industrial countries and, beyond the public pension system, a private func-tion in many countries. China might follow this model. Provincial and local variations in benefits and contribution rates are at odds with uniform standards for all Chinese citi-zens. The current arrangement of city and county responsibility for pensions has forced pooling to the prefecture and provincial level in many provinces, but even that has not eliminated the financial problems. Inter- and intraprovincial disparities in per capita GDP suggest that uniform national levels could not be maintained with local government funding. These pooling issues and the need for portability suggest that both equity and the removal of impediments to labor mobil-ity would be best served if public pensions were administered by the central govern-ment—although, of course, the adminis-tration would need to be deconcentrated—that is, central government would need to maintain local offices for administration of benefits.
Health insurance is a less clear-cut issue because local management of the program has benefits, and a case can be made for some local variation in the delivery of the service. But the case for central financing and the imposition of central rules is also a strong one. The central government would like all Chinese citizens to have access to the same health care services, and certainly to the same reimbursement benefits, irrespective of where they live. City and county govern-ments, and even some provinces, do not have the resources to deliver on this promise. In addition, health insurance benefits need to be portable to remove impediments to labor

402 U r b a n C h i n a
mobility, a goal that is consistent with cen-tralization of the financing and management.
A third problem with expenditure assign-ment is that local governments have been assigned responsibilities that are character-ized by significant interregional spillover effects. These functions and subfunctions are candidates for centralization. Detailed analy-sis by a government commission is likely to uncover many candidates for central assign-ment, but judicial services, food safety, river basin management, and environmental pro-tection are examples of such functions.
Rationalize government revenues
Government revenues need to be reassigned, based on the expenditure needs related to urbanization and on reassignment of expen-diture responsibilities. On the one hand, the reassignment of expenditure responsibil-ity will hold important implications for the financing side of the reform program. If, for example, the social security functions and certain other functions are shifted to the cen-tral government, then it might be necessary to shore up the revenue base of the central government to ensure that these costs could be covered.
Should central government need to mobi-lize more revenues to finance increased expenditure responsibilities, it has two options. One is to transfer more SOE profits to the budget. The SOEs managed by central government are generally natural monopoly corporations, and they generate more than two-thirds of total profits made by all SOEs. If those SOEs managed by central govern-ment were to transfer only half of their prof-its to support the central government’s bud-get, the revenues generated would be roughly equivalent to 1.5 percent of GDP. The other choice is to increase the central government’s retained share of total central tax collec-tions, that is, the value added and corporate income taxes. This policy change would also reduce the incentive for local governments to compete for the value added tax base with industrial subsidies. To manage the poten-tial disruption to local budgets, temporary arrangements such as the Tax Return and Tax Increment Return transfers introduced
in 1994, could be considered but would need to be phased out over time.
At the same time, a solid revenue base for local governments is important for reasons of efficiency and accountability. Such a foun-dation could be established by giving local governments some discretion to levy taxes, on certain bases and within a range of rates, and to claim all revenues raised from the new local taxes. That would bring many benefits to China. Revenue mobilization would be enhanced because local governments have information advantages that give them a comparative advantage in the collection of certain types of taxes, such as property and land taxes. A regional efficiency argument can also be made. Substituting local taxes for some intergovernmental transfers would lead to a higher tax price in the larger urban areas and force labor and capital to take that into account in making location decisions. China is struggling with urban sprawl. A system of property and land taxes could help rational-ize land use patterns and provide incentives for more compact investments. Finally, there is an equalization argument, that is, as local governments in higher-income regions sub-stitute their own taxes for intergovernmental transfers, funds will be freed up for distribu-tion to lower-income regions. More broadly, local taxation might be a way to harden the local budget constraint and to strengthen the creditworthiness of subnational govern-ments. With taxing powers, local govern-ments would have the wherewithal to expand delivery of services that are in high demand or that would allow them to better capture their comparative advantage. It would also improve their creditworthiness by showing a stronger ability to service debt or to maintain public facilities. In general, local taxing pow-ers would give local governments an instru-ment to use in shifting their competitive strat-egies from the back door to the front.
Useful criteria can be applied to identify good instruments for local revenue mobiliza-tion: local taxes should be administered at reasonable cost, yield significant revenue, and not result in exporting the burden of payment to residents of other jurisdictions. A number of local revenue-raising options more or less fit the criteria.

f i n a n C i n g U r b a n i z a t i o n 403
A property tax on housing can provide a stable revenue source that is aligned with ser-vice delivery quality and would allow local government budgets to benefit from increased land values in their jurisdiction. The property tax can fulfill two other important objec-tives in China: it can be both a quasi-user charge for urban services and a tax on wealth holdings in real property. Property taxes are never popular with constituents, but that is part of the rationale for those taxes: if local governments want to spend more, the burden is on them to argue their case to the taxpay-ers. Further, property taxes would encourage property owners to make the best possible use of their property—for instance, by rent-ing out their apartments that are currently empty or developing unused or underused land.
China should aim to make property taxes an important part of local government rev-enues. Even a relatively low effective tax rate of 0.5 percent on this gross measure of the tax base would yield the equivalent of 1 percent of GDP in revenues. Property taxes will not be able to fully replace current land revenues of 1.5 percent of GDP in the near future. Industrial countries raise more than 2 percent of GDP in property taxes while low- and middle-income countries raise about 0.6 percent of GDP on average (Bahl 2009). To realize the full revenue benefits from the tax, it is important to put up a good adminis-tration system with a central decision on the basic structure of the tax. The administration system should consist of identification of all parcels and their ownership, valuation and revaluation, and collection from individual owners; it also requires extensive record-keeping and updating. A gradual introduc-tion could start with empty apartments and unused land kept by developers. If so desired, an adjustment period could allow people that hold multiple properties to sell them to avoid future taxes.
Local government taxes on the ownership and use of motor vehicles could fit China’s strategy for coping with urbanization. The rapid growth in motor vehicles compared with that of the road network has been instrumental in the growing congestion lev-els, higher pollution from transportation,
and longer commutes. Motor vehicle taxa-tion could discourage the use of private cars, at the margin, while generating new revenues to defray some of the costs involved. Chinese cities could continue to use tax and charge policies to increase the price of owning and using a car relative to using a public trans-port system or choosing a different housing location.
The revenue potential from motor vehicle taxation is considerable, and local govern-ments could use the funds to cover the general costs of urbanization. Beijing, Guangzhou, and Shanghai have introduced vehicle own-ership or usage control, or both. Some cities such as Shanghai already auction car license plates, which limits car use to sustainable lev-els and brings in considerable revenues (RMB 7.1 billion in 2012). Higher vehicle registra-tion fees and excise taxes on fuels also offer considerable revenue potential, and both can be implemented with special arrangements for public transport, if local governments want to limit the impact of fuel taxes on pub-lic transport prices.
A local sales tax could be charged in the cities where people live and consume. In principle, urban local governments in China could mobilize considerable resources from local sales taxes that are levied in the location where consumption occurs. If sales taxes on selected items of consumption could be made administratively feasible, they could be rev-enue productive and would pass some of the tests of a good local tax. That might be pos-sible for specific items of consumption such as high-end jewelry and imported luxury goods. But for most consumer goods, a retail sales tax would encourage tax avoidance by providing an incentive to shift the point of consumption to informal traders that are not easily policed by the tax authorities.
A piggyback surcharge could help avoid the administrative problems of sales taxes, by allowing the local government to select a tax rate to be imposed on a central government tax base. The piggyback approach is used to a considerable extent in industrial countries. The primary source of revenue for Swiss cit-ies is a piggyback personal income tax; the city of Rome levies a piggyback income tax on a base defined by the central government,

404 U r b a n C h i n a
and Danish local governments tag on to an income tax base set by the central govern-ment. Local governments in many U.S. states impose a surrate on the state government retail sales tax base. At least three cities—Bangkok, Moscow, and Seoul—have their own surtax on the VAT (Martinez-Vazquez, Vulovic, and Liu 2011). Piggybacking is already done in China with the urban main-tenance and construction tax (UMCT) and the education surcharge on the VAT and per-sonal and corporate incomes taxes. The exist-ing UMCT and education surcharge could be replaced with an “urban service tax,” and then the local government could be given the option of increasing the piggyback tax rate above its current level. The individual income tax could be added to the list of the piggy-back base, but the existing individual income tax rate would need to be lowered to make a room for local piggybacking. In addition, the individual income tax, currently fragmented by different source of incomes, could be con-solidated and simplified to a comprehensive individual income tax, and the location of collection could be changed from where peo-ple work to where people live.
Increasing prices of urban services such as mass transit, solid waste collection, water, power, and gas to full-cost-recovery levels would ration the use of resources, enhance service sustainability, and reduce government subsidies that are required to close the financ-ing gap. Internationally, the use of charges for government services of a largely individ-ual nature (water, electricity) is common, and in high-income countries, those charges often cover full costs—that is, the costs of operat-ing and maintaining the service, and a capi-tal charge to pay for depreciation and profits. Low user charges are not a good solution to address the concern of the entitlement of all citizens to basic service, such as the minimum levels of daily water necessary for good public health; all citizens are entitled to these basic services regardless of their ability to pay. The government could use vouchers or targeted subsidies through lifeline provisions to low-income households to pay for their minimum consumption levels. Targeting consumption subsidies in this manner reduces the munici-pal cost on public budgets.
China’s tax structure could be further improved. One important step would be to replace the business tax on services with a VAT, a step that authorities have already initiated. This move would encourage the growth of a services industry, because VAT on services can be deducted from the user’s VAT tax obligations. It would also encour-age enterprises to outsource services to more specialized enterprises, because there would no longer be a tax advantage for keeping ser-vices in-house. The other important step is to introduce an environment protection levy on carbon emission. This tax would not only generate significant amount of revenues, but would also an important step toward devel-oping environmental friendly cities.
Establish rule-based tax sharing and transfer
Even with enhanced local government rev-enues, a considerable gap between expendi-ture responsibilities and own revenues will continue to exist at the local level. To sup-port the new model of urbanization and eco-nomic development, the intergovernmental transfer system should be recalibrated. To motivate and enable local governments to provide equal public services to all people, urban or rural, migrant or local, a formula distribution based on expenditure needs and fiscal capacity differences would be a bet-ter approach than derivation-based revenue sharing. Changing the distribution of tax sharing from a derivation basis to a formula basis would considerably alter the outcomes for individual provinces, however, even if done gradually. Some of the losers under such a reform likely would be the richer provinces, including perhaps the larger met-ropolitan city-provinces. The lost revenues in some of the higher-income provinces could be replaced by increased local taxes and user charges. Therefore, reforming the intergovernmental transfer system would need to be done in tandem with reforming revenue assignments. That would make pos-sible the replacement of lost transfers in some provinces with higher local tax revenues. To better manage the budgetary and political disruption to local governments, the reform would inevitably need to be implemented

f i n a n C i n g U r b a n i z a t i o n 405
gradually, and the architecture of the reform must be worked out based on government objectives, administrative constraints, and politics. For example, local governments could be assigned a “target share” based on objective criteria of expenditure needs and revenue capacity, but they would only receive this incrementally, starting from their current share in the grant pool.
More specifically, the reform of the trans-fer system should take care of three dimen-sions: vertical sharing, horizontal sharing, and conditional grants.
The vertical sharing regime could be sim-plified by setting a uniform sharing rate for all central taxes. And the current collection of unconditional grants could be folded into the general revenue sharing program. By set-ting a uniform sharing rate against all cen-tral taxes, subnational governments would be protected from the revenue impacts of discretionary changes made by the central government. Moreover, the sharing rate in the future might be more easily reset to reflect expenditure assignments and desired incentives. In addition, this reform would enhance local spending autonomy, preserving the information advantages of provincial and local governments. So, vertical sharing would become relatively simple. Of the total amount of revenue raised (on taxes where the central government had responsibility for setting the tax rate), 73 percent would be transferred to the subnational governments on an uncon-ditional basis. That would make the vertical sharing revenue neutral. The central govern-ment would have the discretion to adjust the general sharing rate up or down, depending on factors such as the need to protect the expenditure-revenue balance, the costs of urbanization, compensation for expenditure reassignments, and the like.
The horizontal sharing regime, the distri-bution of a provincial revenue sharing pool, could be based fully on a formula, rather than on the origin of collections as under the current system, or on several formulas and ad hoc distributions as in the case of uncon-ditional grants. Such a horizontal sharing approach would force local governments to compete for tax revenue based on the provi-sion of quality public services, rather than by
using subsidies to attract industry and thus build its tax base. This approach would offer a better possibility for equalization and for the reduction of fiscal disparities. And it also would encourage cities to develop based on their own advantages, because the revenues of a city would be neutral to any particular economic structure irrespective of whether it was a port city, an industrial city, or a city with a significant presence of non-taxed pub-lic activities.
The formula should reflect the objectives of the government, and will change how the grant pool is distributed among provinces. The formula would be defined by the choice of the variables and how they are weighed. With emphasis on equalization, the provin-cial population might be weighed heavily in the formula (as is done in Germany). If the goal is to provide more funding where expen-diture needs are greatest, the formula ele-ments would concentrate on measures reflect-ing the cost of providing a minimum service level. China can build on its own practice with formula distribution of the equalization grant but also can learn from international experience. Formula grant systems are used in many developed countries; Australia, for example, manages a sophisticated system. In contrast, some countries, such as the United States, have no system of equalization among the states and instead rely on federal ear-marked grants and state government policies to provide equalization. As a result, stan-dards of service delivery can vary consider-ably from state to state and from local gov-ernment to local government. Box 6.4 lists the approaches to formula grants applied in other countries. In the case of China, this formula grant should ensure that local gov-ernment has capacity to deliver the minimum public service package to all serviced popu-lation, which would give explicit entitlement to migrants to access the basic public service package wherever they choose to work.
The conditional transfer system should ensure local government capacity to address externalities and to more directly address high-poverty provinces. The current condi-tional transfer system could be simplified. China could consider consolidating many specific grants into a limited number of sec-

406 U r b a n C h i n a
toral block grants that would need to be linked to central government’s broad sectoral objectives and supported by a system of per-formance indicators and performance review. All conditional grant programs should be subject to a sunset clause and a regular for-mal review, say every five years. That implies that grant financing would be stable and predictable for five years and that formula revision could take place only as a result of a formal review after five years. To overcome delay in disbursement of funds, recipient gov-ernments would receive a regular disburse-ment, say every month, of a specific amount, say 90 percent of the estimated grant due, with the balance disbursed upon evidence of performance. To overcome any diversion of funds by pass-through intermediary govern-
ments, all allocations could be posted on the web before the start of the fiscal year.
Subprovincial finance would need to be reformed to ensure resources get to where they are needed. Adjustments in central-pro-vincial fiscal relations alone are not sufficient to ensure that adequate resources would be available to accommodate the budgetary impacts of urbanization. In fact, intrapro-vincial inequalities in fiscal resources are likely greater than interprovincial disparities. Subprovincial revenue sharing arrangements vary widely from province to province with few mandatory controls set in place by the central government—a feature that is usu-ally observed in federal countries but not in unitary ones. Imposition of mandates by the central government on the pass-through of
Formula grants refer to methods of distributing rev-enue entitlements according to an objective set of indicators. This approach has appeal because it can be objective and, depending on how it is constructed, can seem fair, for example, a formula with a prov-ince’s served population and/or per capita income as a key indicator. It also has the advantage to keep the grant share of each local government relatively stable, as a province’s share of national population or rela-tive level of per capita income are unlikely to change quickly. Formula grant transfers also have some unde-sirable features, however. While the formula itself is objective once it is determined, the process of making the determination is less so—it requires a great deal of judgment and is susceptible to favoritism. More-over, the choice of variables to be used in the formula may be restricted by the quality of the data available.
Many approaches can be taken to constructing a formula. The great variation in the practice might be summarized under four relatively common grant cat-egories. The first might be called the “standard needs-standard revenue gap.” The idea here is to set the amount of grants for each local government accord-ing to the gap between the amount of expenditures required to deliver a minimum level of services and the amount of local revenue that could be raised at a “normal” level of effort. Many consider this approach to be the best. It was developed in Australia and is
box 6.4 Formula grants
also used in Italy and the Republic of Korea, as well as in China.
The second approach is more ad hoc, in that it develops a formula based on impressionistic reason-ing about indicators of fiscal capacity and expendi-ture needs, and then weights each indicator in the distribution formula. These can be very complicated or very simple. Most commonly, population is used as the basic measure of expenditure needs, although its weight in the formula may differ from country to country (for example, 75 percent in Spain and 10 per-cent in India). Other indicators of expenditure need are also chosen in different countries, such as the per-cent who are elderly in Korea, population density in Germany, energy cost in Mongolia, and that share of the population with no access to health care in South Africa.
Third, some provision is made for fiscal capacity. For example, less revenue is transferred to places with greater fiscal capacity and more to places with less capacity (Switzerland, Germany, and India). Alterna-tively, more revenue may be transferred to places that make a greater tax effort (Spain).
Finally formal set-asides are provided in some cases where the government feels that a factor that cannot be measured is nonetheless important to include; examples are state capitals in Brazil and “backward” states in India.
Source: Bahl and Qiao 2013.

f i n a n C i n g U r b a n i z a t i o n 407
central transfers to city and county govern-ments may be prudent to ensure objectives can be achieved.
reform land finance
The Chinese practice of financing urban infra-structure with the proceeds of land leases is both wildly successful and problematic. The basic problem is not with the practice of con-verting farmland assets into productive urban facilities and higher-quality urban services, but rather with the way in which it is being done. Land finance reform needs to address three key challenges: realigning the subna-tional governments’ incentives regarding land acquisition and development with residents’ interest; getting the best economic value from the land assets the subnational governments have already acquired; and mitigating the fis-cal risks emanating from land market vola-tility. 21 This reform would call for China to change the way land development is financed; explore other options for capturing land value and value increase; and establish rigorous fiscal rules for land financing. These would require important changes in the law and the administration, and these changes would need to be worked out and fit together. The following are the most difficult issues:
• Fairness: The fairness questions related to expropriation and compensation for farm-land and village construction land must be worked out. If compensation for these lands is set at market levels for urban land, then a capital gains tax should be levied and returned to local governments. That would put government in the right place—taxing the profits at a reasonable rate rather than expropriating all of the profits.
• Urban sprawl: The problem of dealing with urban sprawl is related to the prac-tice of selling land leases. At least at the margin, this problem might be addressed with a property tax that would help ratio-nalize the land market by imposing a hold-ing cost on land in the built-up area that is being held off the market, imposing higher motor vehicle and motor fuel taxes that would increase the cost of city sprawling, and eliminating derivation-based revenue
sharing, which would reduce the incentive for local government leaders to subsidize industry.
• Revenue impact. The net impact on financing of these changes in land leasing is uncertain and depends on the stock of the idle industrial land and other public land. The first change will inevitably lower the net profits of governments from land, while the second change, abolishing subsi-dies on industrial land, would reduce tax expenditures and therefore improve rev-enues. In addition, the land saved through more efficient use of industrial land could be reallocated to housing or commercial use, and that is likely to generate a signifi-cant amount of revenue. To mitigate any possible revenue shortfall, China could impose betterment taxes on those that see the value of their property rise because of infrastructure development. Box 6.5 lists several practices for capturing land value that have been applied in other countries.
This reform would have important impacts, and the debate surrounding it would be politically charged. Whether its adop-tion is in the best interests of China depends on how well the reform matches national goals. On the one hand, infrastructure ser-vices no longer would be free to users, indus-tries would be deprived of some profits, and city governments might no longer enjoy the monopoly power over land transactions. On the other hand, this reform could reduce the incentives that lead to urban sprawl, improve equity, and optimize the use of existing urban land. A slowdown in land leasing and infra-structure spending could give more space for attention to maintenance and a reallocation of public expenditures to social services. In addition, this reform would encourage more efficient use of industrial land and promote more efficient allocation of industries based on market prices for land. That might nar-row regional disparity because the less devel-oped regions with cheaper land have more opportunity to attract industrial investment. Urban-rural income disparity could be nar-rowed as well. Farmers in city suburbs would gain directly from land conversion, and those living far away from urban areas could also
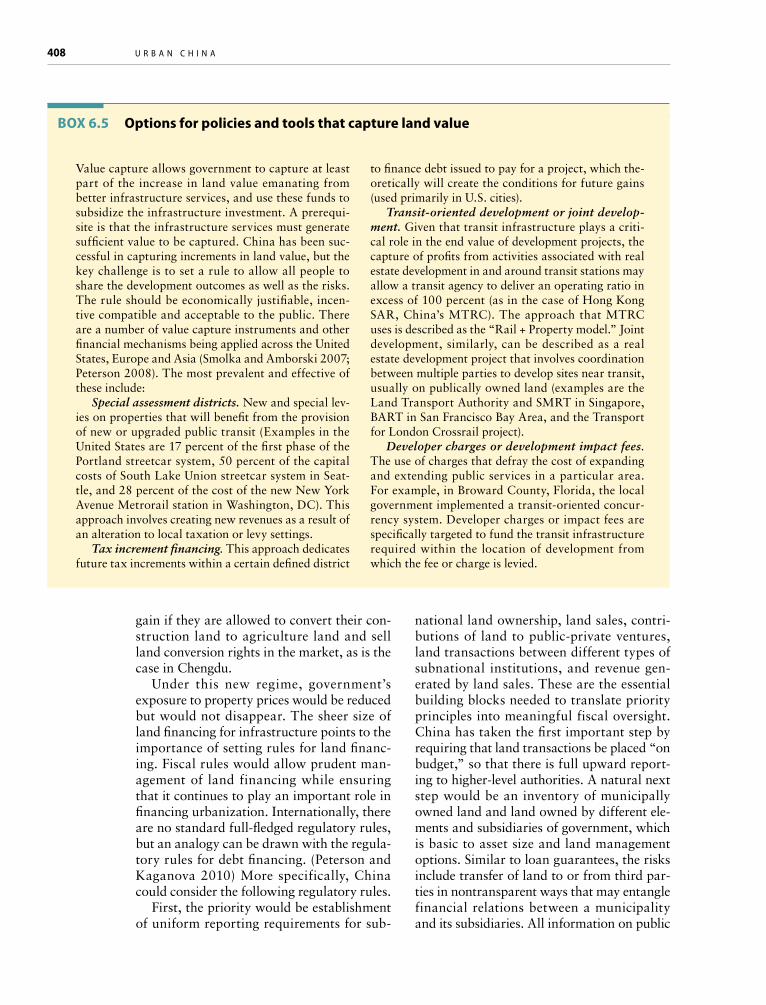
408 U r b a n C h i n a
gain if they are allowed to convert their con-struction land to agriculture land and sell land conversion rights in the market, as is the case in Chengdu.
Under this new regime, government’s exposure to property prices would be reduced but would not disappear. The sheer size of land financing for infrastructure points to the importance of setting rules for land financ-ing. Fiscal rules would allow prudent man-agement of land financing while ensuring that it continues to play an important role in financing urbanization. Internationally, there are no standard full-fledged regulatory rules, but an analogy can be drawn with the regula-tory rules for debt financing. (Peterson and Kaganova 2010) More specifically, China could consider the following regulatory rules.
First, the priority would be establishment of uniform reporting requirements for sub-
national land ownership, land sales, contri-butions of land to public-private ventures, land transactions between different types of subnational institutions, and revenue gen-erated by land sales. These are the essential building blocks needed to translate priority principles into meaningful fiscal oversight. China has taken the first important step by requiring that land transactions be placed “on budget,” so that there is full upward report-ing to higher-level authorities. A natural next step would be an inventory of municipally owned land and land owned by different ele-ments and subsidiaries of government, which is basic to asset size and land management options. Similar to loan guarantees, the risks include transfer of land to or from third par-ties in nontransparent ways that may entangle financial relations between a municipality and its subsidiaries. All information on public
Value capture allows government to capture at least part of the increase in land value emanating from better infrastructure services, and use these funds to subsidize the infrastructure investment. A prerequi-site is that the infrastructure services must generate sufficient value to be captured. China has been suc-cessful in capturing increments in land value, but the key challenge is to set a rule to allow all people to share the development outcomes as well as the risks. The rule should be economically justifiable, incen-tive compatible and acceptable to the public. There are a number of value capture instruments and other financial mechanisms being applied across the United States, Europe and Asia (Smolka and Amborski 2007; Peterson 2008). The most prevalent and effective of these include:
Special assessment districts. New and special lev-ies on properties that will benefit from the provision of new or upgraded public transit (Examples in the United States are 17 percent of the first phase of the Portland streetcar system, 50 percent of the capital costs of South Lake Union streetcar system in Seat-tle, and 28 percent of the cost of the new New York Avenue Metrorail station in Washington, DC). This approach involves creating new revenues as a result of an alteration to local taxation or levy settings.
Tax increment financing. This approach dedicates future tax increments within a certain defined district
box 6.5 options for policies and tools that capture land value
to finance debt issued to pay for a project, which the-oretically will create the conditions for future gains (used primarily in U.S. cities).
Transit-oriented development or joint develop-ment. Given that transit infrastructure plays a criti-cal role in the end value of development projects, the capture of profits from activities associated with real estate development in and around transit stations may allow a transit agency to deliver an operating ratio in excess of 100 percent (as in the case of Hong Kong SAR, China’s MTRC). The approach that MTRC uses is described as the “Rail + Property model.” Joint development, similarly, can be described as a real estate development project that involves coordination between multiple parties to develop sites near transit, usually on publically owned land (examples are the Land Transport Authority and SMRT in Singapore, BART in San Francisco Bay Area, and the Transport for London Crossrail project).
Developer charges or development impact fees. The use of charges that defray the cost of expanding and extending public services in a particular area. For example, in Broward County, Florida, the local government implemented a transit-oriented concur-rency system. Developer charges or impact fees are specifically targeted to fund the transit infrastructure required within the location of development from which the fee or charge is levied.

f i n a n C i n g U r b a n i z a t i o n 409
land inventories, public land valuations, land sales, and land contributions to public-private joint ventures or subsidiaries should be con-ducted through standardized instruments, be reflected in the budget or its annexes and financial statements, and be a matter of pub-lic record. Regulations typically identify what types of publicly owned property can and cannot be alienated, either by sale or as col-lateral for loans. The registration of land and property collateral for land-management pur-poses also involves exactly the same informa-tion required for subnational debt regulation.
Second, the “golden rule” of public finance should be applied to subnational land financing: Proceeds of land asset sales must be used only to finance investment. Excep-tions could be allowed for key, one-time insti-tutional reforms. Although urban authorities can acquire new land at the urban fringe, and under certain conditions may acquire land through condemnation or eminent domain, urban land cannot be “produced” indefi-nitely. Sale or leasing of public land is not a “recurring” source of revenue. Thus, rev-enues from the sale or other disposition of public land should be treated as one-time rev-enues, with proceeds used to finance urban investment or finance other one-time expen-ditures such as major institutional reforms. Such rules also open the opportunity to diversify and augment own-source financing of capital investment.
Recurring revenues from public land development may be appropriately allocated to subnational operating budgets. In cases where public authorities develop commer-cial or industrial projects on public land, for example, development costs can be recap-tured through annual rental charges and used to finance debt service charges through the operating budget. For economic effi-ciency and fiscal prudence, it is essential in these cases that all parts of a public develop-ment project, including land, be valued at market prices, and that the decision whether to publicly develop a site, sell land to the pri-vate sector for private development, or hold land in the public domain for future devel-opment and future increases in land value be made taking into account realistic market valuations.
Third, loans and bonds backed by land collateral may require special regulation. Urban land markets are volatile and cycli-cal. Extreme dependence on land finance for capital investment funding will impart this volatility to subnational capital budgets. The fiscal framework should mitigate such risk. Risk mitigation may take the form of ceilings on land-finance dependence (similar to ceil-ings on local indebtedness) or establishment of permanent infrastructure funds that accu-mulate proceeds from land sales and spread out expenditures over time, according to an infrastructure investment plan. Such rules could set minimum collateral to loan ratios for land-backed loans and prescribe that land must be valued at current market value for collateral purposes.
Fourth, transfer of surplus land to other government units or enterprises, private developers, or public-private partnerships should be prohibited except on a fully dis-closed contract basis. Establishing a land trust (found in some U.S. states) that could receive land sale proceeds, and ensuring that proceeds are used for infrastructure invest-ment as prescribed by law, or as decided by appropriate authority with a metropolitan-wide perspective, is one way to overcome the incentives that bureaucratic owners have to “internalize” land sale gains for the sole ben-efit of the agency.
Develop stable and sustainable debt finance
Stable and sustainable debt finance is critical to China’s continuing urbanization. A con-sensus has emerged within China that local governments should be allowed to access financial markets directly. Direct access yields several benefits. Subnational borrow-ing finances infrastructure more equitably because it matches infrastructure asset life with the maturity of debt instrument so that the beneficiaries of the financed services pay for them. It also exposes local governments to market disciplines and reporting require-ments, hence helping strengthen fiscal trans-parency, sound budget and financial manage-ment, and good governance. Furthermore, expanding local government borrowing

410 U r b a n C h i n a
facilitates the development of competitive financial markets, in particular the deepen-ing of the bond market. And finally, regu-lated direct access to borrowing rather than unregulated indirect access through LGFVs is likely to entail lower risks for the financial sector.
Before China modifies the Budget Law to allow local governments to have direct and open access to credit, a regulatory framework must be established in line with international good practice. Even in the United States, the legal framework set up by each state regu-lates the borrowing of the state and its local governments (Canuto and Liu 2013). These regulatory frameworks work together with markets to discipline subnational borrowing and make it sustainable. China’s capital mar-kets are still evolving; thus it is all the more important to establish a framework to regu-late subnational borrowing while promot-ing a competitive and diversified subnational credit market.
Rigorous regulatory frameworks for subnational borrowers
As China develops a regulatory framework for subnational borrowers, international experience is relevant. The 1990s saw wide-spread subnational debt crises or fiscal stress in major developing countries such as Argen-tina, Brazil, India, Mexico, and the Russian Federation. These crises led to reforms to develop and strengthen regulatory frame-works for local government debt financing in these countries. Some countries such as Peru established a framework in the early 2000s to preempt the fiscal risks of decentralization. Historically, the debt crises in U.S. states in the 1840s led to major constitutional reforms regulating debt in many states. In France, a regulatory framework was put in place in the 1990s after episodes of insolvency in the early 1990s as a result of uncontrolled local government borrowing in the 1980s (L. Liu and Waibel 2010).
Following international experiences, the basic structure of a regulatory framework for China in the medium term should consider the following elements: identifying which entities are eligible for borrowing, reforming
LGFVs, setting fiscal rules and debt limits, and developing approval and monitoring pro-cedures for debt issuance.
Eligibility of borrowing entities. A key ques-tion is which level of subnational governments should be allowed to borrow and whether LGFVs should continue to serve as financ-ing platform of subnational governments. To answer this question, it is important to note that debt is intended to finance long-term asset formation and that it must be serviced. A subnational government that has revenue sources and a responsibility to finance infra-structure should be allowed to access finan-cial markets. If and when a subnational gov-ernment is legally permitted to borrow, the practice for creating LGFVs as pure financing vehicles should cease. However, LGFVs that finance and manage essential infrastructure services such as roads, water supply and solid waste treatment should be permitted to bor-row, if these LGFVs have their own sources of revenues generated from infrastructure projects. These LGFVs will follow corporate governance structure and financial reporting requirements.
These two types of borrowing entities—subnational government and LGFVs—are differentiated by the underlying sources of revenues to service the debt. A subnational government as a borrower will have broader revenue sources such as transfers and tax revenues to service the debt. LGFVs in infra-structure generate revenues from user fees such as tolls and water fees that can be used to service the debt.
While fiscally strong local governments can access markets, fiscally weaker local gov-ernments, particularly in rural or economi-cally disadvantaged regions, may have diffi-culty in achieving creditworthiness. For these local governments, the central or provincial government needs to finance the bare mini-mum of infrastructure investment through grants or direct construction by the higher-level government. To prevent local govern-ments from not seeking to become credit-worthy in order to access grant financing, the amount of funding provided should be determined by standardized rules to ensure a set of minimum standards of service delivery.

f i n a n C i n g U r b a n i z a t i o n 411
Local governments with fiscal potential but lagging in achieving creditworthiness should also be eligible only for rule-based small grants for infrastructure until they can demonstrate creditworthiness. Policy banks should focus on assisting these local govern-ments with technical assistance and training in return for making the first new loan to the local government only after it passes the creditworthiness threshold.
Reforming LGFVs. Even after local govern-ments are allowed to borrow directly, some LGFVs can still play an important role in infrastructure financing and operations. The reforms should differentiate three types of LGFVs. LGFVs that finance and implement public infrastructure projects should continue to exist but be reformed to become transpar-ent and financially stronger. LGFVs that are pure financing vehicles for subnational gov-ernments should be dissolved, and their debts brought onto local government balance sheet, once the subnational governments have for-mal and open access to markets (after the Budget Law is amended). LGFVs that mix public and private commercial activities should divest their commercial activities, in line with the direction of refocusing the gov-ernment on essential public services. This last is perhaps the most challenging aspect of LGFV reform.
As the three types of LGFVs are being clas-sified and restructured, an important reform is to consolidate and restructure LGFV debt (see section on insolvency framework). After restructuring and consolidation, LGFVs that will continue to finance and manage public investments can be strengthened in three ways.
First, if they are not already, these LGFVs should be corporatized, which would strengthen their corporate governance and financial structure. China should continue reforms on cost recovery and pricing of tar-iffs, which will be critical to the financial sus-tainability of infrastructure.
Second, the fiscal relationship between the government budget and LGFV operations should become transparent. LGFVs should follow internationally acceptable account-ing and reporting standards, and have their
accounts audited and their financial state-ments disclosed periodically to the local peo-ple’s congress and the public. Some LGFVs that engage in infrastructure projects may not be financially self-sufficient and may continue to require budgetary support. In these cases, their financial statements should become part of the government budget documents and be reported to the appropriate people’s congress and disclosed to the public. LGFVs that rely on budget support should also be part of the capital budgeting process and of the general government borrowing plan, as is done in Maryland in the United States, for example.
Third, financially self-sustaining LGFVs should be allowed to access markets through their own financial strength but they should also follow a rigorous regulatory framework. LGFVs that generate project revenues such as tolls and water fees should be able to use rev-enue bonds instruments or project financing to access financial markets for infrastructure investments.
Fiscal rules and debt limits for borrowing. Fiscal rules and debt limits for borrowers are intended to manage the risks of systemic defaults before they occur. Many countries have adopted a basic rule, called the “golden rule,” which allows government entities to borrow money only for long-term public capital investments (L. Liu and Waibel 2010). Based on international practice, short-term borrowing for working capital can be per-mitted. However, provisions should be estab-lished to provide a maximum amount of such short-term borrowing and to prevent the roll-over of short-term borrowing into operating deficits.
In addition to the golden rule, a further set of fiscal rules and debt limits should be established. A number of issues must be con-sidered in establishing such rules and limits (L. Liu and Pradelli 2013). First, fiscal rules and debt indicators for subnational govern-ments must take into account the fiscal space available for the total public sector, that is, central and local governments. For any given resources available to repay the total public debt, the borrowing space is ultimately split between the central and local governments. At high debt levels, public indebtedness tends
412 U r b a n C h i n a
to hamper economic growth by crowding out private investment (because of higher interest rates, debt overhang problems, and the like) and imposing heavy tax burdens that distort incentives to produce and invest. In China, the low level of sovereign debt provides com-fortable space for subnational debt accumula-tion. However, local government borrowing limits should be established in tandem with public finance reform that aligns the tax rev-enues with functions and gives local govern-ment the taxing power to meet local needs. In addition, potential expenditure pressures that could constrain fiscal space for subnational entities should be carefully monitored.
Second, translating thresholds established by empirical studies into debt limits guiding borrowing policies can be challenging. China differs critically from some other developing countries. While excessive indebtedness of subnational governments has led to restric-tive debt limits in other countries, China may not benefit from overly restrictive debt lim-its that can hamper growth. Faster economic growth, large national savings, and a lower cost of borrowing can lead to positive debt dynamics in China. The main goal in China is to develop sound regulatory frameworks so that subnational governments can mobilize resources from the capital markets to finance large-scale infrastructure investments that support growth and urbanization, while con-taining overall macroeconomic risks.
Third, it will be important to establish fis-cal rules for LGFVs as well, because LGFVs’ liabilities ultimately constitute sources of contingent liabilities for central and local governments. In the United States, SPV bor-rowing is subject to regulation (L. Liu 2010). For example, a typical rate covenant in the United States for a water-sewer utility is to set rates sufficient to produce net revenues equal to at least 1.25 times total annual debt ser-vice. In the United States, SPV debt financed by revenue bonds is subject to the regula-tory rules and debt limits set for revenue bonds but is generally outside the debt limits imposed on debt instruments securitized by a government’s general taxation power. For this to work, accounting and financial trans-parency of SPVs is an important prerequisite.
Without transparency, the financial problems of an SPV can become contingent liabilities of its owner. Table 6.5 provides a summary of key fiscal rules and debt limits for China to consider.
Guarantees can play a useful role in bridg-ing financing for projects that have public policy justifications, or where markets do not fully recognize the underlying economic values. However, guarantees also create an incentive for risky borrowers to seek govern-ment guarantees, and for interrelated public entities to support one another in ways that violate arm’s-length standards and obfuscate the financial risks that are being assumed. International experience shows that the risks of guarantees for debt service can be regu-lated while retaining the usefulness of the guarantees. The generally applied key rules include the following (L. Liu 2010):
· Private companies may be prohibited from getting such guarantees.
· The scope of guarantees for municipal enterprises may be limited. In France, for example, annual debt charges paid by the local government on its own loans and on loans it has guaranteed may not exceed 50 percent of its operating revenue; no single borrower may receive in guarantees more than 5 percent of the local government’s operating revenue, and guarantees may not exceed 50 percent of the principal of the debt of the entity that is guaranteed. Poland has a stricter rule, which counts guaran-tees provided to a municipal enterprise by a local government as part of the govern-ment debt service, which in total (principal, interest, and guaranteed debt service) can-not exceed 15 percent of its revenues.
· Guarantees and all other direct and indi-rect debt liabilities should be an explicit part of local government budget and finan-cial statements, fully disclosed to the local people’s congress and the public.
Procedures for approving and monitoring subnational debt. The central government, through the Ministry of Finance, should set fiscal rules and debt limits for all levels of subnational government. These rules and
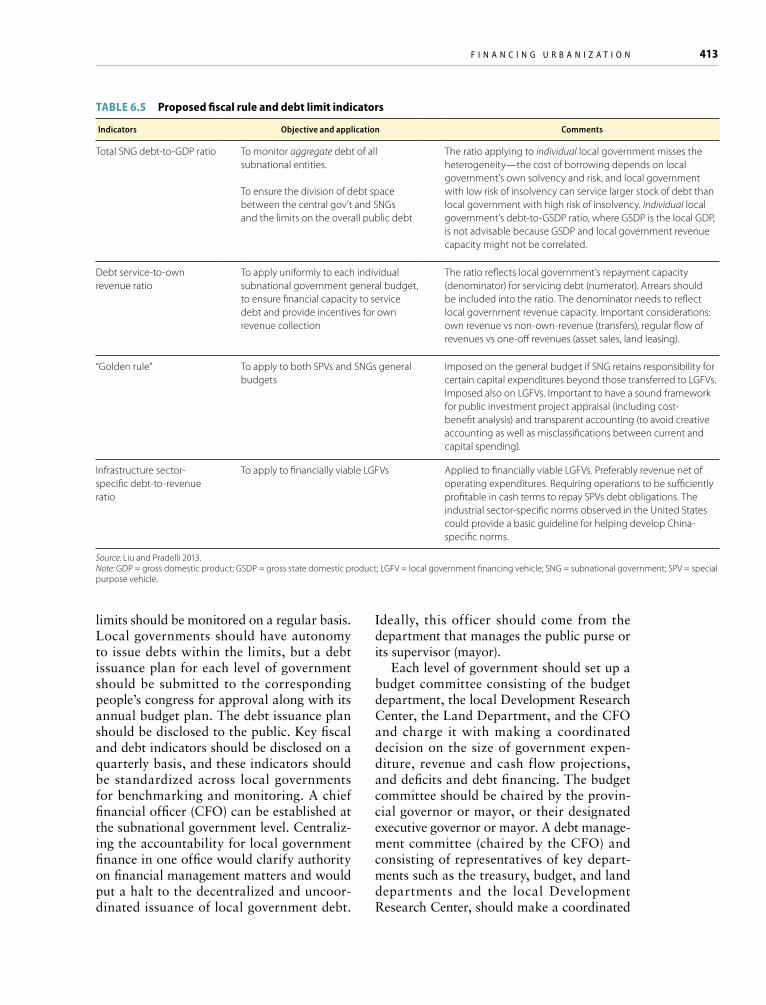
f i n a n C i n g U r b a n i z a t i o n 413
limits should be monitored on a regular basis. Local governments should have autonomy to issue debts within the limits, but a debt issuance plan for each level of government should be submitted to the corresponding people’s congress for approval along with its annual budget plan. The debt issuance plan should be disclosed to the public. Key fiscal and debt indicators should be disclosed on a quarterly basis, and these indicators should be standardized across local governments for benchmarking and monitoring. A chief financial officer (CFO) can be established at the subnational government level. Centraliz-ing the accountability for local government finance in one office would clarify authority on financial management matters and would put a halt to the decentralized and uncoor-dinated issuance of local government debt.
Ideally, this officer should come from the department that manages the public purse or its supervisor (mayor).
Each level of government should set up a budget committee consisting of the budget department, the local Development Research Center, the Land Department, and the CFO and charge it with making a coordinated decision on the size of government expen-diture, revenue and cash flow projections, and deficits and debt financing. The budget committee should be chaired by the provin-cial governor or mayor, or their designated executive governor or mayor. A debt manage-ment committee (chaired by the CFO) and consisting of representatives of key depart-ments such as the treasury, budget, and land departments and the local Development Research Center, should make a coordinated
Table 6.5 Proposed fiscal rule and debt limit indicators
Indicators Objective and application Comments
Total SNG debt-to-GDP ratio To monitor aggregate debt of all subnational entities.
To ensure the division of debt space between the central gov’t and SNGs and the limits on the overall public debt
The ratio applying to individual local government misses the heterogeneity—the cost of borrowing depends on local government’s own solvency and risk, and local government with low risk of insolvency can service larger stock of debt than local government with high risk of insolvency. Individual local government’s debt-to-GSDP ratio, where GSDP is the local GDP, is not advisable because GSDP and local government revenue capacity might not be correlated.
Debt service-to-own revenue ratio
To apply uniformly to each individual subnational government general budget, to ensure financial capacity to service debt and provide incentives for own revenue collection
The ratio reflects local government’s repayment capacity (denominator) for servicing debt (numerator). Arrears should be included into the ratio. The denominator needs to reflect local government revenue capacity. Important considerations: own revenue vs non-own-revenue (transfers), regular flow of revenues vs one-off revenues (asset sales, land leasing).
“Golden rule” To apply to both SPVs and SNGs general budgets
Imposed on the general budget if SNG retains responsibility for certain capital expenditures beyond those transferred to LGFVs. Imposed also on LGFVs. Important to have a sound framework for public investment project appraisal (including cost-benefit analysis) and transparent accounting (to avoid creative accounting as well as misclassifications between current and capital spending).
Infrastructure sector-specific debt-to-revenue ratio
To apply to financially viable LGFVs Applied to financially viable LGFVs. Preferably revenue net of operating expenditures. Requiring operations to be sufficiently profitable in cash terms to repay SPVs debt obligations. The industrial sector-specific norms observed in the United States could provide a basic guideline for helping develop China-specific norms.
Source: Liu and Pradelli 2013.Note: GDP = gross domestic product; GSDP = gross state domestic product; LGFV = local government financing vehicle; SNG = subnational government; SPV = special purpose vehicle.

414 U r b a n C h i n a
decision on a medium-term debt strategy, by taking into account the revenue streams, cash flow, procurement and expenditure plans of line departments, and the balance sheet of governments (assets and liabilities). Gradu-ally, China should move toward a robust borrowing framework that connects with the overall framework of fiscal management and transparency.
Developing an insolvency framework
International experience shows that rely-ing only on ex ante fiscal rules and limits, without ex post consequences, gives irre-sponsible borrowers and lenders an incentive to get around the ex ante rules and execute transactions that will later get bailed out (L. Liu 2010). China would need to establish a framework for insolvency and debt restruc-turing, in addition to ex ante borrowing framework discussed above.
International experience shows that a col-lective framework for debt resolution is at the core of a sound insolvency framework (L. Liu 2010; L. Liu and Waibel 2010). The tension between maintaining essential services and creditors’ contractual rights implies that the pain of insolvency needs to be shared between creditors and the debtor. The insolvency mechanism needs to balance these competing interests and guide the pri-ority structure for settling competing claims. A collective framework will take on more importance as the subnational bond market develops and grows to include thousands of creditors. A lack of clear rules for insolvency is likely to raise borrowing costs, and may limit market access for creditworthy borrow-ers. In the United States, Chapter 9 of the Bankruptcy Code imposes strong measures on defaulting municipalities and carries a strong stigma to offset debtor moral hazard.
A sound framework should reduce the moral hazard of subnational defaults, dis-courage free riders, bind all local govern-ments to pursue sustainable fiscal policies, and extend the short-term horizon of local governments to minimize the impact of unsustainable fiscal policy on future genera-tions (Canuto and Liu 2013). In the absence of a clearly defined framework for insolvency,
local governments may adjust debt in nego-tiations with creditors, repudiate their obliga-tions, or shift the liabilities to higher levels of government. A country’s legal, political, and historical context influences the choice and design of an insolvency system. However, a sound insolvency system balances the needs of borrowers (representing citizens) and the needs of creditors (representing savers), establishes a transparent and rule-based debt workout procedure, and minimizes moral hazard. Such a framework in China will serve two purposes. First, it will guide the restructuring of subnational debt. China cur-rently is conducting a comprehensive audit of subnational debt. As the reform of LGFVs and other off-budget vehicles (such as financ-ing vehicles for hospitals and universities) proceeds, the debt of the off-budget vehicles will need to be classified, and some may need to be restructured. Second, an insolvency framework will address future defaults of subnational units so that an insolvent local government can maintain essential services while restructuring its debts, restore its finan-cial health, and reenter the financial market.
Developing a subnational credit market
China has large national savings. It also has large infrastructure demand resulting from rapid urbanization and the need to absorb millions of rural residents in urban areas. Financial markets can channel savings into infrastructure investments. Diversified sub-national credit markets can provide more investment instruments for institutions (such as insurance companies and mutual funds) and individual investors.
Two models of subnational credit mar-kets. There are two major models of subna-tional credit markets: bank lending, which financed municipal investment in Western Europe throughout most of the 20th cen-tury and is still the primary source of local credit financing there, and subnational bond markets, which China has been developing as an additional source to bank lending. The United States is an example of a country that has a deep and competitive municipal bond market. Annual issuances of local govern-

f i n a n C i n g U r b a n i z a t i o n 415
ment bonds are about $400 billion with out-standing liabilities at about $3 trillion (or 20 percent of GDP). Individual investors are the largest holders of U.S. subnational bonds, fol-lowed by mutual funds, bank trust accounts, banks, insurance companies, and corpora-tions (L. Liu 2010).
Developing competitive and diversified funding sources for infrastructure financing is important to help lower the financing cost. In establishing a framework for municipal finance borrowing after the fall of apartheid, South Africa clearly understood the benefits of competition in the subnational credit mar-ket. Its Intergovernmental Fiscal Review report states, “Active capital markets, with a variety of buyers and sellers, and a variety of financial products, can offer more effi-ciency than direct lending. First, competi-tion for municipal debt instruments tends to keep borrowing costs down and create structural options for every need. Second, an active market implies liquidity for an inves-tor who may wish to sell. Liquidity reduces risk, increases the pool of potential investors, and thus improves efficiency” (South Africa National Treasury 2001, 192).
Several European countries, including the Netherlands and Sweden, and over 50 developing countries have set up municipal development banks or municipal develop-ment funds as the sole or main channel for providing credit to subnational govern-ments. That approach is not recommended for China. Municipal development banks and funds appear to have the advantage of a focused purpose and scope and an ability to build relationships with their borrowers. In theory, they are able to more closely moni-tor the borrower and provide technical assis-tance to weaker borrowers. If not well regu-lated, however, such close relationships with borrowers can be problematic, and the lim-ited scope of their business increases the risk of failure in the case of widespread default. Most importantly, their subsidized lending is costly to the central government and impedes the development of market-based financing.
The international experience with spe-cialized national and regional development banks and municipal funds is mixed with negative examples and consequences. Bra-
zil privatized almost all state policy banks as part of a debt restructuring agreement between those banks and the federal govern-ment in 1997. In the Philippines, government financial institutions have become an impedi-ment to private entry into local government markets. In some Eastern Europe countries, municipal funds have become monopolies.
According to Peterson (2003), financial sector deregulation has eliminated the pos-sibility of having quasi-monopoly municipal banks draw on specially protected govern-ment allocations of low-cost, long-term sav-ings to finance subnational infrastructure. In a competitive world, bonds offer more ways to tap institutional and household long-term savings. Even when the ultimate credit extended to a local government continues to be a loan from a bank or other financial institution, the financial intermediary will increasingly raise its own capital for lending from bond issues.
Developing a subnational bond market. China’s infrastructure financing has been dominated by commercial banks and gov-ernment policy banks (and land financing). This dominance provides too narrow a set of financing instruments for China’s continu-ing urbanization. By broadening the range of instruments and sources to include institu-tional investors in the domestic bond market, and eventually even private equity, financ-ing can better respond to the pace and scale of infrastructure development that China’s rapid urbanization requires.
Engaging the domestic bond market in urban infrastructure financing creates a new class of assets for Chinese investors. Institu-tional investors have large resources to invest in the domestic debt market. These resources can be put to work financing urban infra-structure. Bonds issued by local governments and LGFVs are well suited to the needs of institutional investors such as pension funds, insurance companies, and mutual funds for wealthy individuals who wish to diversify their investments in long-term assets. Bonds that finance urban infrastructure can provide a secure source of fixed income for institu-tional investors. They can also be risk rated so that regulatory authorities can assess the

416 U r b a n C h i n a
impact that they have on the riskiness of the institutional investors’ portfolio, and institu-tional investors can be limited to investments in highly rated assets, as they are in many countries.
There is substantial room to grow and deepen the bond market to achieve a long-term investment target of 150–200 percent of GDP. In 2010, China’s domestic bond market was 40 percent of GDP. In Turkey, it is over 90 percent, and in Brazil nearly 200 percent (IFC 2013). Deep, efficient domestic capital markets are a powerful source of long-term financing for infrastructure and other sectors that underpin growth. They create alternative financing tools and greater access to capital. Domestic capital markets also provide resil-ience against banking system shocks.
China has already started to experiment with creating a municipal bond market (table 6.6). Since 2011, four local govern-ments—the provinces of Guangdong and Zhejiang and the cities of Shanghai and Shenzhen—have been allowed to issue a small amount of municipal bonds directly in the market. In 2013, the provinces of Jiangsu and Shandong were added to the trial pro-gram. A much larger volume of financing has also been mobilized for provincial gov-ernments through bonds issued by the Min-istry of Finance on behalf of the provincial governments.
To better take advantage of the bond market, China will need to extend the yield curve. Three- and five-year bonds, which constitute 98 percent of municipal bonds issued in China since 2011, are too short to spread debt service over the life of the infra-structure. Front-loading the debt service in this way puts unnecessary strain on local
government finances and creditworthiness. China should encourage the issuance of municipal bonds with terms of 10, 15, and 20 years with the objective of moving to 25- and 30-year bonds over time. To extend the term of municipal bonds, the market will have to establish a yield curve that prices bonds of equal quality according to their term. This requires benchmark rates for those terms in the sovereign bond market. Central govern-ment AAA Treasury bonds have been issued for 10- and 20-year terms, but the volume has been relatively small, so benchmark rates have yet to become firm. The Ministry of Finance could begin issuing 15-year T-bonds and increase the volume of longer-term issues to establish benchmarks in the rates for risk-free long bonds.
The local government bond market could be promoted by clearly defining types of rev-enues that can securitize the bonds. Two types of revenues facilitate the development of two types of bonds: general obligations bonds and revenue bonds. General obligation bonds (GBs) are secured by a government’s general faith and credit, that is, the general taxation revenue of the issuer. This type of bond pro-vides a useful financing instrument for public services, such as local streets, street lights, and traffic signals, which do not generate revenues or sufficient revenues, from user charges. The ratings of general obligation bonds are the same as the institutional rating of the issuer unless specific credit enhancements (for exam-ple, a bond guaranty from a policy bank or other source) are added to the bond.
Revenue bonds (RBs) are secured solely by the revenues generated from the project financed by the bonds. There is a direct link between the beneficiaries of the project and their obligations to pay debt services. Inves-tors have no claim on other local govern-ment revenue sources for repayment of these bonds. For this reason, RBs are suited only for financing projects that can produce rev-enue from user charges, such as projects for water supply, toll roads, airports, and pub-lic transport. Revenue bonds reinforce self-sustaining finance, because the repayment of principal and interest is made entirely from the revenues generated from the project financed by the bonds. These bonds allow
Table 6.6 local government bonds by issuersRMB, 100 millions
2009 2010 2011 2012 Total
Ministry of Finance 2,000 2,000 1,771 2,211 5,982
Shanghai 0 0 71 89 160
Guangdong 0 0 69 86 155
Shenzhen 0 0 22 27 49
Zhejiang 0 0 67 87 154
Total 2,000 2,000 2,000 2,500 6,500
Source: Painter 2013.
f i n a n C i n g U r b a n i z a t i o n 417
the market to play a central role in enforcing debt limitation, pricing risks, and matching the maturities of liabilities with the economic lives of assets. More importantly, RBs affirm that sustainability is about the ability of the borrower to service the debt. No financ-ing structure has been of greater impor-tance to the growth of the U.S. municipal bond market than RBs, which account for about two-thirds of subnational debt in the United States (L. Liu and Waibel 2008). In the United States, revenues bonds of SPVs are outside the debt limits set by the states, but revenue bonds follow strict rules and have a low rate of debt default.
Hybrid bonds (HBs) are a third type of municipal bond that combines characteris-tics of both general obligation and revenue bonds. Like a GB, debt service payments are not linked to revenues produced by the project being financed. Like an RB, the local government does not have to pledge the use of all of its revenue sources to debt service. Hybrid bonds offer investors repayment from one or more specific revenue sources only. Local governments can pledge a highly reli-able source of revenue to the HB and arrange for that revenue to be directed into a trust account dedicated solely to repayment of the HB. This allows local governments to finance projects that do not produce revenue with a reliable alternative revenue source, while not encumbering their overall balance sheet. Carefully structured HBs can achieve bond ratings that are better than the issuer’s insti-tutional credit rating. Compared to GBs and RBs, HBs have proven to be the preferred type of infrastructure bonds in the emerging debt markets of India, Mexico, South Africa, and elsewhere.
Local governments in general should refrain from speculative debt instruments such as structured products. These instru-ments should be regulated and in most cases prohibited for used by local governments. The risky debt profiles of some local govern-ments in France stemming from the use of structured products in the 2000s provide a cautionary tale (Canuto and Liu 2013).
Regulating the subnational credit market. Development of a subnational bond market
requires a coherent set of securities regula-tions. In many ways, securities regulations for subnational bonds are similar to those for sovereign and corporate bonds. The institu-tional infrastructure for bond issuance and trading, such as regulations on credit rat-ing agencies, broker-dealers, underwriters, and auditors, are also similar. In addition, China also needs to build a reliable govern-ment bond market yield curve, standardize the accounting standards of public sectors, impose municipal bond documentation and disclosure requirements, and develop profes-sional services.
Security laws cannot prevent defaults and financial deterioration of local governments. Securities laws also cannot replace rules for prudent fiscal management of local govern-ments and for corporate governance for pub-lic entities and special purpose vehicles that are owned by local governments. What they can do is mandate disclosure to investors of all material information that would affect an investor’s decision to buy, sell, or hold a secu-rity. Securities regulations may also cover the offer and sales of securities and the regula-tion of issuers, trading systems, and the pro-fessionals who work in these areas (box 6.6).
The introduction of an insolvency frame-work that disciplines both lenders and bor-rowers, together with a law that makes financing offered to unrated local govern-ments unenforceable, creates strong incen-tives for more responsible financing of urban infrastructure. Vigilant regulation of banks and institutional investors creates an impor-tant incentive for prudent lending behavior. Putting regulation of all financial institutions on an equal footing will open the door to greater use of long-term financing in the Chi-nese capital market.
Over the long term, the development of subnational credit markets would also benefit from self-regulation and a “buyer beware” approach. Many U.S. regulations were devel-oped by the market players themselves or through market practice. For example, the Government Finance Officers Association developed many municipal bond disclosure rules and practices that were adopted in the industry. The U.S. market has also benefited from 200 years of operation, during which

418 U r b a n C h i n a
investors learned the hard way about the consequences of defaults, especially in the absence of guarantees that higher levels of government will bail out defaulting subsid-iaries. While allowing subnationals to default may have adverse impacts on bank assets and on investors’ appetite, these considerations must be balanced against the negative con-sequences of moral hazard and bailouts on market development.
The regulatory and institutional frame-works for commercial and policy banks and bond markets need to be harmonized to create a level playing field and avoid regula-tion arbitrage. The credit rating requirement for bond issuance is a particular concern.
Because institutional investors provide their financing through the bond market, the risk rating of their investment portfolios is deter-mined by the ratings of the bonds they buy and is easily overseen by regulators. If bank loans are not subjected to rating, some banks will continue to make risky loans that under-cut the entry of more prudent lenders into the market. The borrowers may also opt for easy money that can be gotten through shadow banking, for example.
China might consider imposing a manda-tory requirement for local government bor-rowers to have an institutional credit rating irrespective of the instrument used (bank loan, bond, or wealth management product).
Securities laws · The Securities Act of 1933 established a regula-
tory scheme for offerings of corporate securities but exempted offerings of municipal securities. It also included the first antifraud provision, which applies to both corporate and municipal securities.a
· The Securities Exchange Act of 1934 established the Securities and Exchange Commission (SEC) to enforce civil antifraud laws and regulate bro-kers, dealers, and certain other market organiza-tions and professionals. Like the Securities Act of 1933, its antifraud provisions apply to all securities, including municipal securities.
· There are also criminal securities fraud laws, enforced by the U.S. Department of Justice, private securities litigation, and enforcement actions under state securities laws.
Basic principles· Disclosure. Organizations that publicly offer secu-
rities must tell investors the whole truth about their businesses, financial condition, the securities they are selling, and the risks involved in investing. Investors make their own investment decisions.
box 6.6 U.S. securities laws applicable to municipal securities
· Honest markets. People and firms who sell and trade securities—brokers, dealers, and exchanges—must treat investors fairly and honestly, putting investors’ interests first.
Regulation of municipal securities trading· Brokers and dealers who participate in transactions
of municipal securities are required to follow the rules of both the SEC and the Municipal Securities Rulemaking Board (MSRB).
· The MSRB, which was established in 1975, issues regulations for brokers and dealers who engage in municipal securities transactions.
· MSRB rules cover many areas including cus-tomer protection, record keeping, clearance and settlement, trade reporting, broker-dealer conduct (including political contributions by broker-dealers and employees who deal with municipal securities), and the submission of information to an electronic system known as EMMA (Electronic Municipal Market Access system), which makes it immedi-ately available to the public on the MSRB’s website (http://www.emma.msrb.org).
· Disclosed information includes annual audited financial statements from issuers.
· The law emphasizes transparency.
Source: Haines 2009; Canuto and Liu 2013.a. Municipal securities in the United States include securities issued by states, local governments, and their agencies and instrumentalities, including municipalities, districts (such as school districts), special purpose government entities (such as housing authorities), and a variety of other government entities (such as airport authorities). Municipal securities include all debt instruments issued by states and local governments, including bonds, notes, financing leases, and variable rate obligations.

f i n a n C i n g U r b a n i z a t i o n 419
That would have many merits in addition to helping level the playing field. Not only would credit ratings encourage local govern-ments and LGFVs to improve their financial management, but they are an excellent way for borrowers to learn about their own finan-cial strengths and weaknesses before seek-ing financing for their urban infrastructure project. In addition, ratings can help them determine whether to pursue a bank loan, a syndicated loan, or a bond issue. Local gov-ernments and LGFVs with strong credit rat-ings may be in a good position to seek the best terms on loans from competing banks or syndicates. Governments and LGFVs with weaker credit ratings will find that well-struc-tured HBs can achieve much higher credit ratings than their institutional rating and thereby enable them to access financing at lower cost on better terms than would be the case using bank loans. By helping borrowers to better target their lenders and by getting lenders to compete, institutional credit rat-ings can help reduce the cost of intermedia-tion and thereby the cost of financing urban infrastructure.
Mandatory ratings also improve the finan-cial intermediation process. The most effi-cient way for lenders (whether commercial banks or institutional investors) to get objec-tive information about borrowers’ credit risk is to review their credit rating report. That is as true for lending by policy banks and commercial banks as it is for investors in municipal bonds. Ratings are not intended to substitute for financial due diligence, but they provide an efficient way for lenders and investors to determine if potential borrowers warrant additional credit analysis or should be passed over until they are more highly rated. By sorting out the potential borrowers quickly, credit ratings improve the efficiency of the intermediation process and make credit analysis more focused.
Mandatory ratings also make it easier for the regulators of banks and institutional investors to assess the risk profile of banks’ loan portfolios and institutional investors’ securities portfolios. In particular, more transparency about the risk of loans to spe-cific local governments and LGFVs improves the calculation of a bank’s capital adequacy,
and banks will become more sensitive to local government and LGFV credit risk in their lending operations.
Bank lending to local governments should be regulated in a way that reinforces local governments’ budget discipline and fiscal transparency. Commercial bank lending is normally bound by general prudential rules, which, if applied to local governments, would restrict the governments’ opportunity to bor-row from such vehicles. Such rules include exposure limits, which limit a bank’s loan exposure to a single client; concentration lim-its, which limit a bank’s exposure to a certain type of client such as all local governments taken together; and insider lending limits, which limit lending to the owners or co-own-ers of the bank. China might review whether these rules are effectively enforced. In addi-tion to these norms, many countries have innovated other measures to reinforce disci-pline. For instance, after experiencing wide-spread subnational defaults, several coun-tries, including Brazil, banned subnational ownership of financial institutions altogether. In Mexico, competitive lender selection and transaction ratings were required for large-scale long-term financing. Although these requirements are not mandatory, banks lending to unrated subnational governments would need to have a high capital adequacy ratio.
Shadow banking would need to be regu-larized to limit easy money for local govern-ments. All asset management products should be subject to the same fundamental regula-tory standards. Regulatory policy for all col-lective investment products should be coor-dinated among authorized bank, insurance, and security regulators. A plan for reform-ing the legal and regulatory framework of shadow banking should include short-term amendments of regulations and long-term amendments of primary legislation. Invest-ments in wealth management products, trust funds, or other collective investment schemes should not be protected by implicit guarantees.
The role of policy banks in the provision of long-term finance should be reoriented. The policy banks should be reformed to address market failures for long-term mar-
420 U r b a n C h i n a
ket based financing through various instru-ments such as co-investment, guarantees, and credit enhancements. Policy banks could reduce their excessive dependence on govern-ment guaranteed bonds and leverage their resources by exploring new ways to finance their new operations on a sustainable basis, such as well constructed securitizations of their loan portfolios, loan syndications, and cofinancing schemes with other state-owned and private financial institutions. In addi-tion, policy banks could play a catalytic role in supporting the use of long-term capital markets instruments. The bank could issue innovative financial instruments that would support the growth of fixed-income markets; provide bond guarantees (on a fee basis as a credit enhancement) for municipal bonds; and purchase a limited portion of new munic-ipal bond issues, serving as a market-maker by buying or selling bonds as needed by other investors. Promoting market competition and preventing moral hazard in government lend-ing is important. The performance of policy banks should be evaluated regularly on these two grounds.
Clarify the role of housing provident funds
The steps China’s government is taking in the housing area require great care. International experience shows that a key to the provision of affordable housing is an overall well-func-tioning housing system, one that is efficient and responsive to the needs of all segments of the population, including the poor who are able to access housing at reasonable prices. Housing needs to be understood as an interlocking ecosystem where consumers of different income segments, the construc-tion industry, financiers, and local and cen-tral government bodies interact dynamically. Governments that have successfully made housing affordable are those that have played an enabling role, intervening to overcome market failures while also ensuring that their actions do not distort housing markets. Their actions have systematically and simultane-ously addressed the causes of market failures by, first, focusing on demand and supply side constraints and, second, putting in place poli-
cies that improve management of the hous-ing sector as a whole. Governments can use various policies that enable them to carefully balance and coordinate the fluid interaction of those within the ecosystem and thereby support housing affordability. Without such an integrated intervention, a patchwork of “affordable housing” programs will only be dealing with the symptoms of the housing problem rather than its causes.
China’s housing policies should encour-age transparency and the targeting of its subsidies to match its policy goals. The coun-try has achieved great success in meeting its low-income housing construction targets, yet great vulnerabilities remain in how the poli-cies are being implemented. These include financial risks to the municipalities and the housing provident funds, challenges in hous-ing workers migrating to urban areas, social segregation, and risks to the economy overall.
Local governments should carry out a careful analysis of housing demand (demo-graphic and socioeconomic conditions) and supply (types of housing available for differ-ent income groups, at what cost), and then use the findings to determine the housing needs of the locality. This approach will enable local governments to define the nature, scope, and policy interventions required to effectively align housing demand and supply. A “National Housing Observatory” could be established to collect systematic information on housing supply and on demographic and socioeconomic conditions and thus capture trends in housing affordability and finance. Such an institute would facilitate monitoring of the sector’s performance by policy makers. A good example of an institute that indepen-dently collects and analyzes such informa-tion is the Canadian Housing and Mortgage Corporation.
China would benefit from giving munici-palities more flexibility in achieving their low-income housing construction goals. Rather than mandating a specific number of a particular type of units, broad goals could be set for each municipality, which could then be required to develop a specific plan on how to achieve these targets. The overall plan would include a market study, a market plan, a financial plan, an analysis of job growth

f i n a n C i n g U r b a n i z a t i o n 421
and infrastructure needs, and a long-term management plan including contingencies.
The role of housing provident funds should be clarified in the context of a broader clarification of government’s role in hous-ing. These long-term savings funds are established for the purpose of housing the employees who contribute to them, and the cumulative funds in the accounts belong to the employees. Great care must be taken not to conflate the purpose of HPFs with that of serving national or local housing goals such as affordable housing. Moreover, providing mortgage loans and project loans in the same institution without clear lines of delineation is a potential conflict of interest. Using HPFs to pay for operational costs of public rental housing projects should be prohibited unless it is clearly specified in the loan agreement.
Actuarial analyses with stress tests of the HPFs should be performed. Given the high housing prices, the large-scale, long-term HPF investments in projects, and mortgage finance for members, the funds are poten-tially in a financially precarious position. Understanding the risks under different sce-narios would enable them to adjust their poli-cies. It would also enable the Government of China to adjust its own policies if it sees negative trends in the HPFs.
The Regulatory and Supervisory Frame-work for mortgage lenders and housing finan-ciers should be strengthened, particularly with respect to housing provident funds. The Ministry of Housing and Urban and Rural Development should establish standards of lending and operational procedures closely in line with China Banking Regulatory Com-mission’s model and best international prac-tices. The risk analysis recommended for the HPF portfolios would provide important information for improving regulations.
China should explore means other than HPFs for financing an affordable housing program, such as direct subsidies from the government budget, mobilization of assis-tance from employers to their employees, and partnership with the private sector. Addi-tional subsidies will be necessary to ensure sustainability, particularly for low-income renters. Since the central government provides little funding for subsidies, the municipali-
ties will need to generate their own revenue sources. One option is property taxes. That could certainly generate revenue, but Chinese municipalities might consider tax abatements for properties that have received public subsi-dies, especially low-income rental properties. Rental income from low-rent housing is cur-rently exempted from business tax, real estate tax, and from the urban land tax. Higher rates could be applied to vacant properties, those properties that have been under con-struction or unfinished for a predetermined period of time (two to three years) and for other properties owned by the same family.
Demand-side subsidies can be an effec-tive tool both in providing housing and in increasing the housing supply. Developed countries almost universally have moved away from the model where the government finances, builds, manages, and maintains public housing. Rather, the trend has been toward demand-side subsidies, such as down-payment assistance for homeownership and vouchers or conditional cash assistance for rental housing. This type of aid gives the consumer a greater role in the selection of his housing unit. Moreover, the supply of money going to consumers has been shown to increase the supply of affordable housing. Examples of subsidies to households include capital grants towards home purchase (such as assistance for a down payment) or rental vouchers. Successful examples include a rental assistance program to low-income households under the Section 8 Program in the United States enacted in 1974, which pro-vides housing vouchers or direct payments to private landlords. Under the program, ten-ants choose where to live and pay about 30 percent of their gross income for rent, with the remainder of the market rate rent subsi-dized by the program.
Unleashing the constraint of land supply for housing could improve the supply of low-income housing. Land sales should be con-ducted through a competitive bidding pro-cess without regard to its use for industrial, commercial or residential purposes. The gov-ernment could allow for rural collective con-struction land to enter urban land markets, improve the inventory of public land, identify underused parcels that could be put toward

422 U r b a n C h i n a
affordable housing development, and autho-rize collectives in urban villages to redevelop their land for housing and allow them to invest in formal rental housing. These steps could help increase the supply of affordable rental units and improve housing conditions for migrants and low-income households while also offering collectives new and signif-icant income sources. Bangkok offers a good example of formalizing informal settlements by allowing communities to upgrade their housing in situ and gaining security of tenure with the support of Community Organiza-tions Development Institute.
Employers could play a role in support-ing affordable owned and rented hous-ing for their employees. Because they ben-efit from workers and professionals coming into urban areas, this can take a number of forms: matching funds for down payments for owned housing that employees can access after a predetermined period of employment or assistance with mortgage payments for an initial period. For rentals, a company could agree to rent a block of apartments from a public entity at market rates and then provide a discounted rent to its employees. It could also provide monthly support for rental hous-ing that declines over time.
Promote public-private partnerships
A public-private partnership, at its core, is a contractual agreement between a public agency and a private sector entity result-ing in greater private sector participation in the financing and delivery of infrastructure projects. Using PPPs as a form of delivery of public goods represents a step away from the traditional procurement of infrastructure toward a more sophisticated engagement with the private sector, with the expectation of capturing value for money through efficiency gains and lowering of the life-cycle costs of projects. China should consider developing uniform and credible standards, regulations, and a legal framework to encourage public-private partnerships to engage in urban devel-opment, including the construction of urban infrastructure, the delivery of urban services, and the construction and sale or rental of affordable housing.
The potential advantages of moving to PPP arrangements and attracting private invest-ment for cities in China would be substantial. First, PPPs could improve the operational performance of the infrastructure facilities by tapping into the technical expertise in the pri-vate sector. The efficiency gains, with a well-designed PPP contract and full competition, could be captured by the government, thus reducing the fiscal burden of cities, and the need to borrow more or increase taxes.22 The freed-up fiscal space could then be used for social services. Second, because the private sector would be paid largely from the reve-nues generated from users of the facility, the infrastructure capacity would be designed to fit the projected demand, rather than the cur-rent practice of building infrastructure assets beyond the projected demand requirements. PPPs would thus optimize the scale of infra-structure assets being developed. Having the right scale of infrastructure would contribute to the sustainability of the cities by reduc-ing resource use requirements. Finally, PPPs could facilitate the transformation of the role of government. In the 1980s, in an attempt to reduce public spending and reduce inef-ficiencies, countries led by the United King-dom (under Margaret Thatcher) and the United States (under Ronald Reagan) pushed on reform of public enterprises and greater private participation in all economic sectors. The infrastructure industry gradually started to change, marked by a shift from public to private financing and provision of infrastruc-ture and the introduction of the principles of competition and commercialization. The role of the public sector changed from direct and active actor in the provision of public goods and services to one of regulator, facilitator, and user of such goods and services. By the 1990s, PPPs, as currently defined, were intro-duced and provided with models of private sector involvement more attuned to public services provision.
For the duration of the contract, the con-cessionaire (or private partner) typically will build (or rehabilitate), manage, maintain, operate, and control the assets in exchange for some combination of user fees and gov-ernment transfer or payment, which is its compensation for the investment and other

f i n a n C i n g U r b a n i z a t i o n 423
costs. The corresponding government com-mits to make in-kind or financial contribu-tions to the project, whether through subsi-dies, guarantees, shadow fees, or availability payments. Therefore, to capture value for money through efficiency gains, the Chi-nese government needs to consider carefully the following issues. First, attracting private investment may require higher user charges to make the investment profitable for private investors. If government is not prepared to accept cost recovery tariffs for the service, it would have to provide for subsidies from the budget. Second, PPPs can create direct or con-tingent liabilities on the government, which should be carefully managed. If the private operator fails, the government will likely have to take on its obligations to prevent the service from collapsing. Third, providing public services through PPPs adds a layer of complexity in operations and requires con-siderably more detailed legal agreements and more complex bidding processes than those needed for government-built and operated facilities. All of these issues can be managed, and there is ample international experience in all of these, but government should be aware
of these issues as it further develops its PPP framework (box 6.7).
A PPP framework should be tailored to existing laws but may also require changes to laws or policies that are not compatible with PPPs. At the national level, a single PPP law should guide approval processes across sec-tors and regions.23 That can both simplify the project approval system and facilitate prudent decision making at the local level. Local governments need to make policies to create the incentive for participation from the private sector, and establish a regulatory system for guiding regulating PPPs. Of great importance in a PPP framework is its provi-sion for resolution of contractual disputes. To attract private investors, PPP contracts may need to include contract-specific dispute resolution mechanisms that may be based on national or international arbitration and other administrative processes before moving the dispute into the courts. Other legal safe-guards also need to be present in the form of effective application of the rule of law and effective regulatory oversight.
Local governments need to introduce a competitive mechanism along with innova-
Australia is a model example of public-private part-nership (PPP) development from the creation of upstream policy frameworks through downstream implementation. Several reviews of the existing Aus-tralian PPP portfolio express confidence in this model of public service delivery and are optimistic on the performance of PPP projects in comparison with tra-ditional procurement. Furthermore, project outcomes from PPP projects in Australia, as measured by cost savings and delivery performance, outstrip their pub-lic sector comparators.
Australia has entered into the third decade of PPP contracts and has developed a set of unique skills and strong policy frameworks to meet the challenges of implementing an effective and output-based PPP program. In 2008, the Infrastructure Australia Act came into effect with a new integrated approach to planning, funding, and implementing public infra-structure projects. Some contributing factors to
box 6.7 australia: a leading model in implementing public-private partnerships
the success of Australia’s PPP program include the following:
• A PPP policy framework underpins the principles of when to use PPP and how to assess projects and appropriate implementation processes.
• The PPP policy guidelines set out the guiding princi-ples within which the public sector should operate.
• The PPP Unit in Victoria plays a critical role in regulating the PPP process by providing guidance to the government, as well as providing governance structure in its early days when new PPPs take shape.
• The auditor general’s review of the procurement process of the PPP contracts led to subsequent improvements in PPP procurement practices, such as the bid submission process, competitiveness dur-ing the bidding period, and optimization of risk allocations.

424 U r b a n C h i n a
tive modes of operation to promote openness, transparency, and efficiency for PPPs. To open up competition, public agencies should be restructured with transparent financial reporting on their costs, subsidies received from the budget, and the quantity and qual-ity of delivered services. Open bidding should be set as a norm to create more opportunities for the entry of private players.
To fully capture the benefits of these partnerships, China might shift the focus of PPP contracts from capital financing toward service provision. Service focus could be achieved by bundling investment for asset creation with operation and maintenance requirements over a long period of time (such as 20 years). PPPs for most types of urban infrastructure and service and affordable housing delivery will depend on local govern-ment payments over the lifetime of the PPP contract. In these cases, local governments should be allowed to make multiyear finan-cial commitments. Future financial contribu-tions to PPPs need to be kept to a fiscally sus-tainable level, and the best way to do that is to ensure they are kept within the expected, future level of recurrent revenue. These observations reinforce the case for fiscal reform. If, for example, the system of fiscal decentralization provided local governments with a stronger revenue base than they cur-rently have, they would be in a better posi-tion to engage private partners through PPPs.
Expanding PPPs in the future will inevita-bly increase governments’ contingent liabili-ties, and a careful risk assessment and proper risk-sharing system is needed. PPP contract arrangements need to clarify the risk-sharing arrangements. Governments should bear only those risks that they can best manage, which generally are those that they can con-trol or at least influence. The rules govern-ing PPPs should ensure that the officials and ministers in charge have incentives, informa-tion, and the capability to take account of the costs and risks of contingent liabilities. More specifically, PPPs should be approved by the cabinet, the Ministry of Finance, or some other body with an interest in future spending. The Ministry of Finance or the finance departments of local governments, or both, should review proposed PPPs. Cost-
benefit analysis should be used to select proj-ects, and value-for-money analysis should be used to choose between PPPs and traditional public procurement. The costs and risks of contingent liabilities should be quantified, and budgetary systems should be modified to capture the costs of contingent liabilities. A guarantee fund should be used to encourage recognition of the cost of guarantees when they are given or to help with payments when guarantees are called. Governments should charge fees for guarantees. PPP contracts should be published, along with other infor-mation on the costs and risks of the finan-cial obligations they impose on the govern-ment. Modern accrual accounting standards should be adopted for financial reporting, to reduce the temptation to use PPPs to disguise fiscal obligations (World Bank Institute and PPIAF 2012).
China could improve the institutional capacity of governments to lead and promote PPP at the local level by creating a special PPP unit. Experience from more than 20 developed and developing countries shows that such a unit is more likely to have the nec-essary expertise to oversee projects with stan-dardized processes and achieve scale econo-mies in management, ultimately maximizing public benefits. For China, such special PPP units might be established at the provincial level, given the scale and regional variation of development. Potential conflicts among their promotional, advisory, and evaluation roles could be avoided by having the fiscal risk assessment carried out by an impartial entity; as noted, the finance departments might be given the task of deciding whether to use public procurement or PPPs on a comprehen-sive value-for-money assessment.
improve financial management and governance
These reforms in urban finance—public finance, land finance, debt finance, and partnerships with the private sector—will empower city governments with more con-trol over taxing, revenues, and borrowing, and more autonomy in locating resources to finance expenditures on local needs. City governments would then have a better chance

f i n a n C i n g U r b a n i z a t i o n 425
of capturing the opportunities and manag-ing the risks brought about by city develop-ment. At the same time, however, the power of city governments has to be balanced with strong governance to maintain a proper bal-ance between efficiency and equity; only with this balance between authority and account-ability will China’s urbanization be efficient, inclusive, and sustainable.. Top priority should go to building capacities for financial management, by bringing a medium-term perspective to public finance management and by promoting accountability through transparency and a streamlined hierarchy government structure.
Strengthen public finance management through a medium-term perspective
The government’s urbanization plan will have far-reaching fiscal implications across numer-ous sectors regarding revenue, expenditure, and debt over the medium term. Many fiscal policies undertaken today may have broad intertemporal effects. Examples include the effects of current public investment on future operation and maintenance spending, the impact of current land development spending on future land leasing revenue, and the effects of current spending on education and health on future productivity. Similarly, a medium- and long-term horizon is required to assess the financial sustainability of current debt policies and the effect on liquidity risks of the financing terms applicable to LGFV liabili-ties. Formulating and implementing such a plan in a fiscally sound manner would be dif-ficult without using a medium-term budget perspective. Moreover, government antici-pates a slowing of growth even as it works to address the significant imbalances between the needs of local governments and their fis-cal capacity, while maintaining a healthy debt-to-GDP ratio; that combination makes the need for medium-term fiscal planning all the more important.
Conceptually, medium-term expenditure frameworks (MTEFs) promise numerous benefits: strengthening the links between planning and budgeting, including by sharp-ening the strategic allocation of resources over the medium term; strengthening the abil-
ity of fiscal policy to address structural chal-lenges, such as demographic change and busi-ness cycles; strengthening the efficiency and effectiveness of spending, including through programming multiyear projects and their recurrent cost implications; and providing greater reliability to subnational governments dependent on transfers from the central gov-ernment. Among these, a core advantage of MTEFs is the bringing together of planning and budgeting, which is especially important in countries with five-year plans but annual budgets. A recent, comprehensive analysis by the World Bank shows that MTEFs are indeed associated with many of the hypoth-esized benefits (World Bank 2013a).
The term medium-term expenditure framework covers a range of approaches, from more basic ones to more sophisticated ones. The first stage can be considered a medium-term fiscal framework, which is essentially the determination of the total amount of resources available (macroeco-nomic-fiscal framework) during the medium term and their allocation across broad spend-ing categories (sectors or agencies). The fiscal framework is thus based on a “top-down” approach. The second stage, the medium-term budget framework, incorporates mul-tiyear budget requests prepared by spend-ing agencies, which must be reconciled with the sectoral ceilings and the overall resource envelope. The budget framework thus brings in the “bottom-up” dimension. The third and most sophisticated stage is the medium-term performance framework, which moves the budget’s focus from inputs to outputs and outcomes, thus encouraging the alloca-tion of funds based on results. By 2008, 132 countries had adopted MTEFs. To be sure, MTEFs are not panaceas, and their success depends on initial conditions including the institutional context, appropriate design, and sound implementation. The key challenge for China is the robustness of annual budgeting, including budget credibility, measured by the divergence between budget documents and actual spending; and approval of the bud-get after the start of the fiscal year; budget comprehensiveness that is, whether there are extrabudgetary funds and the use of multiple budgets (such as a public finance budget, a

426 U r b a n C h i n a
state funds budget, and so on); complexity, or the number of budgetary entities; and budget reporting, in terms of analyzing the on-going execution of the budget and the impact of spending in light of the five-year plans and their targets (Deng and Peng 2011).
A medium-term expenditure framework with Chinese characteristics is likely to pro-vide benefits that a limited and simple annual budgeting approach cannot offer. To success-fully adopt a medium-term budget perspec-tive, China might consider three steps:
Harmonizing the MTEF with on-going and planned public financial management (PFM) reforms. With the aim of making the annual budget sufficiently robust to enable construction of a multiannual budget pro-cess, China might consider using the MTEF reform to drive the next phase of overall PFM reform. That is, to implement an MTEF, some existing challenges in PFM would need to be addressed simultaneously. Using the MTEF as the driver, or key reform con-cept, would enable the Ministry of Finance to identify and sequence the priorities for reform over time, ensuring design of a com-prehensive and prioritized reform plan.
Identifying challenges that the MTEF should focus on addressing. The specific challenges that China might want to address in intro-ducing an MTEF will play an important role in how it is designed. For example, if China wants to shift from a “bottom-up” orienta-tion to a more “top-down” budget alloca-tion process, the MTEF can play a key role by focusing on sound aggregate and depart-mental expenditure ceilings and limiting policy decisions outside of the annual bud-get process. Or if China wishes to focus on more robust efficiency and effectiveness in spending, the MTEF would play a key role in bringing together the recurrent and capi-tal budgets. It would be important for the government to articulate a rationale for the MTEF to help motivate and design it.
Appropriately designing an MTEF that could fit China’s existing public financial management system. Implementing a full medium-term budget outlook would, of
course, take a number of years and would need to be phased in. But immediate steps could be taken to gradually develop a multi-annual perspective in budgeting. Toward that end, careful consideration should be given to the immediate steps needed to strengthen key supporting fiscal capabilities and pilot build-ing blocks of a medium-term budget outlook.
Given the existing challenges in China, it would seem to make the most sense to start with the fiscal framework. In doing so, attention should be given to building several core capacities: macroeconomic forecasting; revenue forecasting; the capacity for using a medium-term fiscal framework model; the development of multiyear ceilings; and the piloting an improved methodology for pro-gram costing.
In addition, a number of design, institu-tional, and technical issues would need to be considered: coverage (categories and levels of government spending, such as recurrent and capital spending, to be included); level of detail (disaggregation of spending by economic type and agency); time period covered and fre-quency of updating; dealing with uncertainty (setting up a contingency reserve fund, for example); and institutional roles and respon-sibilities for implementation. Additional ana-lytical and technical inputs might be needed to prepare an adequate design proposal and an MTEF implementation roadmap. It might also be useful to develop a pilot MTEF model at a subnational government level (where there is limited reliance on transfers, for example) and also pilot a medium-term budget frame-work in selected sectoral budget agencies.
Enhance transparency
China experienced relatively rapid expan-sion in public service provision coupled with deepening decentralization to provincial and subprovincial governments over the past 10 years. With continued but slower growth expected in the coming years, along with an aging population and rapid urbanization, the demand for equal access to better public ser-vices will continue to increase. These develop-ments are likely to place a strain on services and outcomes for citizens. Transparent per-formance management will track results dur-

f i n a n C i n g U r b a n i z a t i o n 427
ing this time of transition and establish a basis for government and citizen engagement to increase access to and the quality of services.
Transparency is increasingly at the heart of accountable, representative, and well-per-forming government. As Premier Li Keqiang recently said, “It is imperative to build an innovative and clean government under the rule of law. Clean governance is the corner-stone for the credibility of a government, and is expected by the people. Open and trans-parent use of power is the key to building a clean government.”24 Indeed, international literature provides robust evidence that openness and transparency assist in strength-ening accountability and building citizen trust and engagement. Transparency could bring numerous benefits to the country: transparency is often associated with better socioeconomic and human development indi-cators, higher competitiveness, and reduced corruption. More transparent countries tend to have better credit ratings, better fiscal discipline, and less corruption. In addition, reforms that enhance openness and account-ability can lead to increased responsiveness from service providers and less corruption and can empower the poor (Kaufmann and Bellver 2005; Hameed 2005). Moreover, greater transparency in procurement (through public access to information on government contracts, and fair opportunities for contractors and suppliers) can also have a significant impact on the efficiency of public expenditure and the attainment of value for money.
China has taken steps toward greater transparency in public spending in recent years. The new leadership has promised to make more rapid progress in this regard, and some specific types of expenditure, over which the public had voiced concerns, have been addressed recently. However, the level of fiscal transparency is still low compared to member countries of the Organization for Economic Co-operation and Development (OECD) and the Group of 20 (G-20)—and may be declining. China still has one of the least transparent fiscal and budget processes in the world (figure 6.8).
The most recent estimates show that China’s fiscal transparency score has been
FigUre 6.8 budget transparency trends in the oeCD and China, 2008–12
Source: Open Budget Survey: China 2012.Note: OECD = Organisation for Economic Co-operation and Development.
72.0
71.5
71.0
70.5
70.0
69.5
69.02010 2012
Ope
n Bu
dget
Inde
x
15
10
5
0
Ope
n Bu
dget
Inde
x
2008 2010 2012
c. Fiscal transparency: China compared with the G20
b. Fiscal transparency in China, 2008–12
a. OECD transparency trends
South Africa
0 20 40 60Open Budget Index
80 100
United KingdomFrance
United StatesRussian Federation
BrazilGermany
IndiaKorea, Rep.
IndonesiaMexico
ItalyTurkey
ArgentinaChina
Saudi Arabia

428 U r b a n C h i n a
declining over the past five years. China does relatively well on publishing in-year, year-end budget and audit reports; however, after more than a decade of budget reform and increas-ing transparency at the central level, a large gap remains at the subnational level, espe-cially given the size of extrabudgetary funds. These areas are in need of reform. Relatively easy gains could be made by also publishing the executive’s budget proposal as well as the enacted budget, both of which are currently produced but used for internal purposes only. The in-year and end-year budget reports could also be strengthened by increasing the comprehensiveness of information provided, including explanatory notes on the differences between the budget and actual spending and greater disclosure of assets and liabilities.
The level of fiscal transparency varies across jurisdictions, and on average China lags behind most others in government transparency. Information about actual expenditures, off-budget transactions, and actual government performance, is patchy and limited in most jurisdictions. Some pockets of innovation are emerging in some jurisdictions, such as the district of Minhang in Shanghai, which is piloting performance-linked budgeting and is pursuing transpar-ency through the Internet (box 6.8).
Lack of transparency is particularly costly for China. On the one hand, it limits the
central government’s capacity for monitor-ing budget implementation and results at the subprovincial level. Hence, the accountabil-ity chain from central government to citizens is weakened when local governments are unable to provide timely information about the coverage and quality of services delivered. On the other hand, the quality of adminis-trative data provided by local governments to higher levels is also limited. In some cases, subnational governments find it difficult to generate sufficiently high-quality perfor-mance data to meet the needs of the national government; in other cases subnational gov-ernments have been known to manipulate data to attain certain ends, such as qualify-ing for more transfers. This problem has led the national government to provide more and more transfers in the form of narrowly ear-marked programs that require compliance with national government objectives but that limit discretion of subnational governments to adjust programs and allocate resources to meet local needs. This negative cycle of decreasing trust, increasing control, and increasing strategic local government behav-ior may be contributing to reduced spend-ing efficiency and greater administrative and transaction costs.
Making more of the subnational gov-ernment data public and opening it to the scrutiny of citizens would increase the cred-ibility of the data and make it more useful. Indeed, the central government could enlist the help of citizens in holding local govern-ments more accountable. At its foundation, this step would represent a change in political and bureaucratic culture, moving away from practices of confidentiality toward more open communication, not only with the public but within governments themselves in the dis-charge of their duties.
A modern approach to government trans-parency is fast becoming the norm as gov-ernments establish initiatives and agencies charged with making information available to management and to the public. China could draw from international good practices.
Collecting and publishing fiscal, assets, and liabilities information. Transparency includes having an independent audit of
Minhang is piloting a performance-oriented budget reform that covers key social spending programs, for which objectives and performance indicators and tar-gets are incorporated into the annual budget docu-mentation and submitted to the district people’s con-gress for review. Evaluations of these programs, some by third parties, are also undertaken, provided to the people’s congress, and posted on the web. Reviewing and strengthening the pilot, and then rolling it out to other subnational governments, could help improve transparency.
box 6.8 Performance-informed budgeting in the Minhang district, Shanghai
Source: http://www.shmh.gov.cn/.

f i n a n C i n g U r b a n i z a t i o n 429
national and subnational financial accounts, making periodic public disclosures of key fiscal data, exposing hidden liabilities, and moving off-budget liabilities on bud-get. China will need a comprehensive bud-get reporting that covers four government budgets and other public activities carried out by public utilities or SPVs but mainly funded by governments. The classification of budgetary expenditures should distinguish between recurrent and capital expenditures. The debt reporting should cover government direct borrowing, guarantees, and contingent liabilities. The financing of deficits of large public sector undertakings, which implicitly are government liabilities, should be reported as an annex to the main financial statement. Changing the accounting method from cash-based to accrual accounting for all level of the governments could eliminate an important source of hidden liabilities: arrears.
Linking with performance information. China could compile and publish a citizens’ budget. These have been increasingly used as a way to make information about fiscal and service delivery outcomes accessible to the public. A citizens’ budget for China, which would present basic revenue, expenditure, and fiscal data in an accessible format, could be a useful way to communicate about these issues directly with the public.
Transparency—the public availability of fiscal and performance information—is needed to make performance budgeting work. It can help increase public trust in government as part of an open budgeting and performance management framework. Performance budgeting focuses on the results that are being delivered for the resources pro-vided, rather than just on how much money is being spent or transferred to subnational governments. It is an approach that is increas-ingly being adopted around the world. Over two-thirds of OECD countries now include non-financial performance information in their budget documents.
To a large extent, China is already per-formance driven. The national performance framework is transitioning from being output focused and is increasingly linked to forward-looking policy targets. China’s 12th Five-Year
Plan sets out clear performance targets that cut across the priority areas of government. Similarly, regional and special plans set out targets for key initiatives, while provincial plans set out policies and targets at the sub-national level. The Ministry of Finance is in a unique position to lead a government wide initiative to link fiscal and performance trans-parency. Performance-linked budgeting can be a useful approach for pursuing this goal.
Publishing performance data in national and subnational budgets is an initiative that would anchor China’s performance-driven plans in open government, and that would encourage greater focus, efficiency, and effec-tiveness in expenditure. To achieve these goals, the main task is to systematically dis-till and publish a salient set of performance benchmarks tied to budgets and outcomes as experienced by local citizens across the whole of government.
To be effective, performance information needs to be meaningful to both service pro-viders and citizens. This balance is often a challenging one to strike, because it is based on an iterative and coordinated process between levels of government and service providers. Often, government information is too broad or vague in meaning to have any substantial public impact. Indeed, there are calls for subnational governments to release more meaningful data to citizens.
Two examples for providing performance information to the public come from the United Kingdom and Canada. The United Kingdom’s official open data portal (http://data.gov.uk) is the home of its transparency efforts. The website contains a substantial and growing amount of information, includ-ing central and local government spending data, government contracts, and titles and pay rates for senior civil servants. This initia-tive has been transformative and has quickly helped the government demonstrate its com-mitment to transparency and open data.
The Canadian province of British Colum-bia launched an open data portal (http://data.gov.bc.ca) offering access to more than 2,500 local government datasets to the pub-lic. The initiative showed that a high demand for financial data, and remarkably, there was also demand from civil servants themselves
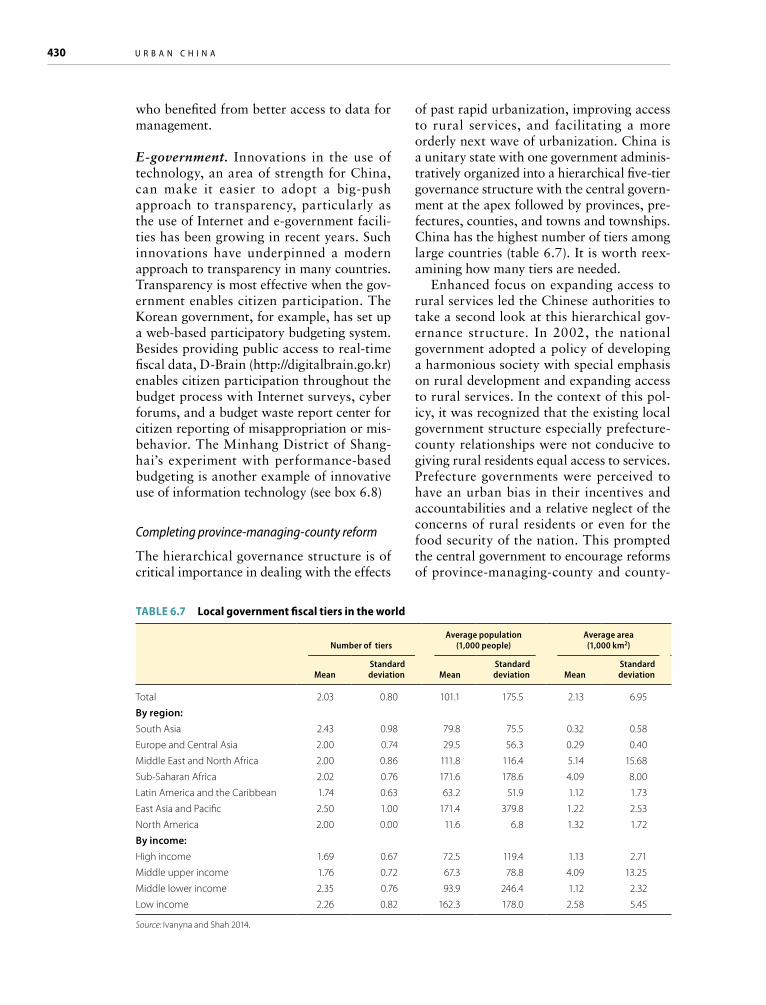
430 U r b a n C h i n a
who benefited from better access to data for management.
E-government. Innovations in the use of technology, an area of strength for China, can make it easier to adopt a big-push approach to transparency, particularly as the use of Internet and e-government facili-ties has been growing in recent years. Such innovations have underpinned a modern approach to transparency in many countries. Transparency is most effective when the gov-ernment enables citizen participation. The Korean government, for example, has set up a web-based participatory budgeting system. Besides providing public access to real-time fiscal data, D-Brain (http://digitalbrain.go.kr) enables citizen participation throughout the budget process with Internet surveys, cyber forums, and a budget waste report center for citizen reporting of misappropriation or mis-behavior. The Minhang District of Shang-hai’s experiment with performance-based budgeting is another example of innovative use of information technology (see box 6.8)
Completing province-managing-county reform
The hierarchical governance structure is of critical importance in dealing with the effects
of past rapid urbanization, improving access to rural services, and facilitating a more orderly next wave of urbanization. China is a unitary state with one government adminis-tratively organized into a hierarchical five-tier governance structure with the central govern-ment at the apex followed by provinces, pre-fectures, counties, and towns and townships. China has the highest number of tiers among large countries (table 6.7). It is worth reex-amining how many tiers are needed.
Enhanced focus on expanding access to rural services led the Chinese authorities to take a second look at this hierarchical gov-ernance structure. In 2002, the national government adopted a policy of developing a harmonious society with special emphasis on rural development and expanding access to rural services. In the context of this pol-icy, it was recognized that the existing local government structure especially prefecture-county relationships were not conducive to giving rural residents equal access to services. Prefecture governments were perceived to have an urban bias in their incentives and accountabilities and a relative neglect of the concerns of rural residents or even for the food security of the nation. This prompted the central government to encourage reforms of province-managing-county and county-
Table 6.7 local government fiscal tiers in the world
Number of tiersAverage population
(1,000 people)Average area
(1,000 km2)
Mean Standard deviation Mean
Standard deviation Mean
Standard deviation
Total 2.03 0.80 101.1 175.5 2.13 6.95
By region:South Asia 2.43 0.98 79.8 75.5 0.32 0.58
Europe and Central Asia 2.00 0.74 29.5 56.3 0.29 0.40
Middle East and North Africa 2.00 0.86 111.8 116.4 5.14 15.68
Sub-Saharan Africa 2.02 0.76 171.6 178.6 4.09 8.00
Latin America and the Caribbean 1.74 0.63 63.2 51.9 1.12 1.73
East Asia and Pacific 2.50 1.00 171.4 379.8 1.22 2.53
North America 2.00 0.00 11.6 6.8 1.32 1.72
By income:High income 1.69 0.67 72.5 119.4 1.13 2.71
Middle upper income 1.76 0.72 67.3 78.8 4.09 13.25
Middle lower income 2.35 0.76 93.9 246.4 1.12 2.32
Low income 2.26 0.82 162.3 178.0 2.58 5.45
Source: Ivanyna and Shah 2014.
f i n a n C i n g U r b a n i z a t i o n 431
managing-township finances in 2002 on a pilot basis. Subsequently, these reforms were recommended for nationwide adoption jointly by the Communist Party of China (CPC) Central Committee and the State Council in 2009 (Zong Fa, 2009, no. 1) and were highlighted as an important priority in the 12th Five-Year Plan. In 2012, the Minis-try of Finance advised all provinces to imple-ment these reforms with suitable adaptation to local context.
Several provinces including Hubei have now almost a decade of experience with these reforms. The reforms delayered local fiscal governance by allowing direct flow of funds from the province to counties and in the pro-cess bypassing the prefecture governments. A careful review of progress with these reforms suggests that they have had a positive impact (Zhao, Ma, and Li 2013).
The case for abolishing prefecture as an intermediate tier between province and county can be made on conventional consti-tutional and economic grounds. First, aboli-tion in itself could be considered a welcome move because China has four tiers of local governance, twice as many as the average in the rest of the world and the highest number among large countries. Second, China’s Con-stitution does not acknowledge prefecture governments as oversight tiers for county gov-ernments. Third, the greater the number of tiers, the more costly local governance is and the greater the perils of coordination failures. Further there is likely to be greater potential for confusion about division of powers and, as a result, duplication as well as neglect in delivery of public services. A lack of clarity in responsibilities is further likely to manifest itself in a lack of government accountability to local residents.
Although monitoring and oversight by the higher level could be adversely affected with delayering, that is not likely to be of much concern in this information age with instan-taneous communications. The information age diminishes the economic relevance of an intermediate tier in countries with advanced communication and transportation networks and makes larger population sizes in a com-pact area more economical for local service delivery. Agglomeration economies associ-
ated with compactness of the area (popula-tion density) further weakens the relevance of an intermediate tier for service delivery. In addition, the regional functions could be performed by inter local partnerships or agreements and the oversight function of the prefectures could be made the responsibility of the provinces. One also needs to examine local governments, especially intermediate tiers, for jurisdictional design. Any jurisdic-tion not aligned with the economic service area should have its boundaries redrawn.
The province-managing-county reforms moved decision making closer to the people by shifting the power locus from prefectures to counties. The empowerment of counties has led to greater clarity in division of powers and has thereby limited potential for blame shifting for service delivery failures. Local residents now have a much better perspective about who does what and therefore have a greater clarity about who should be held to account. These management reforms have also resulted in greater focus on rural areas and improved access for rural services. Sev-eral factors have contributed to this positive result. First, rural counties were given greater funding consistent with enhanced responsi-bilities. Second, potential for divergence of funds intended for rural areas to urban areas as happened under the prefecture-managing-county regime have been eliminated. Third, land grabs by prefectures of productive agri-cultural land from rural counties have been restrained, which should have a positive impact on food security for the nation.
The reforms also offer potential for a posi-tive impact on investment climate and urban-ization. The location advantages for rural migrants of county-level cities offer great potential for orderly urbanization. Because of their geographic closeness to rural areas, county cities are better placed to absorb rural migrants. These cities have the poten-tial to offer more affordable housing, educa-tion, and health care services, and they also typically have less rigid policies in granting residence permits to rural migrant labor com-pared with metropolitan or prefectural cities. County cities view the influx of rural migrant labor as a positive “demographic dividend” by increasing the size of the productive labor

432 U r b a n C h i n a
force and a larger population to reap econo-mies of scale and scope for city services. The abundant supply of labor and lower wages in turn may improve the competitiveness of counties against prefectural cities in attract-ing potential investors. In addition, the reforms in the long run are also expected to contribute to more orderly development of urban centers, by constraining the expansion of boundaries of prefectural cities.
Moving forward, prefectures as a regional tier providing administrative oversight of counties could be a good candidate for abo-lition. With the abolition of prefecture gov-ernment as a regional tier, regional functions could be performed by interlocal partner-ships or agreements, and the oversight func-tion of the prefectures could be move upward to the province. This will enhance provincial oversight and coordination responsibilities which could be exercised by absorbing redun-dant prefecture technical staff into provincial cadres.
The reform agenda and expected payoffsThe proposal here is for a comprehensive structural reform rather than a piecemeal fix of the system. Because the Chinese approach to urbanization finance makes it difficult to separate public finance reform, land finance, debt finance, and housing finance, it may be reasonable to consider how the various ele-ments of the reform fit together and the joint impact they might have on the economy. The elements of the reform can be introduced gradually and over time, but developing and making clear the long-run plan to modernize the entire urbanization finance system should be done at the outset. One such comprehen-sive reform program, discussed above, con-tains the following elements:
· Shift responsibility for financing social insurance programs, including legacy costs, to the central government level.
· Authorize subnational governments to adopt specified taxes and to set rates within limits. The tax sources to be used are prop-erty taxation, motor vehicle taxes, and the
urban construction and management tax/education surcharge tax.
· Revamp the revenue sharing system to one that features a single sharing rate for the vertical pool, a formula-based system for distributing the transfers, and a simplified earmarked grant system.
· Clarify the role of HPFs in the affordable housing program, and explore alternative means to finance the program including direct subsidies from the government bud-get, contributions from employers, and partnership with the private sector.
· Regulate the land lease system and change its structure toward higher rates of com-pensation for farmers, restriction to public purpose activities, and implementation of property taxation to encourage a more effi-cient use of land.
· Promote private-public partnerships in broad urban development.
· Reform LGFVs, and allow local govern-ments and SPVs to borrow within a rigor-ous regulatory framework.
· Diversify stable long-term financing for local government and SPVs and align the incentives for them and their lenders.
· Bring medium-term perspective and trans-parency into public expenditure manage-ment, and streamline the government hier-archy structure by removing the prefecture as a regional government.
This proposed reform package will signifi-cantly change the Chinese economic system in many ways (see table 6.8). Among these, the most important payoff will be a stronger market institution. The reforms would allow the market to play a larger role in resource allocation and let the government focus on its core role of delivery of public services, plan-ning, coordination, and regulation. Moving from a derivation-based revenue sharing to a formula system would reduce the incen-tives for local governments to compete for a tax base. The amount of intergovernmen-tal transfers received would now depend on expenditure needs, such as population size or the concentration of low-income families or the state of urban infrastructure or urban-ization, rather than on the amount of new VAT or company income tax generated. The

f i n a n C i n g U r b a n i z a t i o n 433
Table 6.8 Comprehensive reform program
Subject Reform Comments
Expenditure assignment
Transfer responsibility for social security to the central level
Full assumption of responsibility and the cost of leveling up benefit differences among provinces, and funding the system including legacy costs would probably bring additional expenditures.
Transfer unfunded liabilities in the pension and health areas to the central level
Central expenditures would increase, but amounts are unknown
Transfer selected subnational functions to the central level
Central expenditures would increase, but amounts are unknown
Revenue assignment
Eliminate the 25 percent value added tax (VAT) share to subnational governments
This step would shift revenues from the subnational governments to the central government.
Adopt local government taxes Options include property taxes, surcharges on central taxes, motor vehicle taxes, and retail taxes on selected products.
Intergovernmental transfers
Restate the vertical share for intergovernmental transfers in terms of all tax collections. Replace derivation sharing with formula sharing
This reform would shift the distribution of transfers away from the higher-income provinces.
Consolidate conditional and unconditional grants into a single program
This reform would reduce compliance costs but remove targeting of specific areas for spending. Allocation could be shifted to a formula and possibly merged with general revenue sharing above.
Tariff Policies Set tariffs to recover the full costs of infrastructure service provision, including the costs of capital, for:• Solid waste collection and disposal• Water supply and distribution• Natural gas distribution• Wastewater treatment plants• Roads and bridges constructed as toll facilitiesSet tariffs to cover the full costs of operation and maintenance and to make partial contributions to the cost of capital for wastewater collection systems.
A regulatory authority will review tariffs to ensure that they meet the prescribed standards
Debt Give local governments the power to directly borrow long-term for capital investments once they are credit rated.
Allowing local governments to access debt market would impose fiscal discipline. Local government financing vehicles (LGFV) would no longer be the only way for local governments to access financing.
Make credit rating mandatory before any local government can borrow from any source for any purpose.
Ratings promote financial transparency, encourage lenders and investors to price credit on a risk basis, and enable authorities to monitor local government finances based on objective information.
Develop the municipal bond market to provide long-term financing for urban infrastructure.
This step increases the sources of financing for local governments and SPVs; engages investors that are seeking long-term securities; and strengthens China’s financial sector.
Resolve existing local government bad debts, sharing negative consequences among borrowers and lenders, and simultaneously establish a credible local government insolvency framework
This reform eliminates the need for future central government bailouts of local governments, makes the default risk credible to lenders and investors, and thereby reduces moral hazard in local government financing.
Land finance Pay a higher rate of compensation to farmers but tax the difference between the buying price and the agriculture price.
This reform would slow the increase in land lease sales, reduce public investment in infrastructure, and make debt more affordable.
Revenue generated from long-term leasing of municipally owned land will be earmarked for capital expenditures only.
Land leasing revenues will be dedicated to specific capital projects, when these projects raise land values.
All land leasing will take place at market values, subject to competitive bidding.
Budgeting Adopt a new budget format that separates current from capital spending and revenues. Adopt accrual-based government accounting rules. Require that all revenues, expenditures, assets and liabilities be fully reported. Phase in medium-term budgeting.
The reform would permit development of a capital budget, and could lead to transparency, enhanced efficiency and better measures of creditworthiness.

434 U r b a n C h i n a
choice between investments in education and investments in industrial development would now be on a more level playing field. That should result in more rational decisions about strategies and subsidies for attracting indus-try. Moving industrial subsidies to the central government would further limit the role of local governments. Moving the LGFVs into the formal local government structure, or to commercial entities, and more generally lay-ing a play field for the private sector would make space for the market to play a role.
Central-local government relations will be rationalized. The reform package proposed here would shift some expenditure responsi-bilities from local governments to the central level. The central government has long been called upon to take over financing respon-sibility for social insurance (pension and health), which would lead to cost increases for the central government. Other expendi-ture programs are candidates for shifting to the central government, which would add to the improvement in vertical balance. These include functions where there are significant spatial externalities (environmental protec-tion and natural resource management) and where regional and national coordination is necessary (urban transportation). Expendi-ture reassignments would be accompanied by revenue reassignments. The central gov-ernment revenue share would be increased. All tax revenues where the central govern-ment sets the tax rate would form the new revenue sharing pool, and a single sharing rate would be applied. The new general rate would reflect the new central government responsibilities. The distribution of revenue sharing among provinces would be done by a formula and by earmarked grants. If serviced population is factored heavily in the formula, metropolitan cities are likely to lose revenues. They then could recapture revenue losses with new local taxes that would be assigned. These would include a revamped set of prop-erty taxes, surcharges on central taxes, and motor vehicle taxes.
The financing system will be more condu-cive to the development of an efficient, inclu-sive, and sustainable urbanization.
In addition to efficiency brought by greater role of market in resource allocation, greater
efficiency will be achieved from three other changes proposed here. First, local tax-ing powers would allow (force) those urban governments that provide better services to charge a higher tax rate to their residents, which would bring about a number of changes in choices made. In cities that provided bet-ter (higher cost) services, residents would be asked to pay the higher marginal cost, which would be factored into the location decisions of both companies and migrants and, at least at the margin, contribute to a more efficient mix and layout of cities of various size. This change, together with greater transparency, will stimulate resident groups and business groups to pressure local governments for more cost effective service delivery.
Second, a proper rejiggering of expen-diture assignments would lead to a better accounting of the external costs and benefits in spending decisions. In cases where the reforms led to more centralization, externali-ties would be internalized and more efficient levels of service would follow. Examples are natural resource management, environ-mental protection, food safety, and regional transportation.
Third, the increased level of compensation to farmers (and reduced profits to local gov-ernments and developers) could reduce land transfer revenues and slow down the rate of increase in peri-urban infrastructure invest-ment. Some excess capacity could be used up, and budget allocations could be focused more on social services and on infrastruc-ture maintenance. Urban fringe development might also be slowed by taxes on property and motor vehicles. That could limit urban sprawl and at the margin lead to more com-pact development that would better capture agglomeration economies. Whether any of these changes in relative prices will matter, however, depends on the price elasticity of demand for suburban land.
This reform package would also have positive impacts on equity. The shift to a formula-based system of intergovernmental transfers would, at least, hold out the possi-bility of more equalization among provinces by comparison with the current derivation-based system. The transfer formula could be structured to take expenditure needs more
f i n a n C i n g U r b a n i z a t i o n 435
directly into account and no longer would reward those provinces with a stronger tax base. The degree of equalization that resulted would depend on the formula chosen.
A second area where equity gains would be made is with the shifting of responsibil-ity for the financing of social insurance pro-grams to the central government. Lower-income local governments would no longer be required to cope with fiscal capacity con-straints and a heavy concentration of resident low-income workers. Social security would be a national program where benefits and contributions would no longer depend on place of residence. That would also generate efficiency gains by removing an important barrier to labor mobility.
Third, equity might be served by revisiting the expropriation and compensation policies now followed in converting farmland into urban land uses. That could happen in one of several ways. Farmers could be given stron-ger property rights over farmland or home-steads, or both, or the central government could mandate a compensation rate that more closely approximates market value and impose a capital gains tax on the profit.
Overall stability could be improved. A property tax levied at a reasonable level, and with the right structure, could help curb speculation in the housing market. Heavier taxes on motor fuels would be consistent with lower-carbon urbanization. Bringing a medium-term perspective into budgeting would enable the government to manage the fiscal implications of urbanization more effec-tively and mitigate the shocks accordingly.
Local government budget discipline is promoted. Forcing local governments to raise some of their own revenue and borrow on budget would move local officials a step closer to accountability and fiscal discipline. Adequate budget provisioning is required for contingent liabilities resulting from local gov-
ernment guarantees on debt undertaken by SPVs delivering local services and on the com-mitments made by PPPs. Adherence to budget discipline is monitored through annual insti-tutional credit ratings for all local govern-ments and SPVs that want access to financ-ing from any source. Any failure to maintain budget discipline is revealed through down-graded credit ratings that are public informa-tion, easily monitored by central government authorities and financial institutions.
Financing for local governments is put on a stable foundation. The reform program broadens the sources of long-term financing available to local governments while address-ing the problem of moral hazard that under-mines the stability of China’s financial sector. Scaling up the use of municipal bonds issued by local government from its experimental phase creates a mechanism for institutional investors to play a much larger role in financ-ing urban infrastructure. Shifting some of this financing burden from policy banks and commercial banks to China’s developing debt market enables banks to diversify and strengthen their loan portfolios with more lending to small and medium-size businesses. It also strengthens and deepens the debt mar-ket, thereby contributing to a more flexible and responsive financial sector for China.
Gradually resolving the existing bad debts of LGFVs in a manner that shares responsi-bility among the central government, local governments, and banks is combined with establishing a formal and pragmatic local government insolvency framework. These reforms put financial institutions on notice that an assumption that local government SPV debt is implicitly guaranteed is unwar-ranted. That forces moral hazard out of the financing process and creates strong incen-tives for lenders and borrowers to pursue objectively creditworthy financing for urban infrastructure.

436 U r b a n C h i n a
The World Bank developed a model to esti-mate the total costs of urban infrastruc-ture, social services, and affordable hous-ing, covering both the capital expenditure (CAPEX) and the current expenditures such as the operation and maintenance expendi-ture (OMEX) in a wide range of key sectors. Urban infrastructure sectors include roads, subways, drainage, sewage, landscaping, gar-bage, water, and heating; while social service sectors include social housing, education, and health. Arguably, by considering all these sec-tors, the model provides a fairly comprehen-sive account of the major amenities urbanites would expect from a livable city in China or elsewhere.
Acknowledging the prominence of the public sector in undertaking and financing expenditure programs related to urban infra-structure and social services is quite pertinent to assess the fiscal affordability of the urban-ization process. To do so, the model consid-ers the total expenditures to be borne by the public sector (including those related to urbanization as well as many other spending responsibilities) against the resource envelope it commands. The model is then structured in two modules. First, the urbanization cost module quantifies the required expenditures stemming from the urbanization process, projecting these expenditures sector by sec-tor over the period 2013–30 to capture long-term economic and demographic trends. Second, the fiscal space module estimates the total expenditures to be financed by the central and local governments, together with their prospective resource envelope compris-ing fiscal revenues and borrowings. Financ-ing policies play a key role in linking the two modules because they ultimately determine the share of required urbanization-related expenditures (identified in the investment needs module) that the public sector would finance as part of its total expenditures (ascertained in the fiscal space module).
The World Bank model’s projections are predicated on stylized scenarios built upon reasonable assumptions concerning the future pattern of economic growth and urbanization (such as growth of real GDP
and incomes, expansion of urban popula-tion, built-up area, and density) and the insti-tutions and policies shaping public-finance outcomes (such as financing policies, taxes, spending programs). The Development Research Center (DRC) macro model pro-vides many of the long-term economic and demographic projections that are used as exogenous inputs in the World Bank model, thus ensuring consistency between results obtained from both models. In the World Bank model, the baseline scenario reflects the continuation of the current pattern of urban-ization and the perpetuation of existing insti-tutions and policies without drastic reforms. It is characterized by a growing urban popu-lation and significant city sprawl. The reform scenario captures the high-quality urbaniza-tion pattern that structural reforms might bring about, together with changes in tax, land, and debt-financing policies. Reforms thus lead to even faster growth of the urban population and city densification.
The urbanization cost module
Salient economic and demographic funda-mentals of the urbanization process affect the expenditures required to build urban infra-structure and deliver social services. Three fundamentals are considered in determining the expenditure needs: urban population, the built-up area, and density. These variables are projected for three categories of urban area (namely, city, county, and town) and for both the baseline scenario and the reform sce-nario. The urban population results from the total population projected by the National Population and Family Planning Commis-sion, and the urbanization rate estimated in the DRC macro model for the baseline and reform scenarios. The distribution of urban population among the categories of city, county, and town follows the trends observed in recent years, where the relative importance of cities is increasing slightly at the expense of towns. The urban built-up area is projected linearly in the baseline scenario, starting with the 2011 figures for the three categories and subsequently adding a category-specific fixed
annex 6a a technical note on the urbanization finance model

f i n a n C i n g U r b a n i z a t i o n 437
amount each year. The fixed annual increase in built-up area equals the average expan-sion observed in 2001–11.25 In the reform scenario, the urban built-up area is kept con-stant at the 2012 figure for each category, thus reflecting policy reforms that discour-age urban sprawl. Finally, the urban density is defined as the ratio of urban population to built-up area and is projected accordingly.26
Urban infrastructure sectors
The urbanization process characterized by the fundamentals described above requires investment in physical capital, most nota-bly for urban infrastructure sectors. Thus, the model postulates that the growth of urban population and density determines the required growth of physical capital stock in these sectors (with the exception of subways). Formally, the required physical capital stock Ki,j,t in category i (that is, city, county, or town), urban infrastructure sector j, and year
t, is given by
where UPi,t is urban population,
population, UDi,t is urban density, and the elasticities eUP and eUD are estimated econo-metrically. For each category and sector, the initial physical capital stock Ki,j,2011 is taken from 2011 data.27
The basic growth specification outlined above projects Ki,j,t for roads, drainage, landscaping, and heating. For sewage treat-ment, garbage treatment, and water, a sector-specific policy target is added to the funda-mentals-driven growth: namely, 100 percent of discharged sewage and collected garbage must be treated by 2030, and the water cov-erage rate must also be 100 percent by 2030. The target accelerates the projected Ki,j,t by adding a third term to the basic growth speci-
fication: lnRate
Ratei jRate i j t
i j t,
, ,
, , –1
ε × where Ratei,j,t is
the sectoral rate (that is, sewage treatment, garbage treatment, or water penetration), which increases linearly until reaching 100 percent by 2030, and the elasticity e Rate, which is estimated econometrically.28
In contrast to the other sectors, subways are driven solely by a policy target implicit in the development plans of 34 Chinese cities: the subway lines must reach 14,187 kilome-ters by 2040, starting from 1,672 kilometers in 2011. Therefore, an average of 432 kilo-meters of subway lines must be built every year until 2040 to meet the target. Thus, the model assumes the required physical capital stock Ki,j,t in this sector increases in propor-tion to the average expansion of subway lines.
The physical investment requirement in a given urban infrastructure sector is, by defi-nition, the required growth of physical capi-tal stock plus the depreciation of the exist-ing stock. For simplicity, the depreciation is assumed to be a constant proportion of the existing physical capital stock, which is uni-form across sectors and varies only across categories: 5 percent if the capital is built in a city, 6.7 percent if built in a county, and 10 percent if built in a town. The physical investment requirement IRi,j,t is then given by K K(1 )i j t i i j t, , , , –1δ− −
where di is the category-specific depreciation rate.
A monetary cost is incurred if and when the accumulation of physical capital takes place. The cost reflects all the expenses incurred in purchasing real assets outright or in building them, and so depends on market prices of real assets, goods, and services, as well as on the overall efficiency of the invest-ment process. A cost per unit of physical cap-ital invested is postulated in the model as a summary indicator of all costs related to real investment. For each category and sector, the initial unit cost PK
i,j,2011 is calibrated using historical data up to 2011 on the invest-ment expenditures at current prices and the concomitant gross accumulation of physical capital. Next, to project the unit cost PK
i,j,t, the model assumes a time-invariant sector-specific inflation rate pK
j , which captures the expected trends in market prices and investment efficiency. For the baseline and reform scenarios, the sector-specific unit-cost inflation is 6 percent annually. This figure is below the historical average estimated for most urban infrastructure sectors and thus reflects investment efficiency gains vis-à-vis past performance (for example, the estimated unit-cost inflation in roads and landscap-

438 U r b a n C h i n a
ing was 13 percent a year in 2001–10). On the other hand, because the cost structure in these sectors is tilted toward inputs (like labor) whose relative prices would increase along with the rebalancing of China’ growth pattern, the projected 6 percent unit-cost inflation exceeds the projected 3.5 percent GDP deflator inflation.
The required capita l expenditure (CAPEX) in a given urban infrastructure sector is, by definition, the physical invest-ment requirement (the quantity of real assets to be invested) times the unit cost (the expenses incurred per unit of real assets to be invested). At current prices, CAPEXs are projected as IR Pi j t i j t
K, , , ,× , whereas CAPEXs
at constant prices use PKi,j,2011 to value
the physical investment requirement. The CAPEXs are monetary magnitudes and can be aggregated across categories and sectors. Thus, total CAPEX at current prices in year t is IR Pi j i j t i j t
K, , , , ,∑ × .
The required operation and maintenance expenditure (OMEX) in a given urban infrastructure sector is assumed to be pro-portional to the replacement value of the physical capital stock. For all categories and sectors, the proportion is 2 percent, and the unit cost proxies the replacement value. The OMEXs at current prices are projected as
P Ki j tK
i j t, , , ,θ × × where q is the proportional factor (2 percent). OMEXs at constant prices use PK
i,j,2011 to value the physical capital stock. The total OMEX at current prices in year t is P Ki j i j t
Ki j t, , , , ,θ∑ × × .
Education
Providing education in urban areas requires building schools and hiring teachers. A remarkable policy goal is that mandatory education in urban schools be provided to students whose households hold urban resi-dence, as well as to students currently attend-ing rural schools whose parents are living and working in cities (the migrant population without hukou). Thus, the model postulates that the required urban-education cover-age of students to be served is driven by two factors. The first is the number of students living in cities and attending five types of urban schools: primary school, middle-junior
school, high school, high vocational school, and other schools. Starting from the 2011 figures corresponding to the first four urban-school types, the number of these students is assumed to increase over time following the growth of the urban population under-lying the baseline and reform scenarios.29 The second factor is the gradual absorption of the migrant workers’ children currently receiving mandatory education in rural areas that would move to cities and enroll in urban schools. Nearly 19 million students in rural primary schools and 6.5 million students in rural middle-junior school are estimated to join their parents living in cities.30 Thus, the model assumes that these students will grad-ually enroll in urban schools, with the transi-tion completed by 2015. For each of the four urban-school types indicated above, indexed by s, the total number of urban students STs,t resulting from both factors is the required urban-education coverage.
Monetary costs incurred in providing pri-mary, middle-junior, high, and vocational education in urban areas include labor, OMEX, and CAPEX. The model formulates a cost per unit of student served for labor and OMEX, and a cost per marginal student served for CAPEX. The unit costs summa-rize expenses to deliver education services, which depend on market prices of real assets, goods, and services, as well as on the overall efficiency of the service delivery process. This approach assumes that each urban student has a fixed endowment of physical capital, so that the (observed) number of urban students STs,t is one-to-one proportional to the (unob-served) stock of physical capital in urban schools. For each urban-school type s, the initial unit costs of labor PL
s,2011 and OMEX PO
s,2011 are calibrated using 2011 data on these expenditures. The initial CAPEX unit cost PK
s,2011 is estimated using historical data up to 2011 on the investment expenditures at current prices and the increase in the number of students attending urban schools of type s. To project costs into the future, it is assumed that the labor unit cost PL
s,t increases over time in line with the growth of per-capita nominal income of urban households, which averages 9.3 percent a year in 2013–30, according to the DRC macro model. The

f i n a n C i n g U r b a n i z a t i o n 439
OMEX unit cost POs,t grows at 3.5 percent
a year, in line with the GDP deflator infla-tion. The CAPEX unit cost PK
s,t increases 6 percent a year, in line with the unit-cost infla-tion in urban infrastructure sectors. Putting together the required coverage and unit costs at current prices projected for the four types of urban schools, the provision of education in year t requires a total labor expenditure of ST Ps s t s t
L, ,∑ × , OMEX of ST Ps s t s t
O, ,∑ × ,
and CAPEX of . Total expenditures at constant prices use the 2011 initial unit costs.
Costs incurred in other types of schools cannot be addressed by identifying required coverage and unit costs separately because of a lack of reliable information on the num-ber of students currently enrolled. Thus, to project the required total labor expenditure, OMEX, and CAPEX, it is assumed that the expenditures observed in 2011 would grow at annual rates identical to those postulated for the unit costs of the four main types of urban schools. Note that the model does not deduct the savings in the rural education sys-tem arising from the migration of students.
Public health
Delivering health services in urban areas requires building hospitals and hiring medi-cal staff. The model focuses only on capital expenditure, however, because government subsidizes the recurrent cost to both rural and urban residents on a capitation basis, thus the net increment of recurrent cost is expected to be negligible. Since there is no homogeneous physical capital good for providing health ser-vices but rather a heterogeneous collection of goods (including facilities and medical equip-ment), the model relies on the number of beds in urban hospitals as a proxy for the require-ments of physical capital (or, more broadly, hospital capacity). This approach implicitly assumes that each bed is associated with a fixed endowment of physical capital, so that the (observed) number of urban hospital beds Bt is one-to-one proportional to the (unob-served) physical capital stock. The required urban-health coverage is then expressed in terms of beds to be endowed with supportive physical-capital goods.
Urban hospital beds and related CAPEX are driven by an assumed policy target con-cerning the capacity of health facilities to serve urbanites: to make available 6.4 beds per 1,000 urbanites by 2030, which is the average figure observed in high-income OECD countries, starting from the current availability of 3.6 beds per 1,000 urbanites. Thus, the urban population growth and a gradual increase in the beds ratio toward the 2030 target jointly determine the required urban-health coverage measured by Bt.
The model postulates a cost per marginal bed to be endowed, which reflects investments to be made in the health sector and depends on market prices of real assets, goods, and services, as well as on the overall efficiency of the investment process. The initial CAPEX unit cost PK
2011 is calibrated using 2011 data on the investment expenditures at current prices and the increase in the number of beds in urban hospitals. The estimated value is RMB 80,453 for a bed. The CAPEX unit cost PK
t is assumed to grow at 6 percent a year, as in the urban infrastructure sectors. Providing health services in year t then requires CAPEX of B B P[ (1 ) ]t h t t
K1δ− − ×− . CAPEX at constant
prices use the 2011 initial unit cost.
Social housing
Social housing implies construction, opera-tion, and maintenance of buildings. Current policy aims at building 36 million units in the period 2011–15, and raising social-housing coverage to 20 percent of urban households by 2020. In the model, it is postulated that a typical social-housing unit has 60 square meters of floor space, and a typical urban household living there has three people. The required physical capital stock Ksh,t in the social housing sector is then defined in terms of the floor space to be built. It is driven by the current policy until 2015 and afterward by the urban population growth and cover-age target.
Building social housing takes time, and some major monetary costs are incurred before the physical capital built becomes available. In this regard, the model postulates that the physical investment requirement IRsh,t in year t ( the quantity of real assets
440 U r b a n C h i n a
to be invested) equals the average increase in the physical capital stock available in the next two years, K K0.5 ( )sh t sh t, 2 ,× −+ .31 A cost per unit of physical capital invested (which will be available over the next two years) is used to summarize all costs related to real investment in the sector. The initial unit cost PK
sh,2011 is RMB 2,373 for a square meter of space floor.32 The unit cost PK
sh,t is assumed to grow in line with GDP deflator inflation. Finally, the required capital expenditure (CAPEX) at current prices is projected asIR Psh t sh t
K, ,× , whereas the required CAPEX at
constant prices uses PKsh,2011 instead. Of the
total capital expenditure on social housing, 70 percent is expected to finance through debt.
The required operation and maintenance expenditure (OMEX) in social housing is assumed to be proportional to the mar-ket value of the physical capital stock. The OMEX proportion q is 2 percent. The mar-ket value PKM
sh,t is proxied with the average selling price of residential buildings, which was RMB 4,993 for a square meter of space floor in 2011 and which is assumed to grow following unit-cost inflation. OMEX at cur-rent prices is projected as P Ksh t
KMsh t, ,θ × × and
OMEX at constant prices use PKMsh,2011.
Fiscal space module
Expenditure requirements identified in the urbanization cost module are to be under-taken and financed by the private and pub-lic sector, often using borrowing to initially put assets in place and setting tariffs, user charges, and budget resources (subsidies and transfers) to repay debts and operate and maintain these assets. Financing policy options will then determine how much of the urbanization costs will be borne by the central and local governments. These costs will compete with other spending respon-sibilities, thus posing policy trade-offs and the need to prioritize expenditure programs. In the model, the expenditure share in each urban infrastructure and social service sec-tor is calibrated by looking at the historical ratio between public and total spending.33 Estimated shares are used in both baseline and reform scenarios, thus implicitly assum-
ing that the current financing policies will be upheld going forward.
As for all the other primary expenditures (those not related to urbanization, excluding interest), it is assumed that the correspond-ing spending programs will be adapted to China’s new growth pattern and thus will expand in line with either the nominal GDP or the nominal per capita income of urban households. Interest payments depend on the borrowing policies pursued, which are dis-cussed below.
The resource envelope available to fund all expenditures, referred to as the fiscal space, consists of government revenues and borrowings. While revenues result from the interaction of economic performance and fiscal policies, borrowings (both on- and off-budget) depend on the objectives of debt financing policies as well as on market opportunities.
Government revenues include taxes, non-tax receipts, and net land-leasing receipts (after deducting the cost of land acquisition and relocation compensation), which are recorded in the Public Finance Budget and the Government Funds. The macroeconomic projections of the DRC macro model pro-vide reasonable proxies for the relevant tax bases of the major tax and nontax revenues. Assuming the tax rates remain unchanged, the revenue projections are consistent with their underlying economic determinants, so that, for example, income taxes grow in line with nominal GDP and consumption tax trails aggregate consumption expendi-ture. Nontax receipts include rentals from social housing. The rental is expected to be high enough to cover operating and main-tenance cost, interest and amortization of construction cost in 30 years. Land financ-ing policies drive the net land leasing receipts. In the baseline scenario, the gross receipts result from leasing 4.4 million mu of state-owned land a year, at a market price of RMB 660,000 a mu in 2012, which subsequently increases 3 percent a year, in line with GDP deflator inflation. Three-quarters of the gross receipts are assumed to cover the costs of land acquisition and relocation compensa-tion. In the reform scenario, instead, land leases are dropped in 2015 and replaced with

f i n a n C i n g U r b a n i z a t i o n 441
a property tax that likely generates revenues equivalent to 1.6 percent of GDP a year.
Borrowings include all direct government debts and the indirect debts of local govern-ments contracted through their financial vehicles. Debt-financing policies determine the net borrowings (after deducting princi-pal amortizations) by setting a target level of public debt relative to GDP. In the base-line scenario, it is assumed that net borrow-ings seek to maintain the public debt-to-GDP ratio at 53 percent, which was the level observed in 2012. In the reform scenario, policies aim to slow the rapid pace of indebt-edness incurred by local governments since 2008, when the global crisis erupted. Thus, the target is to attain a debt-to-GDP ratio of 40 percent by 2030. The model assumes that the annual interest rate on outstanding debts is 3.5 percent for the central government and 7 percent for the local governments.
Notes 1. Much of this growth will come from migrant
workers, who have less human capital than the existing urban population, and to a lesser extent the conversion of rural areas into urban areas with the concomitant reclassifica-tion of the resident population.
2. Official policy requires residence-based, com-pulsory education for all children. In general, local governments are in compliance with this policy. A recent survey shows that about 80 percent of migrant worker children are now enrolled in public schools.
3. Lall, Timmins, and Yu (2009) evaluated the relative importance of wage differences and public services in migrants’ decisions to move in Brazil. Their findings showed a distinction in preferences according to income level: for relatively well-off people, basic public services were not important in the decision to move, but for the poor, differences in access to basic public services did matter.
4. Woetzel and others (2009) estimated that the increased expenditure of the public sector will accumulate continually, reaching RMB 1.5 trillion, or 2.5 percent of projected urban GDP in 2025.
5. For example, 1 million of 4 million migrant workers in Liaoning province reportedly made social security contributions.
6. Migrants from rural regions receive subsidies on education, pension, and health insurance
in regions of origin, with the central govern-ment funding most of these subsidies in the lagging regions. With respect to pension and health insurance schemes, rural residents are charged lower premiums for pension and health insurance schemes, and receive deeper benefits, than are urban residents.
7. Social housing financing is modeled in such a way that the government finances the full investment, of which 70 percent is from debt finance. The government later collects rentals from users, and the rental is set to cover the full operating and maintenance cost and interest and to amortize 70 percent of capital expen-diture in 30 years. For simplicity, the rental revenue, estimated at 0.7 percent of GDP in 2012–30, is included in the fiscal space.
8. In China, “local” is used for all subnational governments.
9. There are two important qualifiers to this discussion of revenue centralization in China. First, the payroll contributions to social secu-rity are in the subnational government bud-gets, and the rates of charge vary across prov-inces. These contributions are collected by the state tax bureau as an agent for subnational government. Second, local governments are responsible for administering the sale of land leases, including setting the purchase price of the farmland and the price of the land lease. Gross land sales revenues were equivalent to about 7 percent of GDP in 2012, almost 30 percent of general government revenues, and exceeded the revenue yield of social security contributions.
10. General transfers in this report include yi ban xing zhuan yi zhi fu and shui shou fan huan in Chinese official documents.
11. “The State Council’s Decision on Reform-ing Investment Regime,” No. 20 of Guo fa 2004, stipulates that the central government is responsible for investing in project across jurisdictions and river basins.
12. Finance Minister’s Report to National People’s Congress, March 2013, and staff calculation.
13. Article 28 of the Budget Law of the People’s Republic of China (1994) stipulates that “the local budgets at various levels should be com-piled according to the principles of keeping expenditures within the limits of revenues and maintaining a balance between revenues and expenditures, and should not have defi-cits. The local government may not issue local government bonds except as prescribed by laws or the State Council.”

442 U r b a n C h i n a
14. The LGFVs were capitalized by local govern-ments, mostly with free or subsidized user rights to land, and in some cases with a dedi-cated revenue stream from the local govern-ment budget, and in some cases by ad hoc transfers from the local government budget. A typical form of LGFV is an urban develop-ment investment corporation (UDIC). Pub-lic utilities enterprises and even schools and hospitals could also serve as an LGFV. Some LGFVs may have no other function except for financing.
15. For a comprehensive analysis of the issues, see supporting report 1: Urbanization and Eco-nomic Growth.
16. However, when infrastructure is badly planned and managed, borrowing to finance it can burden future generations with debt without corresponding benefits.
17. This is from the Administrative Rules for PPP Urban Public Utilities Projects, by the Minis-try of Construction, March 19, 2004.
18. Take the road sector as an example. A PPP project must follow the Road Law (2004), Tendering and Bidding Law (1999), Land Management Law (2004), Contract Law (1999), and the Regulation on the adminis-tration of toll roads (2004) if it is toll road, and the Decision on Reforming Investment Scheme (2004) if it involves domestic private investment.
19. For example, the central government forbids government guarantees of fixed returns, but in some local areas, government guarantees are used to attract private funding. Private sector tax exemption by local governments also has been forbidden by the central gov-ernment since the late 1990s; however, tax exemption is still an important promise in local policy (Chen and Zhang 2009).
20. See http://www.numbeo.com.21. Broader issues relating to land management—
spatial planning, urban development, gover-nance, and resettlement and safeguards—are discussed in supporting report 4, China’s Urbanization and Land: A Framework for Reform.
22. It should be noted that the overall financing costs of investment through PPPs might not be lower. In fact, private operators would likely face higher financing costs than gov-ernment. This disadvantage can be out-weighed by efficiency gains in construction and operation.
23. The newly released rule on government pro-curement (Rule No. 74 by the Chinese Min-
istry of Finance, on December 19, 2013) is a good start in this direction.
24. “Li Defines Criteria for Fighting Corrup-tion,” China Daily, March 27, 2013, p. 1.
25. Calculated using data from the China Statis-tics Yearbook of Urban and Rural Construc-tion and the China Statistics Yearbook of City Construction.
26. Density is often defined using the urban area, which is larger than the urban built-up area. But the model focuses on the urban built-up area because it is more relevant to project investment needs.
27. Data from the China Statistics Yearbook of Urban and Rural Construction and the China Statistics Yearbook of City Construction. Linear regression models for each urban cat-egory and infrastructure sector are estimated using cross-section data, including 656 cities and aggregates of county and town for 30 provinces. Physical capital stock in 2011 is regressed on urban population, density, and other explanatory variables. Variables are in log, and the estimated coefficients are the elasticities reported in the main text.
28. Physical capital stock in sewage and gar-bage sectors is assumed to be proportional to the quantities treated because data refer to sectoral outputs and not to the real assets involved in producing those outputs.
29. Data from the China Statistics Yearbook of Education Finance. There is no reliable infor-mation on the number of students attending schools in the residual “others” type, so it is assumed that such a number (whatever it may be) remains constant over time.
30. Estimates result from comparing the actual number of students attending primary and junior-middle schools in rural areas against the hypothetical number of students that would attend rural schools if the total student population were distributed among rural and urban schools in proportion to the urbaniza-tion rate (mimicking the distribution of the total Chinese population between rural and urban areas). Whereas the urbanization rate was 51 percent in 2011, nearly 70 percent of total primary-school students and 63 per-cent of total junior-middle-school attended schools in rural areas. Such an asymmetry reveals a backlog of rural students for the urban schools to absorb. Data on the actual number of students are from the China Statis-tics Yearbook of Education Finance.
31. For simplicity, no depreciation is assumed. 32. Data are from DRC.

f i n a n C i n g U r b a n i z a t i o n 443
33. Such figures often result from aggregate-level data and should be seen cautiously as work-ing approximations because the limited avail-ability of data precludes any accurate estima-tion of expenditure shares.
referencesBaeumler, Axel, Ede Ijjasz-Vasquez, and Shomik
Mehndiratta. 2012. “Sustainable Low-Carbon Cities in China: Why It Matters and What Can be Done.” In Sustainable Low-Carbon City Development in China, edited by Axel Baeum-ler, Ede Ijjasz-Vasquez, and Shomik Mehndi-ratta. Washington, DC: World Bank.
Bahl, Roy. 1999. Fiscal Policy in China: Taxa-tion and Intergovernmental Fiscal Relations. San Francisco: 1990 Institute and University of Michigan Press.
———. 2009. Property Tax Reform in Develop-ing and Transition Countries. Washington, DC: United States Agency for International Development.
Bahl, Roy, Johannes F. Linn, and Deborah L. Wetzel, eds. 2013. Financing Metropolitan Governments in Developing Countries. Cam-bridge, MA: Lincoln Institute of Land Policy.
Bahl, Roy, and J. Martinez-Vazquez. 2006. “Sequencing Fiscal Decentralization.” Policy Research Working Paper 3914, World Bank, Public Sector Governance Group, Washington, DC.
Bahl, Roy, and Baoyun Qiao. 2013. “Reforming the Public Finance System to Fit a More Urban-ized China.” Background Paper prepared for China Urbanization Project: Pillar Six.
Bahl, Roy, and Geeta Sethi, editors. 2012. “Inter-governmental Fiscal Relations in Latin Amer-ica: The Case of Argentina, Colombia, Mexico and Peru.” Public Sector and Governance Unit, Poverty Reduction and Economic Manage-ment Unit, Latin America and the Caribbean, World Bank, Washington, DC, June.
Bahl, Roy, and Christine Wallich. 1992. “Inter-governmental Fiscal Relations in China.” Country Economics Department Working Paper, World Bank, Washington, DC.
Blochliger, Hansjorg, and Camila Vammalle. 2010. “Intergovernmental Grants in OECD Countries: Trends and Some Policy Issues.” In General Grants versus Earmarked Grants: Theory and Practice, ch. 6. Conference report from the Copenhagen Workshop 2009, Korean Ministry of Finance and Danish Ministry of Interior and Health.
Blom-Hansen, Jens. 2010. “The Fiscal Federal-ism Theory of Grants: Some Reflections from Political Science.” In General Grants versus Earmarked Grants: Theory and Practice, ch. 3. Conference report from the Copenhagen Workshop 2009, Korean Ministry of Finance and Danish Ministry of Interior and Health.
Boadway, Robin W., and Anwar Shah. 2009. Fis-cal Federalism. Cambridge, U.K.: Cambridge University Press.
Canuto, Otaviano, and Lili Liu, eds. 2013. Until Debt Do Us Part: Subnational Debt, Insol-vency, and Markets. Washington, DC: World Bank.
Chen, Shiyi, and Jun Zhang. 2009. “Empirical Research on Fiscal Expenditure Efficiency of Local Governments in China.” Social Sciences in China 30 (2): 21–34.
de Mello, Luiz. 2010. “Fiscal Decentralisation and Public Investment: The Experience of Latin America.” OECD Economics Depart-ment Working Paper 824, OECD Publishing, Paris.
Deng, Shulian, and Jun Peng. 2011. “Reforming the Budgeting Process in China.” OECD Jour-nal on Budgeting 1: 75–89.
Gao, Peiyong, and Dehua Wang, eds. 2012. China Fiscal Policy Report 2012.2013: Housing Security in the Context of New Urbanization. Beijing: China Finance and Economy Publish-ing House.
Haines, Martha. 2009. “Regulation of the Sub-national Securities market in the USA.” Pre-sentation to the International Forum on Sub-national Debt Management, Zhuhai, China, September 25.
Hameed, Farhan. 2005. “Fiscal Transparency and Economic Outcomes.” IMF Working Paper WP/05/225, International Monetary Fund, Washington, DC.
Hofman, Bert, and Susana Cordeiro Guerra. 2007. “Ensuring Inter-Regional Equity and Poverty Reduction.” In Fiscal Equalization: Challenges in the Design of Intergovernmental Transfers, edited by Jorge Martinez-Vazquez and Bob Searle, 31–60. Amsterdam: Springer.
IFC (International Finance Corporation). 2013. Opening remarks prepared for Vice President Jingdong Hua for the Conference on Securi-tization and Capital Markets Development in China, Beijing.
Ivanyna, Maksym, and Anwar Shah. 2014. “How Close Is Your Government to Its People? Worldwide Indicators on Localization and Decentralization.” Economics: The Open-Access, Open-Assessment E-Journal 8: 2014-

444 U r b a n C h i n a
3. http://dx.doi.org/10.5018/economics-ejour-nal.ja.2014-3
Kaganova, Olga, and Gary Windolph. 2012. “Introducing Management of Capital Assets in Secondary Cities in China: Laibin Inception Report.” Background note prepared for the World Bank.
Kaufmann, Daniel, and Ana Bellver. 2005. “Transparenting Transparency: Init ial Empirics and Policy Applications.” http://mpra.ub.uni-muenchen.de/8188/.
Keen, Michael, and Maurice Marchand. 1997. “Fiscal Competition and the Pattern of Public Spending.” Journal of Public Economics 66: 33–53.
Lall, Somik V., C. Timmins, and S. Yu. 2009. “Connecting Lagging and Leading Regions: The Role of Labor Mobility.” Brookings-Wharton Papers on Urban Affairs: 151–74.
Li, Hongbin, and Li-An Zhou. 2005. “Political Turnover and Economic Performance: The Incentive Role of Personnel Control in China.” Journal of Public Economics 89 (9): 1743–62.
Liu, Lili. 2010. “Strengthening Subnational Debt Financing and Managing Risks.” Review of Economic Research 46 (August): F-9.
Liu, Lili, and George Peterson. 2013. “Manag-ing Fiscal Risks of Land Financing.” Draft of a Premise Note, PREM Network, World Bank, Washington, DC.
Liu, Lili, and Juan Pradelli. 2013. “Monitoring Subnational Debt in China: Strategic Consid-erations and Policy Options.” Policy note for China Ministry of Finance, World Bank Bei-jing Office.
Liu, Lili, and Baoyun Qiao. 2013. “Restructuring of Legacy Debt for Financing Rural Schools in China.” In Until Debt Do Us Part: Subna-tional Debt, Insolvency, and Markets, edited by Octaviano Canuto and Lili Liu, 81–108. Washington, DC: World Bank.
Liu, Lili, and Michael Waibel. 2008. “Subnational Borrowing, Insolvency and Regulations.” In Macro Federalism and Local Finance, edited by A. Shah. Washington, DC: World Bank.
———. 2010. “Managing Subnational Credit and Default Risks.” Policy Research Working Paper 5362, World Bank, Washington, DC.
Liu, Zhi, and Andrew Salzberg. 2012. “Develop-ing Low-Carbon Cities in China: Local Gov-ernance, Municipal Finance, and Land Use Planning: The Key Underlying Drivers.” In Sustainable Low-Carbon City Development in China, edited by Axel Baeumler, Ede Ijjasz-Vasquez, and Shomik Mehndiratta, ch. 4. Washington, DC: World Bank.
Lou, Jiwei. 2013. Rethinking of Intergovernmen-tal Fiscal Relations in China. Beijing: China Finance and Economics Press.
Man, Joyce. 2013. “Evaluation of Property Tax Reform and Experiments in China.” Back-ground paper prepared for World Bank urban-ization project.
Man, Joyce Yanyun, Siqi Zheng, and Rongrong Ren. 2011. “Housing Policy and Housing Markets: Trends, Patterns, and Affordability.” In China’s Housing Reform and Outcomes, edited by Joyce Yanyun Man. Cambridge. MA: Lincoln Institute of Land Policy.
Martinez-Vazquez, Jorge, and Baoyun Qiao. 2011. “Assessing the Assignment of Expen-diture Responsibilities.” In China’s Public Finance in Transition, edited by Joyce Yanyun Man and Yu-Hung Hong, 21–40. Cambridge. MA: Lincoln Institute of Land Policy.
Martinez-Vazquez, Jorge, Violeta Vulovic, and Yongzheng Liu. 2011. “Direct vs. Indirect Taxation: Trends, Theory and Economic Significance.”In The Elgar Guide to Tax Sys-tems, edited by Emilio Albi and Jorge Mar-tinez-Vazquez, 37–92. Northampton, MA: Edward Elgar.
Merk, O., S. Saussier, C. Staropoli, E. Slack, and J.-H. Kim. 2012. “Financing Green Urban Infrastructure.” OECD Regional Development Working Papers 2012/10, OECD Publishing, Paris, http: //dc.doi.org/10.1787/5k92p0c6j6r0-en.
Mikesell, John L., and Daniel R. Mullins. 2011. “Reforms for Improved Efficiency in Public Budgeting and Finance: Improvements, Dis-appointments, and Work-in-Progress.” Public Budgeting and Finance 31: 1–30.
Ministry of Land and Resources. 2008. China Land and Resources Almanac.
Open Budget Survey: China. 2012. International Budget Partnership. http://www.oecd.org/gov /budget/database.
Painter, David. 2013. “Financing Policies for Urbanization.” Background note prepared for the World Bank.
Persson, Petra, and Anna Eriksson. 2006. “From Blind Pursuit of Growth to Balanced Devel-opment? An Analysis of the Political Logic of Fiscal Intergovernmental Transfers in China 1998–2003.” Stockholm School of Economics, Stockholm.
Peterson, George E. 2003. “Bonds or Banks? Building a Municipal Credit Market.” In Local Government Finance and Bond Mar-kets, edited by Yun-Hwan Kim. Manila: Asian Development Bank.

f i n a n C i n g U r b a n i z a t i o n 445
———. 2008. “Land Leasing and Land Sale as an Infrastructure Financing Option.” In Financ-ing Cities, George E. Peterson and Patricia Clarke Annez, eds. A copublication of the World Bank and Sage Publications (India Pvt Ltd), Washington, DC and New Delhi.
Peterson, George E., and Olga Kaganova. 2010. “Integrating Land Financing into Subnational Fiscal Management.” Policy Research Working Paper 5409, World Bank, Washington, DC.
Qiao, Baoyun, and Lezheng Liu. 2013. Inter-governmental Fiscal Relationship and Risk-sharing Function. Beijing: China Financial and Economic Publishing House.
Rojas, Eduardo. 2008. “The Metropolitan Regions of Latin America: Problems of Gov-ernance and Development.” In Governing the Metropolis, edited by Eduardo Rojas, Juan R. Cuadrado-Roura, and Jose Miguel Fernan-dez Guell. Washington, DC: Inter-American Development Bank and David Rockefeller Center for Latin American Studies, Harvard University.
Smolka and Amborski. 2007. Published online: http://www.intechopen.com/books/energy-efficiency-a-bridge-to-low-carbon-economy.
Wang, Guixin, Jianfa Shen, and Jianbo Li. 2008. “Citizenization of Peasant Migrants during Urbanization in China: A Case Study of Shang-hai.” Population and Development 1: 2–23.
Wang, Xiao, and Richard Herd. 2013. “The Sys-tem of Revenue Sharing and Fiscal Transfers in China.” OECD Economics Department Work-ing Paper 1030, OECD Publishing, Paris.
Woetzel, Jonathan, Lenny Mendonca, Jana-mitra Devan, Stefano Negri, Yangmei Hu, Luke Jordan, Xiujun Li, Alexander Maasry, Geoff Tsen, and Flora Yu. 2009. “Preparing for China’s Urban Billion.” McKinsey Global Institute, March.
Wong, Christine, ed. 1997. Financing Local Gov-ernment in the People’s Republic of China.
Hong Kong SAR, China: Oxford University Press.
World Bank. 2013a. Beyond the Annual Bud-get: Global Experience with Medium Term Expenditure Frameworks. Washington, DC: World Bank.
———. 2013b. “China: The Role of Housing Provident Funds in the Construction of Afford-able Housing.” East Asia and Pacific Region, World Bank, Washington, DC, July.
———. n.d. “Economic, Financial, and Commer-cial Review of Urban Water Supply Utilities.” World Bank, Beijing.
World Bank and DRC (Development Research Center of the People’s Republic of China). 2013. China 2030: Building a Modern, Har-monious, and Creative Society. Washington, DC: World Bank.
World Bank Institute and PPIAF (Public-Private Infrastructure Facility). 2012. Public-Private Partnerships Reference Guide Version 1.0, Washington, DC: World Bank.
Wu, Weiping. 2013. “Public Private Partnership for Urban Infrastructure Financing and Man-agement.” Background paper for the World Bank urbanization project.
Yusuf, Shahid. 2013. “Metropolitan Cities: Their Rise, Role and Future.” In Bahl, Linn, and Wetzel.
Zhao, Min, Guangrong Ma, and Lina Li. 2013. “Province-Sub-province Government Rela-tions in China: A Case Study of Hubei Prov-ince.” Stocktaking Note for Discussion, World Bank, March.
Zheng, Gongcheng. 2012. “Reform and Devel-opment Strategy of China Health Security.” Dong Yi Forum. http://www.qstheory.cn/sh/shbz/201208/t20120828_178251.htm.
Zhou, Li-an. 2007. “Governing China’s Local Officials: An Analysis of Promotion Tourna-ment Model [J].” Economic Research Journal 7: 36–50.

447
7
Green Urbanization
introductionChina’s growth model has brought tremen-dous economic and social rewards over the past three decades but also has come at the enormous cost of resource depletion and local and global pollution. Most resource use and pollution occurs in cities or is caused by demand from cities, which also bear some of the greatest impacts. Continuing on this path is not economically effi cient because pollu-tion imposes rising direct and indirect eco-nomic costs, even if those costs (to health or the environment) are usually not refl ected in markets or in measures of national income. Such development is also not socially inclu-sive because—while pollution and resource scarcity affect all citizens—the poor are usu-ally most heavily affected and least able to cope. As it seeks to attain high-income sta-tus, meet aspirations for a higher quality of life, and ensure that resources are available for future generations, China needs to transi-tion to a growth path driven by more effi cient and cleaner production and consumption. For that to become a reality, environmental sustainability must become an explicit policy goal on an equal footing with economic effi -ciency and social inclusion.
Raising the profile—and the effective-ness—of environmentally sustainable policies in the ongoing urbanization process requires that China’s green governance matches its green ambitions. China has introduced a comprehensive set of environmental laws and regulations, but these have not brought the expected improvements in environmental quality. To achieve better outcomes, China needs to overcome what has been called the “paradox of advanced legislation but weak enforcement.” So far, environmental policy making has often favored narrow technical and engineering solutions over institutional development and economic approaches. Strengthening the incentives and accountabil-ity framework for environmental manage-ment requires addressing many interrelated challenges, including the following:
• First,byinternationalstandardsandgiventhe size of the problem, China’s national-level environmental management capacity is relatively small and should be increased, while many local environmental protec-tion bureaus need more resources and authority to enforce compliance.
• Second, incentives to implement envi-ronmental policies and complete comple-mentary sector reforms have been weak.
448 U r b a n C h i n a
Changing the cadre evaluation system would encourage local leaders to pursue sustainability goals more forcefully, and extending their tenure, which has dropped over the past decade, would promote lon-ger-term thinking.
• Third,morechannelsareneededforpub-lic participation, which in practically all industrial countries is a key element for catalyzing demand for better environ-mental protection and a higher quality of life. Three main channels could be fur-ther opened to complement government efforts: consultation on policy design and projects, with a greater role for environ-mental nongovernmental organizations (NGOs); facilitation of stronger actions against polluters by adequately resourcing the formal complaint systems at local lev-els and by broadening access to the emerg-ing environmental court system; and more public disclosure including use of public environmental performance ratings and strengthening of the Open Environmental Information initiative, a program of the Ministry of Environment (MEP).
• Fourth,thereisaneedtosharpenthemixof policy instruments. The most effective instrument to induce resource efficiency and lower pollution is pricing. China has removed many environmentally harmful subsidies and other distortions, but tariffs for energy, water, and other resources do not always fully reflect both the cost of providing them and the external costs that resource production and use impose on health, ecosystems, and the climate. Solid waste tariffs reflect only 10 percent of the cost of services, for instance, and should be adjusted. Road and congestion pricing, even higher parking rates, would more accurately reflect the full cost of using private vehicles. Pricing distortions in the electricity market could be addressed to create a more even playing field for renew-able energy, including a well-coordinated and clear carbon-pricing policy. Pricing, however, needs to be complemented with strong regulations, setting ambitious tar-gets for pollution controls and limits on resource use, but allowing for more flex-ible and market-based approaches to meet-
ing them, such as trading. Finally, better collection and wide disclosure of cred-ible data, greater consideration of market signals, and more efficient management of trade-offs between sustainability and other development goals will improve the quality and enhance the implementation of environmental regulations. For example, affordability concerns should be addressed more through targeted subsidies rather than preferential residential energy tariffs.
There are numerous causes of environmen-tal problems in China’s cities, and improving urban sustainability requires a multisector approach. Structural shifts in the economy toward cleaner sectors will help, but only over the longer term. Urban infrastructure and energy sector policies that align environ-mental objectives with economic and social objectives therefore need to complement more effective green governance. Greening sec-tor policies will require some action at the national level where broad legal and regula-tory decisions guide local decisions. At local levels, more comprehensive overall planning supports more specific sector reforms. For instance, integrated urban land use, trans-port, and energy planning, by reshaping urban form, help avoid urban sprawl, which is raising the cost of public service provision and locking in wasteful energy consumption in many Chinese cities. And in larger urban clusters, air quality management must operate at a regional scale to account for all relevant pollution sources in the airshed and identify cost-effective regional abatement plans.
Beyond these cross-cutting issues, sustain-able urbanization requires improvements in each sector. The reforms range from the mundane—such as better landfill manage-ment—to the monumental: an energy shift away from coal toward natural gas and a rising share of renewables. The priorities dis-cussed in this report are specific to each sec-tor, but the basic principle across all sectors is to limit environmentally harmful resource use as much as possible and then clean up what cannot be avoided. Resource use effi-ciency is thus the first priority, all the more so because it also yields important co-benefits by raising productivity and promoting eco-

g r e e n U r b a n i z a t i o n 449
nomic growth. Energy intensity reductions during the 11th Five-Year Plan averted the use of 630 million tons of coal equivalent, or 1.46 billion tons of carbon dioxide (CO2) emissions. Pollution control is closely linked with social development objectives. Achiev-ing China’s new air quality standards in all cities would add millions of healthy life years for China’s urban residents. Some of the most important sectoral actions are as follows:
• Encourage a greater shift from private to public urban transport by using price instruments and investments in better service, and reduce pollution by promot-ing cleaner vehicle technology, especially a shift to ultra-low-sulfur diesel and gaso-line, and enforcing fuel quality standards.
• To improve incentives and cost effec-tiveness in meeting the energy intensity reduction targets of industrial enterprises, rebalance regulatory and target-based approaches by introducing market-based policy tools such as tradable energy sav-ings certificates. Further development of technical and financial services for energy efficiency, including deeper penetration of energy savings performance contracting, will also be helpful.
• Lead by example by implementing aggres-sive efficiency programs for public build-ings; establish targets for progressively tightening the energy efficiency code; and broaden the use of benchmarking for exist-ing buildings. Promote green buildings by linking incentives with clearer labeling schemes while strengthening capacities across the supply chain. Phase out harmful construction materials to reduce indoor air pollution in buildings.
• Secure cleaner urban energy sources by minimizing direct use of coal in cities through expanded access to piped natural gas—giving priority to households, com-mercial uses, and district heating—by removing pricing distortions, establish-ing a well-coordinated carbon pricing policy and restarting sector reforms that would establish a more even playing field for clean energy sources to contribute to urban energy supply. Continue to tighten power and heating emissions regulations.
• Ensure an efficient, safe, and secure water supply by reforming water rights systems, by using smart technologies to measure consumption, and by improving regional water resource and pollution discharge governance at the river basin and local lev-els. Expand use of payments for ecological services to address nonpoint source pol-lution challenges, and modernize urban water utility management.
• Improve cost recovery in the solid waste sector to promote waste reduction, recy-cling, and safe disposal, including, in the medium term, life-cycle product steward-ship programs. Improve planning of waste disposal with better environmental impact assessments. Improve waste disposal oper-ations through reduced air and water pol-lution from incinerators and landfills and through proper closure, rehabilitation, and safe reclamation of old landfills.
The task is urgent as the costs of growth mount and as citizens’ demands and expec-tations increasingly include a clean environ-ment. The task is also challenging. No coun-try in the world can claim to have achieved truly green growth, and those that are green-est took decades to get there. But the chal-lenge also provides an opportunity. Stronger environmental actions will further encourage the shift toward cleaner economic activities—towards growth that is built not on energy- and pollution-intensive low-margin produc-tion, but on services and higher-value-added manufacturing as countries such as Germany or Japan have done. Greener growth is a viable goal for China, as also argued by the Development Research Center of the State Council and the World Bank in China 2030 (World Bank–DRC 2013). Progress on reduc-ing pollution will not be fast, and China’s current and future urban citizens will need some patience before their cities resemble their peers elsewhere that started this transi-tion much earlier. But China has proven that it can implement major transformations more quickly than other countries, as the unprec-edented scale and pace of its economic devel-opment shows. By continuing the tradition of adapting lessons from elsewhere to local needs and developing their own innovative
450 U r b a n C h i n a
solutions, China’s cities will become not just great places to make a living, but also great places to live.
The challenge of sustainable urban growthIn 1997, a World Bank report titled “Clear Water, Blue Skies” reviewed China’s environ-mental challenges. Fifteen years later, its find-ings and recommendations sound strangely familiar. Looking at the 15 years before 1997, when China’s urban population grew from 191 million to 352 million people, the report documented high air and water pol-lution levels with large impacts on public health but also pointed to the many policy efforts under way to rein in pollution and the many successful initiatives for stabilizing or even reducing environmental problems such as urban air pollution. The report’s hopeful conclusion was that “new policies and care-ful investments made today [in 1997] mean that China’s children and grandchildren would also enjoy clear water and blue skies [by 2020]” (World Bank 1997, 3). This pros-pect still seems distant as China’s economic growth since the late 1990s exceeded not only the most optimistic expectations but also the capacity of environmental institutions to keep pollution and resource depletion in check. Some key challenges are the following:
• The main source of air pollution in China comes from its dependence on coal for energy, and total energy use increased six times to fuel an economy that increased 18 times and meet the needs of a growing industrial sector and an urban population that more than doubled since 1978, when China began its economic reforms (Wang, Berrah, and Peng 2012). This growth in energy demand exceeded all expecta-tions. By 2005, China had already almost reached energy consumption levels pro-jected for 2020 in a joint DRC–Energy Research Institute (ERI) study published in 1999 (Berrah and others 2007). The share of coal in primary energy consump-tion has dropped from 78 percent in 1995 but remained at around 70 percent in 2011 (NBS 2012c). Emissions grew in paral-lel, although concerted efforts have been
made to control particulate matter (PM) and sulfur oxides (SOx), and mono-nitro-gen oxides (NOx) emission standards for power plants were strengthened in 2012. Greenhouse gas emissions also grew. According to the International Energy Agency, China now accounts for about a quarter of global CO2 emissions from burning fossil fuel (IEA 2013a). Shanghai, Beijing, and Tianjin have estimated per capita emissions comparable to large Euro-pean and even some North American cities (Sugar, Kennedy, and Leman 2012).
• While air pollution has grabbed recent international headlines, China’s cities also face serious challenges in the quality and quantity of water. Nationwide, urban water supply falls short of demand by 6 billion cubic meters a year. The Ministry of Land Reclamation and Water Resources reports that 430 of 657 cities face water shortages; 110 of these had “severe” short-ages (OECD 2009). The MEP reported 57 percent of the groundwater in 198 cities in 2012 was rated “bad” or “extremely bad,” while more than 30 percent of the coun-try’s major rivers were found to be “pol-luted” or “seriously polluted,” making their waters unfit for drinking or direct human contact (MEP 2013).1
• Municipal and industrial solid waste gen-eration increased from about 1.2 billion to 2.6 billion tons between 2003 and 2010 and is expected to double by 2030—chal-lenging the waste management systems in many cities. Urban residents represent 53 percent of the population, but generate 80 percent of the total waste amount.
As alarming as these trends are, there are some positive notes as well. The increase in energy consumption could have been much higher if it had paralleled economic growth, which averaged about 10 percent between 1990 and 2010. But China’s economy also became more efficient in using energy during this period, as energy intensity fell by an aver-age of 4.7 percent a year (figure 7.1). This is an impressive achievement even though a full decoupling—with the economy continuing to grow while energy use and carbon emissions are held constant or decline—has not been attainable with such high economic growth

g r e e n U r b a n i z a t i o n 451
rates. Second, the trend over the past years has been a reduction of average annual con-centrations of PM10 (fine particulates with a diameter of 10 micrometers or less) despite the large increase in energy consumption (figure 7.2). Abatement policies have had an effect, although particulate matter concentra-tions in large cities remain unacceptably high. A third reason to be optimistic is that some experts expect a further slowing of energy consumption and resource use thanks to the restructuring of the economy. While still more is needed, a large share of the infrastructure to accommodate expected urban growth has been built, and more efficient technol-ogy is becoming more widely available—and is often produced—in China. These broader trends could provide a welcome tailwind for ambitious public policies aimed at greater resource efficiency and pollution abatement.
The rising cost of environmental degradationThese successes are no cause for complacency because environmental degradation con-tinues to compromise social and economic development objectives. Understanding of the severe health impacts of air pollution is grow-ing, especially the effects on small children
and infants, including higher rates of infant mortality, birth defects, and impaired cogni-tive functions (Currie and Neidell 2005; Cur-rie and Vogl 2012; Padula and others 2013).Estimates of mortality from air pollution in China are staggeringly high. Despite falling average annual PM10 concentrations, impacts have been increasing, in large part because more people now live in cities. Two hundred million more urban residents were exposed to high air pollution levels in 2010 compared with the beginning of the decade. Estimated annual premature mortality from air pollu-tion in Chinese cities increased from 418,000 to 514,000 between 2001 and 2010 despite a 25 percent reduction in average PM10 (Cheng and others 2013). The recent Global Burden of Disease update issued by the World Health Organization (WHO) presents an even higher estimate of 1.2 million premature deaths in China in 2010 (HEI 2013).2 The impacts of water pollution are less well researched. Water pollution contributes to China’s rising cancer rates. Digestive cancers, for instance, increase by almost 10 percent with a one-grade deterioration of water quality (on a six-grade scale) (Ebenstein 2012).
These high mortality levels and other health damages have high economic costs. Because of differences in methodologies, esti-
Figure 7.1 Fast economic growth outpaced improvements in efficiency
Source: IEA, World Energy Statistics and Balances (database), doi:10.1787/data-00510-en.Note: CO2 = carbon dioxide.
Economic growthEnergy use
CO2 emissionsEnergy intensity
Inde
x (1
990
= 10
0)
100
1000
101990 1995 2000 2005 2010
Figure 7.2 Air pollution declined over time and has recently been stable: PM10 concentrations
Source: Renmin University 2013, based on China Environmental Yearbooks.Note: Data for 2000 and 2001 not comparable due to change in monitoring systems; m3 = cubic meters; PM = particulate matter.
Mic
rogr
ams p
er m
3
80
160
0
100
20
120
40
140
60
1997 2001 20092005 2011
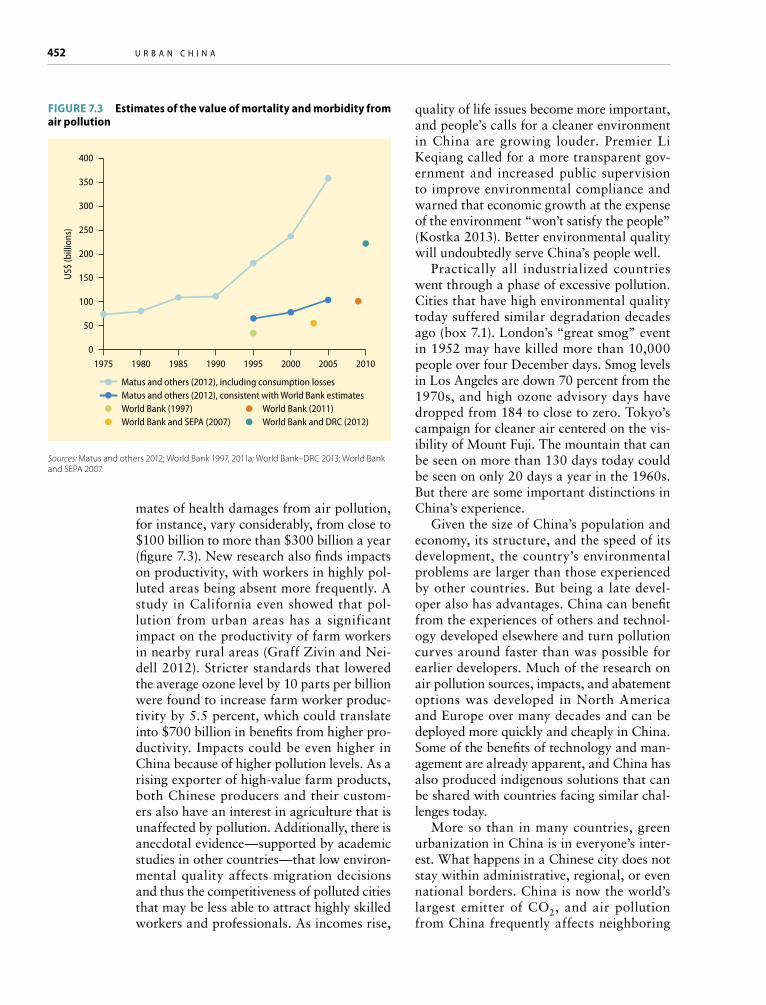
452 U r b a n C h i n a
mates of health damages from air pollution, for instance, vary considerably, from close to $100 billion to more than $300 billion a year (figure 7.3). New research also finds impacts on productivity, with workers in highly pol-luted areas being absent more frequently. A study in California even showed that pol-lution from urban areas has a significant impact on the productivity of farm workers in nearby rural areas (Graff Zivin and Nei-dell 2012). Stricter standards that lowered the average ozone level by 10 parts per billion were found to increase farm worker produc-tivity by 5.5 percent, which could translate into $700 billion in benefits from higher pro-ductivity. Impacts could be even higher in China because of higher pollution levels. As a rising exporter of high-value farm products, both Chinese producers and their custom-ers also have an interest in agriculture that is unaffected by pollution. Additionally, there is anecdotal evidence—supported by academic studies in other countries—that low environ-mental quality affects migration decisions and thus the competitiveness of polluted cities that may be less able to attract highly skilled workers and professionals. As incomes rise,
quality of life issues become more important, and people’s calls for a cleaner environment in China are growing louder. Premier Li Keqiang called for a more transparent gov-ernment and increased public supervision to improve environmental compliance and warned that economic growth at the expense of the environment “won’t satisfy the people” (Kostka 2013). Better environmental quality will undoubtedly serve China’s people well.
Practically all industrialized countries went through a phase of excessive pollution. Cities that have high environmental quality today suffered similar degradation decades ago (box 7.1). London’s “great smog” event in 1952 may have killed more than 10,000 people over four December days. Smog levels in Los Angeles are down 70 percent from the 1970s, and high ozone advisory days have dropped from 184 to close to zero. Tokyo’s campaign for cleaner air centered on the vis-ibility of Mount Fuji. The mountain that can be seen on more than 130 days today could be seen on only 20 days a year in the 1960s. But there are some important distinctions in China’s experience.
Given the size of China’s population and economy, its structure, and the speed of its development, the country’s environmental problems are larger than those experienced by other countries. But being a late devel-oper also has advantages. China can benefit from the experiences of others and technol-ogy developed elsewhere and turn pollution curves around faster than was possible for earlier developers. Much of the research on air pollution sources, impacts, and abatement options was developed in North America and Europe over many decades and can be deployed more quickly and cheaply in China. Some of the benefits of technology and man-agement are already apparent, and China has also produced indigenous solutions that can be shared with countries facing similar chal-lenges today.
More so than in many countries, green urbanization in China is in everyone’s inter-est. What happens in a Chinese city does not stay within administrative, regional, or even national borders. China is now the world’s largest emitter of CO2, and air pollution from China frequently affects neighboring
Figure 7.3 estimates of the value of mortality and morbidity from air pollution
Sources: Matus and others 2012; World Bank 1997, 2011a; World Bank–DRC 2013; World Bank and SEPA 2007.
Matus and others (2012), including consumption lossesMatus and others (2012), consistent with World Bank estimatesWorld Bank (1997)World Bank and SEPA (2007)
World Bank (2011)World Bank and DRC (2012)
US$
(bill
ions
)
200
400
150
350
100
300
50
250
01975 1980 1985 1990 1995 2000 2005 2010

g r e e n U r b a n i z a t i o n 453
In December 1952, London experienced an unusual cold spell, prompting greater than normal coal burn-ing for heating. Although air pollution had been a problem for many years, from December 5 to Decem-ber 9, London was covered by a thick blanket of what became known as the “Great Smog of ’52.” This event coincided with 4,500 more deaths than would normally have been expected. Later research esti-mated that almost three times as many fatalities could be attributed to persistently high air pollution during that winter.
The dangers of low air quality were known to Londoners as early as 1661, when John Evelyn pre-sented evidence to King Charles II that smoke pol-
Box 7.1 reducing severe air pollution in London and in Tokyo
lution increases mortality. But it was not until the London smog incident that major pollution control legislation was passed, in the form of the Clean Air Act of 1956, which was subsequently expanded. Most importantly, the law regulated the use of domestic fires and encouraged the replacement of coal with natural gas or electricity for heating. Air pollution began a steady decline, even though London experi-enced another major smog event in December 1991 that caused about 160 deaths and could likely have been prevented by more ambitious air pollution poli-cies. It was not until the mid-1990s that the United Kingdom adopted specific air quality standards in response to EU requirements (figure B7.1.1).
Box sources: Ren 2000; Bell, Davis, and Fletcher 2004; Hutchinson and others 2004; Okubo 2013.
Figure B7.1.1 Air pollution concentrations in London and Tokyo, 1950–2013
Source: Data provided by David Hutchinson (Urban Research) and Arata Ichihashi (Tokyo Metropolitan Government).Note: For Tokyo, particulates (or dust) for 1966-1983 were measured using a light scattering method. Data for 1984–2013 show suspended particulate matter (SPM) as measured by beta attenuation monitoring.
Sulphur dioxide Black smoke Suspended particulates
0
50
100
150
200
250
300
350
400
450
1950 1960
a. London b. Tokyo
1970 1980 1990 2000 2010
Mic
rogr
ams p
er m
3
0
50
100
150
200
250
300
350
400
450
1960 1970 1980 1990 2000 2010
Mic
rogr
ams p
er m
3
In Tokyo, every day since January of 1963, observ-ers at the Seikei Meteorological Observatory have recorded whether they can see Japan’s highest moun-tain, Mount Fuji, 83 kilometers away. The 1960s were a period of fast industrial growth in Japan that came with an equally rapid increase of soot, dust, and sulfur oxides (SOx) in the air. While the government was initially slow to respond to severe air pollution, citizen groups soon demanded stronger action. See-ing Mount Fuji again, which in 1965 was possible on only 20 days, became a rallying cry for Tokyo resi-dents. Public pressure was further fueled by a series of environmental crises including the 1970 “Yokkaichi Asthma” incident—an outbreak of
severe chronic pulmonary disease, emphysema, and asthma among residents near a large petrochemi-cal complex in Mie Prefecture south of Kyoto. The government was finally compelled to issue a slew of environmental rules in a special legislative session that became known as the “Pollution Diet.” The new rules required factories to report their activities, strictly regulated industrial emissions, and, as trans-port emissions replaced those from manufacturing as the most important problem, imposed tight pollution regulations on vehicles. Air pollution dropped rapidly between the mid-1960s and 1970s. In 2011, observers at Seikei Observatory saw Mt. Fuji on a record num-ber of 131 days.

454 U r b a n C h i n a
Japan and the Republic of Korea and can be carried in the jet stream for thousands of miles. North America and Europe still exceed China’s cumulative historical greenhouse gas emissions, but, according to IEA data, China’s per capita CO2 emissions from fuel combustion of 5.4 tons in 2010 are still rising and are likely to reach the EU average by the middle of this decade (IEA 2013a, 2013c).
Finally, in contrast to experience else-where, a large share of China’s pollution came initially from the expansion of dirty industries that were being phased out in developed countries. One estimate suggests that exports account for about one-third of China’s energy use, and likely a similar share of air pollution (Weber and others 2008). China’s export of CO2 emissions embedded in manufactured products has risen sharply in the 2000s (figure 7.4). This happened even as its manufacturing sector became cleaner simply because exports increased so much. On balance, these trends were prob-ably beneficial to China and to its trade part-ners. Europe and North America were able to green their production and access low-cost goods, but at the cost of sometimes pain-ful economic restructuring at home as dirty industries closed down. China’s industrializa-
tion helped lift hundreds of millions out of poverty, but at the cost of heavy pollution in its cities where the lower environmental stan-dards at the time were among its compara-tive advantages. By shifting toward a growth model based more on services and consump-tion, China will be able to pollute less on behalf of other countries. On the other hand, global patterns appear to be replicated within China as coastal provinces have now become major importers of embedded CO2 from inte-rior areas (Feng and others 2013).
The past 15 years have yielded much bet-ter information about the sources and con-sequences of environmental problems in China. There have been promising develop-ments, but excessive environmental burdens remain a major challenge. Much of what was written in the 1997 World Bank report could be written today. Will a report writ-ten 15 years from today be able to present a more positive appraisal? Much will depend on whether Chinese leaders can strengthen green governance to increase everyone’s incentives for more ambitious greening, and whether provincial and local decision mak-ers can implement sustainable sector policies that align greening with social and economic objectives.
Figure 7.4 global net transfers of Co2 emissions embedded in traded goods, 1991–2008
Source: Peters and others 2011.
China Russian Federation France United KingdomJapan German United States Spain
Tons
of c
arbo
n di
oxid
e (m
illio
ns)
Net
impo
rter
sN
et e
xpor
ters
1,400
1,200
1,000
800
600
400
200
0
–200
–400
–6001991 1994 1997 2000 2003 2006 2008

g r e e n U r b a n i z a t i o n 455
green governance must match China’s green ambitionsChina has one of the most comprehensive sets of environmental laws and regulations in the world. Since 1970, it has “enacted eight pollution control laws, 15 natural resources laws, over 50 environmental protection administrative regulations, over 200 depart-mental regulations and other regulatory documents, more than 1300 national envi-ronmental standards, more than 1600 local environmental regulations, and has approved and signed 51 multilateral international envi-ronmental treaties” (M. Zhang and B. Zhang 2012, 1). Yet, this growing body of laws and rules has not ensured environmental compli-ance by private and state-owned firms. Major pollution incidents are frequent, and persis-tent pollution continues to foul the air, land, and water in Chinese cities. How can China overcome this “paradox of advanced legisla-tion and weak enforcement” (M. Zhang and B. Zhang 2012, 5)?
Investments in specific sectors, discussed in later sections, will increase resource use efficiency and reduce pollution. But the technical know-how or even the financial resources for these investments are not the primary problem holding back green prog-ress. The fundamental problem is inadequate green governance—the institutions, incen-tives, and instruments that enable effective environmental management. There are four main ways in which China can make envi-ronmental management more effective:
• Increase resources: By international stan-dards and given the size of the problem, China’s environmental management capacity is relatively small—especially at the national level—and environmental agencies often lack sufficient authority to enforce compliance.
• Strengthen incentives: The current evalu-ation system for local officials, who are the primary authority for implementing environmental policies, puts insufficient weight on improvements in the quality of life of residents.
• Open more channels for public participation: Citizens’ opportunities for contrib-
uting to the enforcement of green regula-tions, including those through the legal system, are still inadequate—in part because of limited access to information on the performance of environmental management authorities and the polluting activities of firms.
• Employ sharper instruments: Reflecting a strong emphasis on technical expertise in government, regulations and target-based approaches dominate, while economic and market-based instruments that can some-times be more efficient remain underused.
Although governance is difficult to mea-sure and formal evaluations are scarce, China has made progress in all of these areas. The government has announced increases in funding for pollution control. With ris-ing incomes, local policies are shifting from a sole emphasis on growth to more balanced objectives. Individual citizens and organized groups are more and more active in environ-mental advocacy work, and initial steps have been taken toward full public disclosure of environmental information. And, finally, price instruments and market-based mecha-nisms such as pilot carbon markets play an increasing role in promoting resources con-servation and pollution control. Yet, as this chapter shows, in all of these areas more progress is possible.
greater resources for effective environmental management
Achieving China’s green goals requires stron-ger institutions responsible for designing and enforcing environmental rules. Gov-ernment spending on environmental pro-tection has been around 1 percent of gross domestic product (GDP) (World Bank–DRC 2013). That is similar to average GDP shares for public spending on the environment in countries belonging to the Organisation for Economic Co-operation and Development (OECD), although EU levels are at about 1.9 percent when including expenditures by gov-ernment-controlled environmental agencies such as water treatment plants.3 China’s cur-rent expenditures represent an increase from the past, and, in response to recent pollution

456 U r b a n C h i n a
problems, the government announced addi-tional resources. Required initial spending to adequately address China’s environmen-tal problems is estimated at 0.5 percent of GDP above current levels (World Bank–DRC 2013). Conservative estimates put annual damages from environmental degradation at 3.5 percent of GDP in 2010, according to the Chinese Academy of Environmental Planning.4
The lack of sufficient resources is reflected in lower staffing levels at China’s national environmental institutions. The Ministry of Environmental Protection has about 400 staff in Beijing, about 2,000 in affiliated institutions (shiye danwei) and 500 in five regional offices.5 Compare that to the more than 17,000 who work at the U.S. Environ-mental Protection Agency, two-thirds of whom are based in regional offices. MEP, serving a population that is four times larger and arguably facing more severe challenges, has fewer resources available for centralized environmental management functions such as national collection and dissemination of data, research, policy and regulatory development, and supervision of large polluters than its North American or European counterparts.
Provincial and local environmental man-agement is the responsibility of the environ-mental protection bureaus (EPBs), whose staff numbers increased from 105,900 in 1998 to 166,800 in 2005 (Li and Higgins 2013, 412) and about 192,000 today.6 While notionally partly accountable to MEP, EPBs mainly report to local governments and are dependent on them for funding and promo-tions. Local EPB budgets vary by region. In poorer parts of the country, budgets tend to be small, leading to staff shortages, lack of inspection and testing equipment, and inad-equate skill development. Some EPBs located in regions experiencing rapid economic growth have not received funding increases that match their expanded obligations.
For instance, Kunshan City in Suzhou municipality in Jiangsu had a level of eco-nomic development in 2011 that was much higher than that of several of the poorer prov-inces in China, yet Kunshan’s administra-tive status remained that of a county (Chien 2013; Kostka 2013). This “big foot in a small
shoe” (dajiao chuan xiaoxie) problem has sometimes adversely affected the work of the EPB. EPBs in these fast-growing urban areas complained that allocated resources and their rank did not match the higher workload. Some local governments and EPB leaders have tried to overcome inadequate budgets for environmental or restructuring projects by using debt financing or land sales, as has been the case in Datong City in Shanxi (Eaton and Kostka 2013). Inadequate funding means that local-level staff and managers often lack sufficient qualifications and training oppor-tunities to cope with rising challenges. Fur-thermore, because of the current government officials’ selection and appointment practice, only a quarter of EPB directors came from within the EPB system (figure 7.5)
EPBs also often depend on fines collected from polluters for funding. In one EPB in Central China, only 24 of 157 employees were covered by central government fund-ing; the remaining 133 were supported by pollution fees.7 Among six surveyed coun-ties in Henan Province in 2009, 79 percent of staff were paid from fines paid by local firms. When the EPB staff’s “daily bread comes from pollution fees,” as one county EPB director put it, they have no incentive to increase fines to a level that would exceed damages or compliance costs and cause firms to stop polluting. It is not clear whether these reports are isolated cases or form a wide-spread pattern,8 but they do imply that the
Figure 7.5 only a quarter of provincial ePB directors came from within the organization
Source: Kostka 2013.Note: EPB = environmental protection bureau.
From anotherprovincial
departmentParty functioncommittee
Others
Within theEPB
Municipalmayor or
Partysecretary
26%
23% 13%
32%
6%

g r e e n U r b a n i z a t i o n 457
steady flow of fines may lead to overstaff-ing of some local bureaus without increas-ing their effectiveness. In addition, pollution fines and collection rates are generally low, and penalties do not generally increase for repeated violations (Economy 2010). That is in contrast to the U.S. Clean Water Act, for example, under which daily penalties can be imposed on noncompliant polluters.
Besides lack of funding, environmental management agencies in China also do not have sufficient authority to enforce regula-tions. Provincial EPBs have the authority to impose “regional investment restrictions” by holding up environmental approvals of new projects. But because EPBs report to provin-cial and local governments, local officials can override environmental concerns when they conflict with other objectives. Because EPBs rank relatively low in the administra-tive hierarchy, leaders of state-owned enter-prises (SOEs) that operate nationally or internationally often outrank those who supervise their environmental compliance—a constraint often referred to as the “central SOE problem.” Especially where an SOE or even a private firm dominates a local econ-
omy, local leaders have few means and little incentive to enforce regulations. In fact, where one or a few large firms dominate a municipality, there tends to be less disclosure of environmental information, especially if the dominant firms are in heavily polluting industries (Lorentzen, Landry, and Yasuda 2014). Enforcement authority varies among other agencies responsible for attaining environmental objectives.9 For example, the National Development and Reform Commis-sion (NDRC), which is responsible for energy efficiency, has relatively strong influence through investments and financing. Local water and resource bureaus, which monitor surface water quality, on the other hand, have fewer enforcement tools. One such munici-pal bureau in Hunan Province was not only unable to penalize firms that violated water consumption regulations, it could not even obtain value-added figures for local firms from the statistical bureau to estimate their water consumption (Kostka 2014). Recently there have been some hopeful signs that strong leadership at EPBs are able to address some of these problems even if the low fines remain an ineffective deterrent (box 7.2).
In June 2013, the local environmental protection bureau (EPB) of Anqing Municipality in Anhui charged the central state-owned enterprise (SOE) Sinopec Anqing with a RMB 90,000 fine for pollut-ing the air. The fine was triggered by a production accident that in May 2013 caused black smoke to leak from Sinopec’s production facilities. The fine was one of the first of its kind, because local EPBs usually have no authority to charge pollution fees to central SOEs. Often managers of local branches of central SOEs also hold concurrent posts within the locality; the general manager of Sinopec Anqing, for instance, is concurrently also a member of the Anqing Munici-pal Standing Committee, a powerful position in the locality. The Anqing case could be a signal to other local EPBs to be bolder in addressing the “yangqi [central state-owned enterprise] problem.” However, the RMB 90,000 fine is relatively low for a central SOE and does not fully reflect the considerable local
Box 7.2 Addressing the “central Soe problem”
ecological and health damage resulting from Sino-pec’s pollution.
Two factors help to explain why the municipal EPB in Anqing dared to fine the central SOE:
• Publicmonitoringwasanimportantstimulus:After the accident in May 2013, many citizens in Anqing complained about the pollution and posted pictures to the Internet.
• StrongEPB leadershiparose: Inearly2013,Anqing Municipality assigned a high-ranked local leader—a former vice mayor—to lead the municipal EPB. The new leader frequently vis-ited the provincial EPB bureau and MEP to gain upper-level government support. The local EPB head’s high ranking together with the support from national level made charging the new fee possible.
Source: Kostka 2013.

458 U r b a n C h i n a
Strengthening the capacity of institu-tions for environmental management should also include improvements in the collection and wide dissemination of relevant data. Much progress has recently been made in collecting air quality data, including the recent establishment and real time release of monitoring data for PM2.5 (very fine par-ticulates with a diameter of 2.5 micrometers or less) in 74 cities. MEP plans to expand this system to more than 300 prefecture-level cities. But monitoring networks for many environmental indicators are still sparse. Provincial EPBs, but no local EPBs, are able to assess the 106 indicators defined in the new water quality standards (Qu and others 2012). Reporting protocols for environmental performance data are not very rigorous, allowing local institutions too much flexibility in what and how they report (box 7.3).
In response to recent environmental cri-ses China’s government has announced new financial resources for mitigating pollution
problems. Some of those resources could be allocated to strengthen the policy develop-ment and enforcement capacity of MEP and its affiliated institutes. At the local level, additional resources in capacity and tech-nology for monitoring will also be needed. Additional administrative changes could disconnect the funding for local EPBs from the collection of pollution fees, but without removing the incentive to go after polluters. Fines and pollution fees can be an important source of funding for environmental man-agement, but, as in most countries, revenue should flow into general budgets from which EPBs would then be financed. A more dif-ficult problem will be to make local EPBs more independent, especially in enforcement action, without reducing the responsibility of local governments for environmental out-comes. That may require stronger oversight and performance monitoring from provincial and national authorities, combined with bet-ter incentives for local officials and greater scope for public participation.
Shortage of advanced monitoring equipment at the local level hinders the verification of environmental outcomes. The verification of environmental tar-gets differs depending on available technologies and forms of monitoring systems. For chemical oxygen demand (COD), a measure of water quality, and SO2 targets, monitors are installed in larger companies. This monitoring equipment is often not very techni-cally advanced, is unreliable, and is limited in num-ber (Kostka 2014). For energy intensity targets, no purpose-built monitoring equipment is in place, and reports rely on self-reported figures from enterprises. Self-reported online data are sent to the local statisti-cal bureau, which then collates sheets of data. Only data from very large enterprises are shared directly with the provincial and national statistical bureaus. A government official explains:
Enterprises report their energy consumption through an online reporting system. Selfreporting by enterprises is problematic,
Box 7.3 The three baos of data reporting
because there are three kinds of bao [reporting]. There is luanbao, which refers to messy data that [lack] logic. Often accountants enter the data into the online sheets but they lack training on energy bookkeeping, so they often make mistakes. There is manbao, which refers to companies underreporting production figures because they fear that this information is shared with the local taxation bureau. Because companies are afraid that they would have to pay more taxes, they do not report real production numbers. Finally, there is tuobao, where companies simply delay reports.
Because the self-reported data from enterprises col-lected by the statistical bureau are so poor, one official admitted that he collects his own data from the town level, including data for both large and smaller enter-prises. According to him, his independently collected data are more accurate, but for official purposes, he still has to use the data from the statistical bureau.
Source: Kostka 2013.

g r e e n U r b a n i z a t i o n 459
Stronger incentives for local governments
The disconnect between the national govern-ment’s environmental goals and local imple-mentation is also a reflection of insufficient incentives for local governments to improve environmental outcomes and for firms to reduce resource consumption and avoid pol-lution. Local government officials who do not see sufficient benefits or penalties for environ-mental performance will focus on other pri-orities. National directives and local priorities continue to encourage a dominant concern for economic growth targets over social and environmental objectives. As one local leader said: “It is like a constrained maximization problem (youyue shue de jidahua): We try to maximize GDP and fiscal income, but we meet only the bare minimum of environmen-tal standards. This is of course not always efficient for the environment” (Kostka 2013).
Such attitudes are reinforced by promo-tion criteria that put relatively little weight on environmental quality achievements. This system is formalized in the government’s per-formance assessment system, which gives dif-ferent weights to targets in the cadre evalu-ation forms (kaohebiao). Economic targets tend to overshadow social and environmental targets. In one Shanxi county 2011 evalua-tion form, government officials could reach up to 28 points for meeting economic targets, 19 points for improving people’s lives, 11 points for social development, 14 points for resources and environment, and 13 points for social safety (Eaton and Kostka 2013). Envi-ronmental goals thus accounted for, at most, 16 percent of the total performance score. Consequently, one EPB official said: “Envi-ronmental and energy targets are binding tar-gets but they are not our ultimate targets. No leader will be promoted because of their better achievements in environmental protection and energy savings. GDP growth is still the tar-get that we work hardest to achieve” (Kostka 2013). A recent statistical analysis confirms that environmental improvements are uncor-related with probability of promotion, while spending on transport, for instance, promotes GDP growth and thus career advancement (Wu and others 2013). Given the long list
of central government directives, local lead-ers therefore act rationally by investing their time and resources in other objectives that are more likely to advance their career. This pat-tern will not change unless promotion criteria are revised and penalties for nonachievement increased.
The relatively short tenure of local cadres also reduces their incentive to invest in envi-ronmental projects whose benefits may only be apparent after some years. Nominally 5 years, the average tenure of local mayors and party secretaries has dropped from 4.2 years in the 1993–2001 period to 3.3 years dur-ing 2002–11 (Kostka and Yu 2014). Provin-cial DRC heads stay an average of 3.6 years and provincial EPB directors 4 years. While there are some advantages of periodic turn-over to bring in fresh ideas, short tenure times encourage a focus on projects with short-term results that increase promotion odds rather than on more complex restructuring or pol-lution mitigation efforts whose benefits are in the future and that may be stopped by one’s successor (Eaton and Kostka 2014). Extended tenures would encourage long-term thinking and more emphasis on quality of life issues in evaluation systems. Xiaoyi in the coal country of northern Shanxi province turned itself into an attractive place to live under the leadership of a locally rooted group of policy makers who built constructive relationships with residents and local industry (box 7.4).
Further reducing the effectiveness of envi-ronmental policy implementation is that local decision makers frequently concentrate on the appearance of environmental gains rather than on cost-effective greening. In selecting environmental investments, many local lead-ers thus favor “political accomplishment proj-ects” (zhengji gongcheng) over more efficient solutions. In Shandong Province, one county plans to build water treatment plants in each town to show progress in implementing the 12th Five-Year Plan, rather than upgrade a centralized larger plant more cheaply (Kostka 2013).
There are some signs that these problems are being addressed. Promotion criteria have begun to change, and Zheng and others (2013) find that this is having an impact on local policy makers’ environmental achieve-

460 U r b a n C h i n a
ments, especially in cities where mayors have better education levels. China’s government can accelerate this process by further reform-ing the reward and incentive system for local officials. Together with increasing public involvement (discussed in the next section), stronger incentives will put pressure from two directions on local officials to improve environmental performance.
More channels for public participation
In practically all industrial countries, envi-ronmental management has become stricter over time largely as a response to vocal pub-lic demand for better protection from pollu-tion and for a higher quality of life. China is no exception. As incomes and access to information increase, public pressure on pol-luters directly and on governments charged with environmental management will con-
tinue to grow. Public participation—whether by individuals, by grass-roots initiatives, or by well-organized NGOs—plays a vital and constructive role that complements official efforts but does not replace it. The public’s concern often focuses on visible problems such as air pollution, while less visible or long-term problems such as sporadic toxic releases or soil contamination can be just as bad or even more dangerous. Most people also react most to problems in their own backyard (although NGOs tend to have a broader perspective). So the problems identi-fied by well-educated people, who are often more vocal and well connected, might receive a disproportionate amount of attention. Pub-lic participation is therefore no substitute for the government’s investment in environmen-tal monitoring and enforcement.
Yet, public participation will be an impor-tant factor in the success of China’s efforts
Xiaoyi County in northern Shanxi effectively man-aged to co-opt local businesses into sharing the burdens of green growth and economic restructur-ing. Xiaoyi is a resource-based economy with an undiversified, coal-dependent industrial structure in the midst of transformation. Leaders in Xiaoyi’s leadership group have cooperated closely with local businesses to share the burden of reducing Xiaoyi’s coal dependence. Strikingly, local coal enterprises, many of which are privately owned, have actually been given soft targets in local plans for investment in economic transformation projects: “Coal produc-tion enterprises should each launch non-coal projects of between one and two billion RMB; each coking enterprise should launch projects of one billion RMB or more in non-coal or downstream processing proj-ects.” (Xiaoyi Government Work Report 2011, 20). In addition, Xiaoyi leaders have effectively bundled coal restructuring with the goal of developing non-coal industries by providing incentives for former coal bosses whose enterprises were eliminated as part of a 2006 industry clean-up to start greener businesses. For instance, with government backing, a former mine owner whose enterprise was shuttered brought a Walmart outlet to Xiaoyi and also has a new business marketing agricultural products.
Box 7.4 Co-opting local businesses into green growth in xiaoyi
Xiaoyi’s greening growth strategy has built up gradually with guidance from a strong and locally rooted leadership group. Recent party secretaries in Xiaoyi have served for an average of 8.3 years and mayors an average 6.2 years, much longer than the average tenure of local leaders of three to four years. A unique characteristic of Xiaoyi is that leaders from elsewhere put down roots in Xiaoyi: “Most of the Party secretaries, mayors and CCP Organization Department heads are from outside. But they all settle down here.” The attractiveness of Xiaoyi as a place to live (good primary and secondary schools, high envi-ronmental quality, and a developed entertainment industry) does seem to have contributed to its success. Living environment is often cited as an important factor in luring investors, but the example of Xiaoyi shows that it also may be important in attracting and retaining able government leaders.
This continuity helped Xiaoyi’s leadership group make very effective use of the relationships it has built over time with local industry. Leadership continuity likely contributed to the leaders’ success in secur-ing investment because investors could be confident that plans would not shift radically with personnel changes in the leadership group.
Source: Kostka 2013.
g r e e n U r b a n i z a t i o n 461
to improve the environment. Citizens can currently have influence through three main channels: the consultation process that is part of the environmental impact assessment of large public and private projects, various public complaint mechanisms, and the legal system. For these channels to be effective and efficient, citizens must have access to credible and up-to-date information about pollution and emissions from companies. Progress on public disclosure of such information has been made in some parts of China, but infor-mation release is still too much up to the dis-cretion of firms and local officials.
As in other countries, NGOs play an important role in facilitating public partici-pation in China (Kostka 2013). There are an estimated 1,000 registered environmental NGOs (or ENGOs) and an equal number of unregistered ones. Those that have been most influential have often been closely associated with governmental organizations (government-organized NGOs, or GONGOs). They can more easily bridge the gap between civil society and the state but have sometimes been criticized for not being as forceful in pur-suing environmental objectives as more inde-pendent ENGOs, who still often run into the limits of what the government considers an acceptable role for NGOs (Hildebrandt 2011; Wu 2013). ENGOs could become more effec-tive in helping achieve China’s green goals if they had more opportunities to participate in policy design and formulation and not just implementation. ENGOs are far more influ-ential in China’s large international cities, especially Beijing, Shanghai, and Guangzhou. Officials in other parts of China too often see them as adversaries rather than as stake-holders, which limits their role, for instance, in environmental education, advocacy, and monitoring of environmental compliance. ENGOs can also play an important role in promoting sustainable lifestyles—an essential task for China to build up awareness and sup-port for green actions and to build a market to demand greener products.
Environmental impact assessments
The earliest mechanism for the public to pro-vide input to environmental decision making was through participation in environmental
impact assessments (EIAs), which were first introduced in China in 1973 (M. Zhang and others 2012). The guiding concept for EIAs is the “three simultaneities”: any major project should anticipate adverse impacts on the environment by designing, construct-ing and operating protective measures dur-ing the project cycle. By the 1990s, EIAs for international cooperation projects started to include public consultation. In 2003, the Environmental Impact Assessment Law spe-cifically stated that if a project involves the environmental interests of the general public, inputs from stakeholders, experts, and the general public need to be collected. EIAs have become one of the main instruments for envi-ronmental protection. They have been effec-tive in significantly modifying or preventing some projects that could have caused large environmental damages, including the Panyu Waste Incineration Project or the Shanghai-Hangzhou Maglev train line (Zhao 2010).
But there are weaknesses both in the EIA implementations generally and in their par-ticipatory components. EIA compliance is mandatory only for a relatively small num-ber of projects and often weakly enforced. Large companies sometimes fail to perform EIAs, instead paying relatively modest fines. In soliciting inputs from the public, EIAs often pick an unrepresentative sample of respondents and allow public comments for only a short period early in the process when the full implications of the project are not yet clear. There is often too little opportunity for face-to-face consultation. Recently, the cen-tral government has endorsed a strengthening of public participation in EIAs. What would help most would be a shift in the mindset of local officials about the value of the public’s feedback, more rigorous methodologies for questionnaire design and feedback collection, and clearer operational rules for public par-ticipation throughout the project cycle (Li, Ng, and Skitmore 2012).
Formal complaint systems. As early as the 1990s. some city governments had estab-lished formal channels through which resi-dents could complain about environmental violations. Many provinces and cities have established 24-hour hotlines that allow citi-zens to register environmental complaints.

462 U r b a n C h i n a
Citizens also can complain directly to local EPBs, which received over 700,000 com-plaints in 2010. With rising access to social media—42 percent of Chinese are now con-nected to the Internet—some local govern-ments have begun using such channels that allow for broader information distribution and feedback collection. The Chengdu EPB, for instance, assigned staff to set up a micro-blog for citizen outreach and information dis-semination. By documenting and publicizing local environmental problems, citizen groups can be effective partners of the government in pursuit of shared environmental goals. As the example in a previous section showed, in May 2013, public monitoring helped encour-age Anqing Municipality in Anhui Province to impose a fine on the production facility of a large SOE after a pollution incident. For-mal complaint systems thus complement the efforts of local agencies, which usually do not have the resources to monitor compliance of numerous potential polluters.
The question is how efficient and effective complaints are. There are many examples of polluters being caught who would not have been detected by the EPB. But the costs of a complaint system can be high, because many complaints are about minor nuisances. Improving formal monitoring aided by more complete pollution registries could prevent many complaints in the first place. Despite the large number of complaints, relatively few trigger enforcement actions. Between 2006 and 2010, MEP received 300,000 environ-mental complaints.10 These led to a re-exami-nation of 2,614 administrative decisions. Only 980 of these were administrative court cases, and only 30 resulted in criminal cases, sug-gesting that few environmental conflicts are resolved through the legal system. Greater public participation in detecting and publi-cizing environmental wrongdoing—whether through formal channels or informally—will be an effective means to support the govern-ment’s environmental goals only if there is an outlet for such protests. Otherwise they can lead to social instability. One such outlet is the legal system where citizens, community groups or local governments could initiate cases of gross violation of environmental laws.
Legal system. Most national and local envi-ronmental agencies around the world have limited enforcement capacity. Ministries of Environment typically have much smaller budgets than other departments. Enforce-ment of environmental rules in Europe or North America—but also in Brazil, India, or Thailand, for instance—therefore relies substantially on the court system. A famous example is the role of courts in enforcing air quality standards in Delhi in 2001 (Bell and others 2004). Successful lawsuits by indi-viduals affected by pollution in China have resulted in compensation payments in some instances. In one prominent ongoing case, a chemical plant in Yunnan released 5,000 tons of chromium dregs into the Nanpan River in 2011. A group of NGOs filed a public inter-est lawsuit on behalf of thousands of affected farmers that could become a landmark case if it is recognized by the Supreme People’s Court as a precedent. Overall, however, pursuing polluters through the legal system is still difficult, and many cases never reach trial stage (Stern 2011).
China has for some time been experiment-ing with specialized environmental courts. By mid-2012, almost 100 such courts and tribunals had been established in 16 prov-inces of China (Zhang and Bao 2012). Such courts could provide an effective way of assisting more direct government efforts in enforcing environmental laws if a number of problems with existing environmental courts are resolved. The main issue is that there are high barriers to bringing cases to court. Less than 1 percent of environmental dis-putes reach the court system (Stern 2011), in part because only few organizations can file public interest environmental law suits. Revi-sions to China’s environmental law proposed in July 2013 would further restrict the right to file such suits to only one MEP-affiliated organization—the All-China Environment Federation.11
Barriers also exist where judges close to local governments prevent individuals or groups of affected citizens trying to bring cases to court from going forward (Zhang and Bao 2012). The resulting small num-ber of environmental cases has been used as

g r e e n U r b a n i z a t i o n 463
a reason to close environmental courts. A more certain legal basis for these courts and greater independent procedures would help overcome these problems. The legal system can be a slow and expensive way to resolve environmental disputes. More comprehensive enforcement of environmental laws and medi-ation or conflict resolution by public or non-state organizations should play an important role and usually be the first best option. But, as experience in other countries has shown (for example, Lin and others 2009), for com-plex cases or where officials are unable or unwilling to pursue polluters, stronger envi-ronmental courts will be an important means to hold polluters to account.
Public disclosure
Public pressure on polluters can be an effec-tive way to encourage greater environmental compliance. But citizens often do not real-ize that a facility is polluting air, water, or soils until harmful effects are obvious. Dis-closure of polluting behavior by firms gives people the information they need to assess whether they are affected. China has experi-mented with public disclosure of pollution performance ratings since the 1990s (Wang, Wheeler, and Jin 2010). Piloted in Zhenjian (Jiangsu Province, box 7.5) and Hohhot (Inner Mongolia) by MEP’s predecessor organization, SEPA, together with the World
Despite long-standing efforts to control pollution with traditional regulatory instruments, China con-tinues to have severe pollution problems. Environ-mental performance rating and public disclosure (PRPD) has emerged as a complement for traditional pollution regulation. It helps overcome institutional weaknesses that hinder conventional monitoring and enforcement of environmental laws, regulations, and standards, and lowers regulatory costs. In the past decade, Jiangsu and several other areas in China have practiced the PRPD approach and have found it an effective pollution control instrument.
Jiangsu started its PRPD program with support from the World Bank in 2001, after a pilot test in Zhenjiang Municipality. The program rates firms’ environmental performance from best to worst in five colors—green for superior performance; blue for full compliance; yellow for meeting major compliance standards but violating some minor requirements; red for violating important standards; and black for more extreme noncompliance. The primary benchmarks for ratings are China’s emission and discharge standards that specify effluent concentration limits. The rating system also incorporates other performance indica-tors, including hazardous waste disposal practices, solid waste recycling, pollution accidents, public com-plaints, internal management requirements, China cleaner production certificates, ISO 14000 certificates, administrative penalties, and other citations for illegal
Box 7.5 environmental performance ratings in Jiangsu Province
activity. For each indicator, the system specifies a clear, unambiguous, and publicly available link to ratings.
Evidence for the PRPD program in Jiangsu Prov-ince indicates both increasing participation by firms and improvement in their compliance rates. The num-ber of rated firms increased more than twentyfold in 10 years, from 1,059 in 2001 to 20,261 in 2010. The percentage of firms with positive ratings increased to 96 percent in 2010. Research has found that PRPD program in Jiangsu has significantly reduced pol-lution from rated firms, with particularly strong impacts on firms with poor ratings. PRPD has signifi-cantly increased market and stakeholder pressure on managers to improve their firms’ environmental per-formance. Firms with better ratings perceive positive impacts on market competitiveness, overall market value, and relationships with different stakeholders, while the firms with bad ratings are more likely to perceive deterioration.
Recently, Jiangsu Province has linked the envi-ronmental performance ratings to eligibility for bank loans, the market list inspections requirement, and the environmental responsibility insurance premium, among other things. All firms’ environmental perfor-mance information has been posted on the province’s intranet, which is accessible to all local environmental officers. It is expected that stronger incentives will be generated for firms to further reduce pollution with the PRPD program in Jiangsu Province in the future.
Source: Jin, Wang, and Wheeler 2010.

464 U r b a n C h i n a
Bank, such initiatives have now been imple-mented in the Yangtze River delta (Jiangsu, Shanghai, Zhejiang), Hunan, Hebei, Anhui, Guangdong, Shanxi, Shenyang of Liaon-ing, Shenzhen, Chongqing, Ningxia, and soon Hubei. These systems summarize and publicize firms’ environmental compliance information into a color-coded ranking from excellent to severe underperformance, essentially shaming persistent polluters and rewarding clean production.
Social pressure can be effective, and many companies will voluntarily seek improve-ments. But such systems will work only in cities with an environmentally proactive government, which are usually already bet-ter performing places with higher incomes. Although decentralized, this approach again requires the voluntary support of a central (provincial or municipal) authority (Econ-omy 2010). The system also still will need to be backed up by comprehensive monitor-ing and strong enforcement, which has been uneven in China—better in coastal areas and in areas with a more diverse economy (and therefore less susceptible to capture by domi-nant firms), where enforcement capacity is greater, and where there are a larger number of complaints, which highlights the role of public participation (van Rooij and Lo 2010).
As part of China’s Open Government Information initiative in 2008, MEP intro-duced an Open Environmental Information (OEI) regulation. It requires disclosure of environmental information including the allocation of emissions quotas, pollution fees collected, outcomes of investigations, and lists of violators of environmental rules. These measures are an important step in moving from voluntary public disclosure schemes toward more formalized attempts to introduce greater transparency in envi-ronmental performance. The regulation still has some shortcomings. First, in contrast to most other such regulations, China’s OEI makes the government, rather than industry, responsible for disclosure. The toxic release inventory in the United States and the Euro-pean Pollutant Emission Register in contrast make it mandatory for companies to report emissions above a threshold. Furthermore,
there are seven types of exceptions that Chi-nese environment management officials can invoke to refuse release of information, such as state or commercial secrets or information that could endanger public security or social stability. These exceptions make it too easy to suppress information about pollution that is of public interest.
Second, as a general set of regulations aimed at improving governance, OEI does not convey a right to disclosure. Given China’s decentralized environmental admin-istration, that means that the most polluted municipalities have the weakest disclosure (Tan 2012). There is even some evidence of backsliding. The Institute of Public Policy and Environmental Affairs, which annually ranks 113 cities by their environmental trans-parency, found that about 40 cities had lower disclosure performance in 2012 than a year earlier.12 And third, implementation of OEI is quite expensive for environmental authori-ties and will require further large investments in technology. MEP, for instance, receives “a flood of requests,” as one official put it, and does not have the staff and resources to respond to all.
The government still acts as a gatekeeper for environmental compliance informa-tion. Some municipalities have made sig-nificant efforts to open up environmental information. Jiangsu Province has become a national model for public disclosure.13 Hunan Province’s publicizing of persistent polluters shamed one company into imme-diately investing in cleaning up production. And Zhejiang Province is the first in China to require firms to publicly release their pol-lution data. The current system gives a lot of leeway to individual provinces, which encourages experimentation. Over time, this should lead to mandatory policies that require municipalities in all parts of China to collect and disclose high-quality pollution monitoring data and information about gov-ernment enforcement. This kind of disclosure will be an important step toward a system where local authorities—with the help of the public—monitor the compliance of firms and prosecute violators, and where provincial governments and MEP, in turn, monitor the

g r e e n U r b a n i z a t i o n 465
environmental management performance of municipalities.
Sharper policy instruments
As in other areas of policy making, govern-ments have three types of instruments avail-able to promote environmental objectives. They can use price instruments such as taxes, fees, or subsidies. They can pass regulations such as technology or emission standards. And they can spend resources on things like research, information programs (Annex 7A), or transfers to compensate those affected by other policies. All three types of instru-ments are necessary, although the efficiency with which they achieve their policy goal can vary. Price instruments, if they are designed to ensure economically efficient resource use, tend to be the most efficient. But they are often not enough to trigger the desired response such as a certain level of energy savings. So additional instruments may be required to address separate market, infor-mation, or behavioral failures. Governments should be careful when adding additional instruments, however. Too often, overlapping instruments cancel out each other, create new market distortions, or create confusing and inefficient signals to firms and households. A simple principle is that each problem or mar-ket failure should be addressed by a separate instrument. In practice, policies do inter-act and need to be taken into account when introducing new instruments. The following sections briefly discuss the three main types of instruments—prices, regulations, and investments and transfers.
Prices
Besides reforming institutions for environ-mental management in China, the most effec-tive way to induce greater resource efficiency and lower pollution is through prices. China has removed the most egregious distortions and subsidies in the energy sector—the source of most air pollution and greenhouse gas emissions. Prices for coal, electricity, some petroleum products, and natural gas generally reflect financial costs over the long
run, and some are at or even above interna-tional market levels.
Coal prices. Coal prices paid by industrial consumers have been relatively high com-pared with prices in other countries. Over the past year, the benchmark spot price for ther-mal coal traded at China’s northern ports has remained well above that of similar-grade coal produced in South Africa, Indonesia, and Australia (figure 7.6). Domestically pro-duced hard coking coal has generally been up to 20 percent more expensive than in the United States between 2009 and 2012, in part because of high transport and handling fees that can make up to 70 percent of the industrial consumer price in coastal areas. Environmental taxes and fees have also increased. Publicly traded coal mining com-panies in China paid around RMB 140 ($22) in taxes per ton of coal produced in 2012 (RMB 110 or $17 per ton excluding income taxes).14 A 2013 review by China’s Central University of Finance and Economics found 25 different environmental resource taxes and fees among the 109 taxes and fees cur-rently levied on coal producers.15 Prices will
Figure 7.6 Border spot prices for thermal coal traded in China and other countries, 2012–13
Source: China Coal Industry Association data.Note: Free-on-board (FOB) prices, expressed in U.S. dollars at monthly market exchange rates. Kcal/kg = kilocalories per kilogram.
Chinese northern ports (FOB, 5,500 kcal/kg)Durban, South Africa (FOB, 6,000 kcal/kg)Newcastle, Australia (FOB, 5,500 kcal/kg)Kalimantan, Indonesia (FOB, 5,900 kcal/kg)
US$
per t
on 90
100
70
80
110
60Oct DecNov
2012 2013Jan Mar AprFeb May
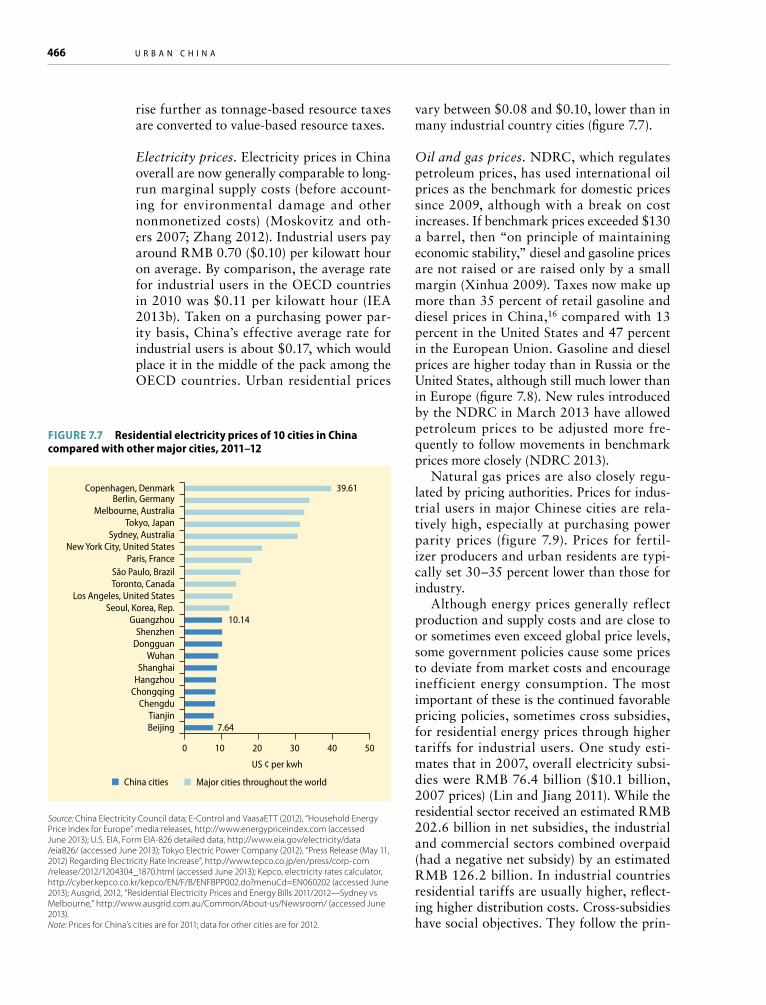
466 U r b a n C h i n a
rise further as tonnage-based resource taxes are converted to value-based resource taxes.
Electricity prices. Electricity prices in China overall are now generally comparable to long-run marginal supply costs (before account-ing for environmental damage and other nonmonetized costs) (Moskovitz and oth-ers 2007; Zhang 2012). Industrial users pay around RMB 0.70 ($0.10) per kilowatt hour on average. By comparison, the average rate for industrial users in the OECD countries in 2010 was $0.11 per kilowatt hour (IEA 2013b). Taken on a purchasing power par-ity basis, China’s effective average rate for industrial users is about $0.17, which would place it in the middle of the pack among the OECD countries. Urban residential prices
vary between $0.08 and $0.10, lower than in many industrial country cities (figure 7.7).
Oil and gas prices. NDRC, which regulates petroleum prices, has used international oil prices as the benchmark for domestic prices since 2009, although with a break on cost increases. If benchmark prices exceeded $130 a barrel, then “on principle of maintaining economic stability,” diesel and gasoline prices are not raised or are raised only by a small margin (Xinhua 2009). Taxes now make up more than 35 percent of retail gasoline and diesel prices in China,16 compared with 13 percent in the United States and 47 percent in the European Union. Gasoline and diesel prices are higher today than in Russia or the United States, although still much lower than in Europe (figure 7.8). New rules introduced by the NDRC in March 2013 have allowed petroleum prices to be adjusted more fre-quently to follow movements in benchmark prices more closely (NDRC 2013).
Natural gas prices are also closely regu-lated by pricing authorities. Prices for indus-trial users in major Chinese cities are rela-tively high, especially at purchasing power parity prices (figure 7.9). Prices for fertil-izer producers and urban residents are typi-cally set 30–35 percent lower than those for industry.
Although energy prices generally reflect production and supply costs and are close to or sometimes even exceed global price levels, some government policies cause some prices to deviate from market costs and encourage inefficient energy consumption. The most important of these is the continued favorable pricing policies, sometimes cross subsidies, for residential energy prices through higher tariffs for industrial users. One study esti-mates that in 2007, overall electricity subsi-dies were RMB 76.4 billion ($10.1 billion, 2007 prices) (Lin and Jiang 2011). While the residential sector received an estimated RMB 202.6 billion in net subsidies, the industrial and commercial sectors combined overpaid (had a negative net subsidy) by an estimated RMB 126.2 billion. In industrial countries residential tariffs are usually higher, reflect-ing higher distribution costs. Cross-subsidies have social objectives. They follow the prin-
Figure 7.7 residential electricity prices of 10 cities in China compared with other major cities, 2011–12
Source: China Electricity Council data; E-Control and VaasaETT (2012), “Household Energy Price Index for Europe” media releases, http://www.energypriceindex.com (accessed June 2013); U.S. EIA, Form EIA-826 detailed data, http://www.eia.gov/electricity/data /eia826/ (accessed June 2013); Tokyo Electric Power Company (2012), “Press Release (May 11, 2012) Regarding Electricity Rate Increase”, http://www.tepco.co.jp/en/press/corp-com /release/2012/1204304_1870.html (accessed June 2013); Kepco, electricity rates calculator, http://cyber.kepco.co.kr/kepco/EN/F/B/ENFBPP002.do?menuCd=EN060202 (accessed June 2013); Ausgrid, 2012, “Residential Electricity Prices and Energy Bills 2011/2012—Sydney vs Melbourne,” http://www.ausgrid.com.au/Common/About-us/Newsroom/ (accessed June 2013).Note: Prices for China’s cities are for 2011; data for other cities are for 2012.
Major cities throughout the worldChina cities
Săo Paulo, BrazilToronto, Canada
Los Angeles, United StatesSeoul, Korea, Rep.
GuangzhouShenzhen
Berlin, GermanyMelbourne, Australia
Copenhagen, Denmark
Tokyo, JapanSydney, Australia
New York City, United StatesParis, France
DongguanWuhan
ShanghaiHangzhou
ChongqingChengdu
TianjinBeijing
0 10
US ¢ per kwh
20 30 40
7.64
10.14
39.61
50

g r e e n U r b a n i z a t i o n 467
ciple of “equal burden sharing,” where price setting considers affordability and social con-cerns in addition to supply costs. But they come at the cost of lower economic efficiency.
Furthermore, they tend to be regressive because wealthier households, who consume disproportionately more energy, receive the largest share of the benefit.
Figure 7.8 China’s transport fuel prices are still relatively low but have increased significantly
Source: GIZ 2013.
2012 prices 1995 prices
United Kingdom
a. Diesel prices
France
Japan
South Africa
United States
Russian Federation
Turkey
Germany
Korea, Rep.
Australia
China
Brazil
India
US$ per liter
0 0.5 1.0 1.5 2.0 2.5
United Kingdom
France
Japan
South Africa
United States
Russian Federation
Turkey
Germany
Korea, Rep.
Australia
China
Brazil
India
0 0.5 1.0 1.5 2.0 2.5 3.0
b. Gasoline prices
US$ per liter
Figure 7.9 Natural gas prices paid by industrial end-users in Chinese cities compared to prices in other countries, 2000–11
Source: NBS 2005d–2012d; U.S. EIA, US Price of Natural Gas Delivered to Residential Customers, http://www.eia.gov/dnav/ng/hist/n3010us3m .htm (accessed December 2013); Korea Energy Economics Institute, Energy Info.Korea 2012, http://www.keei.re.kr/main.nsf/index_en.html (accessed December 2012); UK DECC, Table 5.7.1 Industrial gas prices in the EU and the G7 countries, https://www.gov.uk/government /statistical-data-sets/international-industrial-energy-prices (accessed December 2013). Note: Chinese data represent prices paid by sample of industries in 36 large cities; data for Korea, Japan, the United States, and the United Kingdom are national averages of urban consumers; data include all taxes, surcharges, and other fees.
Korea, Rep. China Japan United States United Kingdom
6
RMB
m3
a. Market exchange rates
5
4
3
2
1
02000 2005 2011
1.2
US$
(PPP
) per
m3
b. Purchasing power parity
1.0
0.8
0.6
0.4
0.2
02000 2005 2011

468 U r b a n C h i n a
Other distortions include pricing practices that prevent electricity producers and some other energy suppliers from passing input costs above a certain level on to consum-ers. The difference between market-based import prices for natural gas and regulated domestic prices have generated large losses for importers. In 2011, for example, Pet-roChina lost RMB 21.4 billion on sales of pipeline gas imported from Turkmenistan because of price regulation. Such losses have dampened incentives to boost supplies of this relatively cleaner fuel. As pricing reform continues, better information about the size, fiscal costs, and distributional impacts of distortions in resource prices would provide greater momentum for reform and a better basis for deciding which policies, on balance, are justified when economic, social, and environmental considerations are taken into account. Such a review could take the form of an inventory or audit of environmentally harmful policies similar to those performed by some European environmental agencies (UBA 2011, for example).
Getting to cost recovery levels is only the first step. China’s coal, electricity, and gasoline pricing policies have also begun to account for damages caused by resource pro-duction and consumption—local pollution that harms people’s health and greenhouse gas pollution that fuels global warming. Adding such “external” or “social” costs is usually the most efficient way to change the behavior of people and firms. Determining the appropriate pollution charges can be dif-ficult, however. Estimated health impacts or climate change impact modeling can provide guidance. One large U.S. study for instance, estimated that the health damages from fossil fuel power plants range from 0.002 to 0.12 cents per kilowatt house depending on the size and age of the plant (NRC 2010). A study by Chinese experts estimated that adding a comprehensive estimate of the social cost of coal—including indirect costs from mining, transport, production, and emissions—would raise the market price of coal by 23.1 percent (Mao, Sheng, and Yang 2008). The social cost of climate change damages from energy use are more difficult to determine, because of uncertainty about specific impacts. The
U.S. government recently revised its official estimates of the social cost of carbon upward based on extensive modeling—to $38 per ton of carbon dioxide for the year 2015.17 This number is used to estimate the climate ben-efits of environmental rule making.
Such extra charges are imposed in two ways. One is through an energy or resource tax. Ecological tax reforms would put a charge on energy or water use to encour-age conservation. Carbon taxes specifically charge greenhouse gas emissions (box 7.6). Charges could rise over time in line with efficiency improvements and become a new source of revenue, which can be earmarked for related goals, such as funding energy effi-ciency investments, or they can reduce other distorting taxes such as those on labor or replace municipal revenue from land sales. The alternative policy is a cap-and-trade sys-tem. This system establishes a clear limitation on pollution and lets a market for emission allowances determine the price for pollution, ensuring that pollution reductions occur where they can be achieved at least cost. Allowances have been initially distributed freely to make the system acceptable to firms, which if possible should be avoided. They can be auctioned off to raise revenue similar to a tax. Revenues from a tax or cap-and-trade allocation auctions can be reinvested in fur-ther resource savings or emission reduction, contributing to higher benefits than the price effect alone. Pollution trading systems in China have been piloted for sulfur dioxide (SO2) and carbon, and in several countries they are also used for water pollution (Fisher-Vanden and Olmstead 2013).
The following sections on sector priori-ties discuss the use of some price instruments in China in more detail. Several policies and pilots introducing environmental taxation and cap-and-trade systems are already under way in China. These will be useful as a way to collect information and experiences but will need to be expanded nationally if they are to become truly effective. Furthermore, cap-and-trade systems need to be frequently recalibrated. An economic slump will reduce emissions or pollution even without firms’ efforts, adding to the frequent problem of initially overallocating allowances. In addi-

g r e e n U r b a n i z a t i o n 469
tion, complementary energy efficiency and renewable energy policies may “loosen” the cap and add to a surplus of allowances, drag-ging down CO2 prices, as seen in the EU car-bon trading system (Grubb 2012). As China moves from pilot schemes to full deployment, these interactions among overlapping policy instruments need to be dealt with based on careful analysis with a coordinated effort between ministries and agencies.
Regulations
Price incentives are an efficient and nonco-ercive way to encourage changes in behav-ior, but there remains an essential role for strict environmental regulations as well as for social transfers. Price instruments can be blunted by behavioral factors such as short-
termism (people look at the higher purchase price of energy-efficient light bulbs but ignore their long-term savings) or split-incentives (a landlord may not make energy saving upgrades as long as the tenant pays the utility bills). Regulations can also be more effective when the need to stop or reduce a harmful activity is urgency. But regulation is only as good as its enforcement. China’s current reli-ance on target-based regulations is producing desirable results but may lead to unintended consequences and weaker compliance incen-tives. The regulations are often rigid and may not reflect local environmental conditions and priorities, often lack a scientific basis, are sometimes arbitrarily exaggerated as they pass through the administrative hierarchy, and compliance is difficult to verify (Kostka 2013). More rigorous technical, social, and
According to a recent analysis by the World Bank and DRC, a price of $10–$20 on a ton of carbon diox-ide (CO2) (RMB 83–166 in 2004 prices) starting in 2015 would effectively bend the curve of China’s ris-ing greenhouse gas emissions, causing emissions to plateau or peak before 2030. Total coal use would peak in or around 2020. The price would effectively be equal to a tax on steam coal of about $22–$44
Box 7.6 China 2030: estimated impacts of carbon pricing
a ton. While carbon pricing would have a dramatic effect on CO2 emissions and the use of dirty fossil fuels, it would only have a modest long-run effect on economic output (figure B7.6.1). Even with a carbon price of $20 a ton, average annual growth in GDP slows by only 0.06 percent between 2015 and 2020 and 0.05 percent between 2025 and 2030 compared with a baseline scenario.
Source: World Bank background analysis done for World Bank–DRC 2013.
Figure B7.6.1 effect of a carbon price on emissions and economic growth
Business as usual Carbon price of US$10 per tCO2 Carbon price of US$20 per tCO2
2010 2015 2020 2025 2030
12
CO2 e
mitt
ed, t
ons (
billi
ons)
a. E�ect on emissions
11
10
9
8
7
6
3.4
Coal
, ton
s (bi
llion
s)
b. E�ect on economic growth
3.2
3.0
2.8
2.6
2.4
2.22011 2020 20252015 2030

470 U r b a n C h i n a
economic analysis of regulatory decisions and investment projects could make them more effective.
Investments and transfers
Besides influencing prices and issuing regula-tions, governments also spend money directly to pursue greening, for example, by funding information programs, training, or upgrad-ing public infrastructure. In some instances, such direct government expenditures can help buffer the unintended consequences of environmental policies. Market instruments are economically efficient, and complemen-tary regulations are effective where markets do not work well. But both usually raise prices for resources, at least in the short term, which can affect the competitiveness of firms and the welfare of low-income households. For environmental policies to be efficient, effective, and fair, assistance to households and companies will sometimes be necessary.
For instance, household expenditure shares for energy in two of China’s provinces, Liaoning and Sichuan, range from about 2 percent for the richest households in Sich-uan to just over 10 percent for the poorest in Liaoning (figure 7.10 shows expenditures are higher in Liaoning because of winter heating needs). Wealthier households usually have
higher total energy expenditures, but the expenditures account for a smaller share of their income. An international benchmark for energy poverty is when households have to spend more than 10 percent of their income on energy. If energy prices rise by 15 percent when cross-subsidies are removed or an eco-logical tax is imposed, up to 20 percent of households in Liaoning could fall above that threshold. This example illustrates that the social consequences of sustainability policies need to be studied carefully, but it does not argue against raising prices to market or even to social cost levels. A block tariff that main-tains a lower price for a minimum amount of energy is one option to address social con-cerns, as already implemented for electricity. But, if the block is not well designed, it can have significant benefit leakage to the non-poor. Generally, rather than keeping energy prices low across the board, which would discourage energy efficiency efforts by house-holds, a more effective strategy is to comple-ment sustainability policies with targeted sec-tor and social protection policies that help the poorest cope with energy price rises (Ruggeri Laderchi, Olivier, and Trimble 2013).
Local officials in China already have extensive powers to force the shutdown of inefficient or outdated production capacity for which energy efficiency upgrades would
Figure 7.10 Household energy expenditure shares, 2012
Source: China Household Income and Expenditure Survey data.Note: Vigintile = one-twentieth or each 5 percent increment.
Liaoning Sichuan
12
10
8
6
4
2
0Hom
e en
ergy
use
as s
hare
of h
ouse
hold
expe
nditu
res (
%)
Average
Vigintile
V1(poorest)
V2 V3 V4 V5 V6 V7 V8 V9 V10 V11 V12 V13 V14 V15 V16 V17 V18 V19 V20(richest)

g r e e n U r b a n i z a t i o n 471
not be sufficient. To soften the blow to local employment and economic output, city gov-ernments may provide reemployment assis-tance to displaced workers, financing for affected enterprises to pursue other lines of business, and partial compensation for retired equipment (Kostka and Hobbs 2012; Li and others 2009; Taylor and others 2010).
Sustainable sector policies are closely aligned with green objectivesDiffering resource endowments, economic structures, climactic conditions, and other conditions mean there can be no universal definition of a green city. Because the specific issues that need to be addressed in these sec-tors vary widely, and because sector reforms have advanced more in some sectors than in others, no generic set of options or recom-mendations can be applied. But there are a number of common themes. First, action in all sectors is urgently needed because of the immediate health and ecosystems impacts from high pollution and because poorly designed urban infrastructure investments during the next wave of urbanization could lock China into further cycles of unsustain-able development.
Second, problems of the magnitude and complexity faced by China’s urban policy makers cannot be solved in sector silos or geographic niches. Land management, trans-port, building, and public service sectors need to be closely coordinated to shape cities that are resource efficient and low polluting while also promoting economic efficiency and qual-ity of life. And because air pollutants travel over long distances, air quality management needs to be organized at a geographic scale that matches the footprint of the problem.
Third, reducing local pollution (imme-diate benefits) and global carbon pollution (with most benefits in the future) often go hand in hand. Increasing energy efficiency, by reducing fossil-fuel burning, can save lives that would be lost to air pollution today and will also help reduce future global warm-ing. But end-of-pipe abatement technologies for power plants and cars, for instance, can
reduce air pollution concentrations but will not capture carbon emissions. As a rule of thumb, when retrofitting existing infrastruc-ture, it will often be most cost-effective to prioritize local pollution reductions because they bring important, near-term benefits to local populations. For new investments, low-carbon designs will be easier and often cheaper to incorporate at the beginning than retrofitting these assets later, so both objec-tives can be considered at a lower life-cycle cost. Assessment tools are available that evaluate both local and global emissions, and these should be developed further to opti-mize solutions based on local circumstances (annex 7B). Sector investments and policies should seek to limit environmentally harmful resource use as much as possible and clean up what cannot be avoided. Table 7.1 presents the main messages for each sector.
Crossing jurisdictions for effective air quality management
Recent episodes of severe air pollution in many cities have brought air quality into the center of environmental policy debates in China. There is a growing realization of the scope and scale of health impacts from polluted air, and the government has dem-onstrated its willingness to use its financial and administrative resources to address this problem more forcefully. Improving air qual-ity in China’s cities is a massive challenge not only because of the scale of the problem but also because the large number of pollution sources, and chemical reactions between dif-ferent pollutants, make it particularly com-plex. Some of the key elements of an effective air quality action plan are addressed here. Three principles for policy making stand out. One is that adopting a more flexible approach for setting targets for air quality management (AQM) within China’s National Ambient Air Quality Standards (CNAAQS) could facilitate implementation by account-ing for the currently very large differences in pollution levels and conditions across cities and regions. A second point is that regional institutions for AQM must be endowed with greater authority, because air pollution trav-els across municipal boundaries and solutions
472 U r b a n C h i n a
TABLe 7.1 Sector priorities for green urbanization
Integrated approaches to resource use efficiency and pollution management
Promote resource efficiency by revising statutory urban planning rules and coordinating urban and sector planning more closely.
Implement regional air quality management based on sound monitoring, comprehensive technical assessment, and economic analysis.
Providing sustainable and safe urban transportation
Reduce reliance on private cars by charging the full cost that their use imposes and by making urban public transit and nonmotorized transport more attractive.
Enforce fuel quality standards, continue to tighten and enforce vehicle emission standards, expand low-emission and alternative fuel vehicles, and encourage retirement of older, highly polluting vehicles.
Meeting urban energy needs by prioritizing efficiency and greening the energy mix
Rebalancing markets and mandates to reduce energy use in industry
Rebalance administrative measures with more market-based approaches that motivate enterprises to prioritize energy efficiency as part of their own business interest; maintain enterprise obligations while providing more options, like trading, to meet targets; and strengthen local government capacity in regulatory supervision and policy implementation.
Strengthen development of energy-efficiency services industries, giving enterprises increased access to technical services and financing, and promote deeper penetration of energy savings performance contracting.
Leading by doing: serving the people in more efficient and cleaner buildings
Lead by example with aggressive building efficiency programs in public institutions.
Establish targets for progressively tightening energy efficiency codes to set clear market signals; broaden use of benchmarking for existing buildings as basis for retrofit policies and programs; promote green buildings by linking incentives with clearer labeling schemes and strengthening capacities across the supply chain.
Phase out harmful construction materials to reduce indoor air pollution.
Securing clean energy sources
Minimize the direct use of coal in cities by expanding access to piped gas (with priorities given to households, commercial uses, and district heating) and clean energy sources.
Establish a more even playing field for cleaner energy to contribute to urban energy supply by removing pricing distortions and by improving efficiency of energy supply systems through increased competition and modernization of sector regulation.
Integrating water resources and pollution management to improve water quality
Ensure a efficient, safe, and secure water supply by reforming the water rights system, using smart technologies to measure consumption, and enhancing water resource and pollution discharge governance at the basin level and at local levels; broaden use of payments for ecological services to address nonpoint source pollution challenges; and increase public awareness through new means like water footprint accounting.
Modernize urban utility management by reforming water pricing to improve sustainability of water and wastewater treatment services; strengthen governance by piloting mechanisms like water boards in metropolitan areas and aggregating services in small towns, adopting transitional arrangements for meeting wastewater standards for weaker cities to help improve coverage.
Improving solid waste management: waste reduction, recycling and disposal
Charge waste removal fees that can fund more efficient collection, separation, and disposal of waste, and encourage life-cycle product stewardship programs that help avoid waste generation.
Improve the planning of waste disposal by strengthening environmental impact assessments, improve their operations by reducing air and water pollution from incinerators and landfills, and provide for the proper closure, rehabilitation and safe reclamation of old landfills.
can be cost-effective only when applied at a larger scale beyond the jurisdiction of each city and province. Third, spending resources for air pollution mitigation wisely requires a comprehensive, multipollutant approach that identifies those policies and interventions that
provide the largest pollution reductions at the lowest cost. This strategy also includes the identification of abatement options that result in both local air pollution and climate change reduction (co-benefits). Specific abatement actions will occur at the sector level. Because

g r e e n U r b a n i z a t i o n 473
of the cross-sectoral nature of the air pollu-tion problem, an effective institutional and regulatory framework is critically important.
Urban air quality has gradually improved as prevention and control policies have been successively tightened (World Bank–MEP 2012). The annual average concentration of relatively coarse particulate matter (PM10) for 113 priority cities fell by about 40 per-cent, from 145 to 83 micrograms per cubic meter (µg/m3) between 1997 and 2012. SO2 emissions have been declining since the late 1990s and particularly since the mid-2000s, mainly because of the wide application of flue-gas desulfurization at power plants (Lu and others 2010). Overall, NO2 emissions have also showed a decreasing trend over the past 15 years, although this trend has lev-eled off in recent years most likely because of the increasing vehicle fleet in Chinese urban areas (Nygard and Deichmann 2013). Much progress has also been made in collecting and disseminating information on urban air pol-lution. A nationwide monitoring program for fine particulate matter (PM2.5) initially covered 74 cities. China’s Center for Envi-ronmental Monitoring now provides hourly updates of air quality for about 175 cities on the web, with plans to expand the program to all 325 prefecture-level cities.
Despite these positive trends, air pollu-tion levels remain high. Average PM10 con-centrations in 2012 are still more than 20 percent higher than the new Class II rating under CNAAQS and 325 percent higher than the WHO preferred standard of 20 µg/m3. Moreover, these averages mask far higher levels in individual cities and city clusters, especially in the North China plain including the Beijing, Tianjin, Hebei (Jingjinji) region (figure 7.11). Furthermore, data for the first half of 2013 suggest that PM concentrations may have increased, with PM2.5 levels about twice the Class II standard and seven times the WHO standard of 10 µg/m3. PM2.5 is of great concern because these very small particles can enter deep into the cardiovas-cular and respiratory systems, causing high morbidity and mortality. Overall, the newly available monitoring data suggest that PM10 concentrations appear substantially higher than earlier reported. The Jingjinji region experienced severe pollution, where even healthy people should avoid outdoor activi-ties, on 48 days during the first half of 2013. While cities in West and North China once had the highest PM10 concentrations, the new PM2.5 and ozone (O3) data indicate that the centers of heavy air pollution are now in the industrial centers in the North China Plain.
Figure 7.11 PM10 and PM2.5 monitoring results from 74 pilot cities, including 3 regions, 2009–13
Source: Calculations based on Renmin University 2013, World Bank–MEP 2012, and CNEMC 2013.Note: Since the 2013 figures are for the first half year only, both the standards and the concentrations levels are illustrated in dotted lines and bars.
Jingjinji Yangtze Pearl Total 74 citiesCNAAQS (2012) new class II CNAAQS (1996, 2012) class I WHO recommended
250
Former PM10 monitoring New PM10 and PM2.5 monitoring (from 2013)
PM10 PM2.5
200
150
100
50
0
µg/m
3
2013 20132009 2010 2011

474 U r b a n C h i n a
Unless the patterns found in early 2013 are due to unusual circumstances, it seems unre-alistic for many cities to achieve CNAAQS Class II standards as intended by 2016.
China’s air pollution problem may be getting more complex
The causes of these unexpected spikes in air pollution are still debated, and they may well be temporary. But air pollution problems will remain challenging for a number of reasons that also have a bearing on possible mitiga-tion strategies. First, the composition of pol-lution sources in China’s cities is gradually changing. It is also highly variable, because China’s cities have different geography, industrial structure, and energy supply pat-terns. Far too few rigorous and comparable pollutant source apportionment studies have been done for Chinese cities. Overall, coal combustion—in power plants, industry, and residential use—remains an important con-tributor to China’s air pollution, especially in winter, where it can account for as much as 60 percent of PM10. The share of emissions from vehicles is rising. Although new cars are cleaner, the volume of new vehicles is very large and vehicular emissions can account for as much as 30 percent of PM2.5. Natural
sources in the form of dust worsen air pollu-tion problems, especially in the North, where seasonally and during severe dust storms they can make up to 60 percent of PM10 in some cities, including Beijing (table 7.2). The con-tinued uncertainty about pollution sources and the dynamic nature of source composi-tions show the need for a much better under-standing of where air pollution comes from.
Second, the way in which particulates form is growing more complex, with the share of so-called “secondary pollutants” increasing. This is the share of fine particu-lates such as PM2.5 that forms in the air when gases such as sulfur dioxide (SO2), nitrogen oxides (NOx), and ammonia (NH3) react chemically. Most SO2 comes from coal com-bustion, while most NOx is emitted by vehi-cles. Ammonia is an important precursor. In fact, such chemical reactions are facilitated by cold temperatures such as those that the Jingjinji region experienced in early 2013 dur-ing the spike in PM2.5 concentrations.18 Over the North China Plain, most ammonia comes from agricultural activities—nitrogen fertil-ization (54 percent) and livestock emissions (46 percent; see Zhang and others 2012). Ammonia emissions have increased rapidly over the past twenty years. Because ammonia emissions worsen the impact of gaseous emis-
TABLe 7.2 Breakdown of PM10 and PM2.5 sources nationwide and in Beijing
SourcesPM10
% share
PM2.5 % share
Nationwide Beijing
Suspended dust
30–60 (North)5–30 (South)
34 (North)29 (South)
17 (suspended)7 (construction)
Coal combustion20–60 (Winter)5–20 (Summer)
10–30(within city only)
16.7 within city24.5 outside city
Industrial processes (iron steel, cement dust)
Up to 20Up to 32 (mainly cement)
—
Vehicle emission5–20 15 (North)
20 (South)22
Biomass burningUp to 10 14 (North)
20 (South)9
Secondary PM(Beijing, Yangtze, Pearl River)
20–40(largely PM2.5)
10–57(from SO2, NOX, NH3)
40-50%(from SO2, NOX, NH3)
Source: World Bank–MEP 2012, 11; Nygard and Deichmann 2013; Yang and others 2012; Lei and others 2011.

g r e e n U r b a n i z a t i o n 475
sions from fossil-fuel burning by helping to create more PM2.5, reducing them will also lessen the impact of emissions from energy generation and use. That will require halting the considerable overapplication of fertilizer (Liu, X., and others 2013) and introducing better livestock management. The complexity is further increased by the need to also con-sider greenhouse gas emissions. Air pollution abatement often can yield significant CO2 reductions as a co-benefit (Liu, F., and oth-ers 2013) and also reduces short-lived climate pollutants, of which black carbon is of par-ticular importance. Because pollutants from different sources interact in complex ways, it is important to address pollution from all sources—that is, a multipollutant approach that also considers carbon pollution—rather than focus on one in particular.
The third aspect is the role of long- distance transport of air pollutants. Dust and particulates produced in one province can reach cities in a neighboring province. Emis-sions caused by agricultural activities in dis-tant rural areas can worsen urban pollution problems. As a result, already high pollution levels may become even more severe by events or actions that take place far away from the area of impact. In the Jingjinji region, Hebei accounts for as much as 89 percent of the industrial PM emissions and 81 percent of the SO2 emissions, while Beijing accounts for only 4 percent and 6 percent, respectively (Xinhua 2013). Similarly, in the lower Yang-tze River Delta, 84 percent of industrial PM and SO2 originate in the neighboring Jiangsu and Zhejiang provinces, while 16 percent of the emissions originate in Shanghai city. Long distance transport of pollutants implies that air quality management cannot only be done on city-by-city level but rather must be planned and implemented at a closely integrated regional scale (for example, in a regional “airshed”) that brings local urban and regional AQM together.
Finally, an emerging question is whether climate change could have an impact on local air pollution levels. One well-under-stood aspect is that the higher temperatures expected with global warming facilitate the formation of ozone, which can harm the respiratory system and lead to asthma,
bronchitis, and premature death. A less researched aspect is arctic amplification that can cause greater swings and a slowing down of the jet stream (Francis and Vavrus 2012; Nygard and Deichmann 2013). Weather sys-tems may remain in place longer, leading to a greater accumulation of pollutants. The pos-sible role of climate change highlights the fact that uncertainty is likely to increase, so our assumptions must be continuously updated.
Strengthening air quality management
Many parts of China’s air pollution control policies have worked well. For instance, the amended air quality law of 2000 focused control efforts on 113 priority cities with the greatest air pollution problems. These cities significantly reduced PM10 concentrations over the following decade. Lessons learned should now benefit all of China’s cities that face air quality challenges. A comprehensive air quality improvement strategy needs to address three important aspects.
Different cities face very different chal-lenges in meeting China’s ambient air qual-ity standards, and these differences should be reflected in the prescribed implementation schedule for pollution reduction policies. The standards establish a uniform target air qual-ity level for all cities under the principle that all of China’s urban residents should be able to enjoy clean air as soon as possible. But cit-ies have very different pollution levels that arise from industrial structure, natural con-ditions, and capacity to implement mitiga-tion policies. A uniform path to compliance is therefore unrealistic and probably coun-terproductive. A more differentiated set of target dates, with intermediate targets for the most polluted cities, can make achievement more manageable while still retaining the incentives for already-cleaner cities to reach targets faster or to overcomply, for instance by pursuing the stricter WHO standards.
Because air pollution travels across admin-istrative boundaries, control programs must be organized regionally. Much of the air pol-lution in many of China’s cities originates from areas that are beyond the control of city governments—from other urban centers but also from nearby agricultural areas. Purely

476 U r b a n C h i n a
local abatement action will not be suffi cient to clean the air, especially in larger city clus-ters. Other global metropolitan areas with historically large pollution problems have set up powerful regional AQM authorities. In the United States, the South Coast Air Quality District is in charge of air quality planning, regulation, compliance assistance, enforce-ment, monitoring, technology advancement, and public education for the greater Los Angeles region in California, home to 17 million people. And the Ruhr area in Ger-many established a regional AQM strategy (Luftreinhalteplan Ruhrgebiet) that coor-dinates abatement measures across 13 indi-vidual cities such as Essen and Dortmund. Such models could be adapted to strengthen regional institutions in Chinese city regions with severe air quality problems such as Jingjinji. To be effective, such regional institu-tions or similarly effective mechanisms need to be endowed with a clear mandate and legal authority across municipal boundaries, together with strong enforcement mecha-nisms, which in most countries leverage the legal system. A clear coordination mechanism also is needed covering the many munici-pal sector and environmental management bureaus whose actions affect air quality.
Air quality action plans need to be guided by a comprehensive and rigorous analy-sis of the costs and benefits of abatement options. In response to recent severe air pol-lution incidents in China, the government has announced large additional air pollution control efforts, including a RMB 1.7 trillion program to be implemented over 2013–17 (Xinhua 2013). To ensure that such funds are well spent, a solid technical and economic analysis should identify the most cost-effec-tive abatement strategies. The approaches need to be both broader—by considering pollution sources and impacts in a larger geo-graphic region—and deeper—by employing much fi ner-grained data on individual pollu-tion sources and exposed populations. These are common in North America and Europe, and Chinese researchers and policy analysts also have the expertise to implement them. A comprehensive, integrated AQM approach involves four major steps (figure 7.12; see also box 7.7).
The fi rst step is the identifi cation of emis-sion sources, including their geographic loca-tion, by conducting a detailed inventory and analysis of emission sources, both stationary ones such as power plants and nonstationary ones such as vehicles. In the second step, a combination of ground-monitoring data and atmospheric dispersion modeling determines air pollution concentration levels in all parts of the area. In a regional application, this step will involve a hierarchically structured set of models with fi ne resolution local mod-els nesting into coarser resolution regional or even national models.19 In the Jingjinji region, for example, the overall regional level could be covered by 50-by-50 kilometer grids at a coarser resolution in an overall 700-by-700 kilometer coverage, while 14 urban areas would be covered by fi ner resolution grids of 1–5 kilometers within the 50-by-50 kilometer coverages (fi gure 7.13). The resulting infor-mation can then be used to predict how pol-lution concentrations in individual locations change with the introduction of very specifi c abatement measures, even at individual facili-ties. In principle, this procedure allows design of abatement options to achieve specifi c air quality targets at the level of individual moni-toring stations.
The third step translates observed and modeled air pollution concentrations into impacts by estimating who is exposed to how
Figure 7.12 Framework for comprehensive integrated air quality management
Source: Nygard and Deichmann 2013.
Emission frompollutionsources
Air pollutionconcentrations
Optimizedabatement
strategy
Impacts anddamages
Exposure
MonitoringDispersionmodeling
Abatementoptions
Cost-bene�tanalysis

g r e e n U r b a n i z a t i o n 477
much air pollution and then applying so-called dose-response functions, which link pollution levels to health outcomes including premature death. In an urban context, the impacts on human health are most impor-tant, but other impacts include diminished visibility, corrosion, or cleaning needs. In a broader context, impacts on natural ecosys-tems through eutrophication or acid rain as well as long-term climate change impacts, for example, should also be considered. Comparison of current impacts with those modeled under various abatement scenarios provides measures of benefi t (avoided dam-ages). If the abatement option is an effi ciency measure, additional co-benefits could also include energy or other resource material sav-ings. In the fi nal step, these benefi ts are com-pared with abatement costs. Going through this process for various abatement options identifi es the most cost- effective air pollution control strategy, for instance in the form of a marginal abatement cost curve that ranks policies or investments according to their damage reduction per unit of expenditure. An effective tool is to present the abatement options on maps and show how much air pollution concentrations will be reduced in separate sections of the city.
Given the recent spikes in air pollution in many Chinese cities, it is easy to forget that
air quality today is better than a decade or two ago. With rising wealth, expectations for quality of life increase, and China’s urban residents today value clean air more. China can leverage experience and technology from elsewhere and mobilize signifi cant domestic expertise and resources to tackle the urban air pollution problem. But international expe-rience also shows that quick improvements
Figure 7.13 example of a nested modeling system of air quality in the Jingjinji region in China
Source: Nygard and Deichmann 2013.Note: See text for explanation.
: Framework for comprehensive integrated air quality management.
Figure 2: Possible geographic reference for air quality modeling in the Jingjinji region in China (part 2).
Air pollutionconcentrations
Emissions from pollution sources
Optimized abatement strategy
Impacts and damages
MonitoringDispersion modeling
Exposure
Abatement optionsCost-‐benefit analysis
[For Fig. 7.13] Note: See text for explanation.
[For both 7.12, 7.13] Source: Nygard and Deichmann 2013.
The third step translates observed and modeled air pollution concentrations into impacts by estimating who is exposed to how much air pollution and then applying so-called dose-response functions, which link pollution levels to health outcomes including premature death. In an urban context, the impacts on human health are most important, but other impacts include diminished visibility, corrosion, or cleaning needs. In a broader context, impacts on natural ecosystems through eutrophication or acid rain as well as long-term climate change impacts, for example, should also be considered. Comparison of current impacts with those modeled under various abatement scenarios provides measures of benefit (avoided damages). If the abatement option is an efficiency measure, additional co-benefits could also include energy or other resource material savings. In the final step, these benefits are compared with abatement costs. Going through this process for various abatement options identifies the most cost-effective air pollution control strategy, for instance in the form of a marginal abatement cost curve that ranks policies or investments according to their damage reduction per unit of expenditure. An effective tool is to present the abatement options on maps and show how much air pollution concentrations will be reduced in separate sections of the city.
Given the recent spikes in air pollution in many Chinese cities, it is easy to forget that air quality today is better than a decade or two ago. With rising wealth, expectations for quality of life increase, and China’s urban residents today value clean air more. China can leverage experience and technology from elsewhere and mobilize significant domestic expertise and resources to tackle the urban air pollution problem. But international experience also shows that quick improvements are unlikely. Heavily polluted cities in Europe and the United States reduced pollution levels by well over 90 percent from their peak, but it often took several decades of determined policy implementation. China can achieve its goals faster, but blue skies will not come overnight.
An extensive review by the National Research Council of air quality management (AQM) in the United States since introduction of the Clean Air Act in 1978 concluded that further improve-ments would require “an integrated multi-pollutant approach to controlling emissions of pollutants pos-ing the most significant risks” (NRC Committee 2004). The council advised that such approaches should seek opportunities for addressing air pollu-tion and climate change mitigation simultaneously. Recent research has highlighted the importance of short-lived climate pollutants such as black carbon that are also reduced through measures that target
Box 7.7 The call for integrated, multipollutant approaches to air quality management in the united States
PM2.5. Since the council’s review, states and local governments have passed laws requiring multipollut-ant AQM planning that takes greenhouse gases into account. States can also save money and achieve air quality targets more effectively if control measures for traditional pollutants, such as NOx and SO 2, are integrated with required CO2 reductions (James and Schulz 2011). As China embarks on more aggressive pollution controls and decarbonization efforts, such integrated, multipollutant approaches can identify cost effective pathways that lead to signifi cant emis-sion reductions in local and global greenhouse gas emissions.
Source: NRC Committee 2004; James and Schulz 2011.

478 U r b a n C h i n a
are unlikely. Heavily polluted cities in Europe and the United States reduced pollution levels by well over 90 percent from their peak, but it often took several decades of determined policy implementation. China can achieve its goals faster, but blue skies will not come overnight.
Shaping urban energy and infrastructure needs through urban form and planning
The urban form—a city’s spatial develop-ment—will shape China’s urban energy and infrastructure needs and thus heavily deter-mines their environmental impacts.20 Urban form strongly influences city infrastructure and in turn the behaviors of city dwellers. Because of its multisector nature, urban form is a key lever for strategies to improve resource efficiency and to maximize use of renewable resources. Urban form, once established, is very difficult to change. Urban infrastructure embeds a path dependency, possibly for generations—it establishes the way people travel and live, encouraging a lifestyle that is hard to change after people grow accustomed to it. Yet it is still possible to change mobility choices and the sizing and scaling of street patterns that meet the needs of all users, both motorized and nonmotor-ized (Ollivier and others 2013).
China has the world’s largest urban pop-ulation, but, surprisingly, its cities are not particularly densely settled. Guangzhou for example, could increase its population in the densest 600 square kilometers by 70 percent, or 4.2 million people, if it raised its density to the level that prevails in Seoul (figure 7.14). Similarly, Shenzhen could increase its popu-lation in the densest 600 square kilometers by 98 percent. Population densities are also less uniform in Chinese cities. Densities of neighborhoods vary by a factor of 10 in the Paris and New York metropolitan areas but densities of some neighborhoods of Beijing, Shanghai, Guangzhou, and most other large Chinese cities are as much as 20 times greater than other neighborhoods in the same city.
Urban sprawl—with rapid growth of low-density areas at the urban periphery—increases resource use in three general ways. First, low-density development increases fuel consumption in urban transport through lon-ger commutes and more private motorized trips. Second, low-density areas increase liv-ing space per person, and consequently lead to higher per capita energy use for home heat-ing, cooling, and general power consumption. Third, low-density development produces infrastructure used less intensively than that in dense urban cores, lowering economies of
10,000
20,000
30,000
40,000
Den
sity
(inha
bita
nts/
km2 )
01000
Built–up area (km2)
200 300 400 500 600
Guangzhou
Seoul, Korea, Rep.
Figure 7.14 Potential of redensification in the densest 600 km2 in guangzhou, compared to Seoul
Source: Salat 2013.
Figure 7.15 Water network length and urban density
Source: Adapted from Müller and others 2013.Note: This and subsequent figures map a set of cities worldwide to illustrate the relationship between density and water and transport networks. The green line corresponds to the current average urban density levels in Chinese cities. The red line illustrates urban sprawl impacts. The green arrow illustrates the path efficiency from denser urban development.
Urban density (inhabitants per km2)
Wat
er n
etw
ork
(m p
er c
apita
)
6
7
5
4
3
2
1
020,00015,00010,0005,0000

g r e e n U r b a n i z a t i o n 479
scale (figure 7.15; figure 7.16) and increasing the capital, operation, and maintenance costs for infrastructure services. Globally, efficient urban forms are quite diverse because the relationship between end users and the urban fabric is complex. There is no ideal urban form that can be copied from place to place. However, there are characteristics common to most efficient cities that typify outcomes of good urban planning practices. First, while efficient urban forms vary in scale and density, compact urban forms make it easier to support public transport; generate lower demands for energy, water, material and waste; and limit encroachment on farmland and natural areas. Second, efficient urban forms mix different uses with housing to pro-vide shops, services, and employment nearby, reducing the need for a car. Third, efficient urban forms stand out as high-quality places to live and offer a diversity of interactions among residents and businesses that fosters innovation.
As urban form locks in a path dependency, it locks out options for greener urbaniza-tion. For instance, studies have shown that a 10 percent increase in density reduces trans-portation energy consumption much more in already denser urban areas than in less dense ones, because the relationship between trans-portation and density is nonlinear (Porter and others 2013). Transit-oriented develop-ment, an energy-efficient option for cities, is generally not practical or economically viable
in low-density suburban areas (figure 7.18). Unbalanced metropolitan areas, with dense urban cores and an extended low-density periphery induce greater commuting flows from the periphery to the center. As a result, both transit capacity and road networks must be oversized to accommodate peak loads dur-ing rush hour. The resulting congestion of the street network is responsible for significant increases in energy consumption and green-house gas emissions from transportation, up to 300 percent for freight (figure 7.17). Studies in Jinan, for instance, calculated that household vehicle kilometers traveled are five times larger in the more modernist single-use superblock configuration than in a mixed-use, traditional street-grid neighborhood (MIT-Tsinghua-EF 2011).
A priority action for promoting compact urban form is to revisit the statutory urban planning rules that are barriers to optimiz-ing resource use. Lower densities are partly a consequence of China’s statutory urban plan-ning rules and related land market policies (see supporting report 2). Largely unchanged for decades, statutory urban planning rules require blocks to measure 400 meters on a side, which locks cities into car dependence. Japanese cities, by comparison, have an aver-age distance of 50 meters between intersec-tions, making them more pedestrian-friendly.
Urban density (inhabitants per km2)
Road
net
wor
k (m
per
cap
ita)
10
12
8
6
4
2
020,00015,00010,0005,0000
Source: Adapted from Müller and others 2013.
Figure 7.16 road network length and urban density
Figure 7.17 Fuel consumption for freight (40-ton trucks) and congestion
Source: Larsson 2008.
60
70
80
90
50
40
Fuel
con
sum
ptio
n (li
ters
per
100
km
)
30
20
10
00
Stops per km
1 2
28
52
84
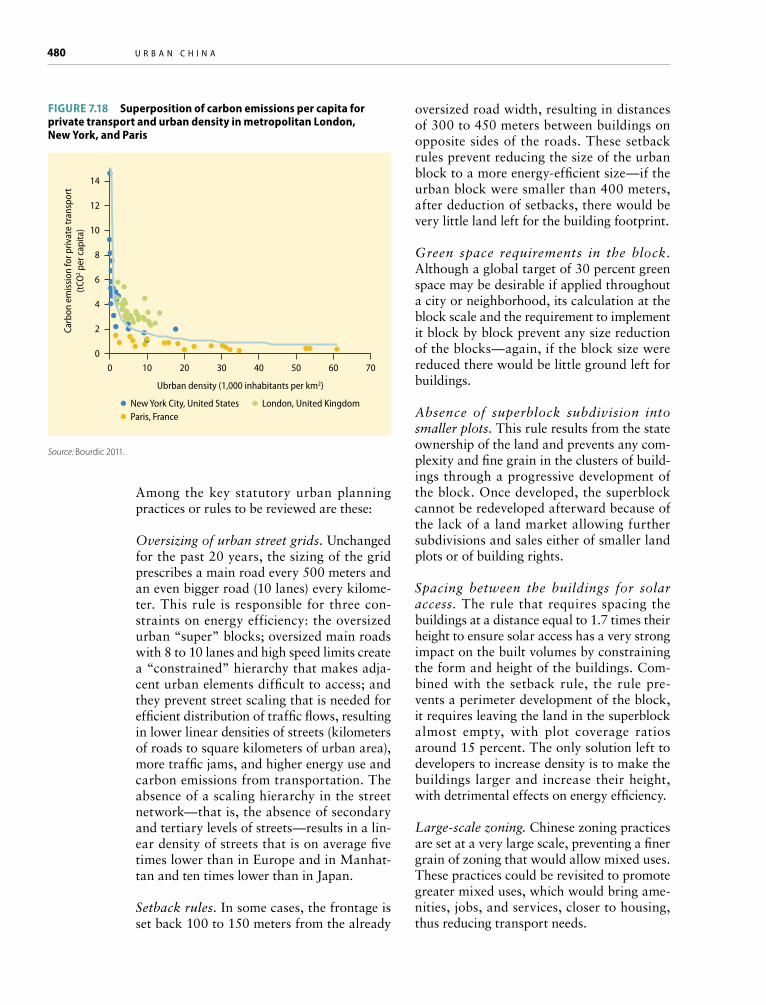
480 U r b a n C h i n a
Among the key statutory urban planning practices or rules to be reviewed are these:
Oversizing of urban street grids. Unchanged for the past 20 years, the sizing of the grid prescribes a main road every 500 meters and an even bigger road (10 lanes) every kilome-ter. This rule is responsible for three con-straints on energy efficiency: the oversized urban “super” blocks; oversized main roads with 8 to 10 lanes and high speed limits create a “constrained” hierarchy that makes adja-cent urban elements difficult to access; and they prevent street scaling that is needed for efficient distribution of traffic flows, resulting in lower linear densities of streets (kilometers of roads to square kilometers of urban area), more traffic jams, and higher energy use and carbon emissions from transportation. The absence of a scaling hierarchy in the street network—that is, the absence of secondary and tertiary levels of streets—results in a lin-ear density of streets that is on average five times lower than in Europe and in Manhat-tan and ten times lower than in Japan.
Setback rules. In some cases, the frontage is set back 100 to 150 meters from the already
oversized road width, resulting in distances of 300 to 450 meters between buildings on opposite sides of the roads. These setback rules prevent reducing the size of the urban block to a more energy-efficient size—if the urban block were smaller than 400 meters, after deduction of setbacks, there would be very little land left for the building footprint.
Green space requirements in the block. Although a global target of 30 percent green space may be desirable if applied throughout a city or neighborhood, its calculation at the block scale and the requirement to implement it block by block prevent any size reduction of the blocks—again, if the block size were reduced there would be little ground left for buildings.
Absence of superblock subdivision into smaller plots. This rule results from the state ownership of the land and prevents any com-plexity and fine grain in the clusters of build-ings through a progressive development of the block. Once developed, the superblock cannot be redeveloped afterward because of the lack of a land market allowing further subdivisions and sales either of smaller land plots or of building rights.
Spacing between the buildings for solar access. The rule that requires spacing the buildings at a distance equal to 1.7 times their height to ensure solar access has a very strong impact on the built volumes by constraining the form and height of the buildings. Com-bined with the setback rule, the rule pre-vents a perimeter development of the block, it requires leaving the land in the superblock almost empty, with plot coverage ratios around 15 percent. The only solution left to developers to increase density is to make the buildings larger and increase their height, with detrimental effects on energy efficiency.
Largescale zoning. Chinese zoning practices are set at a very large scale, preventing a finer grain of zoning that would allow mixed uses. These practices could be revisited to promote greater mixed uses, which would bring ame-nities, jobs, and services, closer to housing, thus reducing transport needs.
Figure 7.18 Superposition of carbon emissions per capita for private transport and urban density in metropolitan London, New York, and Paris
Source: Bourdic 2011.
New York City, United StatesParis, France
London, United Kingdom
Carb
on e
miss
ion
for p
rivat
e tr
ansp
ort
(tCO
2 per
cap
ita) 10
12
8
4
6
2
14
00 2010 30 40 50 60 70
Ubrban density (1,000 inhabitants per km2)
g r e e n U r b a n i z a t i o n 481
Compact urban forms will need strict emission controls because more people will be exposed to pollution in a smaller area. Many public outcries from environmental incidents originated in cities in China. When people are concentrated in a smaller area, a single negative environmental incident can have large multiplier effects on human health. Therefore, policies that promote redensifi-cation offer both challenges and opportuni-ties. While exposure levels have increased as a result of urbanization, measures to reduce exposure in dense areas can reach more people, more quickly, and thus improve cost effectiveness.
Providing sustainable and safe urban transportation
An efficient transport system supports urban economic growth by moving goods and peo-ple within and between cities quickly and at low cost.21 Transport is also critical for social inclusion. As cities grow in size, the distance between one’s residence and one’s job also rises, and it is often low-income groups who can find affordable housing only far away from economic centers. Besides supporting growth and inclusion, transport also affects sustainability. Overreliance on individual transport and a large stock of inefficient vehicles lead to congestion, rising energy con-sumption, and air pollution. China’s cities have two tasks to ensure that urban trans-port not only supports inclusive growth but also sustainability objectives. First, they can avoid emissions and lower congestion by continuing to encourage a shift to public and nonmotorized transport with much greater attention to the quality and convenience of public transport services. Price instruments and regulations will help reduce car travel, but urban planners should also create com-pact cities with well-coordinated land use and transportation plans where alternatives to automobiles are more feasible and effi-cient. Second, for vehicle traffic that cannot be avoided, the second priority is to reduce emissions from a cleaner vehicle fleet. Here, China should broaden achievements in trans-port pollution control by accelerating the switch to ultra-low-sulfur diesel and gasoline
for vehicles nationwide, transitioning to new vehicle emission standards for heavy-duty vehicles, and rapidly phasing out high- emis-sion vehicles that account for a large share of emissions.
Reducing the environmental burdens imposed by a growing transport sector is not just a welfare issue. Impacts from the sector also have a large, measurable cost. Time lost to congestion and associated higher fuel use causes by far the highest external, or indirect, costs from transportation, followed by health damages from air pollution, traffic safety, and noise pollution. International estimates of total indirect costs from road transport range from $0.05 to more than $0.40 a kilo-meter (Proost and van Dender 2011). Two studies have estimated the indirect costs from transport in Beijing. Mao, Zhu, and Duan (2012) put the figure at 4.2 percent of GDP for congestion costs only, while Creutzig and He (2009) put it at 7.5–15 percent for all types of externalities. Even at the low end of these estimates, the large external costs from private transport can justify significant pol-icy intervention including support for public transit from general revenue or dedicated taxes where preferred policies such as conges-tion charges or energy and carbon taxes are not feasible (Parry and Small 2009).
Encouraging more efficient urban transport
Urban road expansion will not be able to keep up with the continuously rising number of vehicles in China’s cities. China’s vehicle fleet has grown by more than 14 percent a year on average over the past two decades, largely fueled by private car ownership. In 1990, China had 5.5 million vehicles, of which only 800,000 (14.5 percent) were pri-vately owned. In 2012, China had 121 mil-lion vehicles, of which 93 million (77 percent) were private cars. As incomes rose, the num-ber of vehicles grew even faster. While better mobility is a universal human ambition, the reality has been that in Chinese cities, more cars have actually reduced mobility because many are stuck in traffic for long hours. So far, the response has been to increase the sup-ply of roads, creating impressive urban road networks in many cities.

482 U r b a n C h i n a
As road construction becomes more costly or impossible in dense urban areas, more emphasis must be put on demand manage-ment, which reduces the amount of travel and shifts traffic to public transit. The most effec-tive management measure is to fully charge drivers the cost of using private vehicles, including environmental and social costs. Road pricing, including congestion charges in all or part of a city, is the economically most efficient management measure, but it is com-plex to implement and, like all price instru-ments, affects lower-income drivers relatively more. There are therefore few cities, such as London and Singapore, where comprehensive congestion charging has been introduced. It will often be more manageable to charge tolls on selected roads, such as major arter-ies or bridges into a city, as in Wuhan where electronic toll collection has been introduced on seven bridges and one tunnel. Parking policies also affect traffic densities. Cities can ration parking spaces, for instance by reduc-ing required minimum parking spaces for new housing or office developments as is now happening in many U.S. cities. And charges for parking spaces should reflect the value of the land, which often exceeds the cost of the vehicles that occupy it.22
Other demand management approaches already used in some Chinese cities include quotas on license plates assigned through auctions or lotteries. International evidence
has been mixed on temporary restrictions, for instance based on license plate numbers. Well-designed restrictions can reduce emis-sions quickly (Viard and Fu 2013), but they are usually not sufficient to stem the growth of the car fleet over time, and, if poorly designed, they can increase emissions as many households purchase lower-efficiency second cars with different plate numbers. The central government can play a role in establishing clear guidelines for introducing demand management procedures for con-gested cities. Technical standards and public communication strategies to make conges-tion and parking charges more acceptable would be included. While national guidelines provide a reference frame, the most appropri-ate specific policy mix will be city specific.
Policies to reduce driving by making pri-vate vehicle use more expensive or more dif-ficult should go hand in hand with making mass transit options more convenient. Chi-nese cities have vastly expanded public trans-port. The total length of bus lines in opera-tion increased from 145 thousand kilometers in 2006 to 520 thousand kilometers in 2011, about 62.5 thousand kilometers a year (fig-ure 7.19). The total length of metro lines in operation increased from 621 kilometers in 2006 to 1,699 kilometers in 2011. By the end of 2012, the total length of metro lines in operation had reached 2,008 kilometers in 17 cities in China. Moreover, metro systems
Figure 7.19 Total length of bus and metro lines in operation
Source: NBS 2007a–12a.
600,000
a. Total length of bus lines in operation
500,000
400,000
300,000
200,000
100,000
02006
km km
2007 2008 2009 2010 2011
145,012169,384 175,366
237,259
488,812519,554
1,200
1,400
1,600
1,800
b. Total length of metro lines in operation
1,000
800
600
400
200
02006 2007 2008 2009 2010 2011
621763
835999
1,471
1,699

g r e e n U r b a n i z a t i o n 483
in 28 additional cities have been approved or are already under construction, and the total length in operation is expected to reach 5,000 kilometers by 2015.
Despite these significant capital invest-ments in and operating subsidies for public transport in recent years, its modal share in major Chinese cities remains lower than in other major cities such as Seoul, New York City, and Tokyo. Not only is more invest-ment in capacity needed, however, service quality and comfort needs to be improved through better system integration and acces-sibility. Better service integration includes more convenient, efficient, and safer access to train stations and bus stops, particularly for walkers, cyclists, and people with disabil-ities; better connections between mass tran-sit and buses; and improved and expanded park-and-ride lots. Integrated traveler infor-mation systems facilitate trip planning and keep travelers informed. Giving buses pri-orities on roads makes the service more con-venient, reliable, and efficient. That can be done by creating bus-only lanes and queue jumps that allow buses to proceed with little or no traffic delay, providing traffic signal priority at certain intersections, and install-ing preboarding payment systems to allow passengers to board buses faster. These measures help buses keep to their schedules, improve bus service, and reduce roadway congestion.
Transit-oriented development (TOD) can further improve the convenience of public transit and the efficiency of service provision but has rarely been a specific aim of major developments and transport investments in China. In California, research showed that TOD can increase ridership on rail and buses by three to four times relative to control sites (Lund, Cervero, and Willson 2004). TOD emphasizes compact, mixed-use buildings and neighborhoods that encourage walking, cycling, and use of public transit. The high density of residential and commercial build-ings allows proximity to and a functional relationship with transit stations and termi-nals, giving easy access to high-quality public transport to a large share of the population. Construction of transit hubs as part of TOD also raises surrounding land values signifi-
cantly. Part of the increased land values can be captured through taxes or special assess-ments, thus helping to finance public invest-ments. Better road planning complements TOD through hierarchically classified road networks providing complete city coverage, and through people-oriented facilities for safe walking and biking such as those provided by “complete streets” that consider all transport modes equally.
To make integrated, multimodal transport planning work requires close cooperation among the planning bureau, development and reform commission, finance bureau, con-struction commission, transport bureau, traf-fic police department, land resources bureau, and others. Many cities have therefore set up a metropolitan transport authority with responsibility for planning and overseeing all transport mode investments and opera-tions in that metropolis. Hong Kong SAR, China, and Singapore offer good examples in the region. Vancouver and London provide good international examples. Such transport agencies are suitable not only for large cit-ies. In the United States, for example, almost 400 federally mandated and federally funded metropolitan planning organizations bring together representatives from a range of local and state agencies and from different transportation modes, such as public transit, freight, bicycling, and pedestrian. The plan-ning organizations also have a citizens’ advi-sory committee that represents community groups, professional organizations, neighbor-hood associations, and the private sector.
Building and operating an efficient trans-port network is not feasible without dedi-cated and predictable funding mechanisms, especially because of the long planning and construction process and the long life span of transport infrastructure. A dedicated fund to improve public transport services could be created in cities through various charges on private vehicles, including earmarking a share of the fuel levy and vehicle purchase fee, currently collected by the central govern-ment, but which is mostly used for highways. China’s government should revisit the current central road-financing arrangement to allow for the establishment of urban transport funds for major cities.

484 U r b a n C h i n a
Controlling vehicle emissions in urban areas
Transport-related emissions, mostly from road transport, are a large and growing con-tributor to air pollutants in urban areas in China. In 2011, vehicle emissions produced 621,000 tons of PM2.5 in China, 4.4 million tons of hydrocarbons, 6.4 million tons of NOx, and 34. 7 million tons of CO. Vehicle emissions account for a high share of emis-sions in cities: for example, 56 percent of NOx and 22 percent of PM2.5 in Beijing, 25 percent of PM2.5 in Shanghai, and around 30 percent of PM2.5 in Shenzhen.23 A dispro-portionate level of NOx and PM2.5 vehicle emissions comes from relatively few vehicles. In China in 2011, about 4.6 million diesel-fueled heavy-duty and 2.7 million medium-duty freight vehicles together accounted for 7.7 percent of the total vehicle fleet but 62.8 percent of NOx and 69.6 percent of PM2.5 emissions from all vehicles (MEP 2012).
Sixty percent of emissions of four major air pollutants are caused by pre-China I and China I emission standard vehicles, which account for only a quarter of all vehicles (fig-ure 7.20). A China I truck, if properly main-tained, emits 36 times more PM2.5, 20 times more NOx, 9 times more hydrocarbon, and
3 times more CO than a similar truck that achieves the latest standard used in Europe (Euro VI). Vehicles also cause a significant and rising share of greenhouse gas emissions. Nationwide, the transport sector accounts for 7.1 percent of CO2 emissions from fossil fuel burning, of which 78 percent are from road transport, according to IEA figures for 2010 (IEA 2013a).
While the overall fleet is becoming cleaner, the sheer number of new vehicles is still caus-ing emissions to rise. Continued efforts to reduce vehicle emissions are needed. China has already made major progress over the past decade in reducing such pollution. It has tightened emissions standards following European benchmarks, although with a time lag. Since 2009, it has also begun to encour-age scrapping of older vehicles. Fuel stan-dards have been improved to some extent. In its retrospective, the International Council of Clean Transportation (ICCT) estimated that the programs adopted avoided 44 mil-lion tons of hydrocarbons, 239 million tons of CO, 38 million tons of NOx, and 7 mil-lion metric tons of particulate matter, pre-venting an estimated 170,000 deaths in 2010 (Fung and others 2010). In the long term, the use of natural gas could be expanded in the
Figure 7.20 Vehicle emissions contributions in China
Source: MEP 2012b. Source: MEP 2012b.
Diesel vehicleGasoline vehicle
Natural gas vehicle Pre-China IChina I
China II China IV andaboveChina III
Perc
ent
100
80
90
70
60
40
10
CO HC NOx PM0
50
30
20 15
27.60
67.40
99
0.000.00
82.40
a. By fuel type
69.60
29.50
2.60 2.80 3.10
Emiss
ion
shar
e (%
)
60
40
10
CO HC NOx PM0
50
30
20
b. By vehicle emission standards category
48.3 50.7
40.0
48.9
21.6 19.6
21.3
27.0
13.9 13.2
13.0
10.7 15.3 15.8
25.3
13.3
0.9 0.7 0.4 0.1
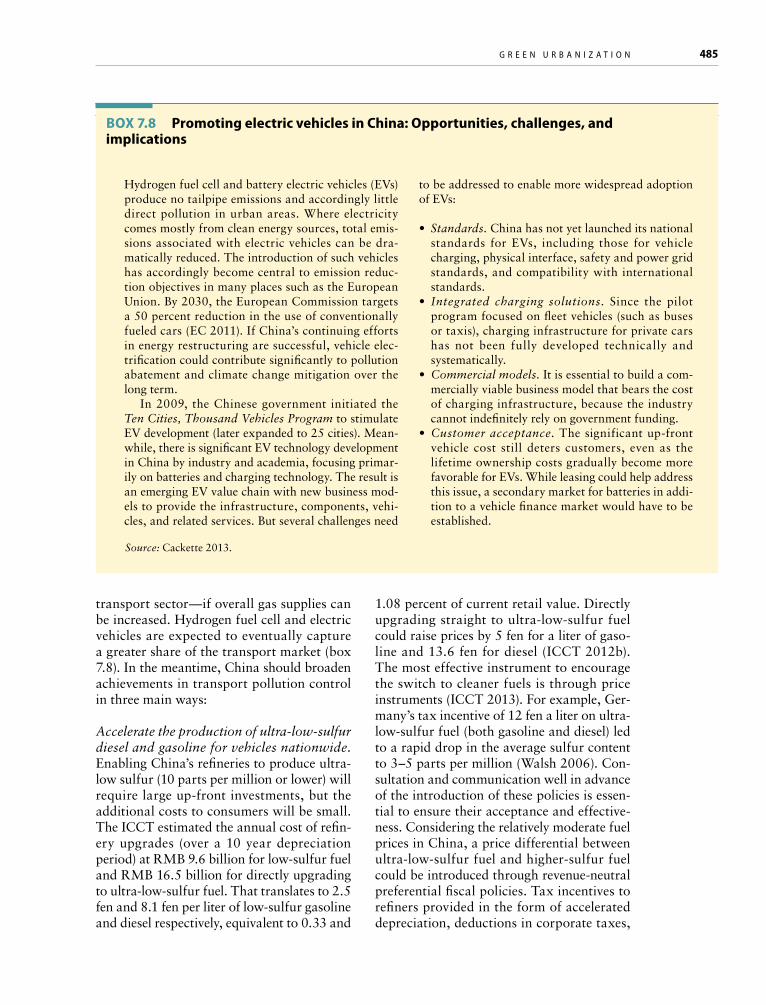
g r e e n U r b a n i z a t i o n 485
transport sector—if overall gas supplies can be increased. Hydrogen fuel cell and electric vehicles are expected to eventually capture a greater share of the transport market (box 7.8). In the meantime, China should broaden achievements in transport pollution control in three main ways:
Accelerate the production of ultralowsulfur diesel and gasoline for vehicles nationwide. Enabling China’s refineries to produce ultra-low sulfur (10 parts per million or lower) will require large up-front investments, but the additional costs to consumers will be small. The ICCT estimated the annual cost of refin-ery upgrades (over a 10 year depreciation period) at RMB 9.6 billion for low-sulfur fuel and RMB 16.5 billion for directly upgrading to ultra-low-sulfur fuel. That translates to 2.5 fen and 8.1 fen per liter of low-sulfur gasoline and diesel respectively, equivalent to 0.33 and
1.08 percent of current retail value. Directly upgrading straight to ultra-low-sulfur fuel could raise prices by 5 fen for a liter of gaso-line and 13.6 fen for diesel (ICCT 2012b). The most effective instrument to encourage the switch to cleaner fuels is through price instruments (ICCT 2013). For example, Ger-many’s tax incentive of 12 fen a liter on ultra-low-sulfur fuel (both gasoline and diesel) led to a rapid drop in the average sulfur content to 3–5 parts per million (Walsh 2006). Con-sultation and communication well in advance of the introduction of these policies is essen-tial to ensure their acceptance and effective-ness. Considering the relatively moderate fuel prices in China, a price differential between ultra-low-sulfur fuel and higher-sulfur fuel could be introduced through revenue-neutral preferential fiscal policies. Tax incentives to refiners provided in the form of accelerated depreciation, deductions in corporate taxes,
Hydrogen fuel cell and battery electric vehicles (EVs) produce no tailpipe emissions and accordingly little direct pollution in urban areas. Where electricity comes mostly from clean energy sources, total emis-sions associated with electric vehicles can be dra-matically reduced. The introduction of such vehicles has accordingly become central to emission reduc-tion objectives in many places such as the European Union. By 2030, the European Commission targets a 50 percent reduction in the use of conventionally fueled cars (EC 2011). If China’s continuing efforts in energy restructuring are successful, vehicle elec-trification could contribute significantly to pollution abatement and climate change mitigation over the long term.
In 2009, the Chinese government initiated the Ten Cities, Thousand Vehicles Program to stimulate EV development (later expanded to 25 cities). Mean-while, there is significant EV technology development in China by industry and academia, focusing primar-ily on batteries and charging technology. The result is an emerging EV value chain with new business mod-els to provide the infrastructure, components, vehi-cles, and related services. But several challenges need
Box 7.8 Promoting electric vehicles in China: opportunities, challenges, and implications
to be addressed to enable more widespread adoption of EVs:
• Standards. China has not yet launched its national standards for EVs, including those for vehicle charging, physical interface, safety and power grid standards, and compatibility with international standards.
• Integrated charging solutions. Since the pilot program focused on fleet vehicles (such as buses or taxis), charging infrastructure for private cars has not been fully developed technically and systematically.
• Commercial models. It is essential to build a com-mercially viable business model that bears the cost of charging infrastructure, because the industry cannot indefinitely rely on government funding.
• Customer acceptance. The significant up-front vehicle cost still deters customers, even as the lifetime ownership costs gradually become more favorable for EVs. While leasing could help address this issue, a secondary market for batteries in addi-tion to a vehicle finance market would have to be established.
Source: Cackette 2013.
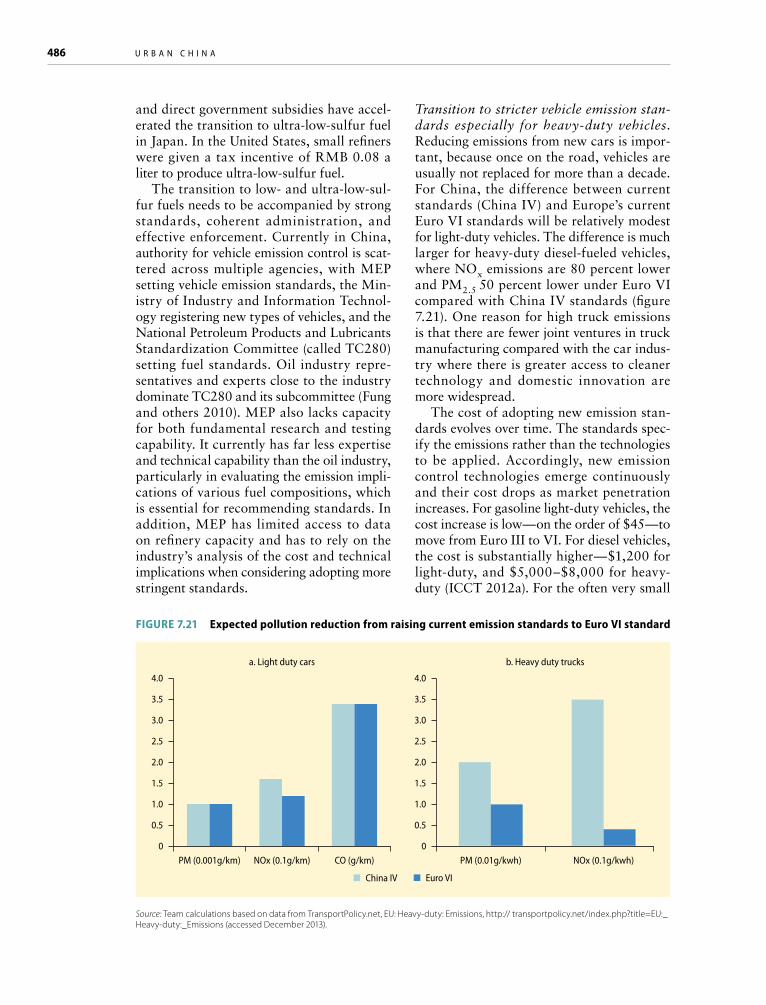
486 U r b a n C h i n a
and direct government subsidies have accel-erated the transition to ultra-low-sulfur fuel in Japan. In the United States, small refiners were given a tax incentive of RMB 0.08 a liter to produce ultra-low-sulfur fuel.
The transition to low- and ultra-low-sul-fur fuels needs to be accompanied by strong standards, coherent administration, and effective enforcement. Currently in China, authority for vehicle emission control is scat-tered across multiple agencies, with MEP setting vehicle emission standards, the Min-istry of Industry and Information Technol-ogy registering new types of vehicles, and the National Petroleum Products and Lubricants Standardization Committee (called TC280) setting fuel standards. Oil industry repre-sentatives and experts close to the industry dominate TC280 and its subcommittee (Fung and others 2010). MEP also lacks capacity for both fundamental research and testing capability. It currently has far less expertise and technical capability than the oil industry, particularly in evaluating the emission impli-cations of various fuel compositions, which is essential for recommending standards. In addition, MEP has limited access to data on refinery capacity and has to rely on the industry’s analysis of the cost and technical implications when considering adopting more stringent standards.
Transition to stricter vehicle emission standards especially for heavyduty vehicles. Reducing emissions from new cars is impor-tant, because once on the road, vehicles are usually not replaced for more than a decade. For China, the difference between current standards (China IV) and Europe’s current Euro VI standards will be relatively modest for light-duty vehicles. The difference is much larger for heavy-duty diesel-fueled vehicles, where NOx emissions are 80 percent lower and PM2.5 50 percent lower under Euro VI compared with China IV standards (figure 7.21). One reason for high truck emissions is that there are fewer joint ventures in truck manufacturing compared with the car indus-try where there is greater access to cleaner technology and domestic innovation are more widespread.
The cost of adopting new emission stan-dards evolves over time. The standards spec-ify the emissions rather than the technologies to be applied. Accordingly, new emission control technologies emerge continuously and their cost drops as market penetration increases. For gasoline light-duty vehicles, the cost increase is low—on the order of $45—to move from Euro III to VI. For diesel vehicles, the cost is substantially higher—$1,200 for light-duty, and $5,000–$8,000 for heavy-duty (ICCT 2012a). For the often very small
Figure 7.21 expected pollution reduction from raising current emission standards to euro Vi standard
Source: Team calculations based on data from TransportPolicy.net, EU: Heavy-duty: Emissions, http:// transportpolicy.net/index.php?title=EU:_Heavy-duty:_Emissions (accessed December 2013).
China IV Euro VI
4.0
3.0
1.0
0.5
PM (0.001g/km) NOx (0.1g/km) CO (g/km)0
3.5
2.5
1.5
2.0
a. Light duty cars
4.0
3.0
1.0
0.5
PM (0.01g/kwh) NOx (0.1g/kwh)0
3.5
2.5
1.5
2.0
b. Heavy duty trucks

g r e e n U r b a n i z a t i o n 487
trucking companies in China, these are sub-stantive outlays, but the accelerated adop-tion of new standards is still justified by the large anticipated health benefits. For such regulations to be effective, they need to be supported by credible enforcement. Oth-erwise fake certificates and counterfeited or mislabeled fuel will inevitably appear. Enforcement requires resources and sufficient authority to apply fines, as in the case under the Texas Regional Emissions Enforcement Program.24
Achieving significant emission reduc-tions in the urban road transport sector also requires addressing the administrative orga-nization for enforcing vehicle emissions stan-dards. The current Air Pollution Prevention and Control Law provides an incomplete framework to manage emissions from vehi-cles. It does not explicitly confer to any min-istry the authority to recall vehicles that do not meet emission standards. While it allows provincial and municipal level EPBs to ran-domly select vehicles for in-use testing (like conducting road-side tests), it does not explic-itly grant MEP such authority. Lacking clear authority to conduct in-use testing, to assess a penalty on manufacturers producing non-conforming vehicles, or to require manufac-turers to recall noncompliant vehicles, MEP has weak enforcement power and limited means to deter production of sub-standard vehicles.
Rapidly phase out highemission vehicles. With China’s rising motorization rate, the number of new vehicles entering its road-ways each year far exceeds the number of old vehicles being scrapped. To lower the average emissions of the entire fleet, the phase-out of the most polluting cars and trucks from urban areas should be accelerated. Gov-ernments in other countries have used two main measures to achieve this goal: penal-izing high-emission vehicles, and providing incentives for early scrapping. Annual vehicle registration fees based on a vehicle emission levels provide the most straightforward way to charge for the damages caused. Seventeen European countries have also extended this concept to address climate change concerns and base all or part of their registration fees
on vehicle CO2 emissions.25 Individual cit-ies, such as Milan, have also begun to penal-ize high emission vehicles by either charging them to enter the central and more congested areas or prohibiting them altogether. Provid-ing a subsidy for owners to scrap high-emis-sion vehicles can also be an effective way of accelerating fleet turnover. Several countries introduced time-limited scrapping programs in recent years, although often primarily as a way to stimulate the economy during reces-sion.26 The environmental benefits of scrap-ping programs need to be carefully evaluated because running a higher-emission vehicle for a few additional years may have less impact than the emissions from producing a new car, especially when the emission requirements for the new car are not strict (Gayer and Parker 2013). Environmental objectives may sometimes be better reached through taxes on high-emission vehicles (Li and Wei 2013).
Meeting urban energy needs by prioritizing efficiency and greening supply
China has made enormous strides to improve the energy efficiency of its economy and miti-gate some of the environmental impacts of burning fossil fuels in urban areas. Reduc-tions in energy intensity reductions during the 11th Five-Year Plan averted the use of 630 million tons of coal equivalent, or 1.46 billion tons of CO2 emissions. Uncontrolled emissions of SOx, NOx, and PM10 are in decline overall. Yet, the scale and complex-ity of the challenge remains daunting. Coal still hovers at around 70 percent of primary energy consumption, a similar percentage as in 1980, and severe air pollution persists in many cities despite ever stricter standards. As China’s urban economy grows more efficient and sophisticated, continuing with the same approach to energy policy will not yield the visible, stepwise improvements in environ-mental quality that China’s urban dwellers will increasingly demand.
With efforts in three main areas, China’s cities can accelerate their progress in light-ening the environmental footprint of their energy use. First, energy planning should be coordinated with the planning process for

488 U r b a n C h i n a
cities. City planners should work with energy planners to take a systematic approach in evaluating ways to optimize energy con-sumption by reducing demand across the main end-using sectors and greening the sup-ply mix to meet the residual energy demand. Second, broad-based energy efficiency efforts should be accelerated in the main end-using sectors through a better balance of regula-tions and market-based policy tools. Third, after measures are taken to reduce energy demand, direct use of coal in cities should be eliminated as much as possible by expand-ing access to natural gas, removing barriers to commercial renewable energy, and con-tinually strengthening emissions controls of remaining coal-fired power plants and indus-try. Across all three policy areas, encouraging compact urban forms will be fundamental.
The rapid, sustained growth of energy demand presents a unique environmental challenge for China’s cities. Few modern cit-ies in the world depend on solid fuels to the extent that Chinese cities do. In London, for example, household coal use was banned in the 1950s in response to serious air pollu-tion. By contrast, 43 percent of Shanghai’s primary energy supply still comes from burn-ing coal inside the city’s borders (8 percent more is from coal-fired power “imported” into the city) (figure 7.22). Nor is the predom-inance of coal limited to China’s big cities.
For example, it makes up 65 percent of the primary energy supply in Zibo City, Shan-dong. In China’s 15 cold climate provinces, where provision of heating is a legal require-ment, coal represents over 90 percent of the fuel burned for district heating. Although a greater share of coal is being used in larger, more efficient power (and heating) units that are subject to stricter emissions standards—and pollution controls in all sectors have improved—the absolute increase in coal use in cities, driven by demand, is the number-one reason for poor local air quality and CO2 emissions. Intensive coal use has resulted in per capita CO2 emissions in large Chinese cit-ies that are already higher than in many other cities around the world (figure 7.23).
Industry uses the lion’s share of energy in urban areas, representing an estimated 70 percent of total energy demand and 69 per-cent of electricity use in 2010 (figure 7.24). Heavy industries have been responsible for most of the historic growth in urban energy demand (Hong and others 2011; Ma and others 2012). Because these industries rely mainly on coal, they have also deepened the carbon footprint of Chinese cities. In 11 big cities studied by H. Wang and others (2012), 75 percent of total greenhouse gas emissions came from industrial fossil-fuel use (figure 7.25). By comparison, industrial emissions represent only 10 percent of total emissions
Figure 7.22 Primary energy supply in Beijing, Shanghai, and Chongqing municipalities, 2011
Source: Authors’ estimates based on data from NBS 2012c; China Electric Power Yearbook Committee 2011; and State Grid Corporation of China 2011.
CoalCoal (from imported electricity)
Oil NuclearRenewablesNatural gas
Beijing(52.7% coal)
Shanghai(51.3% coal)
Chongquing(67.4% coal)
62.5%
4.9%
10.5%
9.5%
0.0% 12.7%
42.9%
8.4%
40.6%
6.5% 0.4%
1.2%
26.3%
26.4%
32.2%
14.0%
0.0% 1.1%

g r e e n U r b a n i z a t i o n 489
for Tokyo (2007), 16 percent for New York City (2011), and 7 percent for London (2006).
Although industry will continue to account for the majority of energy demand in urban areas, energy for heating, cooling, lighting, and equipment in buildings is pro-jected to be one of the fastest-growing seg-ments of demand (Fridley and others 2012). In China’s cities, energy use per square meter of floor space in buildings is still only a small fraction of that used in buildings in high-income countries (figure 7.26). Drivers of energy demand vary between residential and commercial buildings. Based on Fridley and others (2012) and Levine and others (2012), much of the energy used in urban residential buildings will continue to be for space heat-ing and cooling, but by 2020, appliances
Figure 7.23 Per capita Co2 emissions for 11 large Chinese cities and selected cities around the world
Source: Chinese cities: H. Wang and others 2012; other cities: Carbon Disclosure Project 2012. Note: Per capita emissions for Chinese cities and C40 cities reporting Scope I and II emissions using similar methodologies.
Chinese citiesMajor cities throughout the world
WuxiDallas, United States
WuhanTianjin
Chicago, United StatesShanghai
HangzhouPhiladelphia, United States
ZhengzhouBeijing
GuangzhouNanjing
Durban, South AfricaAmsterdam, the Netherlands
ShenyangNew York City, United States
Berlin, GermanyLondon, United Kingdom
HelsinkiTokyo, Japan
Copenhagen, DenmarkJakarta, Indonesia
Moscow, Russian FederationStockholm, Sweden
ChongqingBogota, Colombia
São Paulo, Brazil
16.514.4
13.812.111.8
10.69.99.8
9.28.6
7.97.77.5
6.86.7
6.26.0
5.65.5
4.74.74.6
4.23.3
2.92.2
1.4
Figure 7.24 industrial energy use as a share of total energy demand in cities, 2010
Source: World Bank calculations using data from Renmin University 2013; NBS 2011a, 2011b. Note: Electricity use is for downtown areas (main city districts) of the 287 municipalities at administrative prefecture level or above; total energy use is for the entire municipality; where 2010 data unavailable, 2009 data are used instead.
Industry share of total energy Industry share of electricityPe
rcen
t
80
70
55
Small Medium Large
City size
Mega50
75
67
78
7374
64
66
55 55
65
60
Figure 7.25 industrial and nonindustrial Co 2 emissions per capita in selected Chinese and other cities
Source: China: H. Wang and others 2012; New York City: Dickinson and others 2012; London: Mayor of London 2007; Tokyo: Tokyo Metropolitan Government. Note: Consumption-based accounting of greenhouse gas emissions, including emissions from direct energy use and from the power sector allocated to end-use sectors. Chinese data are for 2005, New York City data are for 2011, London data are for 2006, and Tokyo data are for 2007.
Industry Nonindustry
WuxiWuhanTianjin
ShanghaiHangzhou
ZhengzhouBeijing
GuangzhouNanjing
ShenyangChongqing
New York City, United StatesLondon, United Kingdom
Tokyo, Japan
0 5
Tons CO2 equivalent per capita
10 15 20

490 U r b a n C h i n a
will account for a larger share of demand. Increased energy requirements for commer-cial buildings will come mostly from light-ing, plug-in equipment, and central space conditioning.
An estimated quarter of urban households in China rely on coal for their cooking and heating needs, representing an important and at times overlooked source of local exposure to harmful air pollution, most notably very fine particulates (PM2.5) (figure 7.27). Coal-burning stoves and boilers typically have short stacks and no filtering systems. They are often used in peri-urban areas, where
clusters of modern residences are intermixed with more rudimentary housing. Household coal use is most prevalent in—although not limited to—the poorer provinces, especially in the north (World Bank 2013a).
Planning for greener urban energy systems
Leading cities around the world are start-ing to take a more systematic look at how they can reduce the environmental foot-print of their energy use by making energy supply and demand a more integral part of their city plans. Planning for greener urban energy systems is largely about finding syner-gies between different energy users in urban areas that can achieve environmental objec-tives through the most resource efficient and cost-effective path. Improving energy effi-ciency across the different end-using sectors is a top priority, followed by identifying local sources of green energy, “importing” cleaner sources of energy from outside city borders, and mitigating the residual environmental impacts from energy use. This approach to planning will require dedicated leadership to establish effective coordination across dif-ferent departments and jurisdictions accord-ing to specific local circumstances. China is developing an ever-increasing range of targets for “eco-cities” and “low-carbon cities.” If China’s ambition is to bend its environmen-tal Kuznet’s curve more quickly, then it can encourage cities to do the same, especially the more capable ones. As China considers a mix of incentives and regulations to make cities greener, “green” cities could be recognized, like “top runners” in industrial energy effi-ciency, as those that not only meet their tar-gets but exceed them.
While ensuring safe and reliable energy supply, some cities have recently taken a broader view of how they can control their own emissions and environmental footprint by looking at both energy demand and char-acteristics of the energy mix to see what they can do to green their overall urban energy systems. Traditional sector plans will con-tinue to be needed—new approaches will always depend on strong and well-managed sectors, but they often neglect looking across sectors. Nearly all urban infrastructure sys-
Figure 7.26 energy use in commercial buildings in China, the united States, and Japan
Source: Fridley and others 2012; Levine and others 2012.Note: Kilowatt hours per square meter of floor space.
Kwh
per m
2350
300
200
50
China(2005)
UnitedStates(2003)
Japan(2006)
China(2030)
0
250
150
100
157
288309
328
Figure 7.27 Primary household cooking energy in urban and rural areas, 2006
Source: World Bank 2013a.
ElectricityGas
KeroseneBiomass
CoalOther
Urban
Rural
0 25
Percent
50 75 100

g r e e n U r b a n i z a t i o n 491
tems depend on energy to function—water supply, wastewater treatment, solid waste management, and, of course, electricity, heat-ing, and cooling. Until recently, city manag-ers have tended to overlook the links between energy end-users, and the ever-growing pos-sibility for end-users to capture and use waste energy and generate distributed energy. At the strategic level, a city should encourage coor-dinated and reoriented planning for meeting specific emission and environmental goals; this planning would systematically look first to reduce energy consumption as much as possible, then at supply options (prioritizing clean energy resources), and then to manag-ing residual emissions from the remaining use of fossil fuels. As this coordination matures, planning methods integrating various energy sources can be introduced, including energy efficiency (box 7.9). As China’s power sector planning process evolves, energy efficiency should be considered as a resource that is compared with conventional generation to develop a least-cost plan for meeting demand (RAP 2013). The national plan would need coordination with and support from provin-cial and national energy planning processes.
Urban planners should pay much closer attention to neighborhood-scale planning, especially for existing cities. Neighborhoods are fundamental building blocks of cities and can be a useful unit of analysis for under-standing city energy patterns and issues. For instance the energy performance of a neigh-borhood comes from complex interactions of several factors, including construction and (eventual) demolition of buildings, which embody energy over their life cycle; operation of the buildings for heating, cooling, light-ing, and the like; travel needs of residents and users of the neighborhood; and the ability of the neighborhood to produce on-site clean energy, offsetting the need to import it from outside its boundary. A joint MIT, Univer-sity of Shandong, and Normal University of Beijing study compared 27 different neigh-borhoods in Jinan city, taking into account embedded, operational, and transportation-related energy consumption (MIT-Tsinghua-EF 2011). The study showed significant dif-ferences among different neighborhood forms and demonstrated that high-rise superblock forms consume up to twice as much energy as other neighborhoods (figure 7.28). Analyses
Efficiency Vermont was the first “energy efficiency utility” in the United States and provides a good example of how local governments can structure a results-focused model using a third-party entity to package and deliver energy savings. Efficiency Ver-mont is a nonprofit corporation created to provide incentives and support to consumers for energy-effi-ciency programs. The corporation is run by a public board that oversees all power utilities; its members are appointed by the Vermont state governor and are subject to legislative confirmation. It is funded through surcharges on consumers’ electricity utility bills. Some of these funds are used to provide tech-nical assistance for auditing, project development, energy management, and employee training, as well as financial incentives to support companies invest-ing in energy efficiency projects. Financial compensa-tion levels for Efficiency Vermont are contingent on the corporation meeting specified targets for energy
Box 7.9 “energy efficiency utility”: efficiency Vermont, united States
savings delivered and other performance indica-tors. The better the corporation performs, the more compensation it receives (up to a ceiling set by the state government). Energy savings are independently monitored and verified to ensure actual savings are achieved. Targets and funding may be reviewed and adjusted every three years, as part of a longer 20-year plan.
Efficiency Vermont has been highly successful in meeting and exceeding its goals. In 2011, initia-tives financed and supported by Efficiency Vermont reduced the state’s electricity needs by about 2 per-cent, at a cost of 4.3 cents (about RMB 0.28) a kilo-watt hour—far cheaper than the 12.1 cents it would cost to supply a kilowatt hour of electricity. Because it had a good track record, it now participates in gen-eration planning by offering predictable load reduc-tion through its ability to package energy efficiency improvements.
Source: IIP 2012; Taylor, Trombley, and Reinaud 2012.
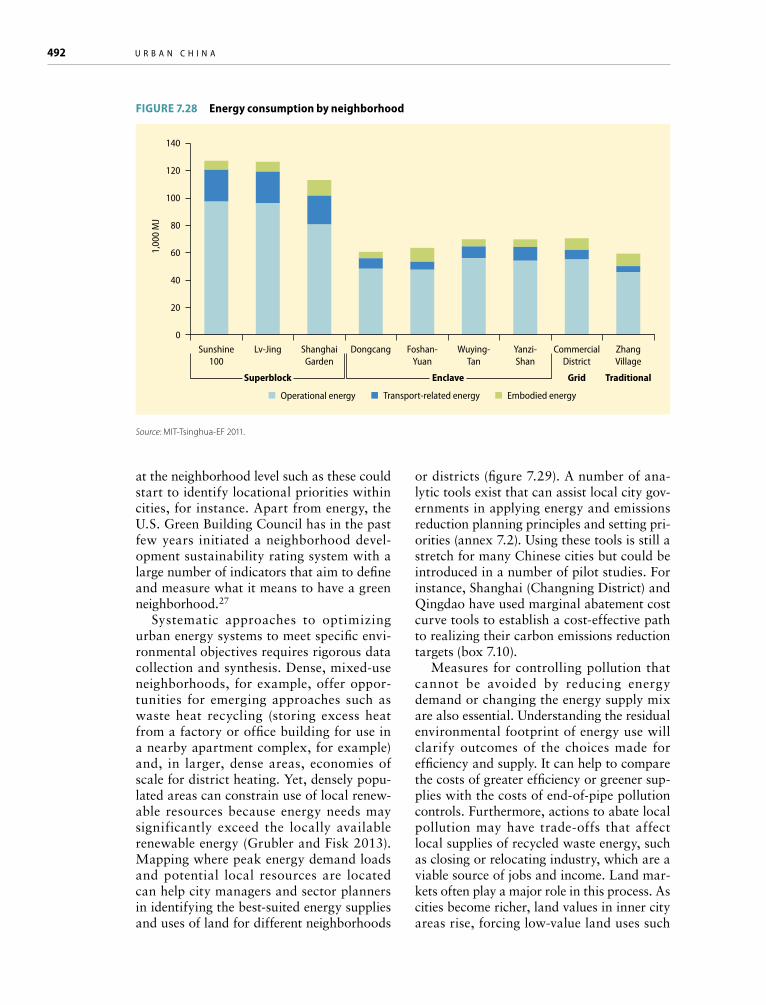
492 U r b a n C h i n a
at the neighborhood level such as these could start to identify locational priorities within cities, for instance. Apart from energy, the U.S. Green Building Council has in the past few years initiated a neighborhood devel-opment sustainability rating system with a large number of indicators that aim to define and measure what it means to have a green neighborhood.27
Systematic approaches to optimizing urban energy systems to meet specific envi-ronmental objectives requires rigorous data collection and synthesis. Dense, mixed-use neighborhoods, for example, offer oppor-tunities for emerging approaches such as waste heat recycling (storing excess heat from a factory or office building for use in a nearby apartment complex, for example) and, in larger, dense areas, economies of scale for district heating. Yet, densely popu-lated areas can constrain use of local renew-able resources because energy needs may significantly exceed the locally available renewable energy (Grubler and Fisk 2013). Mapping where peak energy demand loads and potential local resources are located can help city managers and sector planners in identifying the best-suited energy supplies and uses of land for different neighborhoods
or districts (figure 7.29). A number of ana-lytic tools exist that can assist local city gov-ernments in applying energy and emissions reduction planning principles and setting pri-orities (annex 7.2). Using these tools is still a stretch for many Chinese cities but could be introduced in a number of pilot studies. For instance, Shanghai (Changning District) and Qingdao have used marginal abatement cost curve tools to establish a cost-effective path to realizing their carbon emissions reduction targets (box 7.10).
Measures for controlling pollution that cannot be avoided by reducing energy demand or changing the energy supply mix are also essential. Understanding the residual environmental footprint of energy use will clarify outcomes of the choices made for efficiency and supply. It can help to compare the costs of greater efficiency or greener sup-plies with the costs of end-of-pipe pollution controls. Furthermore, actions to abate local pollution may have trade-offs that affect local supplies of recycled waste energy, such as closing or relocating industry, which are a viable source of jobs and income. Land mar-kets often play a major role in this process. As cities become richer, land values in inner city areas rise, forcing low-value land uses such
Operational energy Transport-related energy Embodied energy
1,00
0 M
J140
100
20
Sunshine100
Lv-Jing ShanghaiGarden
Superblock Enclave Grid Traditional
Dongcang Foshan-Yuan
Wuying-Tan
Yanzi-Shan
CommercialDistrict
ZhangVillage
0
120
60
80
40
Figure 7.28 energy consumption by neighborhood
Source: MIT-Tsinghua-EF 2011.

g r e e n U r b a n i z a t i o n 493
as heavy industry out of the city. Addition-ally, emission standards, if enforced, can play a supplemental role in relocating polluting enterprises. While the use of industrial waste heat for district heating may be an attractive option, for instance, it cannot be evaluated without taking these issues into account.
It is especially important to study how cities organized their many departments to work in an integrated and systematic man-ner. Because this systematic approach cuts across sectors, it does not have a natural con-stituency or agency that would “plan” urban energy systems. City mayors have been at the forefront of many global initiatives on climate change, and their leadership has been instru-mental for green initiatives in their cities. Cities such as New York (box 7.11), Paris, Rotterdam, and Stockholm that have under-taken systematic planning for low-carbon and green development, which is principally looking at urban energy systems, have all used different tools and institutional arrange-ments to meet their specific needs. Based on local conditions, establishing formal insti-tutional arrangements for this systematic approach to energy planning, optimization, and efficiency in Chinese cities would help meet energy consumption and pollution reduction goals.
Even if advanced tools and methods for energy planning are still out of reach for many cities, focusing on efficiency improve-ments in individual urban sectors can bring substantial benefits. Investments in energy efficiency can significantly lower the operat-
ing expenses of municipal service providers. Some measures can be done quickly, with-out waiting for new institutional mechnisms or plans. For example, cities can introduce requirements for the use of energy-efficient pumps or efficient street lighting that meet minimum energy performance standards and can be implemented through munici-pal investment approval processes or other oversight functions. Spending on electricity represents about 18 percent of the costs of supplying and treating water in medium to large cities in China—slightly better than the average for municipal water utilities in other upper-middle-income countries (19 percent) but still higher than the average for utilities in the upper-income countries (15 percent).28 There are significant disparities between urban water utilities in China and room for improvement among lower performers to reach best-practice levels. If wastewater treatment facilities in all Chinese cities could operate as efficiently as they do in Shenzhen (figure 7.30), annual electricity use could be reduced by about 3.1 terawatt hours (TWh), translating into cost savings around RMB 2.4 billion.29
Reorienting approaches to optimizing urban energy systems involves not only local but also regional and national stakeholders. Cities will need to work actively with energy supply companies, and perhaps with neigh-boring municipalities, to promote greater supply of cleaner energy. This work is impor-tant not only because cities host the major energy consumers in China and can there-
Source: UK Power Networks in City of London 2011.
Figure 7.29 Mapping London’s electricity demand
city governments in applying energy and emissions reduction planning principles and setting priorities (annex 7.2). Using these tools is still a stretch for many Chinese cities but could be introduced in a number of pilot studies. For instance, Shanghai (Changning District) and Qingdao have used marginal abatement cost curve tools to establish a cost-effective path to realizing their carbon emissions reduction targets (box 7.10).
[Figure 7.29 near here]
Figure 7.29 Mapping London’s electricity demand
Source: UK Power Networks in City of London 2011.
Measures for controlling pollution that cannot be avoided by reducing energy demand or changing the energy supply mix are also essential. Understanding the residual environmental footprint of energy use will clarify outcomes of the choices made for efficiency and supply. It can help to compare the costs of greater efficiency or greener supplies with the costs of end-of-pipe pollution controls. Furthermore, actions to abate local pollution may have trade-offs that affect local supplies of recycled waste energy, such as closing or relocating industry, which are a viable source of jobs and income. Land markets often play a major role in this process. As cities become richer, land values in inner city areas rise, forcing low-value land uses such as heavy industry out of the city. Additionally, emission standards, if enforced, can play a supplemental role in relocating polluting enterprises. While the use of industrial waste heat for district heating may be an attractive option, for instance, it cannot be evaluated without taking these issues into account.
Box 7.10 Tools for low-carbon development planning: The experience of Changning District in Shanghai
Shanghai City’s Changning District has set out a vision to become a leader in low-carbon urban development. To advance its vision, the district teamed up with the Shanghai Energy Conservation Supervision Center, the World Bank, and McKinsey & Co. in 2010 to develop a marginal CO2 abatement cost (MAC) curve for the Hongqiao area, an economic hub in the center of the district (figure B7.10.1). The MAC curve study will help the district set medium-term targets and policies for reducing CO2 emissions by allowing city leaders to evaluate the abatement potential of a menu of technologies, weigh the cost and difficulty of deploying these technologies, and identify priority investments. The results show that Changning District can meet its target of reducing the carbon intensity of its economy by 17 percent between 2010 and 2015 by investing RMB 500 million in a basket of easy-to-implement, least-cost technologies.
Figure B7.10.1 Marginal abatement cost curve for Hongqiao area of Changning District, Shanghai

494 U r b a n C h i n a
Shanghai City’s Changning District has set out a vision to become a leader in low-carbon urban devel-opment. To advance its vision, the district teamed up with the Shanghai Energy Conservation Supervi-sion Center, the World Bank, and McKinsey & Co. in 2010 to develop a marginal CO2 abatement cost (MAC) curve for the Hongqiao area, an economic hub in the center of the district (figure B7.10.1). The MAC curve study will help the district set medium-
Box 7.10 Tools for low-carbon development planning: The experience of Changning District in Shanghai
term targets and policies for reducing CO2 emissions by allowing city leaders to evaluate the abatement potential of a menu of technologies, weigh the cost and difficulty of deploying these technologies, and identify priority investments. The results show that Changning District can meet its target of reducing the carbon intensity of its economy by 17 percent between 2010 and 2015 by investing RMB 500 million in a basket of easy-to-implement, least-cost technologies.
Source: World Bank ESMAP 2013.
The MAC curve is a powerful tool to visualize abate-ment potentials and costs in setting CO2 reduc-tions for local city governments, but it does require a great deal of detailed information on energy use, technologies, and costs. It may be most appropri-
ate for larger, relatively sophisticated cities where data are readily available. By focusing squarely on the technology options, other options such as land use planning and behavioral changes are separately considered.
The MAC curve is a powerful tool to visualize abatement potentials and costs in setting CO2 reductions for local city governments, but it does require a great deal of detailed information on energy use, technologies, and costs. It may be most appropriate for larger, relatively sophisticated cities where data are readily available. By focusing squarely on the technology options, other options such as land use planning and behavioral changes are separately considered.
Source: World Bank ESMAP 2013.
It is especially important to study how cities organized their many departments to work in an integrated and systematic manner. Because this systematic approach cuts across sectors, it does not have a natural constituency or agency that would “plan” urban energy systems. City mayors have been at the forefront of many global initiatives on climate change, and their leadership has been instrumental for green initiatives in their cities. Cities such as New York (box 7.11), Paris, Rotterdam, and Stockholm that have undertaken systematic planning for low-carbon and green development, which is principally looking at urban energy systems, have all used different tools and institutional arrangements to meet their specific needs. Based on local conditions, establishing formal institutional arrangements for this systematic approach to energy planning, optimization, and efficiency in Chinese cities would help meet energy consumption and pollution reduction goals.
[Box 7.11 near here]
Even if advanced tools and methods for energy planning are still out of reach for many cities, focusing on efficiency improvements in individual urban sectors can bring substantial benefits. Investments in energy efficiency can significantly lower the operating expenses of municipal service providers. Some measures can be done quickly, without waiting for new institutional mechanisms or plans. For example, cities can introduce requirements for the use of energy-efficient pumps or efficient street lighting that meet minimum energy performance standards and can be implemented through municipal investment approval processes or other oversight functions. Spending on electricity represents about 18 percent of the costs of supplying and treating water in medium to large cities in China—slightly better than the average for municipal water utilities in other upper-middle-income countries (19 percent) but still higher than the average for utilities in the upper-income countries (15 percent).
Figure B7.10.1 Marginal abatement cost curve for Hongqiao area of Changning District, Shanghai
fore influence supply, but because ambient air pollution trends in China show that cities are heavily affected by energy consumption in surrounding provinces. Policies influenc-ing clean energy supplied from outside city boundaries also clearly need national lead-ership and support: green urbanization is a shared responsibility between national and local stakeholders.
The following sections of this chapter fol-low the principles of the approach above by
first exploring options for improving energy efficiency in key energy-using sectors of the urban economy and then identifying priority actions that can be taken to support shifts in the energy structure of cities.
rebalancing markets and mandates to reduce energy use in industry30
While China has built a comprehensive sys-tem of regulations, policies, and institutions

g r e e n U r b a n i z a t i o n 495
to improve energy efficiency in industries—and this system has achieved large reduc-tions in energy intensity—the ability of the system to continue to deliver energy savings will depend on how well it can match the growing sophistication and diversity of the enterprises in it. The current approach has relied heavily on administrative targets and regulations. The system can be strengthened by rebalancing administrative measures with more market-based approaches to motivate enterprises to plan, manage, and implement energy efficiency measures as a part of their own business self-interest.
Two broad areas where the national gov-ernment and cities can focus their efforts are rebalancing the current mix of incentives toward the increased use of market-based tools, backed by ambitious regulations and targets; and enabling companies, through supporting policies, to improve access to suitable technical and financial services for
energy efficiency. Provinces and local city governments play an instrumental role in industrial energy efficiency policy. They are on the front lines of implementing policies and have the most direct contact with enter-prises. They are often the pioneers of new policies, which are piloted locally and later scaled up.
The dominance of industry—its contri-bution to GDP, jobs, energy demand, and emissions—is a distinguishing feature of Chinese cities. In 2010, the secondary sec-tor (composed of industry and construction) produced 49 percent of economic output and 48 percent of jobs in China’s urban areas.31 Even with a structural shift toward services, industry is expected to remain a mainstay of China’s urban economy for decades to come.32 It will also likely continue to be the largest end user of energy (Fridley and oth-ers 2012; Zhou and others 2011) and a major contributor to local air pollution. Reining
New York City, America’s largest municipality, embarked on a long-term planning process called PlaNYC 2030 to devise wide-ranging strategies for reducing materials and energy use, improving natu-ral spaces, planning for and mitigating the effects of climate change, and creating a more equitable and engaged society. Strategies were designed and are being executed by a joint task force, led by a spe-cially designated mayoral office and comprising 25 city departments and stakeholders from state and federal agencies, businesses, and nonprofit groups. To strengthen local ownership of the plan, the task force has engaged in media outreach efforts and offered incentives and support to encourage active participa-tion by local business owners and residents, including grant programs and changes in zoning codes intended to create new development opportunities (ICLEI USA and City of New York 2010). The plan is now in its fourth year of implementation.
The energy and emissions strategy for PlaNYC is focused on achieving a goal of reducing city-wide greenhouse gas emissions by 30 percent in 2030 com-pared with 2005. Because buildings account for 75
Box 7.11 New York PlaNYC 2030 case study: integrated centralized planning relying on decentralized delivery
percent of the city’s total carbon emissions, PlaNYC has kick-started a number ambitious programs and policies to improve energy efficiency in the city’s building stock. This buildings effort has two major elements: the promulgation of new laws (together called the Green, Greater Buildings Plan), and the for-mation of the 200-person Green Codes Task Force to recommend code and other reforms to reduce a num-ber of environmental impacts of buildings (that is, not just energy use). The green plan requires regular energy audits, retro-commissioning, and data shar-ing for large public and private buildings; lighting upgrades; and submetering of government buildings and commercial tenant spaces. These measures will cover more than half of the space in 16,000 buildings in the city. To ensure compliance, procedural incen-tives exempt from retro-commissioning and audits buildings that adopt measures early or comply with Leadership in Energy and Environmental Design (LEED) standards for existing buildings, a revolv-ing retrofit loan fund has been created with federal stimulus funds, and the city is forming a large energy service company.
Source: Adapted from Zhou and Williams 2013.

496 U r b a n C h i n a
in industrial energy consumption is crucial to the resource security and environment of Chinese cities.
Reducing energy needs will also be a key element in the competitiveness of industry. In some sectors such as cement, China’s lead-ing firms are nearing or have already reached best-practice levels for energy efficiency, but behind these leaders is a long tail of much more inefficient plants. Projected lower rates of growth in fixed assets and demand for
industrial commodities over the next 10–20 years will start to unmask these inefficien-cies, putting greater pressure on inefficient firms in energy-intensive subsectors such as iron and steel, cement, and aluminum (Frid-ley and others 2012; Zhou and others 2011). Firms will have fewer opportunities to grow out of their inefficiencies by increasing pro-duction capacity. The ability to capture cost savings from energy efficiency can contribute to competitive advantages.
China’s 11th Five-Year Plan produced solid results of a reported 19.1 percent reduc-tion in energy intensity (NDRC 2011), but perhaps more importantly, it laid the founda-tion of policies and programs for long-term energy savings: a legal and regulatory system with energy conservation offices or groups and supervisory offices set up at provincial and most prefecture levels of government. Cities acquired considerable experience with the design and implementation of major programs. When planning low-carbon and energy-efficient programs, cities can tap these lessons and help to introduce improvements and innovations. China’s 12th Five-Year Plan expanded and improved the programs, and, while there are serious efforts to introduce more market-based tools and mechanisms, delivery largely continues to depend on this, still relatively new, administrative system.
While this system and its suite of evolv-ing policies and programs will serve China well into the future, many policy makers and energy efficiency experts are asking whether enterprises and local city governments are fully seizing energy efficiency opportunities under the current mix of regulations, incen-tives, and financing options. Both enterprises and local city governments face challenges. Enterprises are offered little flexibility in meeting government-mandated targets for energy savings, which may be poorly matched to actual company potentials—leading to a passive mentality and little effort beyond meeting minimum requirements. A lack of high-quality energy audits and accurate benchmarking has limited the ability of enter-prises to identify realistic or cost-effective efficiency improvements (see Yang 2010, for example). Flexibility in meeting targets has been limited by the hard timetable set for
Figure 7.30 energy use per unit of water treated by municipal water utilities, various years
Source: International city data from World Bank ESMAP TRACE database; China data from Wang, Song, and Bai 2013; Liu and Jiang 2012; Yang and others 2008; and Zhao and others 2010.Note: Chinese city data includes electricity use only, which typically represents 60–90 percent of total energy use by wastewater treatment plants in China (Liu and Jiang 2012); international city data includes total energy use, in kilowatt hour equivalents.
Chinese cities International cities
Zhuhai (c2008)
Mysore, India (2008)
Tokyo, Japan (2008)
Quezon City, the Philippines (2009)
Vijayawada, India (2008)
Northwest China (2006)
Pune, India (2008)
Northeast China (2006)
Johannesburg, South Africa (2008)
Southwest China (2006)
Danang, Vietnam (2010)
Toronto, Canada (2008)
China average (2009)
Hong Kong SAR, China (2008)
Central China (2006)
Hohot, Mongolia (2010)
East China (2006)
Sydney, Australia(2009)
South China (2006)
Shenzhen (c2008)
Gaziantep, Turkey (2010)
Banja Luka, Bosnia and Herzegovina (2011)
Belgrade, Serbia (2009)
kWh per m3
0 0.20 0.40 0.60 0.70
g r e e n U r b a n i z a t i o n 497
enterprises to achieve a certain level of sav-ings each year during the 12th Five-Year Plan. While hard and binding targets do spur action, there are limitations if compli-ance is too prescriptive. Tight political time-tables may conflict with longer-term busi-ness planning by enterprises and narrow the scale of energy efficiency investments. Local city governments, meanwhile, often lack the technical expertise and experience required for monitoring and reviewing energy use by industries and may not be able to effectively shoulder the burden of enforcing policies and targets.
A more balanced mix of incentives and supporting measures for industrial energy efficiency can help relieve constraints on enterprises and local city governments in pur-suing energy efficiency improvements. With the right combination of incentives and sup-porting programs, enterprises may become more proactive, lightening the administrative burden on local city governments of meet-ing policy objectives. Local city governments meanwhile can play an important but more indirect role in helping enterprises do better by facilitating access to technical and finan-cial services, monitoring the process, and supervising results.
Rebalancing administrative measures with greater use of market-based incentives
The government-enterprise agreements that set mandatory energy savings targets for enterprises and establish the mutual respon-sibility of the government and enterprises in fulfilling these targets are a cornerstone of China’s industrial energy efficiency policies and should continue. An extensive institu-tional infrastructure has been built up at all levels of government to implement the agreements, with the provinces playing a lead organizing role and local city govern-ments assuming responsibility for day-to-day supervision.33 The agreements delivered huge energy savings in the 11th Five-Year Plan, and savings targets have been ramped up for the 12th Five-Year Plan. Nearly 17,000 enterprises are now covered by agreements under national and local programs, repre-senting as much as 60 percent of China’s total
energy use. Still, these programs need to be strengthened to ensure that they continue to deliver results in the 13th Five-Year Plan and beyond. Key issues are maintaining the coverage, ambitiousness, and motivational power of the agreements while also introduc-ing greater flexibility for enterprises in meet-ing their targets.
At the national level, the government should continue to set ambitious targets for limiting energy use. In principle, useful tar-gets for limiting energy use could be denomi-nated in total energy, coal, or carbon. While each kind of target has pros and cons associ-ated with it, the key issue will be to ensure that these targets are coordinated in order to avoid policy dilution or loss of regulatory coverage. Box 7.12 illustrates how obligations to reduce energy intensity might interact with a cap on carbon emissions under an emissions trading system. Both kinds of obligations, in addition to renewable energy targets, can and do co-exist in the United Kingdom and other European countries, but interactions between overlapping targets must be assessed care-fully. New targets to limit carbon emissions and energy use should build on the current energy-savings agreement platform as much as possible to ease the burden of compliance for both industry and local city governments.
While maintaining coverage and ambi-tiousness of targets, the national govern-ment can give enterprises more flexibility in meeting targets for energy use by allow-ing for trade, giving enterprises the option of purchasing energy savings certificates (or carbon abatement credits if the ETS is implemented) as an additional way for them to meet their targets at lowest cost. A num-ber of provinces and cities are already pilot-ing trading schemes for carbon emissions, and a few exchanges have been established. Other provinces and cities outside the car-bon ETS pilot areas could initiate pilots in trading energy savings certificates to build the experience and institutional architecture needed for larger-scale trading. These differ-ent pilot schemes would provide the national debate with valuable experience on various policy options for decarbonizing the econ-omy, which include carbon cap and trade, carbon taxes, and green and white certificate

498 U r b a n C h i n a
trading. However tradable certificates are denominated—whether in carbon or energy savings—a national system of trading will require an extensive institutional infrastruc-ture to monitor, verify, report, and register savings.
New targets should build on the current energy-savings agreement platform as much as possible to ease the burden of compli-ance for both industry and local city govern-ments. Local city governments should con-tinue to join national and provincial efforts to improve the collection of data on energy use by key enterprises and building third-party capacity for monitoring and verifica-tion (MRV). This system can also support potential trading schemes. Greater use of third-party MRV could also help to allevi-ate supervision burdens on local governments and help verify energy savings for projects receiving government support. China has taken steps in this area but could enhance it by standardizing qualification requirements
and broadening the currently narrow base of companies in the MRV system. In addition, fixed asset investment appraisals for energy efficiency have been introduced and could play a more prominent role, with enhanced appraisal capacity from use of qualified third parties, in ensuring new investments are technically advanced, meet standards, and are energy efficient.
Adjusting fuel and electricity tariffs to better reflect social and environmental costs of fossil fuel use should continue. Rais-ing prices on energy can provide additional market incentives for industries to improve their energy efficiency. China’s national and provincial governments are in the process of reforming existing taxes on the production of fossil fuels including coal, oil, and natural gas. Proposals for a revised coal tax suggest a rate of 2–5 percent, which, based on average coal prices in 2012, would amount to about RMB 10–25 a ton.34 By comparison, eco-nomic studies have placed the average dam-
In linking a nationwide carbon emission trading system (ETS) with the current system of energy sav-ings agreements, two of the key design questions for policy makers will be what facilities will be cov-ered by the two systems and whether a cap will be imposed on Scope 1 (direct greenhouse gas emis-sions) or Scope 2 (broadly, indirect greenhouse gas emissions from the consumption of electricity, heat, or steam) emissions. Energy savings agreement obli-gations under the 12th Five-Year Plan cover around 17,000 industrial enterprises, which together account for about 85 percent of industrial energy use or 60 percent of China’s total energy use (NDRC 2012). If, hypothetically, the energy savings agreements were replaced with a carbon ETS for which allowances are issued based on Scope I emissions, as is the case in the European Union, direct coverage of industrial energy use would be reduced by about 25 percent. The remaining obligations would be shifted to elec-tricity generators.
The effect on industrial energy efficiency would depend on several factors, including the stringency
Box 7.12 Maintaining coverage of energy efficiency obligations under the current system with the introduction of a new system of carbon emissions trading
of the carbon cap, allowance prices, and the ability of power suppliers to pass on costs to consumers in the form of higher prices. If power utilities are not able to raise the price of electricity, caps are not tight enough, and carbon allowance prices are too low, then the incentives for industry to save energy could be severely weakened. Tightening the cap and allow-ing power utilities to raise tariffs would not neces-sarily solve the problem of incentives. Absent other reforms, the revenues of power generators and grid utilities would continue to be linked with sales of elec-tricity and investments in expanding capacity. Thus, while power utilities would have an incentive to sup-ply cleaner electricity—and to charge more for that electricity—they would have little motive to reduce demand by industry. Also, despite facing higher energy prices, industries may not invest in energy effi-ciency without other incentives and enabling policies. Should the accounting method change and include Scope 2 emissions, however, then the coverage could remain largely the same and incentives in place for industry to reduce energy demand.
Source: Robert Taylor.

g r e e n U r b a n i z a t i o n 499
ages to public health from burning one ton of coal in China at about RMB 156 (in year 2012 prices) (Nielsen and Ho 2007; Ho and Jorgensen 2003). China will need to conclude its debate over the effectiveness and transac-tion costs associated with ETS and carbon taxes and introduce a clear and consistent policy on carbon pricing so that businesses can plan for it.
Revenues from energy taxes or the sale of tradable allowances could be recycled for energy efficiency and emission reduction programs to provide additional, targeted incentives. Recycling revenues can have a tremendous multiplier effect on efficiency gains. For example, an analysis of household energy use in the United Kingdom shows that recycling the additional revenues from a 3-percent rise in energy prices into efficiency programs produces cumulative energy sav-ings nine times greater than the savings that could be achieved with a price increase alone (Lees 2012). The recycling approach has been an important element in policy discussions and design in major carbon ETS examples in the northeast United States, California, and the European Union.35 Regardless of how public revenues are recycled, govern-ment-funded incentives for energy efficiency should be evaluated regularly to ensure that the greatest amount of additional and verifi-able energy savings are being achieved with the least amount of public money. The need for periodic review and adjustment is also needed for existing incentives, such as invest-ment awards for energy efficiency projects and tax rebates for buying energy-efficient equipment.
Enable companies to respond more easily to incentives and regulations
Evidence has shown that higher energy prices have significantly reduced the energy intensity of Chinese manufacturing, but the impacts of higher prices vary considerably across consumer categories and between industrial sectors (Fisher-Vanden and oth-ers 2013; Lin and Liu 2011). Raising energy prices to capture the social costs of pollu-tion alone will not always result in indus-tries making investments in energy savings.
Pricing will need to be packaged with other policies that address persistent barriers to energy efficiency. The barriers include orga-nizational challenges (such as low awareness of technical solutions or managerial bias in favor of investments in production growth); insufficiently developed financial services for energy efficiency investments (because of high transaction costs and small scale, for example); and regulatory shortcomings (such as inflexible or prescriptive compli-ance requirements that limit ambitions to go beyond government mandates).
A basic element of enhancing the ability of industrial enterprises to pursue energy effi-ciency projects is ramping up their ability to manage their energy use through accelerated placement of competent enterprise energy managers. Energy managers can also support government-enterprise dialogue on comply-ing with energy efficiency policy. National regulations already require that key energy-consuming enterprises appoint energy man-agers, but in-house staff in these companies typically only have general knowledge about monitoring energy use and assessing savings opportunities. Local governments can greatly improve specialized, technical knowledge of energy managers by cooperating with pro-vincial and national agencies to arrange for rigorous training, helping to monitor energy manager proficiency by ensuring they meet minimum job and professional criteria, among other things. Energy managers are responsible for establishing energy manage-ment systems (EnMS);36 The government has required key enterprises to adopt these sys-tems based on a national standard, but left it up to the individual provinces to decide whether certification of EnMS should be mandatory. To avoid superficial EnMS adop-tion, EnMS certification and accreditation standards should continue to be developed at the national level, drawing on local expe-riences such as an EnMS certification pilot with over 130 enterprises in Shandong prov-ince (Zhu 2012).37 Local authorities could continue to propagate the EnMS concept, experience exchanges among enterprises, mobilize technical assistance, and evaluate and publicize energy savings performance outcomes from adoption of the EnMS.

500 U r b a n C h i n a
Ensuring good-quality, competitive techni-cal and financial services is also an enabling factor in which all levels of government play a role. Most enterprises, especially small and medium ones, cannot easily access all needed services alone—from energy audits to devel-oping, financing, and executing projects. Te energy efficiency services industry has grown, especially the use of energy savings performance contracting promoted by energy service companies (ESCOs) (Sun, Zhu, and Taylor 2011). However, the capacity of tech-nical service providers still lags behind the practical needs of many enterprises. For most financial institutions operating in the mar-ket, energy efficiency financing is at best a niche business. National policy encourage-ment, from the China Banking Regulatory Commission, for example, would be use-ful to further motivate Chinese banks to be more active and create and use appropriate new, innovative financial products. A greater diversity of financing mechanisms needs to be available to industries with different finan-cial circumstances, such as financial leasing, equity, and use of off-balance-sheet energy performance contract financing from ESCOs. Local city and provincial governments can support the development of locally active service companies by procuring technical services for supervision of energy efficiency programs, fostering membership in regional and local associations, issuing guidance on common energy efficiency service standards, and facilitating information flow between enterprises demanding and supplying ser-vices. Among the many forms of support at national levels, strengthening energy audits by standardizing the procedures and provid-ing good tools and training programs is a top priority because good-quality energy audits are fundamental to realizing opportunities and developing new projects. The key is to help the service industry grow without over-regulating and stifling it.
Encouraging the innovation of new busi-ness models for promoting energy efficiency can help both industry and local city gov-ernments, particularly in the use of special-ized third-party companies to package and deliver their energy savings projects (Taylor 2013). Larger cities can be leaders in policy
experimentation, testing new delivery models that maximize cost-effective energy savings from public investments such as energy effi-ciency utilities and energy efficiency resource acquisition programs, like those in the United States. In North America, for instance, local governments in about 30 states and prov-inces have through regulation effectively con-tracted for electricity distribution utilities or specialized third-party companies to deliver specific amounts of verified energy savings in key subsectors or targeted locations. Use of qualified third parties eases the local govern-ment’s direct burden because the company is responsible for pursuing and delivering energy savings and receives compensation against verified performance benchmarks. The company has incentives to seek out the maximum amount of energy savings for the least use of public funds. Over time, third-party companies typically become more adept at delivering more savings at lower costs as programs grow, experience is gained, and market knowledge of end users is deep-ened (see, for example, box 7.9). Such a pro-gram could be piloted in China is through the national Demand Side Management Pilot Cities program, which allows utilities and cit-ies to experiment with new models for reduc-ing power loads.
Leading by doing: Serving the people in more efficient and cleaner buildings
To achieve deeper and more rapid reductions in energy consumption in new and existing buildings, a core task for China’s national and local governments is to harness the busi-ness interests of building developers, materi-als and equipment suppliers, investors, and owners to construct and maintain a greener built environment. For new buildings, spatial planning rules, mandatory building energy efficiency codes (BEECs), green building labels, and financial incentives need aligning. BEECs should be broadened to encompass the main design elements of energy usage, and clear, time-bound targets should be set to progressively raise standards. Better train-ing, technical services, and market awareness of green building designs and materials are needed across the entire supply chain. For

g r e e n U r b a n i z a t i o n 501
efficiency upgrades of existing buildings, benchmarking can inform mandatory retrofit policies supported with incentives. Reducing exposure to indoor air pollutants will need consistent building material standards and tighter enforcement (see box 7.13). Local gov-ernments should lead by example, promoting energy efficiency in public institutions and helping to build a market for technical ser-vice providers, such as ESCOs—especially in still underdeveloped parts of China.
Buildings, where people live and work, are critically linked to the environmental sustainability of cities, primarily because of their operational energy use and, in China’s case, the large-scale construction of new buildings. The staggering pace of new build-ing construction over the past two decades has transformed China’s urban landscape and deepened its energy footprint. Total floor space of residential and commercial buildings in China’s cities has increased five-fold since 1995 to 33.3 billion square meters in 2011. As a result, energy resource use has doubled over the past decade for space heating and cooling, lighting, hot water, appliances, and equipment in residential, commercial, and public buildings in cit-ies, reaching about 491 million tons of coal equivalent, or 14 percent of the nation’s total primary energy demand (THUBERC 2013) (figure 7.31). This figure does not take into account the amount of embodied energy used in the manufacturing of building mate-rials and appliances of building users. From an urban perspective, the operation of build-ings dominates urban energy consumption in modern, service-oriented cities. For example, buildings account for roughly 60–70 percent of overall final energy consumption in Hong Kong SAR, China, and London. Energy con-sumption is likely to be similar in the urban core of large Chinese cities (such as within the fifth ring road of Beijing).
China has set ambitious goals and put in place a comprehensive policy framework for improving energy efficiency and environ-mental performance of buildings. By 2015, the country plans to reduce energy use in buildings each year by 45 million tons of coal equivalent (MOHURD 2012), and by 2020, national authorities have established
a target for increasing the share of certified green buildings in new construction to 30 percent (State Council 2013). Policies to meet these goals include mandatory standards, voluntary rating systems and labels, and financial incentives for investing in greener, more energy-efficient buildings and appli-ances. Still, barriers remain. Even though many design techniques and technologies to achieve significantly higher energy efficiency in buildings have already been commercial-ized, market incentives for building develop-ers to adopt green building features are weak. Developers typically do not operate the build-ings they construct and may not see a direct benefit in reducing energy costs for owners and tenants. Some reports suggest payback periods of up to 10 years for the incremen-tal cost of building to green standards. Con-ventional design practices rarely use reliable energy simulation modeling, design profes-sionals lack expertise and experience with integrated design approaches, and there are few published green building performance data for monitoring and evaluation (China Greentech Initiative 2012). With uninspired developers, local city governments continue to struggle to monitor BEEC compliance at the torrid pace and massive scale of new con-struction. More expensive retrofits may be required in the future to meet national tar-gets for curbing energy use in buildings.
Building energy efficiency in new construction
Mandatory building codes will continue to be the fundamental policy lever for the national and local governments to enforce higher efficiency levels in new buildings. However, BEECs can be strengthened and better aligned with financial incentives and voluntary labeling programs to promote ongoing improvements in environmental per-formance. Cities have the power, particularly through land use planning and zoning, to facilitate more energy efficient and greener structures (box 7.14).
Clear, time-bound targets should be set for tightening design standards for energy efficiency to eventually require “low-energy” buildings. In the Chinese context, low-energy buildings could be clearly defined in terms

502 U r b a n C h i n a
As the rapid pace of construction has transformed the urban landscape, the indoor environment of buildings over the past 20 years has also undergone transformational changes. Increased use of plastics, polymeric floor and wall coverings, synthetic wood products and cleaning agents, and air conditioning in closed spaces have significantly increased peo-ple’s exposure to indoor air pollutants such as vola-
Box 7.13 Cleaning the air indoors: The other air pollution
tile organic compounds (VOCs). Medical studies in China suggest a possible link between birth defects and asthma in children in urban areas and increased exposure to organic pollutants and dust in the indoor air. In China, indoor concentrations of known harm-ful substances are typically higher than in other coun-tries, so researchers anticipate that the negative health effects are greater (Zhang, Mo, and Weschler 2013).
Source: Huang and Wang 2010; Li 2010; Liu and others 2012; Zhang and others 2013.
Figure B7.13.1 Concentrations of formaldehyde and benzene concentrations in buildings
Nagoya, Japan
New York City, United States (summer)
Shimizu, Japan (summer)
Mexico City, Mexico
Paris, France
Cairo, Egypt
Beijing, China (summer)
0 0.10 0.20 0.30
Indoor formaldehyde levels(ppm)
0.40
Prince Edward Island, Canada
Tianjin, ChinaBeijing, China (winter)
Uppsala, SwedenBoras, Sweden
Goteborg, Sweden
New York City, United States (winter)
Quebec, Canada
Shimizu, Japan (winter)
Los Angeles, United States
Ferrara, Italy
WHOrecommended indoorLimit 0.08 ppm
a. Concentrations of formaldehyde in the air inside residential buildings in various cities
Japan
Hong Kong SAR, China
Central Europe
Korea, Rep.
Guangzhou, China
0 10 20 30
Indoor concentrations of benzene(µg/m3)
40 50 60
Turkey
Singapore
Finland
Milan, Italy
b. Concentrations of benzene in the air of buildings in various regions
Source: Liu and others 2012.Note: The World Health Organization does not have a guideline standard for benzene because “no safe level of exposure can be recommended” (WHO 2010).
China has issued several standards establishing allowable concentrations of VOCs and other harmful substances. Systematic monitoring in individual buildings is much more difficult than monitoring ambient air quality outdoors, because individual sources of pollution are harder to identify and the regulatory frame-work for enforcing many standards is lacking. Consistency between standards must also be
improved. For example, exposure periods and allowable levels for VOCs in building design and acceptance standards are not the same (Huang and Wang 2010). In addition, China has intro-duced mandatory certification requirements for building materials (standards CNCA-12C-049, CNCA-12C-050, and CNCA-12C-051), but cer-tification is limited. Other common materials are exempt. See figure B7.13.1.
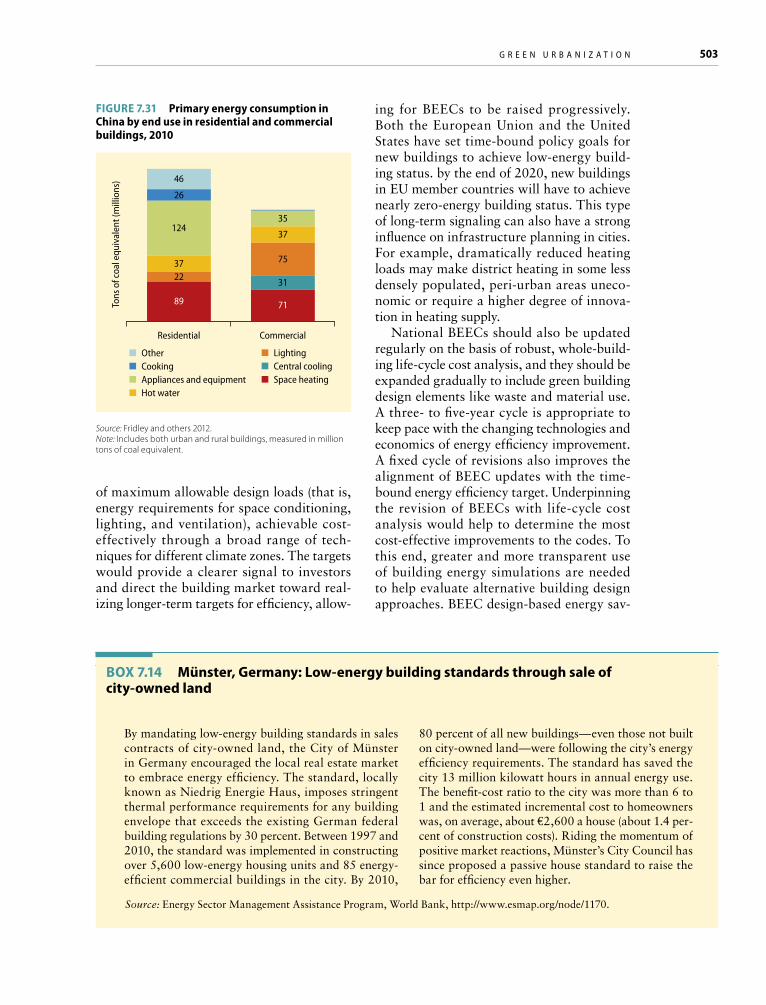
g r e e n U r b a n i z a t i o n 503
of maximum allowable design loads (that is, energy requirements for space conditioning, lighting, and ventilation), achievable cost-effectively through a broad range of tech-niques for different climate zones. The targets would provide a clearer signal to investors and direct the building market toward real-izing longer-term targets for efficiency, allow-
ing for BEECs to be raised progressively. Both the European Union and the United States have set time-bound policy goals for new buildings to achieve low-energy build-ing status. by the end of 2020, new buildings in EU member countries will have to achieve nearly zero-energy building status. This type of long-term signaling can also have a strong influence on infrastructure planning in cities. For example, dramatically reduced heating loads may make district heating in some less densely populated, peri-urban areas uneco-nomic or require a higher degree of innova-tion in heating supply.
National BEECs should also be updated regularly on the basis of robust, whole-build-ing life-cycle cost analysis, and they should be expanded gradually to include green building design elements like waste and material use. A three- to five-year cycle is appropriate to keep pace with the changing technologies and economics of energy efficiency improvement. A fixed cycle of revisions also improves the alignment of BEEC updates with the time-bound energy efficiency target. Underpinning the revision of BEECs with life-cycle cost analysis would help to determine the most cost-effective improvements to the codes. To this end, greater and more transparent use of building energy simulations are needed to help evaluate alternative building design approaches. BEEC design-based energy sav-
Source: Fridley and others 2012.Note: Includes both urban and rural buildings, measured in million tons of coal equivalent.
Figure 7.31 Primary energy consumption in China by end use in residential and commercial buildings, 2010
OtherCookingAppliances and equipmentHot water
LightingCentral coolingSpace heating
Tons
of c
oal e
quiv
alen
t (m
illio
ns)
Residential
46
26
124
3722 31
75
37
35
89 71
Commercial
By mandating low-energy building standards in sales contracts of city-owned land, the City of Münster in Germany encouraged the local real estate market to embrace energy efficiency. The standard, locally known as Niedrig Energie Haus, imposes stringent thermal performance requirements for any building envelope that exceeds the existing German federal building regulations by 30 percent. Between 1997 and 2010, the standard was implemented in constructing over 5,600 low-energy housing units and 85 energy-efficient commercial buildings in the city. By 2010,
Box 7.14 Münster, germany: Low-energy building standards through sale of city-owned land
80 percent of all new buildings—even those not built on city-owned land—were following the city’s energy efficiency requirements. The standard has saved the city 13 million kilowatt hours in annual energy use. The benefit-cost ratio to the city was more than 6 to 1 and the estimated incremental cost to homeowners was, on average, about €2,600 a house (about 1.4 per-cent of construction costs). Riding the momentum of positive market reactions, Münster’s City Council has since proposed a passive house standard to raise the bar for efficiency even higher.
Source: Energy Sector Management Assistance Program, World Bank, http://www.esmap.org/node/1170.

504 U r b a n C h i n a
ings estimates can have “simulation gaps” because conventional design practices do not necessarily use energy simulation models.
As discussed, revisions to urban spatial planning regulations are needed to create urban forms that optimize the overall energy efficiency of the built environment. Over the past thirty years, China has created an urban fabric where buildings stand farther apart from each other, creating a broken urban “fabric.” In cold climate zones, this broken pattern leads to higher energy requirements for heating than a continuous urban fabric consisting of buildings clustered together along the perimeter of street blocks. A com-parative analysis done in Europe found that in a temperate climate, in a 1.44 square kilo-meter area, a continuous urban fabric con-sisting of 21-meter-high buildings requires four times less energy for heating than a bro-ken urban fabric consisting of 60-meter-high, freestanding towers (Salat 2012). In warmer climates, buildings in densely populated urban areas can be spatially organized to cre-ate better ventilation and shading and reduce air conditioning requirements.
A main task for provincial and city gov-ernments will be to improve enforcement of BEECs throughout the entire construction cycle to reduce the risk that buildings will not be in compliance when they are completed, when they can be costly and difficult to fix. Local city authorities also play a crucial role in piloting and implementing new standards and are directly responsible for ensuring compliance. According to MOHURD’s offi-cially reported statistics, at the design stage, compliance rates with BEECs in prefecture-level cities rose from 5 percent in 2001 to a reported 99.5 percent in 2010 (Levine and others 2012).38 Yet, especially at the county level, there is significant gap between large and small cities in BEEC compliance during implementation. In China’s third-party com-pliance enforcement system, the construction supervision companies are held accountable for BEEC compliance inspection and report-ing. Small cities often do not have sufficient resources to support the necessary govern-ment oversight of the third-party inspections. Such issues could be collectively addressed at the prefecture or province level, so that ade-
quate training is provided for the construc-tion trades in county cities, which are admin-istrative subordinates of the prefecture cities.
Local governments can also play an instrumental role in encouraging broader market uptake of voluntary building label-ing programs, including the three-star Green Building Evaluation Standard (GBES) and the five-star Building Energy Efficiency Labeling (BEEL) systems. Currently under revision, the GBES was established by MOHURD in 2007 and covers a broader scope, and is more stringent, than the national BEECs.39 Both the GBES and BEEL are in an early phase of market adoption, although they are required for all large commercial buildings and pub-lic offices with an area greater than 20,000 square meters. By the end of 2012, just under 800 buildings had received green labels, and fewer than 300 BEEL buildings had been cer-tified. Although national and local authori-ties are setting hard targets for new buildings to meet green standards, at this early stage, the profusion of multiple, overlapping rules and ratings can create confusion in the mar-ket (Levine and others 2012).
Compliance with more aggressive BEECs and uptake of voluntary rating systems for green building can be improved through a more strategic alignment of financial incen-tives with policy goals. Existing financial incentives for new buildings have mainly focused on integrated renewable energy systems, including rooftop solar photovol-taic capacity and solar hot water systems—although in 2012, new incentives of RMB 45–80 per square meter were announced for buildings achieving two- or three-star GBEL ratings. Given the speed and scale of desired market adoption for new green building stan-dards, additional incentives and support, such as preferential tax treatment and assis-tance in completing the certification process, are needed. Perhaps most important, public incentive programs should seek ways of lever-aging financial awards with improving access to commercial financing and project services. (Levine and others 2012). Piloting coordi-nated financing incentives with mandatory building codes and voluntary ratings can test such an approach, as in Singapore’s Green Mark scheme (box 7.15).

g r e e n U r b a n i z a t i o n 505
In accelerating adoption of green building standards and given the high variability in capacities in design, supervision, and inspec-tion of buildings nationally, China will need a large-scale training and knowledge build-ing effort across the entire supply chain. The concept of green buildings is rooted in an integrated approach to design, encompassing not just energy efficiency but also other envi-ronmental objectives, which may clash with traditional zoning regulations and overly pre-scriptive building codes. For instance, local design institutes may be more accustomed to traditional urban planning and building design approaches or may be concerned about transgressing codes and regulations. With the ambitious pace at which national and local governments are seeking to increase the share of green buildings in cities, there is a risk of “green washing”—the superficial and incom-plete application or standards (Draugelis and Li 2012, 186). The success of the U.S. Green Building Council in promoting the LEED (Leadership in Energy and Environmental Design) standard in the United States, for example, is owed in large part to its efforts to reach out to all parts of the building commu-nity, including developers, property manag-ers, materials suppliers, architects, and engi-neers.40 An accreditation system similar to the LEED Accredited Professionals program could gradually increase the pool of qualified professionals in China. Training will also be needed for buildings authorities in local city
governments. Flexible, holistic approaches to applying green design standards aimed at reducing the overall energy footprint of build-ings can be further piloted in those cities that already possess a high level of competence and experience. Finally, as a part of knowl-edge-building efforts, the national and local governments should also work with industry associations and stakeholders to expand the scope, increase the credibility, and improve market awareness of green building materials labeling. Developers interviewed have cited lack of credible information on materials and suppliers as one of the main barriers to green building (China Greentech Initiative 2012).
Building energy efficiency in existing buildings
Focusing on efficiency in new buildings is not enough. Most buildings of pre-2005 vin-tage were constructed without accompanying BEECs. Especially in cold regions, upgrades of existing residential and commercial build-ings will be critical for meeting targets for reducing building energy use. The govern-ment has initiated a large thermo retrofit program in northern China with significant subsidy support (15 to 20 percent of retrofit cost). During the 11th Five-Year Plan, 150 million square meters of residential buildings in cold and severe cold region were report-edly retrofitted. In the 12th Five-Year Plan, an additional 400 million square meters of residential thermal retrofit is planned for
Singapore’s Green Mark scheme, run by the Build-ing Construction Authority, was launched in Janu-ary 2005 with a strong focus on energy efficiency. It provides a meaningful differentiation of buildings in the real estate market and has had a positive effect on the industry’s corporate image and on the leasing and resale value of buildings.
The distinctive aspect of the Green Mark scheme is that it is used to support the government’s green building master plan as the basis for technical capac-
Box 7.15 Singapore’s green Mark scheme
ity building and as a measure for determining gov-ernment financial incentives for new constructions or retrofits. By purposely integrating mandatory require-ments, voluntary ratings, and financial incentives for high achievers under a strategic plan for scaling up green buildings, Singapore demonstrates an effec-tive way for transforming the building sector toward green and sustained energy efficiency improvement.
Source: Building and Construction Authority, Singapore, “About BCA Green Mark Scheme,” http://www.bca.gov.sg /greenmark/green_mark_buildings.html (accessed December 2014).

506 U r b a n C h i n a
this region. Yet, these buildings only account for a small fraction of the pre-2005 urban residential building stock in the region (esti-mated at about 5 billion square meters). The main challenges to pursuing efficiency upgrades in existing buildings are less tech-nical and more financial and organizational. Home and property owners need both incen-tives and effective local organization to stim-ulate interest in retrofitting. For instance, the current practice of flat fees or area-based billing for heating does not give residents incentive to save energy on space condition-ing. Implementing consumption-based bill-ing for heating in the northern provinces would allow homeowners to gain financial benefits from energy cost savings, while retrofits would increase comfort levels for people living in cold flats. How retrofits and billing are sequenced matters a great deal. Currently, retrofits are typically required before consumption-based billing for heat-ing is begun to avoid saddling owners and occupants with high energy bills for poorly performing buildings that were constructed long ago. However, postretrofit billing low-ers the motivation and interest of consum-ers. In principle, government subsidies for retrofits can provide incentives, but the level needed to accelerate renovations is likely to be very high. Any financial constraints could create an impasse that can slow down both consumption-based billing and the retrofits. Several countries in Eastern Europe facing similar problems in the 1990s started with consumption-based billing first and started various support programs, including lines of credit, to help stimulate homeowner inter-est in renovation. In China, the government could mandate a deadline for implementing consumption-based billing after retrofit-ting to make the link between retrofits and energy savings clear and it could allow cities to implement the billing before the retrofits if they choose to do so.
To address organizational barriers, many East European countries have promoted ret-rofits of existing building through vigorous public awareness initiatives involving home-owners, condominium associations, build-ing managers, and NGOs. Major retrofits required homeowner consent and financial
contributions. Energy audits needed to be translated into clear investment proposals and communicated in ways occupants could understand. While there are some standard approaches, a degree of customization in technical measures and financing is usually required. Buildings with similar types, uses, and vintages might have significant structural and operational differences—and owners and occupants might have different prefer-ences and financing capacities. It is advisable to introduce a degree of flexibility in govern-ment support programs that set clear metrics for energy consumption reductions but allow for greater customization to reflect local building conditions.
For commercial buildings, building opera-tors might not find energy bills sufficiently high enough to concern themselves with ret-rofits, so additional motivation is needed. Shanghai is experimenting with establishing energy consumption benchmarks that build-ing operators are required to meet, while extending dedicated lines of credit to support retrofits. There is ample experience and suc-cessful examples of national loans for build-ing retrofits in EU countries, providing long-term, low-interest loans through commercial banks for residential retrofits based on a standard set of criteria and procedures, some-times combined with additional capital subsi-dies for specific energy savings level achieved.
Promoting building energy efficiency in public institutions
Although the largest share of the building stock in China is privately owned, the public sector has a significant role to play in leading the move to buildings that are more energy efficient.41 Public buildings represent about 6.2 percent of final energy demand in China and like other end-using sectors are depen-dent mainly on coal and coal-fired electric-ity. Upgrading of existing public buildings and better construction of ones will have an important demonstration effect and will create a larger market for green building products, resulting in lower costs and better access to services for private building own-ers as well. The benefits of improved energy efficiency in the public sector make a com-

g r e e n U r b a n i z a t i o n 507
pelling case for local city governments to lead by doing. The local governments should institute consumption-based district heat-ing metering and billing for all the facilities they own or control, for instance. A precon-dition for improving efficiency in the public sector is development of technical expertise and clarification of responsibilities for pro-moting energy conservation. That will be a major and multiyear undertaking because of China’s size and diversity in public facilities. Among the highest priorities is the establish-ment of good statistics on energy use. Meter-ing is fundamental to energy data collection and diagnostics but is far from universal. Better collection of energy use data through online monitoring systems, some already in place, should be supported by better public disclosure.
The use of awards can harness the natu-ral interest of local leaders and managers of public entities for recognition. Award sys-tems require unbiased data on energy use and environmental performance to be publicly available. Rating systems are another way to bolster enthusiasm for improving energy sav-ings performance, including scorecards such as those issued each year to rate the perfor-mance of U.S. federal agencies in reducing greenhouse gas emissions, energy efficiency, and water conservation. Piloting the use of publicly disclosed scorecards in a subset of institutions, such as municipal office build-ings, would recognize achievements, main-tain accountability, and compel actions to improve their buildings’ performance. Public facilities could also be allowed to retain the savings from reduced energy use in building retrofits, as laid out under the State Council’s Order 531 (2008). Detailed local budget and accounting regulations are needed, and some cities, such as Beijing, have already developed them. Absorbing energy cost savings back into general funds is a strong disincentive. Instead, regulations should explicitly allow for various expenditures, including small upgrades or new equipment, that directly benefit the facility. Retrofits in schools can have multiplier effects when combined with classroom lessons on energy efficiency and sustainability that students then share at home (World Bank 2012b).
Capital budgets for public institutions are hardly ever sufficient in most countries, and China is no exception. Continued use of China’s national- and provincial-level special funds to cofinance capital budgets for pub-lic institutions is encouraged. Budget sup-port for project preparation costs, metering, and establishing statistics systems could also be shouldered by general funds to remove further transaction costs. China has just embarked on a power utility based demand side management program that could make special efforts to target public institutions, as is done in many countries. Revolving funds could be managed at local levels to help lever-age capital budgets and subsidies. Careful analysis of these schemes would be needed to avoid crowding out commercial financing, where available.
Energy service companies offer an oppor-tunity for public-private partnership schemes and provide an alternative source of financ-ing for public institutions. ESCOs in China have started working in buildings but, unlike the ESCO market in the United States, indus-trial energy efficiency projects dominate the market. The State Council in 2010 issued a decree identifying ESCOs as a major market mechanism for promoting energy efficiency investments. Accelerating penetration of the public building market will require defining accounting rules for energy savings perfor-mance contracting and for selecting ESCOs through public procurement procedures, including prequalification criteria public insti-tutions can use. It will also require strength-ening measurement and verification to ensure efficient use of taxpayer funds. The European Union and the United States offer examples of different ESCO schemes, which local governments could study. For instance, the SuperESCO model experience in the United States Federal Energy Management Program provides opportunities to streamline procure-ment for energy efficiency retrofits across dif-ferent public institutions. An ESCO could be competitively selected for a multiyear performance-based contract and allowed to approach departments with investment pro-posals without further selection procedures. Some transactions could be subcontracted to smaller ESCOs in the local market, further
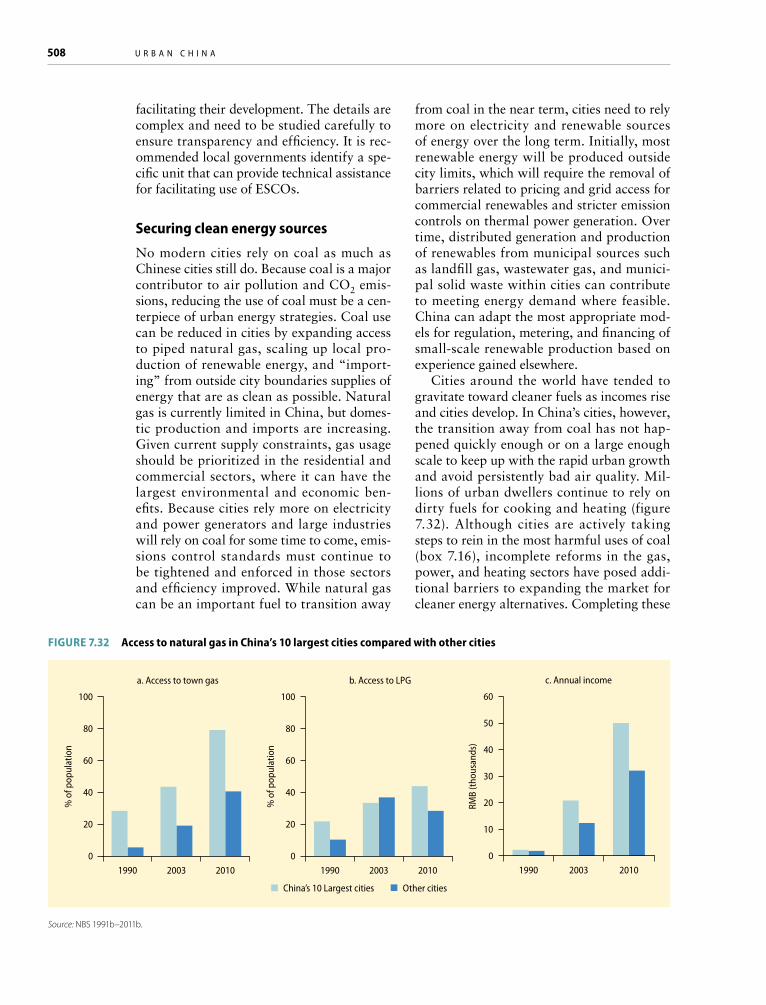
508 U r b a n C h i n a
facilitating their development. The details are complex and need to be studied carefully to ensure transparency and efficiency. It is rec-ommended local governments identify a spe-cific unit that can provide technical assistance for facilitating use of ESCOs.
Securing clean energy sources
No modern cities rely on coal as much as Chinese cities still do. Because coal is a major contributor to air pollution and CO2 emis-sions, reducing the use of coal must be a cen-terpiece of urban energy strategies. Coal use can be reduced in cities by expanding access to piped natural gas, scaling up local pro-duction of renewable energy, and “import-ing” from outside city boundaries supplies of energy that are as clean as possible. Natural gas is currently limited in China, but domes-tic production and imports are increasing. Given current supply constraints, gas usage should be prioritized in the residential and commercial sectors, where it can have the largest environmental and economic ben-efits. Because cities rely more on electricity and power generators and large industries will rely on coal for some time to come, emis-sions control standards must continue to be tightened and enforced in those sectors and efficiency improved. While natural gas can be an important fuel to transition away
from coal in the near term, cities need to rely more on electricity and renewable sources of energy over the long term. Initially, most renewable energy will be produced outside city limits, which will require the removal of barriers related to pricing and grid access for commercial renewables and stricter emission controls on thermal power generation. Over time, distributed generation and production of renewables from municipal sources such as landfill gas, wastewater gas, and munici-pal solid waste within cities can contribute to meeting energy demand where feasible. China can adapt the most appropriate mod-els for regulation, metering, and financing of small-scale renewable production based on experience gained elsewhere.
Cities around the world have tended to gravitate toward cleaner fuels as incomes rise and cities develop. In China’s cities, however, the transition away from coal has not hap-pened quickly enough or on a large enough scale to keep up with the rapid urban growth and avoid persistently bad air quality. Mil-lions of urban dwellers continue to rely on dirty fuels for cooking and heating (figure 7.32). Although cities are actively taking steps to rein in the most harmful uses of coal (box 7.16), incomplete reforms in the gas, power, and heating sectors have posed addi-tional barriers to expanding the market for cleaner energy alternatives. Completing these
Figure 7.32 Access to natural gas in China’s 10 largest cities compared with other cities
Source: NBS 1991b–2011b.
China’s 10 Largest cities Other cities
% o
f pop
ulat
ion
80
20
1990 2003 20100
100
60
40
a. Access to town gas
% o
f pop
ulat
ion
80
20
1990 2003 20100
100
60
40
b. Access to LPG
RMB
(thou
sand
s)
50
10
20
1990 2003 20100
60
40
30
c. Annual income
g r e e n U r b a n i z a t i o n 509
reforms will be necessary to accelerate efforts to reduce the burning of coal and improve access to cleaner fuels in densely populated urban areas.
Increasing the supply of natural gas to priority consumers in urban areas
The potential benefits to urban air quality of expanding access to gas are enormous, but gas supplies are limited, and certain end-using sectors should be given priority to max-imize social benefits. Highest priority should be given to households—as cities worldwide have done. Once infrastructure for piped natural gas (or “town gas”) is in place, small commercial users such as stores, hotels, and restaurants can gain more access to gas. Replacing coal with natural gas in the house-hold and commercial sectors is especially important because end-of-pipe emissions controls are usually either too expensive or not technically feasible. After residential and commercial users, centralized heating facili-ties should be the next priority for supply. A few cities, such as Beijing and Urumqi, have already converted a large amount of district heating capacity to gas-fired capacity. Supply constraints make it important for each city to evaluate the most efficient configuration
for gas-based heating (for example, whether to supply base load or peak load for district heating or distributed generation), taking into account potential renewable heat sources and existing sources from combined heat and power and waste heat sources. In distributed systems, natural gas units are able to meet multiple demands of cooling, heating, and power, and can reduce the transmission and conversion losses associated with heat-only systems with lower heat load densities, which is an important consideration as buildings become more energy efficient. Use of gas for electricity generation and industry, which currently account for 60 percent of gas use nationwide, should be carefully compared with the uses outlined above. Nevertheless, increasing gas supplies to China’s power sec-tor could provide important efficiency ben-efits if used for meeting high peak loads or it could provide additional flexibility to the power system, including easier accommoda-tion of intermittent renewable electricity sup-ply (Kahrl and others 2013).
Because residential consumers are a top priority for scaling up natural gas supplies, achieving universal access to piped natu-ral gas for urban households would require the supply of gas to increase from around 30 billion cubic meters in 2011 to nearly 70
In Taiyuan, the capital of China’s largest coal- producing province, city officials have been reducing coal use by shutting down small heat-only boilers and expanding the district heating network, supplying gas to small and medium enterprises, and eliminating direct use of coal for cooking and heating in the city center and in peri-urban areas near the city. Begin-ning in the early 2000s, Shenyang removed 1,000 heating plants over the course of three years, reducing the number of heating enterprises from 1,062 to 410 (many operating small dispersed boilers) and increas-ing the share of centralized heating supply from 55 to 80 percent.
Urumqi has promoted the use of combined heat and power plants, larger district heating networks,
Box 7.16 Cities take active measures to reduce harmful burning of coal
and, since 2012, gas-fired heating supplies as a part of its plan to reduce severe winter air pollution. Heat-ing in Urumqi was estimated to contribute 16 percent of total annual average concentrations of SO2, and 8 percent of PM10 and NOx. Since the 1980s, Beijing has led the trend in Chinese cities toward increasing the use of natural gas and phasing out direct combus-tion of coal by small-scale residential and commercial consumers. Many large district heating plants in the city were converted to gas, the most polluting factories were relocated, and a coal ban has been enforced in the central downtown area. The ban was extended to the fourth ring road by the end of 2013. The city also recently announced a hard target of capping its total annual coal consumption at 15 million tons by 2015.
Source: World Bank 2012a, 2011a, 2011b; World Bank, Shanxi EPB, and Xinjiang EPB 2012; World Bank–MEP 2012.
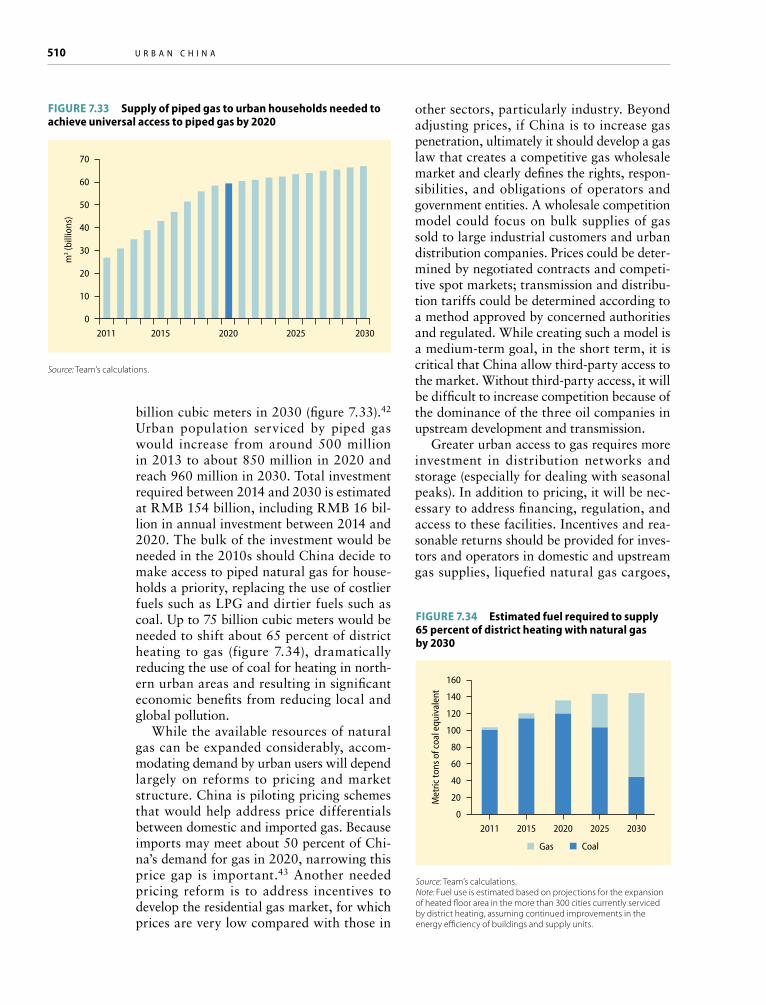
510 U r b a n C h i n a
billion cubic meters in 2030 (figure 7.33).42 Urban population serviced by piped gas would increase from around 500 million in 2013 to about 850 million in 2020 and reach 960 million in 2030. Total investment required between 2014 and 2030 is estimated at RMB 154 billion, including RMB 16 bil-lion in annual investment between 2014 and 2020. The bulk of the investment would be needed in the 2010s should China decide to make access to piped natural gas for house-holds a priority, replacing the use of costlier fuels such as LPG and dirtier fuels such as coal. Up to 75 billion cubic meters would be needed to shift about 65 percent of district heating to gas (figure 7.34), dramatically reducing the use of coal for heating in north-ern urban areas and resulting in significant economic benefits from reducing local and global pollution.
While the available resources of natural gas can be expanded considerably, accom-modating demand by urban users will depend largely on reforms to pricing and market structure. China is piloting pricing schemes that would help address price differentials between domestic and imported gas. Because imports may meet about 50 percent of Chi-na’s demand for gas in 2020, narrowing this price gap is important.43 Another needed pricing reform is to address incentives to develop the residential gas market, for which prices are very low compared with those in
other sectors, particularly industry. Beyond adjusting prices, if China is to increase gas penetration, ultimately it should develop a gas law that creates a competitive gas wholesale market and clearly defines the rights, respon-sibilities, and obligations of operators and government entities. A wholesale competition model could focus on bulk supplies of gas sold to large industrial customers and urban distribution companies. Prices could be deter-mined by negotiated contracts and competi-tive spot markets; transmission and distribu-tion tariffs could be determined according to a method approved by concerned authorities and regulated. While creating such a model is a medium-term goal, in the short term, it is critical that China allow third-party access to the market. Without third-party access, it will be difficult to increase competition because of the dominance of the three oil companies in upstream development and transmission.
Greater urban access to gas requires more investment in distribution networks and storage (especially for dealing with seasonal peaks). In addition to pricing, it will be nec-essary to address financing, regulation, and access to these facilities. Incentives and rea-sonable returns should be provided for inves-tors and operators in domestic and upstream gas supplies, liquefied natural gas cargoes,
Met
ric to
ns o
f coa
l equ
ival
ent
160
140
80
100
20
2011 2015 2020 2025 20300
120
60
40
Gas Coal
Figure 7.34 estimated fuel required to supply 65 percent of district heating with natural gas by 2030
Source: Team’s calculations.Note: Fuel use is estimated based on projections for the expansion of heated floor area in the more than 300 cities currently serviced by district heating, assuming continued improvements in the energy efficiency of buildings and supply units.
m3 (b
illio
ns)
70
50
10
2011 2015 2020 2025 20300
60
30
40
20
Figure 7.33 Supply of piped gas to urban households needed to achieve universal access to piped gas by 2020
Source: Team’s calculations.

g r e e n U r b a n i z a t i o n 511
pipelines, terminals, storage facilities, and distribution networks. Upstream market players also must have a reasonable expec-tation that price-setting mechanisms will be stable and fair—a task that many developed countries have fulfilled by creating an inde-pendent gas regulatory body.
Removing barriers to renewable energy in cities
In addition to maximizing energy efficiency and optimizing use of natural gas in cities, China’s cities can expand use of renewable energy.44 Most cities in the world might be indifferent to receiving electricity generated from renewables or electricity generated from fossil fuels, since both are “clean” at the user end, in China’s case renewable generation has added value by directly offsetting the amount of electricity that would be generated by coal. That can reduce air pollution regionally and lower the carbon intensity of the economy. Diversifying urban energy resources by introducing more renewable-based energy has the added benefit of enhancing cit-ies’ energy security through the “portfolio effect.” Besides receiving more renewable-based energy produced from beyond city limits, cities can also increase their share of self-generated renewable production or distributed forms of energy, where feasible. Completing power sector reforms that began over a decade ago is a top priority for scaling up clean energy in cities. In 2002, the State Council issued Decree No. 5, which out-lined comprehensive power sector reforms to introduce fair competition (starting with gen-eration) and develop an open, well-regulated electricity market.45 Although there have been many achievements in the sector, prog-ress has stalled.
China’s government can take four actions to support even greater development of renewables. As a first step, it can introduce a two-part generation tariff. Currently, gen-eration tariffs of coal-fired power plants are given based on China’s dispatching approach, which ensures a certain number of operat-ing hours for each plant. Coal-fired power producers may incur losses when dispatch centers ask them to reduce their generating to accommodate more wind and other inter-
mittent sources of renewable power. World-wide experience demonstrates that this situa-tion can be rectified by structuring two-part generation tariffs: one charge for available generating capacity (a capacity charge) and one charge for kilowatt hours generated (an energy charge). The capacity charge would allow generators to maintain their current annual repayments of their investments and fixed costs, while the energy charge would allow them to recover the cost of fuel and other variable costs. Such a reform could be implemented relatively rapidly and would need to be complemented by changes in dispatching practices (RAP 2013). Second, transparent and cost-recovering transmis-sion pricing should be implemented to allow grid companies to recover all costs incurred in safely and reliably delivering power to consumers, including the additional costs of accommodating intermittent renewable elec-tricity. Without such pricing, grid companies will continue to resist bringing more renew-ables online, and curtailment generation losses of renewables will become more severe. In fact, about 12 percent of wind power gen-erated in the Three-North Region in 2010 was wasted because of curtailment. Because this reform will be based on the future struc-ture of the power sector, it will need to be undertaken in a broader context of electricity pricing reform in China.
A third action is to consider adjust-ing incentives to guide wind developers to build closer to load centers (Song and Ber-rah 2013). Planning and coordination of grid development to accommodate major wind developments in resource-rich north-ern China will take time and should be sup-ported by comprehensive studies that would aim to optimize connection size and connec-tion circuit layout in consultation with stake-holders. Shifting the focus to central and eastern regions could lower overall incremen-tal costs of wind power development. The fourth action would be to discourage local governments from imposing additional fees or harmful local sourcing requirements on wind developers that many have introduced as a result of value added tax reforms and rebates on wind power equipment. At higher levels of development, VAT from wind gen-
512 U r b a n C h i n a
eration could be higher than pre-reform levels (Song and Berrah 2013).
Additional reforms are needed for regu-lating, financing, and metering distributed generation of renewable energy in cities. Worldwide, there is a trend toward consum-ers becoming generators of energy, which is transforming energy markets. In China, too, solar photovoltaic (PV) capacity has been growing rapidly, but the development of grid-connected solar PV has been inhibited by a combination of low retail prices for electricity and prohibitions by grid companies against installing distributed generation systems. Recent policy breakthroughs have helped break down some of these barriers to distrib-uted generation and should be aggressively followed through with implementing regula-tions. In 2013, the State Grid began provid-ing limited grid access to distributed energy, with support from the State Council, and the government announced that it would be shift-ing from capacity-based subsidies to feed-in tariffs (FITs) based on generation. These new initiatives should be complemented by efforts
to develop new and appropriate models for advancing commercial renewables in Chinese cities, such as in the “Sunshine Schools” pro-gram in Beijing (box 7.17).
While power sector reforms entail action at the national level, local city governments can also take proactive measures to intro-duce more renewable energy into their sup-ply mix. Because most Chinese cities import the majority of their energy from outside the city, they are dependent on regional sources of supply, which are mostly outside their control. Still, they can leverage their position in the energy commodity markets as large centers of demand to influence the types of energy they receive. Several options exist for cities to “import” more renewable energy by covering the additional cost for renewable energy until parity with traditional energy supplies is achieved. One is capacity-based, where consumers in a city pay a marginal fee on their utility bills to install a spe-cific amount of renewable energy capacity. Another is energy-based, where consumers pay a small premium for units of renewable
Under the umbrella of China’s national Golden Sun Program, Beijing will install 100 megawatts of roof-top photovoltaic (PV) systems in schools and other educational institutions in Beijing Municipality. It is the largest such initiative in China to date. Most projects under the Golden Sun Program involve large PV installations in a single location. By contrast, the Sunshine Schools program will involve distributed PV capacity in about 800 facilities. The capacities of most systems are expected to range from 50 to 200 kilowatts. The program will test the renewable energy service company (RESCO) business model for distrib-uted rooftop solar PV systems, whereby investments are financed by the service provider, which also pro-vides maintenance and other after-sale service. The project is also expected to pilot two-way metering and net metering for rooftop PV systems. If proven successful, the project would provide valuable experi-ence and demonstration effects for China’s growing solar PV market.
Box 7.17 The Beijing Sunshine Schools program: Linking green policy, pedagogy, and people
In addition to policy replication, the program launched a parallel effort to educate students in the schools about environmental sustainability. It includes a competition with awards given out by both Beijing and central government officials as well as school administrators. Online monitors showing the amount of renewable energy generated and carbon dioxide avoided are displayed in the schools. Link-ing faculty, students, and parents with sustainability initiatives in schools should reinforce green lifestyle concepts both at school and at home.
The World Bank is providing a $100 million loan for the installation of the solar PV systems, as well as a grant from the Global Environment Facility to establish online monitoring by the city of the renew-able energy generation of the schools and to conduct technical studies on grid connection issues. The hope is that the Beijing project can be replicated in other Chinese cities developing similar schemes.

g r e e n U r b a n i z a t i o n 513
energy they purchase (for example, as a fixed percentage of the electricity they use each month). The Shanghai Jade Electricity Pro-gram, started in 2005, experimented with the energy-based approach. Three important lessons were learned in Shanghai: the local government needs to play a very active role in promoting the initiative and, ideally, to link up with national efforts; public education and awareness is critical in achieving buy-in for both nonresidential and residential con-sumers; and financial incentives are needed to stimulate participation (Peng 2012).
District heating sector reform
District heating is one of the last vestiges of the welfare state in China.46 District heating reforms offer some of the clearest and most direct opportunities for improving environ-mental quality in northern cities. In more than 300 cities where centralized heat in the winters is legally required, over 90 percent of the heat supply is fueled with coal. Most Chi-nese heating utilities continue to bill consum-ers for heating based on a flat rate per square meter, removing any end-use efficiency incen-tives. Old district heating systems in north-ern cities are often highly inefficient and have historically had poor pollution controls. As a result, ambient PM2.5 concentrations of cit-ies north of the Huai River were estimated to be about 55 percent higher between 1981 and 2000, and to have reduced average life expectancy by about 5.5 years, compared with cities where heating is not legally required (Chen and others 2013). The district heating sector has grown about 12 percent a year in the past five or six years and is about 50 percent larger in floor area coverage than in 2005 (World Bank 2012a). Achieving a greener district heating sector will require a broad range of technical innovations, pricing, and institutional reforms, including modern-izing regulations. It will also require a major effort in building technical and managerial capacities in the utilities and regulators to usher in modern management techniques. Since the government issued guidelines for heating reforms in 2003, there have been many pilots and lessons learned that can be used to accelerate reforms.
Mandatory heat metering should be imple-mented at least at the building level with a binding timetable for introducing consump-tion-based billing and two-part heat pricing. Metering enables heating companies to under-stand energy consumption patterns and allows consumers to pay according to use. While apartment-level metering is preferable, build-ing-level metering should be allowed to avoid expensive and disruptive internal pipe retrofits and accelerate metering. Two-part heat tar-iffs include charges for variable and ordered capacity costs, and thus are incentives for end-user efficiency while covering justified fixed costs. The popular practice to set the fixed part on a flat square meter basis should be changed to a capacity-based charge, creating incentives for consumers with energy-efficient buildings to reduce ordered capacity, freeing it up for new connections. Incentive-based tariff regulation would also encourage heat suppliers to improve their operating efficiency. Ensuring adoption of commercial accounting principles based on uniform guidelines from the Ministry of Finance by heat companies would help get tariffs right. The central gov-ernment could clarify tariff methodologies for combined heat and power plants to improve transparency and consistency across cities. In addition, general subsidies to households, including low tariffs, should be replaced with more targeted assistance and extended also to poor households just above the current thresh-old for public welfare programs. A World Bank survey conducted in Liaoning Province in 2007 found that in RMB terms, heating subsidies for the richest households were simi-lar to those for the poorest households, so that in the end, out-of-pocket spending on heating bills amounted to 2 percent of income for the richest households and 7–10 percent of total income for the poorest households (World Bank 2009).
China could consider issuing a national district heating regulation to address the lack of a strong legal mandate for related institu-tions to undertake reform and issue national district heating planning guidelines to ensure consistent planning approaches that incorpo-rate energy- and carbon-intensity reduction goals. The regulation could, for instance, establish licensing of operators as a key reg-

514 U r b a n C h i n a
ulatory tool to force suppliers to meet their obligations (including for environmental per-formance and financial reporting). A broader provincial role in monitoring sector develop-ment, facilitating knowledge exchange, and supervising the regulation, if issued, would help with the supervision of district heating in the 15 provinces and over 300 cities where heating is mandated. With sufficient capacity, provincial authorities could take on licens-ing responsibilities and participate in dis-pute resolution. The lack of an autonomous regulator with clearly a defined role, budget, and enforcement authority is a key reason for uneven and relatively limited modernization of the sector. A national regulation could cre-ate such an institution, perhaps even at the provincial level. The guidelines would estab-lish principles and approaches for least-cost planning as well as dispatching guidance. Because cities are very involved in the utili-ties’ investment decisions, the city has impor-tant responsibilities in investment approval. The planning function, combined with the investment approval process, should not only aim to ensure heat supply security but also protect consumers from unreasonable costs.
The use of coal for heating should be delib-erately avoided. Coal should be switched to gas where supply can be secured, renewable resources integrated where feasible, and strict emission controls imposed on remaining coal heating sources. Gas is more expensive than coal, but a package of demand-side manage-ment measures, together with modernizing district heating systems, pricing reform, and targeted social assistance could help address affordability concerns. As a first step, gas should replace coal-fired heat-only boilers for peak loads, connected to cogeneration units. Gas boilers are more efficient and flexible and can open doors to more economic dis-patch of heat sources, renewables integration, tri-generation technologies, and value-added services such as district cooling. Alternatives need to be carefully analyzed because heating is influenced by local conditions. Generally, over the longer term, the estimated economic benefits of switching to gas-fired district heat-ing are significant and appear to outweigh the incremental costs (box 7.18).
integrating water resources and pollution management
China’s urban water sector faces two severe and interrelated problems. One is to supply a sufficient amount of water to a growing urban population, while also providing for the needs of the industrial and agricultural sectors as well as ecological requirements. Water scarcity has become one of the great-est threats to China’s continuing urbanization process, especially in the north and west, and problems could become even worse in some regions under plausible climate change sce-narios. The other challenge is to ensure the quality of water entering the city water sys-tem and of the treated wastewater returned to natural water bodies. Urban wastewater, industrial emissions, and agricultural run-off compromise water quality; poor water quality in turn threatens health and leads to higher treatment costs downstream. Water scarcity and pollution interact. Reduced river flow leads to higher pollutant concentrations because there is insufficient water for dilution.
China has addressed these problems in the water sector by improving the legal basis for managing water resources and by investing in water supply and treatment infrastruc-ture. Further progress can be made in three areas. First, water supply can be improved by increasing the efficiency of water use, especially in industry and agriculture, and by encouraging a more flexible allocation of water rights across sectors. Underpric-ing of water currently discourages use effi-ciency. Insufficient information about water resource flows hinders good decision making but could be addressed using new technolo-gies such as satellite remote sensing. Second, improving water supply quality requires reducing industrial pollution and addressing nonpoint source pollution in the rural sector. Besides better enforcement of regulations, instruments such as payments for ecological services can be helpful where urban water users support actions elsewhere in the water-shed that protect water quality. Since one city’s waste water becomes the water supply of another city downstream, further invest-ments in waste water treatment will also be
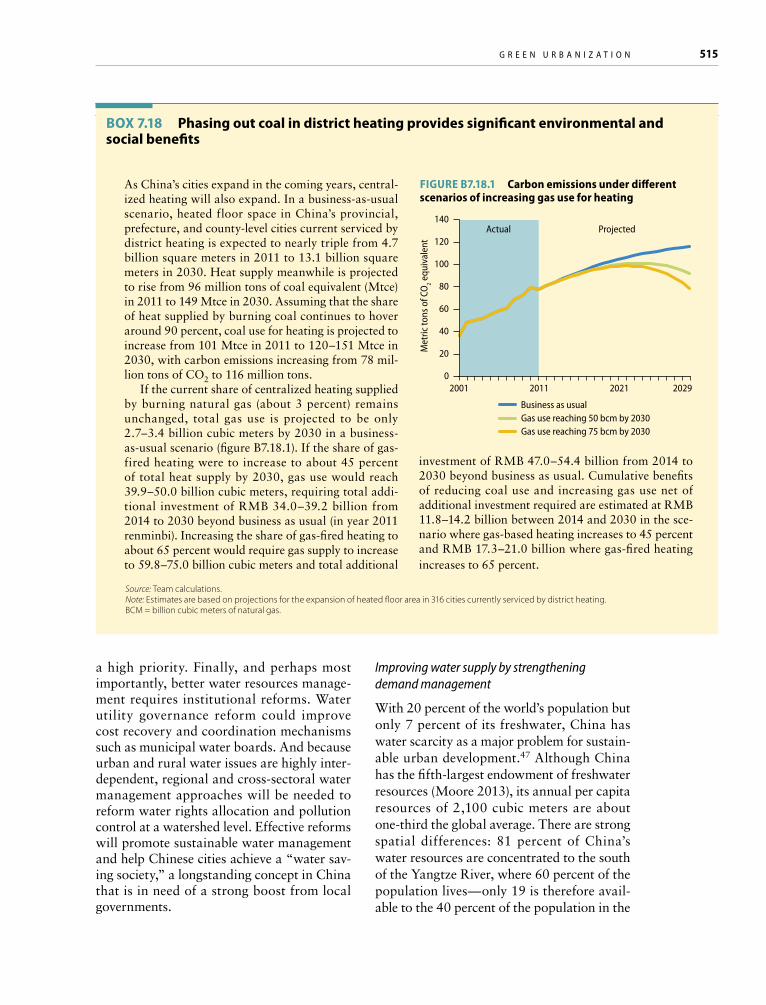
g r e e n U r b a n i z a t i o n 515
a high priority. Finally, and perhaps most importantly, better water resources manage-ment requires institutional reforms. Water utility governance reform could improve cost recovery and coordination mechanisms such as municipal water boards. And because urban and rural water issues are highly inter-dependent, regional and cross-sectoral water management approaches will be needed to reform water rights allocation and pollution control at a watershed level. Effective reforms will promote sustainable water management and help Chinese cities achieve a “water sav-ing society,” a longstanding concept in China that is in need of a strong boost from local governments.
Improving water supply by strengthening demand management
With 20 percent of the world’s population but only 7 percent of its freshwater, China has water scarcity as a major problem for sustain-able urban development.47 Although China has the fifth-largest endowment of freshwater resources (Moore 2013), its annual per capita resources of 2,100 cubic meters are about one-third the global average. There are strong spatial differences: 81 percent of China’s water resources are concentrated to the south of the Yangtze River, where 60 percent of the population lives—only 19 is therefore avail-able to the 40 percent of the population in the
As China’s cities expand in the coming years, central-ized heating will also expand. In a business-as-usual scenario, heated floor space in China’s provincial, prefecture, and county-level cities current serviced by district heating is expected to nearly triple from 4.7 billion square meters in 2011 to 13.1 billion square meters in 2030. Heat supply meanwhile is projected to rise from 96 million tons of coal equivalent (Mtce) in 2011 to 149 Mtce in 2030. Assuming that the share of heat supplied by burning coal continues to hover around 90 percent, coal use for heating is projected to increase from 101 Mtce in 2011 to 120–151 Mtce in 2030, with carbon emissions increasing from 78 mil-lion tons of CO2 to 116 million tons.
If the current share of centralized heating supplied by burning natural gas (about 3 percent) remains unchanged, total gas use is projected to be only 2.7–3.4 billion cubic meters by 2030 in a business-as-usual scenario (figure B7.18.1). If the share of gas-fired heating were to increase to about 45 percent of total heat supply by 2030, gas use would reach 39.9–50.0 billion cubic meters, requiring total addi-tional investment of RMB 34.0–39.2 billion from 2014 to 2030 beyond business as usual (in year 2011 renminbi). Increasing the share of gas-fired heating to about 65 percent would require gas supply to increase to 59.8–75.0 billion cubic meters and total additional
Box 7.18 Phasing out coal in district heating provides significant environmental and social benefits
investment of RMB 47.0–54.4 billion from 2014 to 2030 beyond business as usual. Cumulative benefits of reducing coal use and increasing gas use net of additional investment required are estimated at RMB 11.8–14.2 billion between 2014 and 2030 in the sce-nario where gas-based heating increases to 45 percent and RMB 17.3–21.0 billion where gas-fired heating increases to 65 percent.
Source: Team calculations.Note: Estimates are based on projections for the expansion of heated floor area in 316 cities currently serviced by district heating.BCM = billion cubic meters of natural gas.
Business as usualGas use reaching 50 bcm by 2030Gas use reaching 75 bcm by 2030
Met
ric to
ns o
f CO
2 equ
ival
ent
140
100
40
20
2001
Actual Projected
2011 2021 20290
120
80
60
Figure B7.18.1 Carbon emissions under different scenarios of increasing gas use for heating

516 U r b a n C h i n a
north, where most of the major grain produc-tion is located, and in the west. Annual per capita water availability in the north is only about 900 cubic meters (World Bank 2013b). About two-thirds of China’s cities—420 cit-ies—are water short; 110 of those face severe shortages, with a total deficit of 10.5 bil-lion cubic meters. For instance, Beijing’s and Tianjin’s per capita water resources were less than 120 cubic meters, well below the bench-mark for serious water shortage of 1,000 cubic meters (Wen and Zhu 2013). Eleven provinces overall fall below this level and are drier than Iraq or Lebanon. These shortages have led to severe overexploitation of ground-water resources, which provide about one-third of northern China’s water supply and as much as two-thirds in places like the Hai River Basin, which is home to Tianjin and Beijing. Nationally, more than 160 ground-water overdraft areas cover 190,000 square kilometers, and each year overextracted groundwater exceeds recharge by 22 billion cubic meters. In the Hai River Basin, shallow water tables have dropped by up to 50 meters and deep ones by up to 90 meters.
The main driver of water demand is increasing consumption by a growing pop-ulation, by agriculture, and by expanding water-intensive industries in the water-short north and west, although declining pre-cipitation, possibly due to climate change, is probably also contributing to water short-ages in some regions. By 2030, under current policies, China’s total water demand is pro-jected to rise by 61 percent over 2005 levels (2030 Water Resources Group 2009). Urban municipal and domestic use is expected to rise from about 12 percent of total demand in 2005 to 16 percent. However, the total amount of water use in China will be lim-ited to 670 billion cubic meters by 2020 and 700 billion cubic meters by 2030, accord-ing to the National Water Resource Master Plan approved by State Council in December 2010. The water use sectors are expected to take reduction measures. Although aver-age urban residential per capita water use is lower than in high-income countries, it is growing as living standards rise. In the south-east and coastal areas, per capita daily water use is about 190 liters, while in the northwest
and upper Yellow River areas, it is only 70 liters. Industrial water use intensities remain high at 131 cubic meters per RMB 10,000 of industrial value-added. This is about twice the average for high-income countries and ten times that of the best performers such as Japan. Some of the most water-intensive industries are among the worst performers, with steel, oil refineries, paper, synthetic ammonia, and beer production having water use intensities about 10 times greater than those of advanced international competi-tors. The energy sector, dominated by fossil fuel use, is one of the biggest water users, and some of China’s largest coal-producing regions are in the arid north. Fresh water use for mining, processing, and consuming coal accounts for a considerable portion of water consumption in industry (ADB 2008). Agricultural water productivity is also low. According to the Food and Agriculture Orga-nization, crop water productivity was $3.60 per cubic meter in 2009, compared to an average of $4.80 for middle-income countries and $35.80 for high-income countries.48
The response to water shortages is usually to increase supply—digging deeper wells or building reservoirs or diversion infrastruc-ture. But these are often no more than stop-gap measures in the face of rising demand. The first priority therefore must be to cre-ate incentives for greater water conserva-tion and for implementation of water-saving production technologies. Water prices have gradually increased but are still low by inter-national standards. In Beijing costs are less than a tenth of those in Berlin or Copen-hagen, for instance (figure 7.35). These low residential tariffs are offset in large measure by high industrial tariffs. In many developed countries, industrial water tariffs are usu-ally lower than residential water tariffs. Ber-lin’s urban residential water tariff is $6.67 a cubic meter, while its industrial water tariff is $2.16. The current industrial water tariff in Beijing of RMB 6.21 and in Tianjin of 7.85 RMB are higher than those in Canada, the United States and other developed countries. Agricultural water prices are also very low, as is common in many countries. China’s agri-cultural irrigation water use charges consist of fees paid to state-owned water manage-

g r e e n U r b a n i z a t i o n 517
ment agencies and end canal system water fees, and can vary widely. There appears to be room for water tariff adjustments that can better incentivize all water consumers to con-serve water and to use it more efficiently in industrial and agricultural production.
Raising water use efficiency is critically important, especially in the large agricultural and industrial water-using sectors where water productivity remains low. Increasing water productivity can help address the needs of growing urban population by reallocat-ing water resources from rural or industrial use to municipal water supply. In some coun-tries, that involves market-based trading of water rights between rural and urban users. A prerequisite for such reallocations and for reducing overextraction is better information about available resources and current con-sumption within a given watershed. Within any given watershed, water is extracted from surface or groundwater sources and used for urban, industrial, or agricultural pur-poses; some of it then returns to rivers or seeps back into the ground. Only a share is actually consumed, mostly as evapotranspi-ration (ET) during plant growth. Allocation of water rights requires information on the amount that may be withdrawn; the amount that may be consumed (ET from irrigation); and the amount that must be returned to the local water system at a level of quality suit-able for downstream users and ecological needs. If only extraction is monitored, as is common practice today, there is a severe risk of overexploitation of water resources. New methods using satellite remote sensing have made it much easier to monitor ET as a good approximation to actual water consumption that could be the basis of an enhanced water withdrawal permitting system and in the future, potentially for water rights trading between sectors (World Bank 2013b).
In the medium term, a better understand-ing of virtual water flows—water that is embedded in traded goods—also helps iden-tify opportunities for improving urban water supply. For example, water-scarce Shanxi Province exports large quantities of virtual water to water-rich eastern China through trade of water-intensive products such as coal, metals, thermal power, and manufac-
tured items (Li, Liu, and Liu 2011). At the same time, Shanxi imports virtual water in the form of agricultural products (153 mil-lion cubic meters in 2007, equivalent to over 2.5 percent of total water use), but unfor-tunately these come from even more water-scarce provinces such as Hebei, Shaanxi, and Xinjiang. In the Yellow River basin, in contrast, food for water trade between downstream provinces like Shandong and upstream provinces such as Ningxia pres-ents win-win opportunities. Optimizing such flows, for instance by moving water-intensive agricultural production to water-rich areas or relying more on importing virtual water embedded in food products from interna-tional markets, would help increase water use efficiency and free up water resources for high-value urban uses.
Copenhagen, Denmark
Berlin, Germany
Zurich, Switzerland
Luxembourg
Sydney, Australia
Paris, France
Singapore
London, United Kingdom
Barcelona, Spain
New York City, United States
Stockholm, Sweden
Rome, Italy
Moscow, Russian Federation
Kiev, Ukraine
Hong Kong SAR, China
Beijing, China
Kuala Lumpur, Malaysia
New Delhi, India
Riyadh, Saudi Arabia
US$ per m3
10 2 3 54 6 7 8 9 10
Figure 7.35 Water and wastewater tariffs in Chinese cities compared to other cities around the world
Source: Global Water Intelligence, “Global Water Market 2011-Meeting the World’s Water and Wastewater Needs Until 2018” (2011), http://www.giiresearch.com/report/gwi108050-lob- water-wastew.html (accessed December 2013).

518 U r b a n C h i n a
Ensuring the quality of the water supply
Water scarcity compounds the problem of water quality, which is at the core of Chi-na’s water-related challenges. As rivers and groundwater reservoirs shrink, pollution becomes less diluted and concentrations of effluents, and their impacts, rise. Problems include severe pollution incidents that may be causing “cancer villages” near polluted waterways, but also lower-level chronic pol-lution that affects health and increases urban water treatment costs. By some measures, water quality in China’s major river basins actually shows small but steady improve-ment since 2001, thanks to investments in end-of-pipe controls for industry, although water quality continues to be far worse in the northern basins. Industrial pollution accounted for about 19 percent of chemical oxygen demand (COD, an indirect measure of organic pollutants in water) in 2010, declining to 14 percent in 2011. Discharges of wastewater from urban households, mean-while, are growing and now account for 38 percent of COD in 2011 (figure 7.36). Yet, the largest share of COD comes mainly from nonpoint sources upstream of cities—mostly agricultural (also domestic)—and this share will likely increase (Guo and others 2012). Forty percent of Chinese rivers were seri-ously polluted and unfit for drinking water in 2010, and in 2011 the groundwater qual-ity in more than half of 200 cities surveyed was rated “bad” (40.3 percent) or “extremely bad” (14.7 percent).49 Groundwater pollu-tion is especially worrying because it takes decades for polluted aquifers to recover. Also, there are now concerns in major urban cen-ters about new kinds of pollutants such as medicine residues, micropollutants, and odor and taste pollutants (World Bank 2012c).
Treatment of water entering urban water supply systems is the most immediate way to ensure safe water, but with growing pollution loads accumulating upstream, that becomes increasingly more difficult and costly. Cur-rent utility charges are typically too low to fund the upgrading and operations of com-prehensive water treatment. Reducing pollu-tion of upstream water resources is thus an effective way to keep costs down and achieve
greater water quality. Regulations of agri-cultural practices and industrial emissions such as technology and effluent standards will remain the main policy instruments. Market-based approaches can also be effec-tive, although pollution rights trading is even more difficult to implement for water than for air, in large part because both the pollutants and the impacts are more varied (Olmstead 2010a, 2010b). Damages depend consider-ably on local conditions such as how quickly pollutants mix and disperse with large quan-tities of water.
Downstream water users such as munici-palities can also compensate upstream areas for maintaining higher water quality by preserving forests and wetlands or reducing agricultural runoff. Such payments for eco-logical or environmental services (PES) can often achieve water quality targets at lower costs than additional treatment. Famously, New York City saved $6 billion in construc-tion costs and $300 million in annual operat-ing costs for a new water filtration plant by investing $1.5 billion over 10 years in con-
Figure 7.36 Sources of main water pollutants, 2011
Source: MEP, “Total Emissions of Main Pollutants” (June 2012), http://jcs.mep.gov.cn/hjzl/zkgb/2011zkgb/201206/t20120606_231039 .htm; MEP, “Waste Water,” Environmental Statistics Report 2011 (March 2013), http://zls.mep.gov.cn/hjtj/nb/2011nb/201303/t20130327_249978.htm; MEP and MOA, 12th Five-Year Plan for Controlling Pollution from Livestock and Poultry Industry(全国畜禽养殖污染防治“十二五”规划) (November 2012).Note: Share of livestock and poultry in total emissions is assumed to be the same in 2011 as in 2010. COD = chemical oxygen demand, a waste quality measure.
IndustrySludge fromwater treatment
HouseholdsOther agricultureLivestock and poultry
COD
45%
38%
14%
2%
1% 1%
25%
57%
7%
11%
Ammonia nitrogen

g r e e n U r b a n i z a t i o n 519
servation of the upstream Catskills water-shed, where it sources 90 percent of its water. Stakeholders included state and federal agen-cies, environmental groups, and some 70 towns and villages. It reportedly took about 150 meetings to achieve agreement (Postel and Thompson 2005; Salzman 2009). Many such schemes have now been introduced, including in China (box 7.19), but they are difficult to implement under the current fis-cal system. PES requires transfers across municipal boundaries and to stakeholders who in turn must use the funds for intended purposes. This process requires competent and transparent monitoring. Nevertheless, PES programs represent an innovative strat-egy to rectify market failures and also to help address financial constraints faced by rural areas.
While maintaining the quality of upstream water sources for cities remains a major chal-lenge, China has made significant progress in improving urban waste water treatment. Coverage improved from 46 percent in 2004 to 84 percent in 2011 according to NBS data, and the 12th Five-Year Plan includes RMB 380 billion for investing in urban wastewa-ter treatment and expanding water quality monitoring stations.50 Those central govern-ment transfers should be accompanied by a
greater emphasis on cost recovery. Low tar-iffs weaken incentives to achieve the govern-ment’s widely publicized water saving objec-tives. Even in better-performing cities like Beijing where the wastewater treatment tariff has already been increased to about 26 per-cent of the water price, the fee barely covers the cost of treatment and weakens incentives to decrease wastewater. Cost savings could be achieved in smaller municipalities by aggregating water treatment services into a competitive concession or lease arrangement where one utility serves multiple cities. This is a longstanding practice in many countries. Likewise, wastewater should be managed as a network utility business by integrating drainage and treatment management and charging users for drainage services rather than considering them as a public service. About two-thirds of the investment costs and about half of thte operational costs for wasyewater systems come from increasingly complex pipe networks and pumping sta-tions across the city. Currently, wastewater utilities also have no control over industrial discharges into the municipal system, which can lead to overloading the drainage network and the treatment process. Incorporating drainage infrastructure as a part of a com-mercial or quasi-commercial operation of the
Western Cape, South Africa: Removing thirsty inva-sive pine species from the Western Cape can reduce the unit costs of supplying water from facilities by $0.03 per cubic meter (2010 prices). Removing inva-sive species that used large amounts of scarce water was two to seven times cheaper than augmenting water supplies by treating effluence or desalinizing water (van Wilgen, Cowling, and Burgers 1996).
Bogota, Colombia: The city has saved $19.6 million in avoided costs for water filtration facilities thanks to wetlands above the city, which filter out contami-nants and sediment in the city’s water supply so well
Box 7.19 examples of cost-effective water treatment services provided to cities by natural ecosystems
that only a chlorine treatment is needed for disinfec-tion (Jones, Hole, and Zavaleta 2012).
Vientiane, Laos: Flood attenuation and wastewater treatment services provided by That Luang Marsh next to the capital city have saved an estimated $1.5 million in construction costs for sewage treatment infrastructure (Gerrard 2004).
Poyang Lake, China: Located in the heavily popu-lated Yangtze River basin, the lake filters excess nutri-ents from the water, reducing sewage treatment costs by RMB 4.31 million each year (Zhao and others 2004).
Source: Sall and Brandon, forthcoming.

520 U r b a n C h i n a
treatment system can create the incentives to control and charge for industrial discharges.
Better cost recovery in the water sec-tor would also support implementation of tightened standards that could “leapfrog” to match those common in high-income coun-tries. While many cities have the resources and capacity to achieve high water quality and treatment standards, some do not. China adopted ambitious new drinking-water standards, following WHO guidelines, in July 2012, but many cities do not have the technical means to monitor water quality according to those standards.51 In addition, requirements issued in 2005 for expensive tertiary treatment for all municipal wastewa-ter treatment plants (SEPA Circular No. 110) remain beyond the technical and financial capacity of many cities. Transitional arrange-ments for water treatment and wastewater standards could be introduced in cities with weaker capacities specifically to ensure full and efficient collection of wastewater. Cities and towns that cannot afford the Class 1 or 2 discharge standards (the top standards) could start by ensuring full collection of waste-water and low-cost treatment, with many technologies now available to come close to meeting Class 2 standards. Although this approach does lower standards, it can help to treat wastewater that would otherwise go untreated. Such arrangements need to be carefully monitored and understood to be part of the transition to full compliance.
Strengthening water sector institutions
In addition to continuing large investments in water infrastructure, achieving sustain-able water supply for China’s growing cities will also require institutional reforms. One priority is the reform of utility governance to strengthen the institutions that deliver urban water and treat wastewater and sewage. The other priority is the establishment of regional coordination mechanisms that can manage water allocations and implement measures to ensure water quality at the watershed or river basin level.
One aspect of utility governance, improved cost recovery by raising prices, has already been mentioned as an effective way to encour-
age water use efficiency. A World Bank analy-sis of China’s urban water utilities from 2004 to 2009 showed weak cost recovery and dif-ficulties with achieving greater self-financing of capital investments.52 Only 44 percent of urban water utilities generated positive net margins, although this share varied by prov-ince (figure 7.37). Even the better perform-ing utilities were operating at just above the breakeven point with only 10 percent generat-ing net margins of over 10 percent (a healthy financial performance benchmark is 20 per-cent). The analysis also showed significant variations in utility financial performance across provinces and within provinces, sug-gesting that local government interventions do affect utility financial health. In addition, performance was not correlated with size in the sample. Smaller utilities can perform well with supportive tariff policies and competent
Source: World Bank analysis and China Urban Water Statistical Year-book 2009. No data available for Chongqing, Tibet, and Qinghai.
Figure 7.37 Share of utilities with net positive margins, by province, 2009
SichuanFujian
JiangxiJiangsu
GuangxiBeijing
GuizhouTianjinShanxiHunan
GuangdongAnhui
HainanYunnan
ZhejiangHubei
ShaanxiShanghai
NingxiaInner Mongolia
GansuShandong
HeilongjiangHebei
XinjiangJilin
LiaoningHenan
Percent
0 8070605040302010

g r e e n U r b a n i z a t i o n 521
management. Finally, while most utilities (84 percent) generated operating revenues that covered cash requirements for operations and maintenance, the ratios are razor thin and leave little surplus for capital investment. Further analysis of 27 utilities in 9 provinces between 2004 and 2009 showed that utili-ties’ unit production costs rose on an annu-ally compounded basis at least 5 percent and much more in some cases, so raising prices will be necessary to provide a predictable and sufficient source of revenue for utilities and make them less reliant on support from gen-eral revenue.
If urban utilities become more commer-cialized and autonomous, they will have incentives to solve some longstanding prob-lems in the sector (Browder and others 2007; World Bank 2013b). Governance of the water sector is currently fragmented across differ-ent offices. To improve coordination, cities in some countries have created municipal “water boards” that coordinate and regu-late their water sector. For instance, waste-water tariffs are currently often included in the water bill and collected by municipal water companies, which do not always make efforts to collect the wastewater bills. That also makes it difficult to collect wastewater charges from industries with their own water source. These two issues could be supervised by a water board—a mechanism that could be piloted in more advanced cities first. Mem-bers of these boards are typically appointed by city governments and have the power to make autonomous decisions or recommen-dations on key issues such as tariffs, budget transfers, and capital improvements.
As with air pollution, water supply and quality cannot be successfully managed at the level of an individual city or county only. Pol-lution and overextraction in the upper water-shed affect downstream users. Between 1995 and 1998, for instance, the Yellow River did not reach the sea because of excessive water extraction and as recently as 2009, 30 per-cent of the water in the Yellow River basin was unfit for human consumption, according to MEP. One regional coordination mecha-nism is an integrated water and environment management approach, which establishes a strategic framework at the river basin level
for both water resources and environmen-tal management. It brings together relevant ministries, local governments, major water users, and polluters. A pilot of the approach has been successfully tested in the Hai River Basin. It established a “joint decision-making conference” as a multistakeholder platform for debate and decision making among water users. These processes can reach consensus on water use targets and pollution controls, which are then allocated to the local admin-istrations within the watershed. Without such an inclusive process and appropriate incen-tives, there may be less interest in staying within the targets as experienced in the Yel-low River case, among others.
Finally, institutional reforms are also required at the administrative level. Water and environment management are split, with the water department in charge of water sup-ply and water infrastructure in general, while the environment department is responsible for pollution control in general. Both have overlapping areas of responsibility for water quality control. A further problem is that each department has its own institutional and monitoring system and there is no cul-ture of data sharing. No data sharing among related government departments can lead to disagreements and misunderstandings. Streamlining of responsibilities and greater incentives for cooperation and collaboration and information exchange, piloted in some parts of China, would contribute to achiev-ing national water sector objectives.
Improved solid waste management
As incomes rise and more citizens join the urban consumer society, waste volumes in Chinese cities are growing rapidly. The estimated solid waste volume generated in China, including recyclables that are sepa-rately collected, was 346 million tons in 2011 (table 7.3), about twice the amount in 2000. Urban residents make up about 55 percent of the population but generate about 80 percent of the total waste amount, or 1.1 kilogram of waste a day, compared with 0.3 kilogram for rural citizens. The average of 0.7 kilogram is similar to other large world cities at compara-ble incomes. Waste volumes will likely double

522 U r b a n C h i n a
again by 2030. To ensure a sustainable waste management sector in China’s growing cities, collection fees need to rise to full coverage everywhere, waste segregation and recycling must be improved, and safe disposal of the remaining waste ensured.
Achieving these objectives will also require changing the way waste manage-ment is financed. Municipal waste manage-ment has high marginal operating costs and is therefore different from other services such as water supply and sewage collection, which have high fixed up-front costs but relatively lower operating costs (Hoornweg and Bhada-Tata 2012). Comparable costs in China vary widely. For example, in Shanghai rates are RMB 120 a ton for collection and transport and RMB 90 a ton for disposal in landfill or RMB 240 a ton for incineration. In Kunming, rates are RMB 90 a ton for col-lection and transport and RMB 90 a ton for incineration.
Despite high operational costs, households are typically not charged for formal waste removal. Instead, costs are covered through general spending. Waste management is therefore underfunded in many cities, leading to poor performance. For example, incinera-tors with insufficient gate fees often operate with low temperatures and bad flue gas treat-ment, leading to environmental problems.
Total national waste management fees were only RMB 4.4 billion in 2011, while national investment in fixed assets for waste treatment was RMB 19.9 billion and—assuming overall management costs (collection, transfer and transport, final disposal) of at least RMB 250 a ton—total municipal solid waste costs were likely no less than RMB 40 billion in 2011 for formal cities. These costs are expected to increase tenfold by 2030. A more sustainable financing model would follow international practice in high-income countries and charge households and firms the full cost of waste management, even if charges are combined with those for other utilities to ease admin-istration. Such explicit charges would also encourage reduction of waste generation.
Improving the efficiency of municipal solid waste management
About 70 percent of the waste is currently formally collected in China, and an estimated 54 percent of the total waste is adequately disposed of in sanitary landfills, incinerators, or composting plants. Average waste collec-tion coverage ranges widely, from approxi-mately 20 percent in rural areas to nearly full coverage in many big cities. The volume of waste incinerated (26 million tons in 2011) has increased rapidly. Another 15 percent is
TABLe 7.3 estimated waste generation levels and main outlets in China, 2011
Population
Total waste generated by households
(ton/y)
Total waste formally collected
& transported (ton/y)
Total waste not collected (ton/y)
Total waste separately collected
(=recyclables) (ton/y)
Total waste disposal in harmless manner (sanitary
landfill/ incinerator/ composted) (ton/y)
Total waste not properly collected/
disposed (ton/y)
Kilograms of waste
generated/ person/
day
Urban
722 million (55%)
281 million 219 million 14 million (50% of waste in towns)
48 million (20%) 177 million1 56 million 1.07
Rural
578 million (45%)
65 million 18 million 41 million 6.5 million (10%) 9 million (no data, estimate 14% of total; 50% of waste collected)
49.5 million 0.31
Total
1.3 billion 346 million 237 million 55 million 54.5 million 186 million (cities 131; counties 46; towns+villages 9)
106 million 0.73
Source: NBS 2011a; statistical data from cities and county towns, estimates for towns, and calculations by the authors.
g r e e n U r b a n i z a t i o n 523
recycled. The remaining waste (about one-third of the total amount generated) that is not disposed of properly or collected as recy-clables, is burned, dumped, or disposed of without special environmental controls.
Formally segregation of waste at source organized by local authorities is still rare, but a large informal sector collects and processes valuable recyclables (such as metals, plastics, paper, and appliances). This sector provides income for low-skilled city dwellers, but makes formal recycling of collected waste less profitable. Cities that seek to formalize these systems could integrate currently informal systems or aid informal waste collectors in finding alternative livelihoods. In the longer term, China could adapt European models of product stewardship at both national and local level. In such schemes, manufacturers consider the waste implications along the full life-cycle chain of their products, including the use of packaging materials and the final disposal of the product at the end of its useful life. The government could collaborate with industrial sector organizations and introduce voluntarily schemes and incentives that could eventually lead to mandatory regulations.
Besides raising the collection and recycling rates, better overall planning and manage-ment will boost sector efficiency. First, adopt-ing international practices for master plan-ning of integrated solid waste management systems will avoid overbuilding some parts of the waste management chain and neglect-ing others. To properly function, the various parts of the waste management chain (collec-tion, transfer, transport, final disposal) need to be well matched and synchronized. Sec-ond, introduction of international data moni-toring and financial accounting practices for solid waste management would better reveal the true costs of the waste management chain. About 50 percent of waste volumes are estimated simply by truck counting, meaning that large volumes of waste streams are poorly recorded, and tools for analysis at the national level are inadequate. Accounting practices are also often insufficient. Even at the local level there is generally little insight into the capital and operating costs of all the components in the waste management chain. As a consequence, costs are routinely under-
estimated. Finally, better planning could yield greater economies of scale. Smaller cities, where geographically possible, could coop-erate with adjacent jurisdictions to develop more efficient and well-operated waste man-agement facilities such as landfills or incin-erators. Unfortunately, despite the potential cost savings, such cooperation is still uncom-mon in China.
Reducing pollution impacts from municipal solid waste disposal
More efficient management can greatly reduce, but not eliminate, the amount of waste produced in China that requires dis-posal. Municipal waste disposal is a challenge for many local governments because volumes are rising and land is scarce. To improve the waste disposal system and reduce its envi-ronmental impacts, the national and local governments need to implement improve-ments across the entire waste chain—many of which have already been outlined in the 12th Five-Year Plan. One priority is to streamline administration by introducing greater inde-pendence and accountability for local EPB staff charged with oversight, clarify the roles between the Ministries (or Bureaus at local level) of Housing, Urban and Rural Develop-ment and of Environmental Protection, and reform technical standards and sector guide-lines. As an example of the need for better standards and enforcement, during incinera-tor operation there is often no proper testing, treatment, or disposal of fly and bottom ashes, which causes local pollution problems. Bei-jing provides a good model for an improved waste disposal system. The city has invested in greater supervision of landfill and incinera-tion operations with an institution responsible for monthly inspections. It developed stan-dards for inspection and assessment of opera-tional performance, which have resulted in improved environmental performance.
Cities should also integrate waste man-agement facilities into land use planning. In the planning process, environmental impact assessments and permitting are currently treated as a formality rather than a regula-tory tool. China currently also lacks hydro-geological information and know-how of

524 U r b a n C h i n a
contaminant hydrogeology, and these fac-tors are therefore not sufficiently considered in landfill site selection and design. Finally, local governments need to properly rehabili-tate or close unsanitary landfills in a way that minimizes long-term environmental impacts and allows eventual return of the land to pro-ductive uses. Some cities, such as Beijing and Wenzhou, have completely removed old waste disposal sites by excavating the waste, sorting it, and then transporting the light portion to a newly built sanitary landfill or incinerator. The remaining soil with some organic humus can then be used in gardens and parks. The cost of this restoration could be paid for from the increased land value of the site after it has been cleaned up for redevelopment.
A more sustainable waste management sector
At current growth projections, proposals for continued investments of RMB 264 billion for solid waste management are in line with the ambitions to reach satisfactory levels of waste collection, develop sufficient waste disposal outlets that meet international good practice standards, and introduce waste minimization and recycling schemes. The key challenge will be to match the investments with the operational budgets needed to manage these waste systems and to gradually move toward greater cost recovery through user charges for these services. Fees currently make up only about 10 percent of the RMB 40 billion needed to run waste operations, and these costs will further increase substantially due to the planned investments, the growth in GDP, and the urbanization process.
Cities where a billion people want to live and workThree decades of economic growth brought great welfare improvements to China, but at the cost of unsustainable resource consump-tion and pollution. China’s leaders have rec-ognized that resource depletion and pollu-tion have become a costly barrier to further development. And with rising prosperity, China’s urban residents expect a future that includes clear water and blue skies. The ulti-mate causes of China’s environmental prob-
lems are institutional rather than technical. The main problems are inadequate resources, ineffective organization, limited channels for public participation, and insufficient incen-tives for environmental management. China’s leaders can strengthen green governance by focusing on the following reforms that have been discussed in this report:
• Increase resources and enhance authority for environmental management to sup-port more staff who promote greening and enforce environmental rules. Strengthen data collection and widely disseminate information to better monitor compliance, which is necessary regardless of the policy instruments used.
• Revise the cadre evaluation system, so local leaders have a greater incentive to pursue environmental objectives and focus on quality of life of their citizens, while allowing some flexibility to adapt green goals to local conditions.
• Allow greater public participation in hold-ing polluters to account. Citizens, non-governmental environmental groups, and the media can all assist the government in ensuring that ambitious environmen-tal rules are followed. Public disclosure of environmental performance shames companies into cleaning up. And the legal system can complement government enforcement if current experiments with environmental courts and tribunals are expanded and formalized.
• Rebalance environmental policy instru-ments toward more market-based tools such as taxes and trading systems, possi-bly for carbon and energy use if appropri-ate measurement and verification systems can be established and new mechanisms calibrated with existing policies—while enforcing well-designed regulations where price signals are insufficient.
Without strengthening green governance, necessary changes in resource- and pollu-tion-intensive sectors will be difficult, if not impossible, because it is the application of green governance principles in sector poli-cies that will encourage cleaner and resource-efficient growth. As this chapter has shown,

g r e e n U r b a n i z a t i o n 525
local environmental agencies need greater resources to encourage greening and to ensure compliance with environmental rules in the energy, transport, buildings, water, and waste management sectors. In particular, water resource and air pollution management need regional management mechanisms. Public participation and stronger legal mech-anisms are most important in holding pollut-ers to account but will also help gain greater acceptance for efficiency investments.
Across all sectors, the basic principle for environmental policy design is to rely as much as possible on market or price instru-ments, which provide the incentives for firms and households to seek efficient ways to go green. China has raised some resource prices, but must also do so for others such as water. China is also exploring carbon taxes and car-bon trading, and similar mechanisms could also work for water. Regulations will be effective where price instruments are not suf-ficient, for instance where harmful pollution must be urgently stopped or where behav-ioral issues blunt price instruments. Finally, in some cases, the government will need to provide investments or financial support, for instance to finance pilots and to collect and disseminate information about what works in resource efficiency and pollution control; or more directly to make public transit an attractive alternative or to make building energy investments financially viable.
Technical measures across the sectors that make firms and households more resource efficient and reduce pollution are known. The core message is that sustainable sector practices are compatible with green sector policies. Although there are important non-financial barriers, investments in efficiency
tend to be financially cost-effective even when ignoring broader ecological and health benefits, but deeper efficiency improvements to achieve greener ambitions will need smart incentives and mandates. Pollution abatement is a cost to firms that essentially must pay for a service—removal of harmful byproducts into air, water, or soils—that they previously received for free. Nevertheless, many barriers still prevent these measures from happening, and a combination of both enforced regula-tion as well as market-based approaches is needed. But the high social benefits justify the imposition of stricter emission stan-dards, and firms can often achieve pollution reductions most cheaply through efficiency improvements or productivity enhancing capital upgrading.
China could also find it easier to make needed sector investments than many other emerging and developing countries that face severe environmental problems. It has the technical expertise among academics and professionals and a growing green industrial sector that can supply the needed technology. As China 2030 report pointed out, there are large business opportunities in an ambitious green transformation. Countries such as Ger-many have shown that rising environmental standards encourage domestic industries to innovate, developing clean technology that is now exported around the world. Despite the needed rebalancing of the economy away from low-value industries, China will retain a large manufacturing sector. The examples of Germany, Switzerland, and Sweden, but also the Republic of Korea, for instance, shows that this rebalancing can be compatible with becoming a green growth leader whose cities top quality-of-life rankings.

526 U r b a n C h i n a
Annex 7A Smart greening
The foundation of green governance is cred-ible, transparent, and publicly available data. With China’s cities collectively grow-ing by about 15 million people a year, tradi-tional city management methods are being challenged. This report proposes some new approaches, but the lifeblood of new man-agement methods will be data and how it is used. Improved data collection, management and dissemination should be able to improve the carrying capacity of cities’ growing popu-lations. There is no universal definition of a “smart” city, but greater use of information technology (IT) can benefit cities in the fol-lowing ways:
Promoting a more serviceoriented government, moving away from traditional command and control approaches. Smart infrastructure moves information in both directions between government and its citi-zens. Two-way communication improves interaction and proactivity, and develops greater understanding. For instance, appli-cations of smart technologies could reduce traffic congestion by providing greater logis-tical information and knowledge to travelers. Social media can help disseminate informa-tion in the public’s interest and promote envi-ronmental awareness, while at the same time allowing for feedback in near real time.
Stimulating innovation in hightech and information technologies. Information tech-nologies as simple as metering and informa-tion systems can transform an industry like district heating through consumption-based billing or distributed generation in the power sector.
Enhancing public services and people’s quality of life. Because the market still does not deliver many public services, information asymmetry is prevalent. Applying e-com-merce principles to e-government can deliver public services more efficiently to a large and growing urban population. Greater public disclosure of pollution discharges and air and water quality can support market-based approaches by raising people’s awareness and stimulating demand for green lifestyles, ser-
vices, and products. Vulnerable groups like the growing number of elderly residents will also stand to benefit from information on pollution to help them protect their health. Medical specialists could also be accessed through remote service models.
There are many examples of smart city applications. For instance, Singapore has relieved traffic congestion despite having nearly two cars per resident by implementing an electronic pricing system for traffic conges-tion. When the system was first put in place in 1998, data collection was done by person. Now, traffic is monitored by sensors and infrared equipment installed on roadways. With this real-time data, citizens can check traffic conditions using their mobile phones or on-board global positioning systems in vehicles. Average vehicle traffic dropped by about 25,000 vehicles during rush hours and traffic flow improved by 20 percent.
Cities worldwide have used different approaches to constructing smart technolo-gies for cities ranging from government investment and operation to outsourcing. Full funding by government has applied mainly to services such as fire prevention and emergency warning systems that are supplied exclusively by public entities (as in New York). For other services such as video monitoring, some cities, such as Singapore, Hong Kong SAR, China, and Shenzhen, have handed over operations to commercial companies. In these cases, the government typically finances the capital investment and part of the operating costs while the opera-tor’s price is negotiated through a competitive bidding process. Cities vary as to how much risk and control of operations they pass onto commercial companies.
Because China is still far behind in col-lecting basic data for many public services, leapfrogging to a big-data, smart-city con-cept is still an ambitious prospect. At this initial stage, Chinese cities should study the experience of other cities—both at home and abroad—with big data systems. But there are some areas in which immediate action can and should be taken, for example in meter-ing district heating and water use. Gov-ernment guidance should be developed to

g r e e n U r b a n i z a t i o n 527
avoid impractical applications of data and plan ahead for how different systems might be integrated in the future. Currently, the highly fragmented nature of data collected for public services is a major challenge for Chinese cities. Planning for better integra-tion can help cities realize synergies in real-izing cross-sector objectives such as the inte-grated management of the environment and water resources. It also makes it possible to use a more complete set of indicators for assessing the progress of city management. Beyond data collection, investing in smart applications in public services can help to unleash efficiencies—but with technologies comes a need to ensure public service man-agers actually use these enhancements and act on them.
As they build smarter cities, local gov-ernments in China will need to walk a fine line between providing public oversight of e-services and data systems and constricting a highly innovative IT market. In many cases, the market has solved problems on its own. Value-added services such as mobile Inter-
net apps to hail taxis or map current traffic have boomed without government support, reducing wait times and traffic congestion. Yet, even with greater use of IT technologies, the government will continue to play a very important role in traditional public services, especially to ensure appropriate data and reporting for regulated services. Incentives will be needed for adopting smarter systems especially in utilities such as heating and water, which tend to be more conservative and face financing constraints. Strict public oversight will be needed for services involv-ing the use of sensitive information such as personal medical records. The government should ensure norms and standards for infor-mation security are clear and enforced while guarding against creating roadblocks where the disclosure of information is in the public interest, for example, in monitoring pollution or assessing environmental impacts of proj-ects. With the right balance, local govern-ments in China can create smart cities that are greener, more efficient, and better serve the people.
Annex 7B illustrative framework and analytical tools for urban energy and emissions reduction planning
While traditional energy sector planning is essential, leading cities around the world have started to coordinate these traditional sec-tors to achieve specific, ambitious emission reduction objectives. As major consumers of both benefits of energy use and its environ-mental consequences, cities have an interest in least cost paths to accelerated greening. While there are many similar approaches, this annex illustrates a model framework for planning, drawing on the Sustainable Energy and Emissions Planning (SUEEP) process that was developed by the World Bank through its experience working with cities in its East Asia and Pacific Region (World Bank 2012) (figure 7B.1). It also highlights some methods and tools Chinese municipal authorities could use in managing their cities’ energy use and associated emissions of pollu-tion. It concludes by demonstrating the need for cross-sector approaches and identifying and overcoming challenges.
Securing commitment
A key piece of advice for the ambitious mayor preparing to set out on the energy and emis-sions planning process is to focus on creat-ing the enabling conditions for planning (box 7B.1). As experts experienced in urban energy and emissions planning have noted, securing commitment by city leaders at the beginning of the planning process is another key to success. What this means is making sure relationships can be built across agencies and across sectors, which would not normally interact. Establishing trust between munici-pal stakeholders—including energy, trans-portation, construction, and environmental protection agencies—is needed to encourage them to share their data, time, and resources. Involving these stakeholders at an early stage is also important because they will eventually be responsible for carrying out recommended actions.53

528 U r b a n C h i n a
Diagnostics and benchmarking
Diagnostics entail an assessment of how well the city is currently doing and where it could do better. Elements of conducting a baseline assessment include selection of indicators, a bottom-up inventory of energy use and GHG emissions, and benchmarking to iden-tify under-performing sectors and potential opportunities for improvement.
Hundreds of cities around China have put forward goals for becoming green, low car-bon, or eco-friendly (sheng tai), but what it actually means to be a green, low-carbon, or eco-city is much less clear in practice (Price and others 2013; Zhou and Williams 2013).54 Indicators bring operational clarity to goals and provide a concrete basis for cities to measure baseline performance, compare their performance against that of peer cit-ies or best-practice standards, evaluate their potential for improvement, establish targets, and assess their progress over time.
Aggregated indicators such as energy use per unit of GDP and per capita CO2 emissions are commonly used to evaluate provincial and local city governments in reducing their energy use and emissions. While these top-down, macro-level indicators give a sense of a city’s overall progress, they do not provide a detailed picture of which sectors are most
responsible for energy end use and emissions by the city. Also, overall measures may be biased by the structure of the urban economy, population, climate conditions, and other fac-tors, creating the need for bottom-up, sector-level indicators of energy end-use and emis-sions (Price and others 2013; Zhou and others 2012). Examples of bottom-up indicators for the urban transport sector and proposed benchmarks are shown in (table 7B.1).
Target setting and prioritizing actions
Once reliable data and measurements are obtained, and key problems identified, stra-tegic objectives and goals can be determined. Understanding the technical feasibility and incremental costs of abatement measures will help establish the technical and afford-able abatement potential cities can strive for. Do cities promote micro-turbines or rooftop solar PV, or do they place their efforts more on importing green electricity? These ques-tions can be answered through this process, but with strong technical support from sec-tor specialists who understand the specific resource potential for cities.
Changning District in Shanghai offers an example of priority setting for energy plan-ning based on strong analytics (box 7B.2; World Bank ESMAP 2013). Having identi-fied potential energy savings and measures for reducing carbon emissions, experts grouped options into three categories:
• “Do it now” or “noregret” options that are low-cost and are easy to implement
• Options to “start now, then accelerate” that are either low-cost but difficult to implement or higher-cost but easy to implement and that can be piloted now and then scaled up over the medium term as technologies mature
• Options to “develop now, and capture over time” that come with high costs and significant implementation challenges but have high abatement potential, which can be studied and possibly piloted
With these options, scenarios were developed to assess how far the city could “stretch” to achieve carbon emission reduc-
3. Targetsetting
4. Prioritizingactions
5. Implementing6. Monitoringand review
1. Commitment
2. Diagnosticsand
benchmarking
Figure 7B.1 An example of the energy and emissions planning process
Source: Based on World Bank 2012.

g r e e n U r b a n i z a t i o n 529
tions beyond baseline targets in the current Five-Year-Plan and become a leader for low-carbon city development.
Critically, stakeholder consultations are especially important to establish needed
buy-in from citizens, businesses, and other concerned parties whose understanding and support will be needed for implementation. Feedback on targets, program design, afford-ability, implementing arrangements and so
The population of America’s largest city, New York City, is expected to grow by 1 million people by 2030 and will place additional stress on exist-ing infrastructure and resources, including energy. Faced with this challenge, the city embarked on a long-term planning process called PlaNYC 2030 to devise strategies to reduce material and energy use, improve natural spaces, plan for and mitigate the effects of climate change, and create a more equitable and engaged society. Strategies were designed and are being executed by a joint task force, led by a specially designated mayoral office and comprised of 25 city departments and stakeholders from state and fed-eral agencies, businesses, and non-profit groups. To strengthen local ownership of the plan, the task force has engaged in media outreach efforts and offered incentives and support to encourage active participa-tion by local business owners and residents, includ-ing grant programs and changes in zoning codes intended to create new development opportunities (ICLEI-NYC 2010). The plan is now in its fourth year of implementation.
The energy and emissions strategy for PlaNYC is focused on achieving a goal of reducing city-wide GHG emissions by 30 percent in 2030 compared to 2005. Because buildings contribute to 75 percent of the city’s total carbon emissions, PlaNYC has kick-started a number ambitious programs and policies to improve energy efficiency in the city’s building stock.
Box 7B.1 New York PlaNYC 2030 case study: integrated centralized planning relying on decentralized delivery
This buildings effort has two major elements: the promulgation of new laws (together called the Green, Greater Buildings Plan [GGBP]) and the formation of the 200-person Green Codes Task Force (GCTF) to recommend code and other reforms to reduce a number of environmental impacts of buildings (i.e., not just energy use) (NYC 2011). The GGPB requires regular energy audits, retro-commissioning, and data sharing for large public and private buildings; lighting upgrades; and sub-metering of government buildings and commercial tenant spaces. These measures will impact more than half of the space in 16,000 build-ings in the city. To ensure compliance, procedural incentives exempt from retro-commissioning and audits buildings that adopt measures early or comply with LEED for Existing Buildings, a revolving retro-fit loan fund has been created with federal stimulus funds, and the City is forming a large ESCO.
So far, the city is making notable progress in imple-menting the GGPB and PlaNYC. The city estimates that nearly 70 percent of private building owners have submitted energy use data (Levine and others 2012), energy-efficiency program funding has increased six-fold in recent years, and 10 percent of the city bud-get is now committed to energy efficiency. The city plans to further increase energy efficiency investments through public contracting (ICLEI-NYC 2010; NYC 2011) and to roll out new programs for efficiency improvements in small and medium buildings.
Source: Adapted from Zhou and Williams 2013.
TABLe 7B.1 “green” and “low-carbon” indicators for the transport sector in Chinese cities
Indicator Benchmark Source
Public transit network penetration (km of network per km2 of city area)
4 km/km2 Upper end of China national target for transport planning (Code GB 50220-95)
Share of public transit trips in total passenger trips (%) 60% 12FYP for Transport System target for cities with 10 million people or more
Access to public transportation (share of built area within 500 meters of public transit)
90% MOHURD public transportation demonstration project
Municipal fleet improvement (portion of electric, hybrid, biofuel, and compact [<1.6 L] cars in public vehicle and taxi fleet)
100% Lawrence Berkeley National Laboratory expert team assessment
Source: Drawn from indicators included in the ELITE Cities benchmarking tool for Chinese cities (He and others 2013).

530 U r b a n C h i n a
on can be extremely valuable in obtaining buy in to especially ambitious agendas.
implementing, monitoring and reviewing
The quality of the monitoring and reporting process will largely depend on the quality of the data and indicators chosen. Periodic
monitoring and reporting can sound mun-dane but it is essential to providing feedback and calibrating decisions. Cities should estab-lish a mechanism that is suitable to local con-ditions and mobilizes timely action using the information that is gather. Online monitor-ing tools and public disclosure of progress helps to provide needed information that is in the public interest and develops and under-
The Rotterdam Energy Approach and Planning (REAP) is part of the Rotterdam Climate Initiative, which aims to halve the level of CO2 emissions in the city by 2025, compared to 1990 levels. This is an ambitious plan which requires ambitious actions in terms of urban energy planning. REAP rests upon a simple concept based on re-using waste flows such as wastewater, household and agricultural waste, and residual heat, whilst using renewable energy to satisfy remaining demand.
REAP incentivizes urban planners to search urban areas for opportunities to exchange energy. For instance, in the area of Rotterdam near the World Trade Centre, many new homes, offices and a second shopping mall and supermarkets are all forthcom-ing. All of these buildings have their own heating and cooling needs and produce residual energy flows that can be “exchanged.” For instance, supermar-kets must continually operate cooling systems which produce huge amounts of heat that, if not reused, simply disappears into the atmosphere. Within the REAP framework, heat pumps transfer this residual heat to nearby homes and buildings. This principle of heat cascading also allows for the exchange of heat between offices and homes. On hot days, for instance, office air conditioning units roar into action, yet the heat that is produced in this process is wasted. Within the REAP framework, this heat is stored, for instance in underground aquifer layers (heat and cold storage) for inter-seasonal exchange (and then used to heat homes during the winter months) or in tanks for cov-ering diurnal or weekly differences.
REAP strategy was applied in Hart van Zuid, an existing district in Rotterdam, where urban planning calls for homes (to be built near a shopping center) that can use the residual heat generated by a local supermarket. The Ikazia Hospital, which is located nearby and consumes huge amounts of energy, is
Box 7B.2 Heat cascading in the rotterdam energy Approach and Planning
also being modified to be energy self-dependent by reclaiming heat from residual hot air and water, while also becoming much better insulated by means of an overarching climate façade which resembles a huge greenhouse covered in vegetation.
REAP framework requires a substantial amount of infrastructure changes. For instance, small com-munal facilities must be built to store and redistrib-ute energy. Moreover, heat pumps and heat storage systems are needed for counter-balancing daily and seasonal temperature changes.
The following steps are implemented:Step 00. Make an inventory of the current energy
consumption. Step 01. Reduce consumption. New functions will
be added: 20,000 square meters shops, 6,000 square meter supermarket. Theatre Zuidplein and the infra-structure intersection will be renewed. Better insu-lation of the existing shopping centre will in itself already significantly improve the situation.
Step 02. Reuse waste streams. The addition of housing will create a better heat-cold balance. The use of the waste heat generated by the supermarket and the typical morning and evening energy con-sumption in homes means that the match is perfect: A one square-meter supermarket can heat seven square meters of housing. If 665 apartments are added, the heat-cold ratio becomes 1:1.08, assuming that use is made of heat and cold storage.
Step 03. Renewable energy generation. The remaining demand for heat can be solved by the addi-tion of greenhouses on the first floor, which could be public areas (or greenhouses for growing tomatoes), or by the addition of PV-panels. PV panels could also be installed on the roof to supply electricity for the whole shopping centre. The remaining energy required could be sustainably generated at a higher scale level.
Source: Salat 2013.

g r e e n U r b a n i z a t i o n 531
standing, shoring up support for the abate-ment measures.
Tools to assist in the planning process
A variety of tools have been developed to assist city leaders in the process of urban energy planning. Diagnostic tools which help cities evaluate their performance include the Urban RAM and ELITE Cities tools. Urban RAM (Urban Rapid Assessment Model) eval-uates final energy use by consumers in the transportation, residential, and commercial buildings sectors, as well as the embodied energy use in urban infrastructure and con-sumer goods (Fridley and others 2012). The tool’s explicit accounting of energy embodied in consumer goods reveals the importance of purchasing habits and behavioral changes in shaping a city’s energy and carbon footprint; however, it does not cover energy use and GHG emissions by industry, the dominant urban sector. Urban RAM has been piloted in Suzhou City. ELITE Cities (Eco and Low-Carbo Indicator Tool for Evaluating Cities) is a light-touch benchmarking tool that, like Urban RAM, was also developed specially for use by Chinese cities (He and others 2013). ELITE Cities is built on a system of indica-
tors for climate, water, air waste, mobility, economic health, land use, and social health that enable cities to compare their perfor-mance against national standards, targets, and best-practice levels of cities in China and abroad.
Energy mapping for neighborhood and city-level spatial plans is another example of a cross-sector methodology. Energy map-ping enables cities to identify opportunities for harvesting local energy supplies and uti-lizing flows of “waste” energy. For example, to assist the Hart van Zuid District of Rot-terdam in realizing goals for becoming car-bon neutral, energy planners used heat map-ping to evaluate the possibility of recycling streams of waste heat from a new ice skat-ing rink to supply a nearby swimming pool (box 7B.2). By reducing the pool’s heating demand, planners found that it was possible to supply the residual demand for heat in the neighborhood by installing rooftop solar col-lectors on buildings (van den Dobbelsteen and others 2012). Additional examples of district-scale energy mapping by Dutch cit-ies are illustrated in figure 7B.2. In the left panel, columns are filled according to the potential for local energy supplies in Rotter-dam, including geothermal energy, biomass
Figure 7B.2 examples of energy potential mapping from the Netherlands, rotterdam and groningen
Source: Broersma and others 2010 (left), and van den Dobbelsteen, Broersma, and Fremouw 2013 (right).
residences, holiday homes, spa, tropical paradise,
seasonal industry City of heat
tidal plantand blueenergy
Wind turbine park
a. rotterdam b. groningen
blue energy plant
inundation plant
biomass boulevard bio-plant, bio-refinery,
bio-ethanol factory
natural reserves Forestlands and wetlands
for Co2 sequestration
heat cascading industry feeds
horticulture feeds residences
Figure 7B.2 Examples of energy potential mapping from the Netherlands, Rotterdam (left) and Groningen (
Source: van den Dobbelsteen and Stremke 2012.

532 U r b a n C h i n a
and solar energy, to satisfy heat demand. This method of energy mapping allows for city planners to incorporate local energy sup-ply strategies into spatial planning for urban development, as shown for Groningen in the right panel.
Other tools link diagnostics with tar-get setting and prioritizing actions, as does TRACE (Tool for Rapid Assessment of City Energy).55 Developed by the World Bank’s ESMAP, TRACE is intended to assist cities with developing a portfolio of strategies for reducing energy use in six municipal sectors: passenger transport, municipal buildings, water and wastewater, public lighting, solid waste, and power and heat. TRACE enables cities to identify under-performing sectors, evaluate their potential for improvement, and select priorities for action among a menu of proven, cost-reducing measures for improv-ing energy efficiency. Twenty-three cities around the world have deployed TRACE so far, including Rio de Janeiro, which is host-ing the 2014 FIFA World Cup and 2016 Olympics, and Belo Horizonte, which is also hosting the 2014 FIFA World Cup. Outputs from TRACE have provided grounding for
a US$ 100-million energy-efficiency invest-ment program by the World Bank in the two cities. The Lawrence Berkeley National Lab-oratory is tailoring a new tool, built on the framework of TRACE, designed specifically for Chinese cities (box 7B.3).
Like TRACE and BEST-Low Carbon Cit-ies, the MACTool (Marginal Abatement Cost Tool) assists cities with baseline diagnostics, setting targets, and prioritizing actions.56 MACTool compares the CO2 abatement potentials and costs of deploying a suite of mitigation technologies, allowing users to construct a marginal cost curve for CO2 emissions reductions. National and subna-tional governments have used MACTool for estimating break-even carbon prices in set-ting up carbon ETS schemes. Shanghai City’s Changning District has piloted and adapted the underlying methodology behind the MACTool for use in China. Other innovative examples of tools being tailored specifically for Chinese cities include the development of a simplified city-level GHG accounting methodology and redesigned Long-range Energy Alternative Planning System (LEAP) by researchers at Renmin University, which
The Benchmarking and Energy Saving Tool for Low Carbon Cities (BEST-Low Carbon Cities), developed by the Lawrence Berkeley National Laboratory, is a decision-support tool designed to help city authorities in China identify and rank strategies that they can pursue improve city-wide energy efficiency and reduce carbon emissions.
Adapted from TRACE, BEST-Low Carbon Cities is intended to synthesize, package, and delivery best practices from around the world in a way that is rel-evant for Chinese city leaders. The BEST-Low Car-bon Cities process begins with a quick assessment of a city’s local energy use and carbon emissions in nine sectors: industry, public and commercial buildings, residential buildings, transportation, power and heat, street lighting, water & wastewater, solid waste, and urban green space. The addition of industry (which
Box 7B.3 Benchmarking and energy saving tool for low-carbon cities (BeST-Low Carbon Cities)
was not included in TRACE) is particularly impor-tant for China because industries account for 70 per-cent of urban energy use on average. Performance on key indicators is benchmarked against that of peer cities with similar climate conditions, populations, and levels of development, both inside and outside China, to identify sectors with the greatest potential for saving energy and reducing CO2 emissions. As with TRACE, BEST-Low Carbon Cities then allows city authorities to choose energy and carbon reducing measures from a “playbook” of proven options and to evaluate their appropriateness. By ranking strate-gies that yield the greatest reductions and are most suited to local circumstances, the tool helps local government officials to develop a low carbon city action plan that can be implemented in phases, over a multi-year timeframe.
Source: Adapted from Lawrence Berkeley National Laboratory description of BEST-Low Carbon Cities and World Bank author’s interview with Zhou Nan and Lynn Price, 1 August 1, 2013.

g r e e n U r b a n i z a t i o n 533
they used to help Qingdao City craft a low-carbon development strategy (Wang Ke 2012). The above is not an exhaustive list and other tools may suit specific circumstances (see table 7B.2 for illustrative examples of tools). Further tailoring China-specific tools can help improve the perceived credibility of these tools among city leaders and increase the likelihood that they are utilized.
Cross-sector approaches and methodologies for energy and emissions planning
Currently, there is a need for cross-sector planning approaches, methodologies, and tools that account for the interrelated effects of policy choices on energy, water, land, air, and waste in urban systems. Such tools can improve coordination of urban energy plans with master spatial plans and sector policies in industry, buildings, transport,
health, water, and environmental protec-tion. This section highlights two cross-sector approaches and methodologies that can be incorporated into urban energy and emis-sions planning: climate-friendly air quality management and spatial energy mapping.
“Climate-friendly” air quality manage-ment (AQM) aims to improve air quality and prevent dangerous climate change by pursu-ing concurrent reductions in traditional air pollutants and greenhouse gases (James and Schultz 2011, 1). Evidence from around the world supports that designing and implement-ing coordinated strategies for reducing local air pollution and greenhouse gases is more cost-effective and yields greater economic benefits than pursuing isolated strategies for controlling single pollutants. First, it is usu-ally much cheaper for local governments and businesses to meet regulatory requirements for controlling criteria pollutants such as
TABLe 7B.2 illustrative examples of tools to assist city leaders in developing low-carbon plans
Energy and Emissions Planning Tools Process guide
Benchmarking
ScenariosTarget setting
Develop options for actionImplementation
supportEnergy CO2 Identify Cost/Impacts Prioritize
MAC ToolWorld Bank Energy Services Management Assistance Program (ESMAP)
• • • • • •
TRACEWorld Bank ESMAP
• • • • • •
BEST-Low Carbon CitiesLawrence Berkeley National Laboratory, U.S.
• • • • • • •
EFFECTWorld Bank ESMAP
• • • • [b]
Urban RAMLawrence Berkeley National Laboratory, U.S.
• •
SUEEPWorld Bank
• • • • [a] • • • • •
MCA4climateUNEP
• •
Climate Compass Compendium of MeasuresClimate Alliance
•
A Guidebook for Low-Carbon Development at the Local LevelLawrence Berkeley National Laboratory, U.S.
• • •
Sustainable Energy Planning handbookUNHABITAT, ICLEI
• •
ELITE CitiesLawrence Berkeley National Laboratory, U.S.
• •
Notes: [a] scenario modeling is not one of the tools in the toolkit, al though the guidance document offers advice on considerations for creating scenarios; [b] marginal abatement costs analyzed for major energy using sectors under different scenarios, MAC curves can be created for technologies in industry sub-sectors.

534 U r b a n C h i n a
SO2 and NOx by investing in climate-friendly measures such as improvements in energy efficiency than focusing solely on end-of-pipe controls. The UNDP estimates that China can reduce the costs of meeting its air qual-ity objectives by 60 percent and reduce local air pollution by an even greater margin if it integrates investments in energy efficiency, co-generation, and renewable power genera-tion into local AQM programs (UNDP 2010). Second, accounting for both greenhouse gas mitigation and local AQM impacts can amplify the expected economic benefits of policy choices that may not appear to be cost-beneficial if impacts on local pollutants or greenhouse gases are considered in isolation. The United Kingdom’s environmental agency estimated that measures to increase uptake of low-emission vehicles by consumers would cost around 72 million per year and provide annual benefits of 61 million from avoided air pollution. If avoided CO2 emissions were also considered, however, total benefits would be around 163 million, a much better deal (UK DEFRA 2007, 12).
China’s central government has already embraced the basic principles of climate-friendly AQM in calling for an integrated, multi pollutant approach to reducing air pollution in key regions (James and Schultz 2011).57 The main tasks for outline cities in the 12th Five-Year Plan for Prevention and Control of Air Pollution include measures with significant climate change co-benefits,
such as expanding clean energy supply, lim-iting direct coal use, eliminating small and inefficient boilers, and encouraging cogen-eration of heat and electricity (State Council 2012). New requirements for cities to develop AQM plans in the 12th Five-Year Plan—and mandatory targets for local governments to reduce their carbon intensity—thus pres-ent an opportunity. As they formulate their plans, cities in the key air pollution regions should seek to maximize co-benefits by beginning to consider the impacts of climate change mitigation as part of a multi-pollutant strategy. This requires a city greenhouse gas emissions inventory and an explicit account-ing of climate co-benefits as part of the evalu-ation of abatement options. The account-ing of climate co-benefits would in effect be an extension of the cost-benefit or cost-effectiveness analysis recommended by the World Bank and MEP for strengthening the AQM planning process under current minis-try guidelines (see World Bank-MEP 2012). California’s San Francisco Bay Area offers an example of how local governments may take a multi-pollutant, climate-friendly approach to AQM planning (box 7B.4).
identifying and overcoming challenges to urban energy and emissions reduction planning
Data availability is one of the main chal-lenges preventing Chinese cities from using
The Clean Air Plan issued by California’s Bay Area Air Quality Management District (BAAQMD) in 2010 is the first AQM plan developed by a local pub-lic authority in the United States to take an integrated approach to air quality and climate change. The plan targets four categories of pollutants: ozone, PM2.5, toxics, and greenhouse gases. The plan aims not only to meet federal and state air quality standards, but also sets long-term goals for reducing greenhouse gas emissions in the district to 1990 levels by 2020 and to 40 percent below 1990 levels by 2035. In develop-ing the plan, the BAAQMD estimated public health
Box 7B.4 Climate-friendly air quality management planning in the San Francisco Bay Area
impacts from air pollution in recent years and com-pared the health and climate protection benefits (expressed in dollar terms) of measures to reduce targeted pollutants under different scenarios. The analysis of abatement options included an evaluation of potential trade-offs for control measures that could reduce some pollutants while increasing others. In all, the district estimated that a 1 percent reduction in targeted pollutants would yield $202 million in health benefits, including $158 million in health ben-efits from avoided PM2.5 and $29 million in climate protection benefits from avoided greenhouse gases.
Source: BAAQMD 2010.

g r e e n U r b a n i z a t i o n 535
tools to develop low-carbon action plans.58
Tools such as Urban RAM and MACTool have been piloted in larger Chinese cities with extensive resources and analytic capa-bilities, but may be more difficult to employ in smaller cities. Investing in technical capac-ity, including better data collection, moni-toring, and reporting, is absolutely critical for cities to be able to manage their energy use and emissions and make informed deci-sions about reduction strategies. In addition, most local city governments—both small and large—will probably not develop their energy and emissions plans entirely on their own. They will likely seek outside help or outsource some of the key analytic tasks to experts. Thus, energy and emissions planning also depends on building up China’s techni-cal service industry and expanding public assistance programs for cities completing energy and emissions action plans
During implementation, finding champi-ons of multi sector solutions and then identi-fying financing to implement them are some of the challenges for getting actions off the ground. Examples presented in this report such as in New York City or Stockholm offer ideas for how city leaders could facilitate con-version of plans into actions. Public infor-mation of the plan and the objectives also helps to keep the agencies accountable for implementation. As in the case of Changning District in Shanghai, retrofitting commer-cial buildings would not happen on its own. A specific set of policy measures including targets and provision of financing through a World Bank loan were organized as a pack-age of measures that are intended to facilitate implementation. Understanding the finan-cial viability and nonfinancial barriers of the measures is critical for targeted and effective government support.
Notes 1. “Polluted” or “seriously polluted” water is
Grade IV or below, according to China’s Environmental Water Quality Standard (GB3838-2002).
2. One reason for these higher estimates is that they include both rural and urban areas, making use of satellite data available for the entire country. Another is that they use a new
dose-response function more appropriate for China’s very high pollution concentrations and a lower minimum threshold between air pollution exposure and health effects.
3. h t t p : / / e p p . e u r o s t a t . e c . e u r o p a . e u / s t a t i s t i c s _ e x p l a i n e d / i n d e x . p h p /Environmental_protection_expenditure.
4. http://www.nytimes.com/2013/03/30/world/asia/cost-of-environmental-degradation-in-china-is-growing.html; http://www.cleanbiz.asia/news/chinas-revived-green-gdp-program-still-faces-challenges.
5. Information was provided by MEP. See also Kaiser and Liu (2009).
6. Information was provided by MEP. This total includes 46,000 provincial, municipal, and county EPB staff plus 146,000 staff in affili-ated institutes at each administrative level.
7. Xiao Xiang Morning Post (潇湘晨报), “Media Investigation Finds Polluting Indus-tries are Income Source for Local EPBs” (媒体调查基层环保局:污染企业成为其收入来源), Xinhua News online, April 16, 2013, http://news.xinhuanet.com/yuqing/2013-04/16/c_124587694.htm (Chinese).
8. The management of pollution fees has been revised over the past few years so that salaries are paid out of a “basic fund” that is sepa-rate from a “project fund.” Pollution fees are sent to the local finance bureau. EPBs can then apply to get back part of that money to finance particular environmental projects but not salaries. But, as indicated in the Xinhua article, this practice may not be followed by all EPBs.
9. This includes agencies such as the economic commission, and the land resources, trans-portation, and construction bureaus, which through their decisions and actions have a large influence on environmental quality.
10. ht tp: //www.chinadia logue.net /ar t icle /show/single/en/5438-Officials-struggling-to-respond-to-China-s-year-of-environ-ment-protests- and http://blogs.cfr.org /asia/2013/05/20/chinas-environmental- politics-a-game-of-crisis-management/.
11. “ C h i n a ’s P r o p o s e d R e v i s i o n s t o Environ mental Protect ion Law Draw M i xed Rev iews ,” B loomberg / BNA , Ju ly 17, 2013, ht tp: / /w w w.bna.com /chinas-proposed-revisions-n17179875568/.
12. “The 10 most secretive cities were Zaozhuang in Shandong, Datong and Yangquan in Shanxi, Xiangyang in Hubei, Karamay in Xinjiang, Changchun and Jilin city in Jilin, Zhangjiajie in Hunan, Jinzhou in Liaoning and Ordos in Inner Mongolia. Forty cit-

536 U r b a n C h i n a
ies scaled back their information disclosure last year, with Wuhu in Anhui, Foshan and Shantou in Guangdong, Baoding in Hebei, Taizhou in Zhejiang, Changzhou in Jiangsu, Anshan and Dalian in Liaoning, Weifang in Shandong and Yinchuan in Ningxia the most regressive.” Stephen Chen, “Most Chi-nese Cities Hiding Vital Pollution Data from Public,” South China Morning Post, March 29, 2013, http://www.scmp.com/news/china /article/1202211/most-chinese-cities-hiding-vital-pollution-data-public.
13. Barbara Finamore, “A Step Forward for Environmental Transparency in China,” SWiTCHBOARD, Natural Resources Defense Council Staff Blog, 29 March 2013, http://switchboard.nrdc.org/blogs /bfinamore/a_step_forward_for_environ-ment.html.
14. The average spot price at China’s northern seaports in 2012 was around RMB 650. Esti-mates of tax burden were based on a look at the financial reporting of 12 large publicly listed firms (China Energy Network, June 20, 2013, http://www.cmen.cc/2013/coal_0620/49560 .html).
15. National Energy Administration, “Establish-ing a Modern Tax System for Coal” (建立现代煤炭税费制度), reposted from Economic Daily (经济日报), March 21, 2013, http://www.nea.gov.cn/2013-03/21/c_132251142.htm; Xinhua, “Reducing Burden on Coal Industry by Clearing Up Fees and Reforming Taxes” (煤炭行业减负 重在“清费”“正税”), reposted from Economic Daily (经济日报), March 21, 2013, http://news.xinhuanet.com/energy/2013-03/21/c_124485886.htm .
16. Xie Jiu, “Difficulties and the Way Forward in a World of RMB 8.00 Gasoline” (油价 “8元时代”的困局与出路). Life Week (三联生活), March 28, 2012, http://www.lifeweek.com .cn /2012/0328/36802.shtml (accessed December 2013).
17. Other studies, such as the Stern Review (Stern 2007), come up with higher estimates.
18. Kang Sun, “Atmospheric Ammonia and the Air Quality of the North China Plain,” Pr inceton Universit y, China Energy Group, http://www.princeton.edu/~puceg/ perspective/Atmospheric_Ammonia.html (accessed December 2013).
19. An example of a method of nesting differ-ent levels of resolution is the RAINS and GAINS models of the International Institute for Applied Systems Analysis (see, for exam-ple, “The RAIS 7.2 Model of Air Pollution: General Overview,” http://webarchive.iiasa
.ac.at /Research/TAP/rains_europe/intro
.html, accessed December 2013). The GAINS model can also be applied to combine co-benefits between local air pollution and greenhouse gas reductions (Liu, F., and others 2013).
20. This section draws extensively from Salat (2013).
21. This section draws from Ollivier and others (2013).
22. Wu Hongpo, “Wuhan trapped in public parking lots: 45 out of 70 are facing delays” (武汉公共停车场陷困局 70个项目45个“难产”), Chutian Jin Bao (楚天金报),7 March 2013, http://hb.qq.com/a/20130703/003378.htm (accessed June 2013).
23. Li Shaoyi, “With Traffic Jams in Bei-j i n g C o m e s H i g h L e ve l s o f Po l -l u t i o n f r o m Ve h i c u l a r E x h au s t ” ( 北 京 汽 车 尾气 污 染 严重:首 堵 伴 随 着 首毒). Di Yi Caijing Ribao (第一财经日报), ht tp: //f inance.sina.com.cn /ch ina /dfjj/20130116/011014295729.shtml. Jing Bao, “Vehicular Exhaust Accounts for 30% of Shenzhen’s PM2.5 Emissions” (汽车尾气占深圳PM2.5来源三成), http://news.sznews.com/content /2012-01/11 /content_6383292_2.htm.
24. North Central Texas Council of Govern-ments, “Regional Emissions Enforcement Program,” http://www.nctcog.org/trans/air /hevp/reeptx.asp (accessed December 2013).
25. European Automobile Manufacturers’ Asso-ciation, “ACEA Tax Guide 2012—More Governments Introduce Incentives,” 2012, http://www.acea.be/news/news_detail/tax_guide_2012_incentives_increase_further/ (accessed December 2013).
26. Hunts Point Clean Trucks Program, “Fre-quently Asked Questions,” http://www.hunts pointctp.com/faq.html#overview (accessed December 2013).
27. U.S. Green Building Council, “LEED for Neighborhood Development,” http://www .usgbc.org/neighborhoods.
28. Averages are based on reported performance statistics for 269 utilities in the International Benchmarking Network for Water and Sani-tation Utilities (IB-NET) database, http://www.ib-net.org/en/ (accessed August 9, 2013).
29. China’s cities treat an average of 108 mil-lion cubic meters of wastewater a day, as estimated according to the total volume of municipal wastewater that MOHURD reported being treated during the first quar-ter of 2012 (MOHURD 2012). Average

g r e e n U r b a n i z a t i o n 537
electricity consumption per cubic meter of wastewater treated is 0.254 kilowatt hours, based on a survey of more than 1,800 facili-ties conducted in 2009 (Liu and Jiang 2012). Assuming an average electricity price of RMB 0.78 per kWh (the average for industrial users in 36 medium and large sized cities in 2012 as reported by the NDRC’s Pricing Bureau). Cost savings are a gross, order-of-magnitude estimate intended to illustrate potential, not necessarily actual, room for improvement. Savings do not account for annualized costs of investments required to improve efficiency or for variations in climate, city, or plant characteristics that influence energy use per unit of wastewater treated.
30. This section draws from Taylor, Sall, and Draugelis (2013).
31. The “secondary sector” corresponds to ISIC divisions 10-45 in the International Stan-dard Industrial Classification system (ISIC Revision 3) and is composed of mining; manufacturing; construction; and electricity, water, and gas utilities. GDP is reported on a value-added basis. Urban industrial GDP and employment numbers reported here are for the 287 municipalities at the prefecture level. An “urban area” is the downtown area directly under the jurisdiction of the munici-pality and excludes outlying areas within the administrative boundaries of the municipality (NBS 2011b). The share of industry in GDP for urban areas in 2010 was slightly higher than the national average, which was 47 per-cent (NBS 2011a, 2011b).
32. Total industrial energy demand is projected to rise from around 1,500 million tons of coal equivalent (Mtce) in 2010 to around 2,500 Mtce in 2030, with industry continuing to be the largest end-user of energy in China’s economy (Fridley and others 2012; see also Zhou and others 2011).
33. From an administrative point of view, China has many different kinds of cities. The role of cities in the system of policies for industrial energy efficiency varies with their administra-tive rank. For the sake of discussion, the term “local city governments” is used in this sec-tion to refer mainly to cities at the prefecture level.
34. Xinhua, “Drawing the Bow on Coal Resource Tax Reform” (煤炭资源税改革箭在弦上), June 9, 2013, http://news.xinhuanet .com/energy/2013-06/09/c_124835728.htm (accessed December 2013).
35. Recommendations on policy coordination of carbon ETS, revenue recycling to finance
energy efficiency, and energy-related targets and caps benefited from written contributions by Max Dupuy, Regulatory Assistance Proj-ect, Beijing, May 2013.
36. See Goldberg, Reinaud, and Taylor (2011) for an analysis of policies adopted in different countries to promote EnMS.
37. Institute for Industrial Productivity, “China: Energy Management System Requirements under the Top-10,000 Program,” Industrial Efficiency Programs Database, http://www .iipnetwork.org/databases/programs/energy-management-system-requirements-under-top-10000-program (accessed August 7, 2013). See also Zhu (2012).
38. Despite the apparent improvements, Levine and others (2012, 103) note “there are uncer-tainties about the accuracy and representa-tiveness of MOHURD’s officially reported compliance rates.”
39. An alternative and competing green building rating system relative to the GBES in China is the Leadership in Energy and Environmental Design (LEED), an internationally recognized rating system originated in the Unied States. A comparison of the two rating systems indi-cates more similarities than differences and finds the GBES to be more rigorous (Levine and others 2012).
40. Team interview with U.S. Green Building Council senior staff, October 1, 2013.
41. This section draws on World Bank (2012b).42. Supplying gas for individual space and water
heating units in residences would require a larger supply. Estimates assume that per capita usage for households connected to gas remains about the same as in 2010. It is also assumed that once households are con-nected to piped town gas, they will stop using liquified propane gas (LPG). The number of households with access to LPG represents a substantial portion of the urban population in some southern cities in China, although LPG is typically more expensive and house-holds tend to favor piped natural gas. An annual growth rate in the percentage of the urban population with access to piped gas is assumed at 6 percent, slightly faster than the average rate of 3 percent observed between 2004 and 2010.
43. “Breaking the Ice on Natural Gas Pricing Reform” (天然气价改破冰), Caijing Magazine (财经杂志), January 3, 2012, http://magazine.caijing.com.cn/2012-01-03/111587947.html (accessed December 2013).
44. This section is derived from recent policy notes and other contributions from Xia-

538 U r b a n C h i n a
odong Wang, Senior Energy Specialist, World Bank; Ximing Peng, Senior Energy Specialist, World Bank; Yanqin Song, Energy Special- ist, World Bank; and Nourredine Ber-rah, retired World Bank staff and senior consultant.
45. See the Green Growth Chapter of China 2030 (World Bank–DRC 2013).
46. This section draws on Draugelis and Li (2012) and World Bank (2012a).
47. This section draws from Jiang and Li (2013).48. FAO, AQUASTAT, “China,” http://www
.fao.org/nr/water/aquastat/countries_regions /china/index.stm (accessed December 2014).
49. “China’s underground water in poor con-dition,” Gov.CN (Chinese Government’s Official Web Portal), May 10, 2012, http://english.gov.cn/2012-05/10/content_2134183 .htm.
50. This paragraph draws on Moore (2013) and World Bank (2012b).
51. See Qu and others 2012.52. The analysis was based on national statistical
data, individual utility financial statements, data provided by the China Water Supply Association, and previous analysis for up to 699 utilities. Because of data constraints, not all findings covered all these utilities.
53. Author’s interview with Zhou Nan and Lynn Price, Lawrence Berkeley National Laboratory, August 1, 2013; interview with Pedzi Makumbe, World Bank ESMAP, July 29, 2013.
54. Indeed, this problem is not unique to China, as Zhou and Williams (2013) have writ-ten in their extensive review of eco-city and low-carbon city concepts and indicators. For words of caution on the need to clarify low-carbon city goals in China, see Zhang Xuan, “200 Cities Propose Establishing Low-Carbon City Targets, Blind Development of Targets is a Risk” (200城市提出建设低碳城市目标 或陷盲目发展误区). People’s Daily (人民日报), June 11, 2012, http://npc.people .com.cn /GB/18138478.html (accessed December 2013); and “Li Xun: Concept Unclear, Many Low-Carbon Cities Are Only Low-Carbon in Name” (李迅:概念模糊 低碳城市多为伪低碳), Caijing Magazine (财经杂志), September 2, 2011,“ http://www .caijing.com.cn/2011-09-02/110838876.html (accessed December 2013).
55. World Bank ESMAP, “Tool for Rapid Assess-ment of City Energy: Helping Cities Use Energy Efficiently,” https://www.esmap.org /TRACE (accessed December 2013).
56. World Bank ESMAP, “Modeling Tools and E-Learning,” http://esmap.org/MACTool (accessed December 2013).
57. The State Council’s Approval of the 12th Five-Year Plan for Air Pollution Prevention and Control in Key Regions calls for “coordinated actions to control multiple pollutants” and “strengthening holistic management of multi-ple pollutants” (State Council 2012).
58. Zhou Nan and Lynn Price, Lawrence Berkeley National Laboratory, interview with author, August 1, 2013.
references2030 Water Resources Group (The Barilla Group,
The Coca-Cola Company, IFC, McKinsey & Co., Nestlé S.A, New Holland Agriculture, SABMiller, Standard Chartered Bank, and Syngenta AG). Charting Our Water Future: Economic Frameworks to Inform DecisionMaking. http://www.mckinsey.com/App_Media/Reports/Water/Charting_Our_Water_Future_Full_Report_001.pdf.
ADB (Asian Development Bank). 2008. Proj-ect Completion Report, Scoping Water and Energy Pollution Nexus in Urumqi and Qing-dao for Preparing PRC’s Ministry of Environ-mental Protection Co-Control Program, Asian Development Bank, http://www.adb.org/sites/default/files/Water-Energy-Nexus-Final Report_5.pdf.
Bell, M. L., D. L. Davis, and T. Fletcher, T. 2004. “A Retrospective Assessment of Mortality from the London Smog Episode of 1952: The Role of Influenza and Pollution.” Environmental Health Perspectives 112 (1): 6.
Bell, R. G., A. McDermott, S. L. Zeger, J. M. Samet, and F. Dominici. 2004. “Clearing the Air: How Delhi Broke the Logjam on Air Quality Reforms.” Environment 46: 22–39.
Berrah, N., F. Feng, R. Priddle, and L. Wang 2007. Sustainable Energy in China: Closing Window of Opportunity. Washington, DC: World Bank.
Bourdic, Loeiz. 2011. “Urban Density and Private Transport Energy Consumption: From Global Trends to Local Solutions.” MSc thesis, Impe-rial College, London.
Browder, G., S. Xie, Y. Kim, L. Gu, M. Fan, and D. Ehrhardt. 2007. Stepping Up: Improving the Performance of China’s Urban Water Utilities. Washington, DC: World Bank.
Cackette, Tom. 2013. “Commercializing ZEVs Based on California’s Experience.” Back-ground note for China: Efficient, Inclusive,

g r e e n U r b a n i z a t i o n 539
and Sustainable Urbanization, DRC and World Bank, Beijing.
Carbon Disclosure Project. 2012. “Measurement for Management: CDP Cities 2012 Global Report.” London, https://www.cdproject.net /cdpresults/cdp-cities-2012-global-report.pdf.
Chen, Y., A. Ebstein, M. Greenstone, and H. Li. 2013. “Evidence on the Impact of Sustained Exposure to Air Pollution on Life Expectancy from China’s Huai River Policy.” PNAS Proceedings of the National Academy of Science, http://www.pnas.org/cgi/doi/10.1073/pnas.1300018110.
Cheng, Zhen, Jingkun Jiang, Oscar Fajardo, Shuxiao Wang, and Jiming Hao. 2013. “Char-acteristics and Health Impacts of Particulate Matter Pollution in China (2001–2011).” Atmospheric Environment 65: 186–94.
Chien, Shiuh-Shen. 2013. “New Local State Power through Administrative Restructuring: A Case Study of Post-Mao China County-level Urban Entrepreneurialism in Kunshan.” Geoforum 46: 103–12.
China Electric Power Yearbook Committee. 2011. China Electric Power Yearbook 2011 (中国电力年鉴2011). Beijing: China Electric Power Press.
China Greentech Initiative. 2012. “The China Greentech Report 2012: Faced With Chal-lenges, China Accelerates Greentech Growth.” Beijing, China, http://www.china-greentech.com/report.
City of London. 2011. “Core Strategy: Devel-opment Plan Document, Delivering a World Class City.” City of London Corporation, Local Development Framework. http://www .cityoflondon.gov.uk/services/environment-and-planning/planning/planning-policy/local-development-framework/Documents/The%20Core%20Strategy%20September%202011 .pdf.
CNEMC (China National Environmental Moni-toring Center). 2013. “2013 Nian Shangban Nian Jingjinii, Changsantiao, Quyu Ji Zhe-hashi, Shenghui Chengshi He Jihua Danlie Shi Kongqi Zhiliang Baogao.” July 9, 2013. http://www.cnemc.cn.
Creutzig, Felix, and Dongquan He. 2009. “Climate Change Mitigation and Co-benefits of Feasible Transport Demand Policies in Bei-jing.” Transportation Research, Part D 14: 120–31.
Currie, J., and M. Neidell. 2005. “Air Pollution and Infant Health: What Can We Learn from California’s Recent Experience?” Quarterly Journal of Economics 120 (3): 1003–30.
Currie, J., and T. Vogl. 2012. “Early-Life Health and Adult Circumstance in Developing Coun-tries.” Working Paper w18371, National Bureau of Economic Research, Cambridge, MA.
Dickinson, J., J. Khan, D. Price, S. Caputo, Jr., and S. Mahnovski. 2012. “Inventory of New York City Greenhouse Gas Emissions, City of New York.” Mayor’s Office of Long-Term Planning and Sustainability, New York.
Draugelis, Gailius, and Shawna Fei Li. 2012. “Energy Efficiency in Buildings.” In Sustainable LowCarbon City Development in China, edited by Axel Baeumler, Ede Ijjasz-Vasquez, and Shomik Mehndiratta, 179–205. Washington, DC: World Bank.
Eaton, S., and G. Kostka. 2013. “Does Cadre Turnover Help or Hinder China’s Green Rise? Evidence from Shanxi Province.” In Chinese Environmental Policy: Dynamics, Challenges, and Prospects in a Changing Society, edited by Ren Bingqiang and Shou Shuisheng. London: Palgrave Macmillan Publishers.
———. 2014. “Authoritarian Environmentalism Undermined? Local Leaders’ Time Horizons and Environmental Policy Implementation.” China Quarterly, forthcoming.
Ebenstein, Avraham. 2012. “The Consequences of Industrialization: Evidence from Water Pollution and Digestive Cancers in China.” Review of Economics and Statistics 94 (1): 186–201.
EC (European Commission). 2011. “Roadmap to a Single European Transport Area: Towards a Competitive and Resource Efficient Transport System.” EC White Paper, COM(2011) 144 final, Brussels.
Economy, Elisabeth. 2010. The River Runs Black: The Environmental Challenge to China’s Future. Ithaca, NY: Cornell University Press.
Feng, Kuishuang, Steven J. Davis, Laixiang Sun, Xin Li, Dabo Guan, Weidong Liu, Zhu Liu, and Klaus Hubacek. 2013. “Outsourcing CO2 within China.” Proceedings of the National Academy of Sciences. http://www.pnas.org/cgi /doi/10.1073/pnas.1219918110.
Fisher-Vanden, Karen, Yong Hu, Gary Jefferson, and Michael Rock. 2013. “Factors Influencing Energy Intensity in Four Chinese Industries.” Policy Research Working Paper WPS6551, World Bank, Washington, DC.
Fisher-Vanden, Karen, and Sheila Olmstead. 2013. “Moving Pollution Trading from Air to Water: Potential, Problems, and Prognosis.” Journal of Economic Perspectives 27 (1): 147–72.
Francis, J. A., and S. J. Vavrus. 2012. “Evi-dence Linking Arctic Amplification to

540 U r b a n C h i n a
Extreme Weather in Mid‐lat itudes.” Geophysical Research Let ters 39 (6). doi:10.1029/2012GL051000.
Fridley, David, Nina Zheng, Nan Zhou, Jing Ke, Ali Hasanbeigi, Bill Morrow, and Lynn Price. 2012 “China Energy and Emissions Paths to 2030.” 2d ed. Report LBNL-4866E, Ernest Orlando Lawrence Berkeley National Labora-tory, Berkeley, California.
Fung, Freda, Hui He, Benjamin Sharpe, Fatumata Kamakaté. 2010. “Overview of China’s Vehi-cle Emission Control Program: Past Successes and Future Prospects” (中国机动车排放控制措施评估——成功经验与未来展望). Interna-tional Council of Clean Transportation, Bei-jing, http://www.theicct.org/sites/default/files /publications/Retrosp_final_bilingual.pdf.
Gayer, Ted, and Emily Parker. 2013. “Cash for Clunkers: An Evaluation of the Car Allowance Rebate System.” Brookings Institution, Wash-ington, DC.
Gerrard, P. 2004. “Integrating Wetland Ecosys-tem Values into Urban Planning: The Case of That Luang Marsh, Vientiane, Lao PDR.” IUCN−The World Conservation Union Asia Regional Environmental Economics Pro-gramme and WWF Lao Country Office, Vientiane. http://www.mekongwetlands.org/Common/download/WANI_economics_That-Luang%20Marsh.pdf.
GIZ (German Agency for International Coop-eration). 2013. “International Fuel Prices 2012/2013.” Federal Ministry for International Cooperation and Development, Eschborn.
Goldberg, Amélie, Julia Reinaud, and Robert Taylor. 2011. “Promotion Systems and Incen-tives for Adoption of Energy Management Sys-tems in Industry.” Institute for Industrial Pro-ductivity, Washington, DC.
Graff Zivin, J., and M. Neidell. 2012. “The Impact of Pollution on Worker Productivity.” American Economic Review 102: 3652–73.
Grubb, Michael. 2012. “Strengthening the EU ETS: Creating a Stable Platform for EU Energy Sector Investment.” Climate Strate-gies, London. http://www.climatestrategies.org /research/our-reports/category/60/343.html.
Grubler, Amulf, and David Fisk, eds. 2013. Energizing Sustainable Cities: Assessing Urban Energy. New York: Routledge.
Guo, Maxia, Fang Yu, Dong Cao, and Kunyu Niu. 2012. “Calculation of Agricultural Non-Point Source Pollution Emissions in China and Long-Term Forecast (中国农业面源污染排放量计算及中长期预测).” Acta Scientiae Circumstantiae (环境科学学报) 32 (2): 489–97.
HEI (Health Effects Institute). 2013. “Outdoor Air Pollution among Top Global Health Risks in 2010: Risks Especially High in Developing Countries in Asia.” Press release, December 13, HEI, Boston, http://www.healtheffects .org/International/GBD-Press-Release.pdf.
Hildebrandt, Timothy. 2011. “The Political Econ-omy of Social Organization Registration in China.” China Quarterly 208: 970–89.
Ho, Mun S., and Dale Jorgenson. 2003. “Air Pol-lution in China: Sector Allocation of Emissions and Health Damages.” http://people.hmdc.harvard.edu/~mho/CCICED.report1.pdf.
Hong, Lixuan, Jinshe Liang, Jianming Cai, and Li Zhuang. 2011. “Growth of Industrial Energy Consumption in China’s Prefecture-Level Cit-ies Based on Data from 2001–2006” (中国地级以上城市工业能源消费的增长—— 基于 2001~ 2006 年的数据分解). Geographical Research (地理研究) 30 (1): 83–93.
Hoornweg, Daniel, and Perinaz Bhada-Tata. 2012. “What a Waste: A Global Review of Solid Waste Management.” Urban Develop-ment Series Knowledge Paper 15. World Bank, Washington, DC.
Huang, Shukui, and Jiawu Wang. 2010. “Some Discussion on Problems about Standard of Civil Building Indoor Environment Pollution Control and Standard of Indoor Air Quality.” (《民用建筑工程室内环境污染控制规范》及《室内空气质量标准》有关问题的探讨). Construction Quality (工程质量) 28 (5): 61–63.
Hutchinson, David, Yutaka Tonooka, Akiyoshi Kannari, Yuko Nishida, and David Vowles. 2004. “Air Quality in London and Tokyo: A Comparison.” 13th World Clean Air and Envi-ronmental Protection Congress and Exhibi-tion, London, August 22–27.
ICLEI USA (Local Governments for Sustain-ability USA) and City of New York. 2010. “The Process Behind PlaNYC: How the City of New York Developed its Comprehensive Long-term Sustainability Plan.” Report for The Mayor’s Office of Long-Term Planning and Sustainability, City of New York. http://ny telecom.vo.llnwd.net/o15/agencies/planyc2030 /pdf/iclei_planyc_case_study_201004.pdf.
James, Chris, and Rebecca Shultz. 2011. “Climate-Friendly Air Quality Management: Strategies for Control.” Policy note, Regula-tory Assistance Project (RAP), Montpelier, VT.
Jiang, Liping, and Xiaokai Li. 2013. “Water Resources and Pol lut ion I s sues and Recommendations.”Background note for China: Efficient, Inclusive, and Sustainable Urbanization, DRC and World Bank, Beijing.

g r e e n U r b a n i z a t i o n 541
Jin, Yanhong, Hua Wang, and David Wheeler. 2010. “Environmental Performance Rating and Disclosure: An Empirical Investigation of China’s Green Watch Program.” Policy Research Working Paper 5420, World Bank, Washington, DC.
Jones, Holly, David Hole, and Erika Zavaleta. 2012. “Harnessing Nature to Help People Adapt to Climate Change.” Nature Climate Change 2: 504–09.
Kahrl, F., Junfeng Hu, Gabe Kwok, and James Williams. 2013. “Strategies for Expand-ing Natural Gas-fired Electricity Generation in China: Economics and Policy.” Energy Strategy Reviews. http:dx.doi.org/10.1016/j .esr.2013.04.006.
Kaiser, Todd, and Rongkun Liu. 2009. “Tak-ing the Pulse: The One-Year Anniversary of China’s Open Government Information Mea-sures.” China Environmental Health Project Research Brief, China Environment Forum and Western Kentucky University.
Kostka, Genia. 2013. “Barriers to the Implemen-tation of Environmental Policies at the Local Level in China.” Background note for China: Efficient, Inclusive, and Sustainable Urbanization, DRC and World Bank, Beijing.
———. 2014. “China’s Evolving Green Planning System: Are Targets the Answer?” Working Paper 202, Department of Economics, Frankfurt School of Finance and Management, Frankfurt, Germany.
Kostka, Genia, and William Hobbs. 2012. “Local Energy Efficiency Policy Implementation in China: Bridging the Gap between National Pri-orities and Local Interests.” China Quarterly 211: 765–85.
Kostka, G., and X. Yu. 2014. “Career Back-grounds of Municipal Party Secretaries: Why Do So Few Municipal Party Secretaries Rise from the County Level?” Modern China, forthcoming.
Larsson, S. 2008. “Data and Indicators for Road Freight Transport.” Presentation at New Energy Indicators for Transport conference, Paris, January 28–29.
Lees, Eion. 2012. “Energy Efficiency Obliga-tions—The EU Experience.” European Council for an Energy-Efficient Economy, Stockholm.
Lei, Y., Q. Zhang, K. B He, and D. G. Streets. 2011. “Primary Anthropogenic Aerosol Emis-sion Trends for China, 1990–2005.” Atmospheric Chemistry and Physics 11 (3): 931–54.
Levine, M., S. de la Rue de Can, N. Zheng, and C. Williams. 2012. “Building Energy-Energy Effi-ciency Best Practice Policies and Policy Pack-
ages.” Lawrence Berkeley National Laboratory report LBNL-6006E, Berkeley, California, http://eaei.lbl.gov/sites/all/files/GBPN_Final.Oct_.2012.pdf.
Li, Fangyi, Weidong Liu, and Hongguang Liu. 2011. “Interregional Virtual Water Trade Model and its Application in Shanxi Prov-ince.” (区域间虚拟水贸易模型及其在山西省的应用). Resources Science (资源科学) 34 (5), doi: CNKI:11-3868/N.20111202.1026.009.
Li, Jia, Voravate Tuntivate, Lan Wang, and Feng Liu. 2009. “Energy Efficiency Policy in the Cement Sector: A Study of the Impacts of Vertical Shaft Kiln Plants Closings.” Report for Asia Sustainable and Alternative Energy Program, World Bank, Beijing.
Li, Jing-guang. 2010. “Discussion on Construc-tion of Chinese Indoor Air Quality Standard System” (我国室内空气质量标准体系建设的思考). Building Science (建筑科学) 26 (4): 1–7.
Li, Shanjun and Chao Wei. 2013. “The Cost of Greening Stimulus: A Dynamic Discrete Analysis of Vehicle Scrappage Programs.” Working paper, George Washington Uni-versity, Washington, DC. http://home.gwu .edu/~cdwei/GreenStimulus_Li&Wei_2013 .pdf.
Li, Terry H. Y., S. Thomas Ng, and Martin Skit-more. 2012. “Public Participation in Infra-structure and Construction Projects in China: From an EIA Based to a Whole-cycle Process.” Habitat International 36 (1): 47–56.
Li, W., and P. Higgins. 2013. “Controlling Local Environmental Performance: An Analysis of Three National Environmental Management Programs in the Context of Regional Dis-parities in China.” Journal of Contemporary China 22 (81): 409–27.
Lin, Boqiang, and Zhujun Jiang. 2011. “Estimates of Energy Subsidies in China and Impact of Energy Subsidy Reform.” Energy Economics 33: 273–82.
Lin, Boqiang, and Jianghua Liu. 2011. “Principles, Effects and Problems of Differential Power Pricing Policy for Energy Intensive Industries in China.” Energy 36: 111–18.
Lin, Tun, Canfa Wang, Yi Chen, Trisa Camacho, and Fen Lin. 2009. “Green Benches: What Can the People’s Republic of China Learn from Environment Courts of Other Countries?” Asian Development Bank, Manila.
Liu, F., Z. Klimont, Q. Zhang, J. Cofala, L. J. Zhao, H. Huo, B. Nguyen, W. Schöpp, R. Sander, B. Zheng, C. P. Hong, K. B. He, M. Amann, and C. Heyes. 2013. “Integrat-ing Mitigation of Air Pollutants and Green-

542 U r b a n C h i n a
house Gases in Chinese cities: Development of GAINS-City model for Beijing.” Journal of Cleaner Production 58: 25–33.
Liu, Jieling, and Wenju Jiang. 2012. “Analysis of Energy Consumption of Municipal Sew-age Plant and Measures of Energy Saving” (城市污水处理厂能耗分析及节能措施). Journal of Green Science and Technology (绿色科技) (November): 136–37.
Liu, W. W., Y. P. Zhang, Y. Yao, and others. 2012. “Indoor Decorating and Refurbishing Materi-als and Furniture Volatile Organic Compounds Emission Labeling Systems: A Review.” Chinese Science Bulletin 57: 2533–43.
Liu, X., Y. Zhang, W. Han, A. Tang, J. Shen, Z. Cui, and others. 2013. “Enhanced Nitrogen Deposition over China.” Nature 494: 459–62.
Lorentzen, Peter, Pierre Landry, and John Yasuda. 2014. “Undermining Authoritarian Innova-tion: The Power of China’s Industrial Giants.” Journal of Politics 76(1): 182–94.
Lu, Z., D. G. Streets, Q. Zhang, S. Wang, G. R. Carmichael, Y. F. Cheng, and Q. Tan. 2010. “Sulfur Dioxide Emissions in China and Sulfur Trends in East Asia since 2000.” Atmospheric Chemistry and Physics 10 (13): 6311–31.
Lund, H., R. Cervero, and R. W. Wilson. 2004. “Travel Characteristics of Transit-Oriented Development in California.” Report for Bay Area Rapid Transit District and California Department of Transportation, Sacramento.
Ma, Linwei, Julian Allwood, Jonathan Cullen, and Zheng Li. 2012. “The Use of Energy in China: Tracing the Flow of Energy from Primary Source to Demand Drivers.” Energy 40: 174–88.
Mao Yushi, Hong Sheng, and Fuqiang Yang. 2008. “The True Cost of Coal.” Greenpeace East Asia, The China Sustainable Energy Pro-gram, and World Wildlife Fund, Beijing.
Mao, L., H. Zhu, and L. Duan. 2012. “The Social Cost of Traffic Congestion and Coun-termeasures in Beijing. Sustainable Transportation Systems, pp. 68–76. American Society of Civil Engineers, http://dx.doi .org/10.1061/9780784412299.0010.
Matus, Kira, Kyung-Min Namb, Noelle E. Selin, Lok N. Lamsal, John M. Reilly, and Sergey Paltsev. 2012. “Health Damages from Air Pollution in China.” Global Environmental Change 22: 55–66.
Mayor of London. 2007. “Action Today to Pro-tect Tomorrow: The Mayor’s Climate Change Action Plan, Greater London Authority.” http:// legacy.london.gov.uk/gla/publications /environment.jsp.
MEP (Ministry of Environmental Protection). 2008–13. Report on the State of the Environment (环境状况公报). http://jcs.mep.gov.cn /hjzl/zkgb/.
———. 2012b. “MEP Publishes 2012 Annual Report on Vehicular Emissions Control” (环境保护部发布2012年中国机动车污染防治状况). http://www.mep.gov.cn/gkml/hbb/qt/201212 /t20121227_244340.htm.
MIT-Tsinghua-EF (Massachusetts Institute of Technology, Tsinghua University, and Energy Foundation). 2011. “Designing Clean Energy Cities: New Approaches to Urban Design and Energy Performance.” Joint report for “Clean Energy City” in China project, Cambridge, MA., and Beijing.
MOHURD (Ministry of Housing and Urban Development, PRC). 2012. 12th Five Year Plan for Building Energy Efficiency (关于印发 “十二五” 建筑节能专项规划的通知). Jian Ke 72, http://www.gov.cn/zwgk/2012-05/31 /content_2149889.htm.
Moore, Scott. 2013. “Water Resource Issues, Policy and Politics in China.” Brookings Institution issue brief, February 12. http://www.brookings.edu/research/papers/2013/02 /water-politics-china-moore#_edn2.
Moskovitz, David, Lin Jiang, Frederick Weston, Fuqiu Zhou, Shujie Liu, Zhaoguang Hu, and Cong Yu. 2007. “TA 4706-PRC: Energy Conservation and Resource Management Project, Part A Final Report.” Report to Asian Development Bank, Beijing, July.
Müller, D. B., G. Liu, A. N. Lovik, R. Modaresi, S. Pauliuk, F. S. Steinhoff, and H. Brattebo. 2013. “Carbon Emissions from Infrastructure Development.” Environmental Science and Technology 47 (20): 11739–46.
NBS (National Bureau of Statistics, China). 2007a–2013a. China Statistical Yearbook (中国统计年鉴). Beijing: China Statistics Press.
———. 1991b–2011b. China Statistical Yearbook of Cities (中国城市统计年鉴). Beijing: China Statistics Press.
———. 2000c–2012c. China Statistical Yearbook of Energy (中国能源统计年鉴). Beijing: China Statistics Press.
———. 2005d–2012d. China Statistical Yearbook of Prices of Goods (中国物价统计年鉴). Beijing: China Statistics Press.
NDRC (National Development and Reform Com-mission, China). 2011. “Significant Progress Made in Energy Conservation and Emissions Reductions—A Look Back at the Energy Con-servation and Emissions Reduction Accom-plishments of the 11th Five Year Plan, Part I”

g r e e n U r b a n i z a t i o n 543
(节能减排取得显著成效——“十一五”节能减排回顾之一). NDRC news release. Beijing. http://www.sdpc.gov.cn/xwfb/t20110927_435642.htm.
———. 2012. “List of Enterprises and Energy Savings Targets for Top 10,000 Enterprise Energy Conservation and Emissions Reduc-tion Program” (“万家企业节能低碳行动”企业名单及节能量目标), NDRC public notice 10, May 12.
———. 2013. “National Government Adjusts Refined Petroleum Product Prices Downward and Issues Plan for Improving Pricing Mecha-nism” (国家下调成品油价格 同步出台价格机制完善方案), March 26. http://www.ndrc.gov.cn /xwfb/t20130326_534062.htm.
Nielsen, Chris P., and Mun S. Ho. 2007. “Sum-mary for Policy.” In Clearing the Air: The Health and Economic Damages of Air Pollution in China, edited by Ho and Nielsen, 51–66. Boston: MIT Press.
NRC (National Research Council, United States). 2010. Hidden Costs of Energy: Unpriced Consequences of Energy Production and Use. Washington, DC: National Academies Press.
NRC Committee on Air Quality Management in the United States. 2004. Air Quality Management in the United States. Washington, DC: National Academies Press.
Nygard, J., and U. Deichmann. 2013. “Air Qual-ity Management in China.” Background note for China: Efficient, Inclusive, and Sustainable Urbanization, DRC and World Bank, Beijing.
OECD (Organisation for Economic Co-operation and Development). 2009. OECD Factbook 2009. Paris: OECD. http://dx.doi.org/10.1787 /factbook-2009-en.
Okubo, Yasushi. 2013. “Mt. Fuji Lovers Get Bonus with More Days to See It from Tokyo.” Asahi Shimbun, February 25, http://ajw .asahi.com/article/behind_news/social_affairs /AJ201302250003 .
Ollivier, G., B. Reja, Runze Yu, Qu Li, and Yu Qin. 2013. “Sustainable Mobility: How Will China Meet the Transport Demand of a Green and Low Carbon Urbanization?” Background note for China: Efficient, Inclusive, and Sustainable Urbanization, DRC and World Bank, Beijing.
Olmstead, Sheila M. 2010a. “The Economics of Managing Scarce Water Resources.” Review of Environmental Economics and Policy 4 (2): 179–98.
———. 2010b. “The Economics of Water Qual-ity.” Review of Environmental Economics and Policy 4 (1): 44–62.
Padula, Amy M., Ira B. Tager, Suzan L. Car-michael, S. Katharine Hammond, Frederick Lurmann, and Gary M. Shaw. 2013. “The Association of Ambient Air Pollution and Traffic Exposures With Selected Congenital Anomalies in the San Joaquin Valley of Cali-fornia.” American Journal of Epidemiology 177 (10): 1074–85.
Parry, Ian W., and Kenneth A. Small. 2009. “Should Urban Transit Subsidies Be Reduced? American Economic Review 99 (3):700–24.
Peng, Ximing. 2012. “Low Carbon Electricity for Cities.”In Sustainable LowCarbon City Development in China, edited by Axel Baeum-ler, Ede Ijjasz-Vasquez, and Shomik Mehndi-ratta, 131–47. Washington, DC: World Bank.
Peters, G. P., J. C. Minx, C. L. Weber, and O. Edenhofer. 2011. “Growth in Emission Transfers via International Trade from 1990 to 2008.” Proceedings of the National Academy of Sciences 108 (21): 8903–08.
Porter, C. D., A. Brown, R. T. Dunphy, and L. Vimmerstedt. 2013. “Transportation Energy Futures Series: Effects of the Built Environment on Transportation: Energy Use, Greenhouse Gas Emissions, and Other Fac-tors.” Report DOE/GO-102013-3703 by the National Renewable Energy Laboratory, Golden, CO, and Cambridge Systematics, Inc., Cambridge, MA, for the U.S. Department of Energy, Washington, DC.
Postel, Sandra, and Barton Thompson, Jr. 2005. “Watershed Protection: Capturing the Benefits of Nature’s Water Supply Services.” Natural Resources Forum 29: 98–108.
Proost, Stef, and Kurt van Dender. 2011. “What Long-term Road Transport Future? Trends and Policy Options.” Review of Economics and Policy 5 (1): 44–65.
Qu, Weidong, Weiwei Zheng, Shu Wang, and Youfa Wang. 2012. “China’s New National Standard for Drinking Water Takes Effect.” Lancet 380 (9853): doi:10.1016 /S0140-6736(12)61884-4.
RAP (Regulatory Assistance Project). 2013. “Rec-ommendations for Power Sector Policy in China: Practical Solutions for Energy, Climate and Air Quality.” RAP policy report, Beijing, October. http://www.raponline.org/document /download/id/6869.
Ren, Yong. 2000. “Japanese Approaches to Envi-ronmental Management: Structural and Insti-tutional Features.” International Review for Environmental Strategies 1 (1) :79–96.

544 U r b a n C h i n a
Renmin University. 2013. 3E datasets (Economy, Energy and Environment). http://www.3edata .com.
Ruggeri Laderchi, Caterina, Anne Olivier, and Chris Trimble. 2013. Balancing Act: Cutting Energy Subsidies While Protecting Affordability. Washington, DC: World Bank.
Salat, Serge. 2012. Cities and Forms: On Sustainable Urbanism. Paris: Hermann.
———. 2013. “Chinese Urban Forms and Energy.” Background paper for China: Efficient, Inclusive, and Sustainable Urbanization, DRC and World Bank, Beijing.
Sall, Chris, and Katrina Brandon. Forthcoming. “Developing Policies for Ecosystem-Based Adaptation in China.” Sustainable Develop-ment Discussion Paper Series, East Asia and Pacific Region, World Bank, Washington, DC.
Salzman, J. 2009. “A Policy Maker’s Guide to Designing Payments for Ecosystem Ser-vices.” Report for Asian Development Bank, Manila. http://scholarship.law.duke.edu /faculty_scholarship/2081/.
Song, Y., and N. Berrah. 2013. “West or East Wind: Getting the Incentives Right.” Policy Research Working Paper 6486, World Bank, Washington, DC.
State Council. 2012. State Council Approval of 12th Five Year Plan for Prevention and Control of Air Pollution in Key Regions (国务院关于重点区域大气污染防治“十二五”规划的批复), Guo Han 146. http://www.mep.gov.cn/gkml /hbb/bwj/201212/W020121205566730369875 .pdf.
———. 2013. State Council Notice Regarding Circulation of NDRC and MOHURD Green Building Action Plan (国务院办公厅关于转发发展改革委住房城乡建设部绿色建筑行动方案的通知), Guo Ban 1. http://www.gov.cn /zwgk/2013-01/06/content_2305793.htm.
State Grid Corporation of China. 2011. “2010 China Power Market Electricity Trading Report” (2010年电力市场交易年报). SGCC, Beijing. http://service.sgcc.com.cn/dljynb /index.shtml.
Stern, Nicholas. 2007. The Economics of Climate Change: The Stern Review. Cambridge, UK: Cambridge University Press.
Stern, Rachel E. 2011. “From Dispute to Decision: Suing Polluters in China.” China Quarterly 206: 294–312.
Sugar, L., C. Kennedy, and E. Leman. 2012. “Greenhouse Gas Emissions from Chinese Cities.” Journal of Industrial Ecology 16 (4): 552–63.
Sun Xiaoliang, Zhu Lin, and Bob Taylor. 2011. “China’s ESCO Industry: Saving More Energy
Every Day through the Market.” http://ryanschuchard.files.wordpress.com/2011/06 /chinas-esco-industry-2010.pdf.
Tan, Yelin. 2012. “Transparency without Democ-racy: The Unexpected Effects of China’s Envi-ronmental Disclosure Policy.” Governance. doi:10.1111/gove.12018.
Taylor, Robert. 2013. “Energy Efficiency Resource Acquisition Programs: A Market-Based Approach for Effectively Using Public Funds for Energy Efficiency.” Institute for Industrial Productivity, Washington, DC.
Taylor, Robert, Gailius Draugelis, Yabei Zhang, and Albert Ang Co. 2010. “Accelerating Energy Conservation in China’s Provinces.” Report 56416, World Bank, Washington, DC. http://www-wds.world bank.org/external /default/WDSContentServer/WDSP/IB/2010/09/01/000333038_20100901232632/ Rendered/PDF/564160ESW0whit1in0China 1s0Provinces.pdf.
Taylor, Robert, Chris Sall, and Gailius Draugelis. 2013. “Industrial Energy Efficiency.” Back-ground note for China: Efficient, Inclusive, and Sustainable Urbanization, DRC and World Bank, Beijing.
Taylor, Robert, Dan Trombley, and Julia Reinaud. 2012. “Energy Efficiency Resource Acquisition Program Models in North America.” Institute for Industrial Productivity, Washington, DC.
THUBERC (Tsinghua University Building Effi-ciency Research Center). 2013. Annual Report on the Development of Building Energy Efficiency in China 2013 (中国建筑节能年度发展研究报告2013). Tsinghua.
UBA (Federal Environment Agency, Germany). 2011. Environmentally Harmful Subsidies in Germany—Update 2010. Dessau-Roßblau: UBA.
van Rooij, B., and C. W. H. Lo. 2010. Fragile Convergence: Understanding Variation in the Enforcement of China’s Industrial Pollution Law. Law & Policy 32 (1): 14–37.
van Wilgen, B. W., R. M. Cowling, and C. J. Burgers. 1996. “Valuation of Ecosystem Ser-vices.” BioScience 46 (3): 184–89.
Viard, Brian, and Shihe Fu. 2013. “The Effect of Beijing’s Driving Restrictions on Pollution and Economic Activity.” Social Science Research Network working paper. http://papers.ssrn.com/sol3/papers.cfm?abstract_id=1917110.
Walsh, Michael. 2006. “How to Reduce Air Pollu-tion with Cleaner Fuels and Cleaner Vehicles.” Presentation at 14th Session of UN Commis-sion for Sustainable Development, New York, May. http://walshcarlines.com/mpwdocs.html.

g r e e n U r b a n i z a t i o n 545
Wang, H., D. Wheeler, and Y. Jin. 2010. “Envi-ronmental Performance Rating and Disclosure: An Empirical Investigation of China’s Green Watch Program.” Policy Research Working Paper 5420, World Bank, Washington, DC.
Wang, H., R. Zhang, M. Liu, and J. Bi. 2012. “The Carbon Emissions of Chinese Cities.” Atmospheric Chemistry and Physics 12: 6197–206.
Wang, X., N. Berrah, and X. Peng. 2012. “Energy Sector Background Note.” Background note for China: Efficient, Inclusive, and Sustainable Urbanization, DRC and World Bank, Beijing.
Wang, X.S, L. Song, and R.Y. Bai Runying. 2013. “Energy Consumption Evaluation and Carbon Emission Analysis for Municipal Wastewater Treatment Plants in Hohot City” (呼和浩特地区污水厂能耗评价与碳排放分析). Environmen-tal Science and Technology (环境科学与技术) 36, no. 2: 196–199.
Weber, C. L., G. P. Peters, D. Guan, and K. Hubaceck. 2008. “The Contribution of Chinese Exports to Climate Change.” Energy Policy 36: 3572–77.
Wen, K., and E. Zhu. 2013. Annual report on BeijingTianjinHebei Metropolitan Region Development 2013. Beijing: Social Sciences Academic Press.
WHO (World Health Organization). 2010. WHO Guidelines for Indoor Air Quality: Selected Pollutants. Copenhagen: WHO Regional Office for Europe.
World Bank. World Development Indicators data-base. http://data.worldbank.org.
———. 1997. Clear Water, Blue Skies: China’s Environment in the New Century. Washing-ton, DC: World Bank.
———. 2009. “China: Social Analysis of Heating Reforms in Liaoning Province.” Asia Sustain-able and Alternative Energy Program, Energy Sector Management Assistance Program, World Bank, Washington, DC.
———. 2011a. “China Air Pollution Management Project—Particulate Matter Control: Com-ponent 1: Development of a Particulate Mat-ter Compliance Plan for China.” Draft final report, World Bank, Washington, DC, July.
———. 2011b. “China Air Pollution Manage-ment Project—Particulate Matter Control: Component 2: An Air Quality Management Program for PM10 Reduction in 3 Cities in Shanxi Province.” Draft final report, World Bank, Washington, DC, July.
———. 2012a. “China: Enhancing the Institu-tional Model for District Heating Regula-tion—Outside Perspectives and Suggestions.”
Energy Sector Management Assistance Pro-gram (ESMAP) report, World Bank, Washing-ton DC.
———. 2012b. “China: Improving Energy Effi-ciency in Public Institutions.” Energy Sector Management Assistance Program (ESMAP) report, World Bank, Washington DC.
———. 2012c. “Towards a More Effective Oper-ational Response:Arsenic Contamination of Groundwater in South and East Asian Coun-tries.” World Bank, Washington, DC.
———. 2013a. “China: Accelerating Household Access to Clean Cooking and Heating.” East Asia and Pacific Clean Stove Initiative Series, World Bank, Washington, DC.
———. 2013b. “China Country Water Resources Partnership Strategy (2013–2020).” World, Bank, Washington, DC.
World Bank–DRC (World Bank and State Council Development Research Center). 2013. China 2030: Building a Modern, Harmonious, and Creative Society. Washington, DC: World Bank.
World Bank ESMAP (Energy Sector Manage-ment Assistance Program). 2013. “Applying Abatement Cost Curve Methodology for Low-Carbon Strategy in Changning District, Shang-hai.” Asia Sustainable and Alternative Energy Program report, ESMAP, World Bank, Beijing.
World Bank–MEP (Ministry of Environmental Protection, PRC). 2012. “Integrated Air Pol-lution Management in China: Developing Par-ticulate Matter Control.” World Bank, Wash-ington, DC.
World Bank–SEPA (State Environmental Protec-tion Agency, PRC). 2007. Cost of Pollution in China: Economic Estimates of Physical Damages. Washington, DC: World Bank.
World Bank, Shanxi Environmental Protection Bureau, and Xinjiang Environmental Protec-tion Bureau. 2012, “Integrated Air Pollution Management in Chinese Cities: Proposed Particulate Matter Control in Taiyuan, Lishi, Xiaoyi and Urumqi,” seminar edition. World Bank, Washington, DC, June.
Wu, F. 2013. “Environmental Activism in Provin-cial China.” Journal of Environmental Policy and Planning 15 (1): 89–108.
Wu, Jing, Yongheng Deng, Jun Huang, Randall Morck, and Bernard Yeung. 2013. “Incentives and Outcomes: China’s Environmental Policy.” Working Paper 18754, National Bureau of Economic Research, Cambridge, MA.
Xinhua. 2009 “Full Text of Petroleum Pric-ing Administrative Rules.” May 8. http://news.xinhuanet.com/fortune/2009-05/08 /content_11336876.htm.

546 U r b a n C h i n a
———. 2013. “Atmospheric Pollution Prevention and Control Action Plan (Authorized Release)” [(授权发布) 大气污染防治行动计划]. September 12. http://news.xinhuanet.com/politics/2013-09/12/c_117349304.htm.
Yang, Lingbo, Siyu Zeng, Ningping Ju, Miao He, and Jining Chen. 2008. “Statistical Analysis and Quantification of China Urban Wastewa-ter Treatment Plant Energy Usage Patterns” (我国城市污水处理厂能耗规律的统计分析与定量
识别) Water and Wastewater Engineering (给水排水) 34 (10): 42–45.
Yang, L. X., X. H. Zhou, Z. Wang, Y. Zhou, S. H. Cheng, P. J. Xu, X. M. Gao, W. Nie, X. F. Wang, and W. X. Wang. 2012. “Airborne Fine Particulate Pollution in Jinan, China: Concen-trations, Chemical Compositions, and Influ-ence on Visibility Impairment.” Atmospheric Environment 55: 506–14.
Yang, Ming. 2010. “Energy Efficiency Improv-ing Opportunities in a Large Chinese Shoe- Making Enterprise.” Energy Policy 38: 452–62.
Zhang, Hongliang, Jingyi Li, Qi Ying, Jianzhen Yu, Dui Wu, Yuan Cheng, Kebin He, and Jingkun Jiang. 2012. “Source Apportionment of PM2.5 Nitrate and Sulfate in China Using a Source-Oriented Chemical Transport Model.” Atmospheric Environment 62: 228–42.
Zhang Liang. 2012. “Electricity Pricing in a Partial Reformed Plan System: The Case of China.” Energy Policy 43: 214–25.
Zhang, Minchun, and Bao Zhang. 2012. “Specialized Environmental Courts in China: Status Quo, Challenges and Responses.” Journal of Energy & Natural Resources Law 30 (4): 361–90.
Zhang, Y., A. J. Dore, L. Ma, X. J. Liu, W. Q. Ma, J. N. Cape, and F. S. Zhang. 2010. “Agri-cultural Ammonia Emissions Inventory and Spatial Distribution in the North China Plain.” Environmental Pollution 158 (2): 490–501.
Zhang Yinping, Jinhan Mo, and Charles Weschler. 2013. “Reducing Health Risks from Indoor Exposures in Rapidly Developing Urban China.” Environmental Health Perspectives. http://dx.doi.org/10.1289/ehp.1205983.
Zhao, Tongqian, Zhiyun Ouyang, Liangqing Jia, and Hua Zheng. 2004. “Assessment of the Indirect Value of China’s Grassland Ecosystem Services” (中国草地生态系统服务功能间接价值
评价).” Acta Ecologica Sinica 24 (6) 1101–10.Zhao, Y. 2010. “Public Participation in China’s
EIA Regime: Rhetoric or Reality? Journal of Environmental Law 22 (1): 89–123.
Zhao, Zhengquan, Dong Xu, Hao Zhang, Zheng-bin Sun, Huihui Yang, and Yuan Zhou. 2010. “Power Consumption of Wastewater Treat-ment and the Measures of Energy Saving” (中国污水处理电耗分析和节能途径). Science and Technology Review (科技导报) 28 (22): 43–47.
Zheng, Siqi, Matthew E. Kahn, Weizeng Sun and Danglun Luo. 2013. “Incentivizing China’s Urban Mayors to Mitigate Pollution Externali-ties: The Role of the Central Government and Public Environmentalism.” Research Working Paper 18872, National Bureau of Economic, Cambridge, MA.
Zhou, Nan, David Fridley, Michael McNeil, Nina Zheng, Jing Ke, and Mark Levine. 2011. “China’s Energy and Carbon Emissions Out-look to 2050.” Lawrence Berkeley National Lab, Berkeley, CA.
Zhou, Nan, and Christopher J. Williams. 2013. “An International Review of Eco-City The-ory, Indicators, and Case Studies.” Lawrence Berkeley National Laboratory report LBNL-6513, Berkeley, CA.
Zhu, Hui. 2012. “Experience of Shandong Prov-ince in Establishing Energy Management Sys-tems.” Presentation at IIP Second International Workshop on Energy Management Systems, Dezhou, Shandong, November 19.
Annex 7B referencesBAAQMD (Bay Area Air Quality Manage-
ment District). 2010. “Bay Area 2010 Clean Air Plan.” Plan adopted by BAAQMD, San Francisco, California, United States. http://www.baaqmd.gov/Divisions/Planning-and-Research/Plans/Clean-Air-Plans.aspx.
Broersma S., M. Fremouw, A. van den Dobbels-teen, and R. Rovers. 2010. “Warmtekaarten—Nederlandse warmtekarakteristieken in kaart gebracht.” TU Delft, Faculty of Architecture, Netherlands.
Fridley, David, Nina Zheng, and Zhou Nan. 2012. “Urban RAM: Assessing the Energy Impact of Having People in Cities.” American Council for an Energy-Efficient Economy Sum-mer Study on Energy Efficiency in Buildings, Pacific Grove, CA.
He Gang, Zhou Nan, Christopher Williams, and David Fridley. 2013. “ELITE Cities: A Low-carbon Eco-city Evaluation Tool for China” ECEEE 2013 Summer Study, June, http: //proceedings.eceee.org /visabstrakt .php?event=3&doc=3-399-13.Hildebrandt, T., 2011. The political economy of social organi-

g r e e n U r b a n i z a t i o n 547
zation registration in China, The China Quarterly, 208, 970–989.
ICLEI-NYC (Local Governments for Sustain-ability USA and The Mayor’s Office for Long-Term Planning and Sustainability, City of New York). 2010. “The Process Behind PlaNYC: How the City of New York Devel-oped Its Comprehensive Long-term Sustain-ability Plan.” ICLEI and City of New York, April 2010. http://nytelecom.vo.llnwd.net/o15 /agencies/planyc2030/pdf/iclei_planyc_case_study_201004.pdf.
James, Chris, and Rebecca Schultz. 2011. “Cli-mate-Friendly Air Quality Management: Strat-egies for Control.” Policy note, Regulatory Assistance Project (RAP), Montpelier, VT.
Levine, M., S. de la Rue de Can, N. Zheng, and C. Williams. 2012. “Building Energy-Energy Efficiency Best Practice Policies and Policy Packages.” Lawrence Berkeley National Labo-ratory report LBNL-6006E, Berkeley, CA. http://eaei.lbl.gov/sites/all/files/GBPN_Final.Oct_.2012.pdf.
NYC (City of New York). 2011. “PlaNYC 2011, A Greener, Greater New York.” April 2011. http://nytelecom.vo.llnwd.net/o15/agencies /planyc2030/pdf/planyc_2011_planyc_full_report.pdf.
Price, Lynn, Zhou Nan, David Fridley, Stephanie Ohshita, Lu Hongyou, Nina Zheng, and Ceci-lia Fino-Chen. 2013. “Development of a Low-Carbon Indicator System for China.” Habitat International 37: 4-21.
Salat, Serge. 2013. “Chinese Urban Forms and Energy.” Background note for China: Efficient, Inclusive, and Sustainable Urbanization study, World Bank and DRC, Beijing.
State Council. 2012. State Council Approval of 12th Five Year Plan for Prevention and Control of Air Pollution in Key Polluting Areas (国务院关于重点区域大气污染防治“十二五”规划的批复). Guo Hang [2012] 146 Hao. http://www.gov.cn/zwgk/2012-12/05/content_2283152.htm (accessed December 2013).
UK DEFRA (Department for Environment, Food and Rural Affairs, United Kingdom). 2007. Air Quality and Climate Change: A UK Perspective. London: DEFRA.
UNDP (United Nations Development Pro-gramme). 2010. UNDP China Human Development Report 2009/2010: China and a Sustainable Future: Towards a Low Carbon Economy & Society, http://hdr.undp.org/en /reports/nationalreports/asiathepacific/china /nhdr_China_2010_en.pdf.
van den Dobbelsteen, Andy, Siebe Broersma, and Michiel Fremouw. 2013. “Energy Potential Mapping and Heat Mapping: Prerequisite for Energy-Conscious Planning and Design.” In Sustainable Energy Landscapes: Designing, Planning and Development, Sven Stremke and Andy van den Dobbelsteen, eds. Boca Raton, FL: CRC Press.
van den Dobbelsteen, Andy, and Sven Stremke, eds. 2012. Sustainable Energy Landscapes: Designing, Planning, and Development. Boca Raton, FL: CRC Press, Taylor & Francis Group.
van den Dobbelsteen, Andy, Nico Tillie, Marc Joubert, Wim de Jager, and Duzan Doepel. 2012. “Towards CO2 Neutral City Planning—The Rotterdam Energy Approach and Plan-ning (REAP)” in Cities and Climate Change, edited by Daniel Hoornweg, Mila Freire, Marcus Lee, Perinaz Bhada-Tata, and Belinda Yuen, 268–89. Washington, DC: World Bank.
Wang Ke, Cui Xueqin, Fu Sha, and Zou Ji. 2012. “The Role of Cities in Meeting China’s Car-bon Intensity Goal, Part 3: Methodologies and Analytic Tools for Low-Carbon City Plan-ning,” World Resources Institute, February 9. http://www.wri.org/blog/role-cities-meeting-china%E2%80%99s-carbon-intensity-goal-1 (accessed December 2013 and June 2014).
World Bank. 2012. Sustainable Urban Energy and Emissions Planning Guidebook: A Guide for Cities in East Asia and Pacific. Washington DC: World Bank.
World Bank ESMAP (Energy Management Assis-tance Program). 2013. “Applying Abatement Cost Curve Methodology for Low-Carbon Strategy in Changning District, Shanghai.” Asia Sustainable and Alternative Energy Pro-gram report, ESMAP, World Bank, Beijing, China.
World Bank-MEP (Ministry of Environmental Protection, PRC). 2012. “Integrated Air Pol-lution -Management in China: Developing Particulate Matter Control.” World Bank, Washington, DC.
Zhou, Nan, Stephanie Ohshita, Lynn K. Price, and Nina Zheng. 2012. “A Low Carbon Devel-opment Guide for Local Government Actions in China.” Lawrence Berkeley National Labo-ratory report LBNL-5576E, Berkeley, CA.
Zhou, Nan, and Christopher J. Williams. 2013. “An International Review of Eco-City Theory, Indicators, and Case Studies.” Lawrence Berke-ley National Laboratory report LBNL-6513, Berkeley, CA.

ECO-AUDIT
Environmental Benefits Statement
The World Bank is committed to preserving endangered forests and natural resources. The Office of the Publisher has chosen to print Urban China: Toward Efficient, Inclusive, and Sustainable Urbanization on recycled paper with 30 percent post-consumer waste, in accordance with the recommended stand-ards for paper usage set by the Green Press Initiative, a nonprofit program supporting publishers in using fiber that is not sourced from en dangered forests. For more informa-tion, visit www.greenpressinitiative.org.
Saved:• 53 trees• 23 million Btu of total energy• 4,515 lbs. of net greenhouse gases• 24,487 gal. of waste water• 1,639 lbs. of solid waste