
Uranium and Other Chemical Contaminants Entering … Flux of Uranium Entering the Columbia River...
34
Uranium and Other Chemical Contaminants Entering the Columbia River from the South Columbia Basin Irrigation Outfalls A Cooperative Study by the Washington State Departments of Ecology and Health November 2010 Publication no. 10-05-019
Transcript of Uranium and Other Chemical Contaminants Entering … Flux of Uranium Entering the Columbia River...

Uranium and Other Chemical Contaminants Entering the Columbia River from the South Columbia Basin Irrigation Outfalls
A Cooperative Study by the Washington State Departments of Ecology and Health
November 2010 Publication no. 10-05-019

Publication and Contact Information This report is available on the Department of Ecology’s website at: www.ecy.wa.gov/biblio/1005019.html For more information contact:
Nuclear Waste Program 3100 Port of Benton Boulevard Richland, WA 99354 Phone: 509-372-7950
Washington State Department of Ecology - www.ecy.wa.gov
Headquarters, Olympia 360-407-6000 Northwest Regional Office, Bellevue 425-649-7000 Southwest Regional Office, Olympia 360-407-6300 Central Regional Office, Yakima 509-575-2490 Eastern Regional Office, Spokane 509-329-3400 To ask about the availability of this document in a format for the visually impaired, call the Nuclear Waste Program at 509-372-7950. Persons with hearing loss can call 711 for Washington Relay Service. Persons with a speech disability can call 877-833-6341.

Uranium and Other Chemical Contaminants Entering the Columbia River from
the South Columbia Basin Irrigation Outfalls
A Cooperative Study by the Washington State Departments of Ecology and Health
By
Jerry Yokel, Department of Ecology Mike Priddy, Department of Health
Nuclear Waste Program Washington State Department of Ecology
Richland, Washington

This page is purposely left blank

1
Table of Contents
Page List of Figures and Tables....................................................................................................2
Figures............................................................................................................................2
Tables .............................................................................................................................2
Abstract ................................................................................................................................3
Introduction ..........................................................................................................................4
The River .......................................................................................................................4
The Irrigation System ....................................................................................................4
The Hanford Site ............................................................................................................4
Uranium .........................................................................................................................5
Purpose of the Study ............................................................................................................6
Sample Locations ...........................................................................................................6
Outfall and River Sample Collection .............................................................................7
Uranium Test Method ....................................................................................................8
Results ..................................................................................................................................9
Radiological ...................................................................................................................9
Uranium 234 ..........................................................................................................9 Uranium 234 in Outfalls ......................................................................................10 Uranium 235 ........................................................................................................12 Uranium 235 in Outfalls ......................................................................................13 Uranium 238 ........................................................................................................14 Uranium 238 in Outfalls ......................................................................................15 Total Uranium .....................................................................................................16 Total Uranium in Outfalls ...................................................................................17
Washington Closure Hanford Samples ........................................................................20
Non-Radiological Data ................................................................................................20
Mass Flux of Uranium Entering the Columbia River Irrigation Flow .........................21
Summary and Conclusions ................................................................................................22
References ..........................................................................................................................23
Appendix ............................................................................................................................21
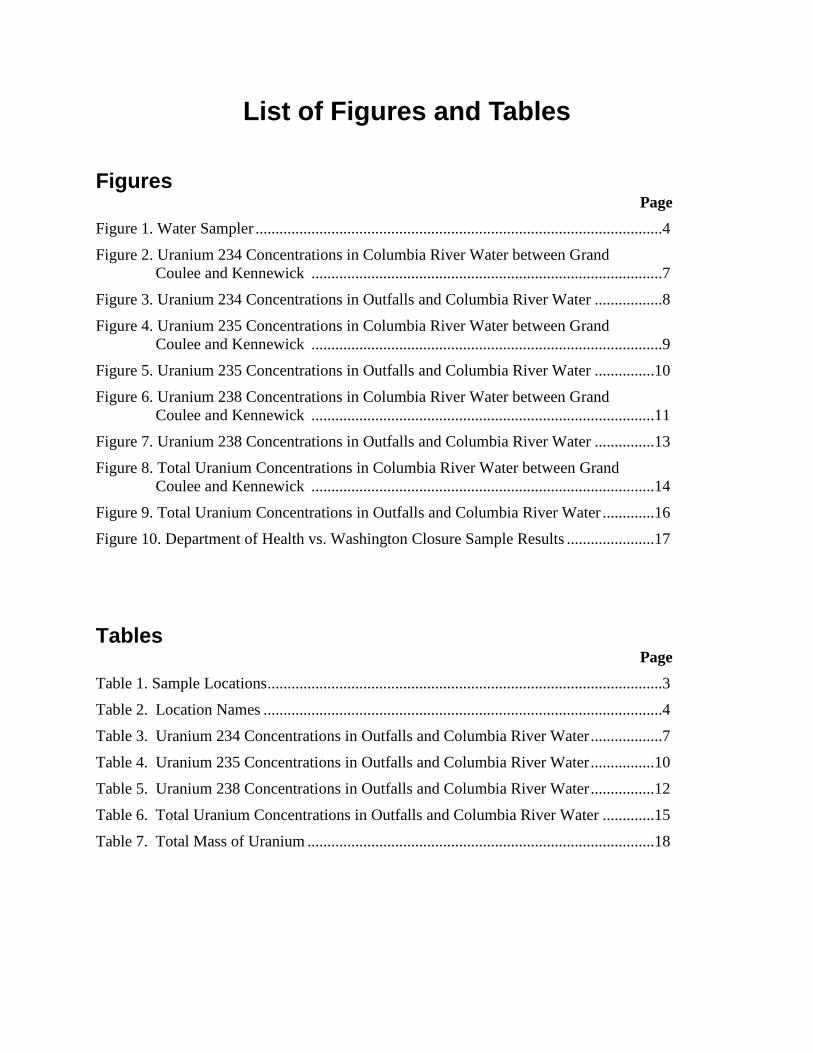
List of Figures and Tables
Figures Page
Figure 1. Water Sampler ......................................................................................................4
Figure 2. Uranium 234 Concentrations in Columbia River Water between Grand Coulee and Kennewick ........................................................................................7
Figure 3. Uranium 234 Concentrations in Outfalls and Columbia River Water .................8
Figure 4. Uranium 235 Concentrations in Columbia River Water between Grand Coulee and Kennewick ........................................................................................9
Figure 5. Uranium 235 Concentrations in Outfalls and Columbia River Water ...............10
Figure 6. Uranium 238 Concentrations in Columbia River Water between Grand Coulee and Kennewick ......................................................................................11
Figure 7. Uranium 238 Concentrations in Outfalls and Columbia River Water ...............13
Figure 8. Total Uranium Concentrations in Columbia River Water between Grand Coulee and Kennewick ......................................................................................14
Figure 9. Total Uranium Concentrations in Outfalls and Columbia River Water .............16
Figure 10. Department of Health vs. Washington Closure Sample Results ......................17
Tables Page
Table 1. Sample Locations ...................................................................................................3
Table 2. Location Names ....................................................................................................4
Table 3. Uranium 234 Concentrations in Outfalls and Columbia River Water ..................7
Table 4. Uranium 235 Concentrations in Outfalls and Columbia River Water ................10
Table 5. Uranium 238 Concentrations in Outfalls and Columbia River Water ................12
Table 6. Total Uranium Concentrations in Outfalls and Columbia River Water .............15
Table 7. Total Mass of Uranium .......................................................................................18

Abstract The Washington State Departments of Ecology and Health jointly investigated the nature and extent of uranium contamination in the irrigation outfalls to the Columbia River. An outfall is where unused irrigation water returns to the river. Six locations on the lower Columbia River were sampled, and the samples were analyzed for uranium and other chemical contaminants. This paper documents the results. Uranium was found at elevated levels in all of the outfall samples. The highest concentration of uranium was found in the Ringold 1 site, which on further investigation turned out to be an outfall from a State-operated fish hatchery. The concentrations at this site are roughly one-third the United States Environmental Protection Agency drinking water standard. Nitrate was the only non-radiological contaminant detected. Analysis of river water after each outfall does not indicate a significant increase in the uranium levels in the river from irrigation water. This study estimates the total mass of uranium (the “total uranium” values were used for the calculation) entering the river from Franklin County along the Hanford boundary to be 1,765 kilograms. That is an order of magnitude greater than the Hanford estimated annual uranium discharge to the Columbia River from the 300-FF-5 Operable Unit in the 300 Area, which was150 kilograms for 2005. These values do not include the contribution from the fish hatchery, which would add significantly to the total. The ratio of isotopes of uranium found indicates it is of natural origin, and not the result of human activity.

Introduction The River The Columbia River is the fourth largest river in the United States and, by volume, the largest river emptying into the Pacific Ocean from North America. The native Chinook speakers called the River Wimahl (Big River). Captain Robert Gray renamed the river after his ship, the Columbia Rediviva, which, in 1792, was the first ship to navigate the river1. The Columbia River is approximately 1,243 miles (2,000 kilometers) long. It empties a watershed of 258,000 square miles (670,000 square kilometers), an area about the size of Texas. Where the river enters the United States, the flow rate is 99,000 cubic feet per second (2,800 cubic meters). At the mouth of the river, 265,000 cubic feet per second (7,500 cubic meters) of water is discharged to the Pacific Ocean2. The Irrigation System In 1902, the United States Bureau of Land Reclamation was created. Part of the bureau’s mission was to promote economic development of the western United States. One way the Bureau did this was to build a series of large dams that would provide electricity and irrigation water. One of those dams, the Grand Coulee Dam, is located in northeastern Washington. Construction of the Grand Coulee Dam began in 1933, and the first irrigation water from the new system arrived in Pasco in 1952. Because the region gets less than ten inches of rain each year, the addition of irrigation water significantly changed the nature of agriculture in the region. The irrigation system has 300 miles of canals, 2,000 miles of laterals, and 3,500 miles of drains and wasteways, for a total of 5,800 miles of irrigation channels. The system runs through 671,000 acres of irrigable land. Canals are the primary conduits of water through the system. Laterals carry water from the canals to the distribution points in the fields, and wasteways carry unused water back to the river3. In recent years, several large landslides have occurred along the Columbia River and in the surrounding hills due to the effects of irrigation water on the soil. These landslides are testimony to the quantities of water flowing through the irrigation systems and into the soil. The Hanford Site The Hanford Site is located in southeastern Washington along 50 miles of the Columbia River just north of Richland, Washington. The Hanford Site, named after one of the towns taken over by the Manhattan Project in 1943, was built to supply plutonium for the first atomic bombs. Hanford plutonium was used in the bomb dropped on Nagasaki, Japan, which essentially ended World War II4. Between 1943 and 1989, the Hanford Site irradiated uranium in nine production reactors located along the river. The spent fuel and waste products were separated from the plutonium, which was processed and sent off site for weapons production.
The Hanford Site has several “areas.” The area closest to Richland, called the 300 Area, was the location of reactor fuel manufacturing and chemical separation process development. Large quantities of uranium were processed in the 300 Area as a result of these activities. Some of the waste products were disposed directly to the soil, and some waste products reached the groundwater. The waste sites have been remediated, but residual uranium remains in both the groundwater and the soil. The groundwater under the 300 Area flows directly into the Columbia River, which is only a few yards from the eastern boundary of the Hanford Site. Because of contaminated groundwater, the United States Department of Energy (USDOE) monitors the groundwater as it enters the river. While uranium can be seen at elevated levels near the shoreline of the river, uranium concentrations in the river water drop off quickly as samples are collected away from the shore. This is due to the extremely large volume of water flowing in the river and the relatively small volume of groundwater that enters the river through seeps and springs. Uranium Uranium is a natural element found throughout the world, including Washington State. Uranium in nature is primarily composed of three isotopes, uranium 234, 235, and 238. In nature, uranium 238 is the most abundant isotope, followed by uranium 235 and 234. Over 99% of natural uranium is 2385. Uranium 235 is the fissile isotope used in nuclear reactors. Uranium at and around Hanford exists in both natural and man-made forms. When uranium is said to be enriched or depleted, it is a reference to the addition or subtraction of uranium 235. In the case of enrichment, it is an attempt to make the uranium more fissile, and in the case of depletion, it is the waste from the enrichment process. When uranium is found in the environment, the ratios of the various isotopes can be used to determine if it is natural uranium or the result of human activity6. Washington State has several large natural uranium deposits, some of which have been mined in the past. The soils in the Columbia Basin do contain natural uranium, which has been detected in groundwater. Because uranium is a natural element, it is detected in many substances. One of these is the phosphates used in fertilizer. The phosphates used in fertilizer contain between 20 and 300 parts per million (ppm) of uranium. Elevated uranium levels would be expected in an area used primarily for agriculture, where phosphate fertilizers are applied7. Uranium 238 makes up 99.28% of natural uranium and dominates the total amount of uranium in the environment, as a function of weight. Uranium 238 exists in secular equilibrium (equal activity) with uranium 234, which is a daughter product of uranium 238. Therefore, while uranium 234 exists in nature at much smaller levels, it represents almost half the total activity. Because uranium is soluble in water, it would not be surprising to find it in the groundwater. Uranium is also commonly found in the soils of eastern Washington and in the fertilizers used there. It is equally likely to be found from blowing dust, fertilizer application, and leaching from groundwater in the irrigation canals of Franklin County.

Purpose of the Study Uranium in the irrigation returns across the Columbia River from the Hanford Site can complicate efforts to characterize the effects of uranium from Hanford sources on the river. For this reason, the Washington State Departments of Ecology and Health jointly investigated the nature and extent of uranium contamination in the irrigation returns to the Columbia River. This sampling effort also provided an opportunity to characterize the semi-volatile organic chemicals, fertilizer chemicals, metals, and pesticides entering the river from the irrigation system. Sample Locations The authors collected samples from each of the sites listed in Table 1. An initial investigation sample was taken at Sagemoor 2 (Byers Landing) in October 2007. Except for Grand Coulee, each location was sampled from the flume above the outfall and from the river downstream of the outfall at a distance that would allow mixing of irrigation water and river water. The purpose of the second sample was to determine if a change in uranium concentrations in river water could be detected after each outfall.
Site Name Latitude Longitude
Grand Coulee (sampled at Lake Roosevelt)
47.96509 -118.98352
White Bluffs 46.67648 -119.44517
White Bluffs Downriver 46.67327 -119.45572
Ringold Slough 46.53747 -119.27893
Ringold Slough Downriver 46.52950 -119.27760
Ringold 1 46.51005 -119.25533
Ringold 1 Downriver 46.50846 -119.26418
Ringold 2 46.50662 -119.25362
Ringold 2 Downriver 46.50463 -119.26246
Sagemoor 1 46.37761 -119.26154
Sagemoor 1 Downriver 46.37581 -119.26331
Sagemoor 2 46.35850 -119.25755
Sagemoor 2 Downriver 46.35665 -119.25920
Table 1. Sample Locations

Some of these sites have different names in different databases. Table 2 links these site names. In some cases, the exact spot of the sampling may vary somewhat, but the name serves as a general location identifier.
Site Name in this Report Alternative Name Alternative 2
White Bluffs Native American Cultural Site
Ringold Slough WB-5 Wasteway
Ringold 1 Ringold Irrigation Return
Ringold 2 PE 16.4 Wasteway
Sagemoor 1 Potholes Canal Wasteway
Sagemoor 2 Esquatzel Coulee Wasteway Byers Landing
Table 2. Location Names
Outfall and River Sample Collection Two methods were used to collect samples for this study.
1. Where it was safe to access the irrigation canals, the sample container was submerged by hand in the free-flowing irrigation water. This method was also used off the back of the boat for collection of downriver samples. Water from Grand Coulee was collected at the end of a long pier in Lake Roosevelt, also by container submersion.
2. The second method was developed to facilitate sample collection from the most dangerous and hard-to-access regions of the canal. A food-grade stainless steel weighted sampler was constructed (see Figure 1). The sampler was lowered by rope into the rapidly flowing canal water. The opening was baffled to prevent spillage upon retrieval. This procedure required multiple retrievals to obtain sufficient volume for analysis.
Figure 1. Water Sampler

Uranium Test Method To test its separate isotopes, uranium is analyzed in water samples by co-precipitation with iron as iron hydroxide, followed by adsorption onto an ion exchange resin. The uranium is then selectively eluted from the resin. The purified uranium is bound to the surface of a filter paper and analyzed on a high-resolution alpha spectrometer that measures the energies of the alpha particles emitted as the uranium atoms decay. This measurement allows the identification of individual isotopes of uranium and determination of their relative concentrations. A known quantity of uranium 232 is added to each sample at the start of the analysis so that chemical recovery can be determined. Uranium 232 is an isotope not found in nature and not produced in production reactors. The nominal detection limit for total uranium using the method described is 0.12 picocuries per liter (pCi/liter) for natural uranium. The chemical separations typically take three days followed by 1,000 minutes of counting on an alpha spectrometer. Up to six samples are analyzed in a batch. Each batch includes:
• A method blank (de-ionized water)
• A quality control (de-ionized water spiked with a known amount of natural uranium)
• A duplicate sample or a matrix spike (a second aliquot of one of the samples to which a known amount of uranium has been added).
These controls allow the accuracy and precision of the batch to be assessed as described in the laboratory’s quality assurance standard operating procedures. The proficiency with this method was established by good performances on independent proficiency test samples by the USDOE MAPEP (Mixed-Analyte Performance Evaluation Program) for uranium in October 2007 and 2008. For total uranium analysis, an isotopic analysis is performed, but the areas of the individual peaks are summed.

Results Radiological The radiological data is arranged to answer two questions.
1. How much uranium is entering the Columbia River from the outfalls studied?
2. What effect is the uranium concentration in the outfall water having on the overall uranium concentration in the Columbia River?
In the following sections of this report, each uranium isotope is discussed separately, and then the “total uranium” concentration is evaluated. For each isotope, the concentrations of uranium in river water are evaluated by graphing the downriver (DR) sample concentrations from Grand Coulee to Kennewick. These graphs will demonstrate any trends in uranium concentration along the stretch of river studied. Then, the uranium concentrations from each outfall (OF) are graphed along with the downriver sample to illustrate the effect of each individual outfall on the river and to compare the concentrations of uranium found in each outfall. For this study, both the Columbia River and the irrigation water originate in the impoundment of the Grand Coulee Dam, which is named Lake Roosevelt. When the authors reviewed the laboratory analysis, it was apparent that the water entering the Columbia River from the Ringold 1 site carried more uranium, by a factor of two, than any other outfall. Inquiries were made with the South Columbia Irrigation District. A team was dispatched to investigate the site upstream of the outfall. They discovered that the Ringold 1 outfall is actually an outfall from the State fish hatchery. The Irrigation District confirmed the source of the outfall. The hatchery pond water comes directly from springs on the site. This water was sampled again to confirm the first results. The authors recommend further study of this situation. This study includes the data from the Ringold 1 site for purposes of completeness. Uranium 234 Review of Uranium 234 in Columbia River water from Grand Coulee to Kennewick, Washington Uranium 234 (U-234) was detected at concentrations of 0.144 and 0.154 pCi/l at Grand Coulee. Downriver the concentration of uranium was highest at the Ringold Slough Downriver location, at a concentration of 0.29 pCi/l. The lowest concentration of U-234 in the river was 0.11 pCi/l at Sagemoor 1. The final sample taken just above Kennewick, Sagemoor 2, was 0.2 pCi/l. There is no clear pattern in U-234 concentrations, except that they are higher downstream of Grand Coulee Dam. The highest concentrations, seen at Ringold Slough, could be the result of a large body of slack water, which mixes more slowly with the main current of the river. There is no obvious reason for the Sagemoor 1 sample being the lowest. Figure 2 shows that the concentrations of U-234 doubled over the studied section of the river. These concentrations are very low when compared to drinking water standards, and almost all of the data points are within the error bars of the Grand Coulee samples.

Figure 2. Uranium 234 Concentrations in Columbia River Water between Grand Coulee and Kennewick
Uranium 234 in Outfalls The maximum level of U-234 found in outfall water in this study, 4.9 pCi/l, was found in water collected at the Ringold 1 outfall. The minimum from an outfall was 0.88 pCi/l from the Sagemoor 1 outfall. The background samples collected at Grand Coulee were 0.144 and 0.154 pCi/l. Concentrations of U-234 in outfalls and Columbia River water are listed in Table 3 and displayed in Figure 3.
Site OF = outfall DR = downriver Date Analyte Result
pCi/l Error
Grand Coulee OF 8/4/2008 U-234 0.144 0.073
Grand Coulee OF 8/4/2008 U-234 0.154 0.094
White Bluffs OF 7/2/2008 U-234 1.7 0.2
White Bluffs OF DR 7/2/2008 U-234 0.19 0.06
Ringold Slough OF 7/2/2008 U-234 1.6 0.2
Ringold Slough OF DR 7/2/2008 U-234 0.29 0.08
Ringold 1 OF 7/2/2008 U-234 4.9 0.3
Ringold 1 OF DR 7/2/2008 U-234 0.17 0.07
Ringold 2 OF 7/2/2008 U-234 2.7 0.2
Ringold 2 OF DR 7/2/2008 U-234 0.19 0.06
00.05
0.10.15
0.20.25
0.30.35
0.4
pCi/L
Locations
Uranium 234 in Columbia River Water

Site OF = outfall DR = downriver Date Analyte Result
pCi/l Error
Byers Landing OF DR 10/9/07 U-234 2 0.2
Sagemoor 1 OF 7/2/2008 U-234 0.88 0.13
Sagemoor 1 OF DR 7/2/2008 U-234 0.11 0.07
Sagemoor 2 OF 7/2/2008 U-234 2 0.2
Sagemoor 2 OF DR 7/2/2008 U-234 0.2 0.08
Table 3. Uranium 234 Concentrations in Outfalls and Columbia River Water
Figure 3. Uranium 234 Concentrations in Outfalls and Columbia River Water
-0.04-0.02
00.020.040.060.08
0.10.120.140.16
pCi/l
Location
Uranium 234 in all Surface Water

Uranium 235 Review of Uranium 235 in Columbia River water from Grand Coulee to Kennewick, Washington Uranium 235 (U-235) was detected at concentrations of 0.001 and 0.02 pCi/l in at Grand Coulee. The concentration of uranium was highest at the Grand Coulee, at a concentration of 0.02 pCi/l. The lowest concentration of U-235 was 0.0 pCi/l at Ringold 2. The final sample, taken just above Kennewick at Sagemoor 2, was 0.01 pCi/l. There is no clear pattern in U-235 concentrations. Uranium 235 makes up only 0.79% of natural uranium, which accounts for the relatively small amounts of U-235 seen in these samples, and the relatively low concentrations of U-235 makes the errors associated with the data large. Concentrations of U-235 in Columbia River water are displayed in Figure 4.
Figure 4. Uranium 235 Concentrations in Columbia River Water between Grand Coulee and Kennewick
-0.03-0.02-0.01
00.010.020.030.040.050.06
pCi/L
Location
Uranium 235 in Columbia River Water

Uranium 235 in Outfalls The maximum concentration of U-235 found in this study, 0.1 pCi/l, which was from water collected at the Ringold 1 and 2 outfalls. The minimum from an outfall was 0.062 pCi/l from the Sagemoor 2 outfall. The background samples collected at Grand Coulee were 0.001 and 0.02 pCi/l. Concentrations of U-235 in outfalls and Columbia River water are displayed in Figure 5 and listed in Table 4.
Figure 5. Uranium 235 Concentrations in Outfalls and Columbia River Water
Site OF = outfall DR = downriver Date Analyte Result
pCi/l Error
Grand Coulee OF 8/4/2008 U-234 0.001 0.021
Grand Coulee OF 8/4/2008 U-235 0.02 0.035
White Bluffs OF 7/2/2008 U-235 0.034 0.033
White Bluffs OF DR 7/2/2008 U-235 0.01 0.019
Ringold Slough OF 7/2/2008 U-235 0.049 0.036
Ringold Slough OF DR 7/2/2008 U-235 0.018 0.022
Ringold 1 OF 7/2/2008 U-235 0.1 0.04
Ringold 1 OF DR 7/2/2008 U-235 0.007 0.019
Ringold 2 OF 7/2/2008 U-235 0.1 0.04
Ringold 2 OF DR 7/2/2008 U-235 0 0.02
-0.04-0.02
00.020.040.060.080.1
0.120.140.16
pCi/l
Location
Uranium 235 in all Surface Water

Site OF = outfall DR = downriver Date Analyte Result
pCi/l Error
Byers Landing OF 10/9/2007 U-235 0.086 0.041
Sagemoor 1 OF 7/2/2008 U-235 0.047 0.028
Sagemoor 1 OF DR 7/2/2008 U-235 0.005 0.01
Sagemoor 2 OF 7/2/2008 U-235 0.062 0.034
Sagemoor 2 OF DR 7/2/2008 U-235 0.01 0.017
Table 4. Uranium 235 Concentrations in Outfalls and Columbia River Water
Uranium 238 Review of Uranium 238 in Columbia River water from Grand Coulee to Kennewick, Washington Uranium 238 (U-238) was detected at concentrations of and 0.18 and 0.156 pCi/l at Grand Coulee. The concentration of uranium was highest in Columbia River water at the Ringold Slough Downriver location, at a concentration of 0.2 pCi/l. The lowest concentration of U-238 in river water was 0.089 pCi/l at Ringold 1 Downriver. The final sample taken just above Kennewick, Sagemoor 2, was 0.11 pCi/l. There is no clear pattern in U-238 concentrations in river water. Concentrations of U-238 in Columbia River water are displayed in Figure 6.
Figure 6. Uranium 238 Concentrations in Columbia River Water between Grand Coulee and Kennewick
00.05
0.10.15
0.20.25
0.3
pCi/L
Location
Uranium 238 in Columbia River Water

Uranium 238 in Outfalls The maximum concentration of U-238 found in this study, 4.1 pCi/l, was from water collected at the Ringold 1 Outfall. The minimum from an outfall was 0.8 pCi/l from the Sagemoor 1 Outfall. The background samples collected at Grand Coulee were 0.18 pCi/l and 0.156 pCi/l. Concentrations of U-238 in outfalls and Columbia River water are listed in Table 5 and displayed in Figure 7.
Site OF = outfall DR = downriver Date Analyte Result
pCi/l Error
Grand Coulee 8/4/2008 U-238 0.18 0.077
Grand Coulee 8/4/2008 U-238 0.156 0.088
White Bluffs OF 7/2/2008 U-238 1.3 0.2
White Bluffs OF DR 7/2/2008 U-238 0.12 0.06
Ringold Slough OF 7/2/2008 U-238 1.3 0.2
Ringold Slough OF DR 7/2/2008 U-238 0.2 0.07
Ringold 1 OF 7/2/2008 U-238 4.1 0.3
Ringold 1 OF DR 7/2/2008 U-238 0.089 0.059
Byers Landing OF 10/9/2007 U-238 1.7 0.2
Ringold 2 OF 7/2/2008 U-238 2 0.2
Ringold 2 OF DR 7/2/2008 U-238 0.11 0.06
Sagemoor 1 OF 7/2/2008 U-238 0.8 0.13
Sagemoor1 OF DR 7/2/2008 U-238 0.1 0.06
Sagemoor 2 OF 7/2/2008 U-238 1.7 0.2
Sagemoor 2 OF DR 7/2/2008 U-238 0.11 0.06
Table 5. Uranium 238 Concentrations in Outfalls and Columbia River Water

Figure 7. Uranium 238 Concentrations in Outfalls and Columbia River Water
Total Uranium Review of Total Uranium in Columbia River water from Grand Coulee to Kennewick, Washington Total uranium was detected at concentrations of and 0.32 and 0.47 pCi/l at Grand Coulee. The concentration of uranium was highest in Columbia River water at the Ringold Slough Downriver location, at 0.56 pCi/l. The lowest concentration of total uranium in river water was 0.089 pCi/l at Sagemoor 1 Downriver. The final sample taken just above Kennewick, Sagemoor 2, was 0.35 pCi/l. There is no clear pattern in total uranium concentrations in River water. As stated in the test method section, total uranium analysis is not simply the addition of the analytical results for the different isotopes of uranium, but is a separate analysis. As a result, while the addition of the individual isotopic analyses result is approximately the same as the total uranium analysis, it should not be expected that they will be the same. Total uranium concentrations in river water are displayed in Figure 8.
00.5
11.5
22.5
33.5
44.5
5pC
i/l
Location
Uranium 238 in Surface Water

Figure 8. Total Uranium Concentrations in Columbia River Water between Grand Coulee and Kennewick
Total Uranium in Outfalls The maximum concentration of total uranium found in this study, 9.2 pCi/l, was from water collected at the Ringold 1 outfall. The minimum from an outfall was 1.8 pCi/l from the Sagemoor 1 outfall. The background samples collected at Grand Coulee were 0.32 and 0.47 pCi/l. The downriver sample collected at Sagemoor 2, representing the accumulated U-238 load from all sources between Grand Coulee and Kennewick, was 0.17 pCi/l. Total uranium concentrations in outfalls and Columbia River water are listed in Table 6 and displayed in Figure 9.
0
0.1
0.2
0.3
0.4
0.5
0.6
0.7
0.8
pCi/L
Location
Total Uranium in Columbia River Water

Site OF = outfall DR = downriver Date Analyte Result
pCi/l Error
Grand Coulee 8/4/2008 Total U 0.32 0.11
Grand Coulee OF 8/4/2008 Total U 0.47 0.15
White Bluffs OF 7/2/2008 Total U 3.4 0.3
White Bluffs OF DR 7/2/2008 Total U 0.33 0.09
Ringold Slough OF 7/2/2008 Total U 3 0.2
Ringold Slough OF DR 7/2/2008 Total U 0.56 0.11
Ringold 1 OF 7/2/2008 Total U 9.2 0.4
Ringold 1 OF DR 7/2/2008 Total U 0.29 0.09
Ringold 2 OF 7/2/2008 Total U 4.9 0.3
Ringold 2 OF DR 7/2/2008 Total U 0.32 0.09
Byers Landing OF 10/09/2007 Total U 3.8 0.3
Sagemoor 1 OF 7/2/2008 Total U 1.8 0.2
Sagemoor 1 OF DR 7/2/2008 Total U 0.28 0.1
Sagemoor 2 OF 7/2/2008 Total U 3.9 0.3
Sagemoor 2 OF DR 7/2/2008 Total U 0.35 0.1
Table 6. Total Uranium Concentrations in Outfalls and Columbia River Water

Figure 9. Total Uranium Concentrations in Outfalls and Columbia River Water
The United States Environmental Protection Agency’s (EPA) drinking water standard for uranium is 30 micrograms per liter. The EPA assumes that 30 micrograms per liter will result in a concentration of radioactivity in water of 27 pCi/l. The highest concentration of total uranium entering the Columbia River from an outfall is 9.2 pCi/l, which is roughly one-third the drinking water standard. The highest total uranium in surface water in the River is 0.56 pCi/l, which is almost 50 times less than the drinking water standard. Whether or not uranium contamination is the product of human activity or the result of natural processes can be determined by the ratio of the various isotopes of uranium. The ratio of U-235 to the total amount of uranium will reveal whether the uranium has been enriched or depleted by processing. The percentages of each isotope of uranium were compared to the average, or expected, percentages to confirm that the uranium in the outfall water was not processed uranium. From these calculations, it is clear that the average by weight percentage of each isotope is consistent with the published data.
0
2
4
6
8
10
12pC
i/l
Location
Total Uranium in Surface Water

Washington Closure Hanford Samples In 2008, Washington Closure Hanford (WCH) sampled the same outfalls for uranium. The results of those analyses and how they compare with the results of this study are discussed here and displayed in Figure 10.
Figure 10. Department of Health vs. Washington Closure Sample Results
The graphs in Figure 10 clearly show fairly good agreement between the two sample sets. The U-235 results vary as a result of analytical techniques, probably related to background radiation calculations. It is clear, however, that the relative concentrations between each outfall are in good agreement. Non-Radiological Data From April to October designates the irrigation season for the Columbia Basin Project (CBP)8. Sampling was performed in the south Columbia irrigation district in Franklin County with one background sample taken at Grand Coulee Dam. Crops fertilized and irrigated were wheat, alfalfa, potatoes, corn, pears, apples, and onions8. As described in the Quality Assurance Plan, semi-volatile organic acids, herbicides, pesticides, metals, nitrates, and phosphates were analyzed for in the wasteway irrigation returns and the resulting Columbia River mainstreams.
WDOH (U234) vs WCH(233/4)
0123456
RINGOLD
1 OF
RINGOLD
2 OF
RINGOLD
SL O
F
SAGEMOOR 1 OF
SAGEMOOR 2 OF
WHITE BLUFS O
F
Location
pCi/L
WDOHWCH
WDOH vs WCH U235
00.050.1
0.150.2
0.250.3
Ringold
1
Ringold
2
Ring S
lough
Sagem
oor 1
Sagem
oor 2
Whit
e bluf
fs
Location
pC
i/L WDOH
WCH
WDOH vs WCH U238
00.5
11.5
22.5
33.5
44.5
Ringold
1
Ringold
2
Ring S
lough
Sagem
oor 1
Sagem
oor 2
Whit
e bluf
fs
Locations
pC
i/L WDOHWCH

Nitrate as nitrogen was detected at 4.6 ppm, which is comparable to the maximum of 3.1 ppm recorded in the Johnson report9. No other chemical contaminants were detected. Mass Flux of Uranium Entering the Columbia River Irrigation Flow The South Columbia Basin Irrigation District supplied the volume of water released through each wasteway for this study. These volumes were converted from acre-feet to liters. That volume was then multiplied by the concentrations of total uranium in each wasteway sample to determine the total mass of uranium entering the river (Table 7).
Site Uranium Isotope Acre Feet Conversion Liters pCi/L pCi Kilo
gram
White Bluffs 238 12627 1.23E+06 1.56E+10 1.3 2.02E+10 60
White Bluffs 234 12627 1.23E+06 1.56E+10 1.7 2.65E+10 12
White Bluffs 235 12627 1.23E+06 1.56E+10 0.034 5.30E+08 0
Ringold Slough 238 28019 1.23E+06 3.46E+10 2 6.91E+10 206
Ringold Slough 234 28019 1.23E+06 3.46E+10 1.7 5.88E+10 27
Ringold Slough 235 28019 1.23E+06 3.46E+10 0.062 2.14E+09 0
Ringold 2 238 103814 1.23E+06 1.28E+11 2 2.56E+11 764
Ringold 2 234 103814 1.23E+06 1.28E+11 2.7 3.46E+11 160
Ringold 2 235 103814 1.23E+06 1.28E+11 0.1 1.28E+10 0
Sagemoor 1 238 21444 1.23E+06 2.65E+10 0.8 2.12E+10 63
Sagemoor 1 234 21444 1.23E+06 2.65E+10 0.88 2.33E+10 11
Sagemoor 1 235 21444 1.23E+06 2.65E+10 0.047 1.24E+09 0
Sagemoor 2 238 55296 1.23E+06 6.82E+10 2 1.36E+11 407
Sagemoor 2 234 55296 1.23E+06 6.82E+10 1.7 1.16E+11 54
Sagemoor 2 235 55296 1.23E+06 6.82E+10 0.062 4.23E+09 0
1,765
Table 7. Total Mass of Uranium

Summary and Conclusions The six lower Columbia River outfalls were sampled for uranium and other chemical contaminants. Uranium was found at elevated levels in all of the outfalls. The highest concentration of uranium was found in the Ringold 1 site, which turns out to be an outfall from a State-operated fish hatchery. The concentrations at this site are roughly one-third of the EPA drinking water standard. Nitrate was the only non-radiological contaminant detected. Analysis of the water downriver from each outfall does not indicate a measurable increase in the uranium levels in the river from irrigation water. This study estimates the total mass of uranium (the “total uranium” values were used for the calculation) entering the river from Franklin County along the Hanford boundary to be 1,765 kilograms. This is more than an order of magnitude greater than the Hanford estimated annual uranium discharge to the Columbia River from the 300-FF-5 Operable Unit in the 300 Area, which was 150 kilograms for 2005. These values do not include the contribution from the fish hatchery, which would add significantly to the total. The ratio of isotopes of uranium found indicates it is of natural origins, not the product of human activity.

References 1. Kit Oldham, “Captain Robert Gray becomes the first non-Indian navigator to enter the
Columbia River, which he later names, on May 11, 1792,” The Online Encyclopedia of Washington State History, January 13, 2003, HistoryLink.org, <http://www.historylink.org/essays/output.cfm?file_id=5051> (April 1, 2008).
2. “Columbia River,” Wikipedia: The Free Encyclopedia, <http://en.wikipedia.org/wiki/Columbia_River#cite_note-USGSrivers-4>.
3. “Columbia Basin Project,” Columbia River History Project, <http://www.nwcouncil.org/history/ColumbiaBasinProject.asp>.
4. Michele Stenehjem Gerber, On the Home Front: The Cold War Legacy of the Hanford Nuclear Site, University of Nebraska Press, Nebraska, 2002.
5. “Uranium-233 at the Hanford Nuclear Site,” Radiation Fact Sheets, Washington State Department of Health Office of Radiation Protection, Washington, 2002, Fact Sheet #34, <http://www.doh.wa.gov/ehp/rp/factsheets/factsheets-htm/fs34u233han.htm> .
6. “Uranium (U),” Radiation Fact Sheets, Washington State Department of Health Office of Radiation Protection, Washington, 2002, Fact Sheet #27, <http://www.doh.wa.gov/ehp/rp/factsheets/factsheets-htm/fs27uran.htm>.
7. “Fertilizer and Fertilizer Production Wastes,” Radiation Protection, U.S. Environmental Protection Agency, <http://www.epa.gov/rpdweb00/tenorm/fertilizer.html>.
8. Richard Wagner, Lonna Frans, and Raegan Huffman, Occurrence, Distribution, and Transport of Pesticides in Agricultural Irrigation Return Flow from Four Drainage Basins in the Columbia Basin Project, Washington, 2002-2004 and Comparison with Historical Data, U.S. Geological Survey and Bureau of Reclamation, Virginia, 2006, Scientific Investigation Report 2006-5005.
9. Art Johnson and Shirley Prescott, Irrigation Return Flow Quality South Columbia Basin
Irrigation District May-August 1980, Washington State Department of Ecology Wastewater Monitoring Section, Washington, 1981, Publication No. 81-e16 WA-36-1010.


1
Appendix
Quality Assurance Project Plan for Hanford Reach Columbia River
Irrigation Outflow Sampling

Quality Assurance Project Plan for Hanford Reach Columbia River Irrigation
Outflow Sampling Prepared by: Jerry Yokel
Washington State Department of Ecology (ECY), Nuclear Waste Program, Richland, WA
Mike Priddy Washington State Department of Health (DOH), Office of Radiation Protection, Richland, WA
Rev. 1 July 14, 2007
Section Supervisor: Cheryl Whalen ECY Deborah McBaugh DOH Quality Assurance Coordinator: Jerry Yokel Table of Contents Page Organization and Schedule 3 Background and Problem Statement 5 Project Description 5 Data Quality Objectives 5

Organization and Schedule The members of the sampling team include Jerry Yokel and Mike Priddy. This study is a Washington State Department of Ecology and Department of Health joint activity. The results of this study will be available to Hanford stakeholders, concerned public, and the Tribal Nations. Also, the analytical results will be available for all concerned entities to use and review. Approximate Timetable The first set of samples will be taken in September. By mid-October, the data packages should be ready and data review will occur. Further sampling depends on need and budget. Field Activities Sampling sites have been identified below and the methods for contaminants of concern. Sampling dates have been added in this revision.
Location ID Uranium Herbicides Pesticides Semi-VOA’s Metals Nitrates Phosphates
Sagemoor SG1 7/02/08 4/23/09 7/7/08
Down river S1R 7/02/08 7/7/08 7/7/08
Byers Landing SG2 10/09/07 10/9/07 10/9/07
7/7/08
10/9/07
7/7/08
10/9/07 10/9/07 10/9/07
Down river S2R 7/02/08 7/7/08 7/7/08
Ringold 1 R1O 7/02/08 7/7/08
4/23/09 7/7/08
Down river R1R 7/02/08 7/7/08 7/7/08
Ringold 2 R2O 7/02/08 7/7/08 7/7/08
Down river R2R 7/02/08 7/7/08 7/7/08
Ringold Slough RSO 7/02/08 7/7/08 7/7/08
Down river RSR 7/02/08 7/7/08 7/7/08
White Bluffs WBO 7/02/08 7/7/08 7/7/08

Location ID Uranium Herbicides Pesticides Semi-VOA’s Metals Nitrates Phosphates
Down river WBR 7/02/08 7/7/08 7/7/08
Grand Coulee GR 8/04/08 8/5/08 8/5/08 8/5/08 8/5/08 8/5/08 8/5/08
Liquid samples will be collected in amber glass containers for the pesticide/herbicides. Metals and uranium will be collected in plastic cubitainers. Each sample container will be labeled with water-resistant labels. The sample collection date/time, name of sampler, organization, and analysis required will be included on the label. A security tape will be affixed to the container lid. Shipping of Samples Samples obtained for chemistry analysis will be held on ice and shipped to the laboratory within 48 hours. A chain of custody will be carried through the field sampling and shipping. The chain of custody will accompany the sample to the lab. The shipping and handling activities will occur at the Nuclear Waste Program (NWP) facility. Samples taken for radiochemical analysis will be held on ice and transported to the Department of Health laboratory in Seattle. Laboratory Turnaround Time The laboratory will be given a 45-day turnaround time. Past experience with the laboratory has shown that the average turnaround time is 30 days. Data Analysis Paragon submits a full data package with qualified summaries and quality control sections. Data Verification The chemical data will be verified by the NWP lead chemist. The laboratory has been audited twice in the last six years and is certified by the Laboratory Accreditation section of Ecology. The laboratory has a successful record in the past of producing defensible and useable data. The radiochemical data is verified after it is produced at the State Health Laboratory for chemical preparation, quality assurance/quality control, instrument calibration, and general analysis. A second review is performed once the data is received by the party that originally collected the sample. Report Write Up The report will be jointly authored by Jerry Yokel and Mike Priddy. Future plans include submittal for publication.
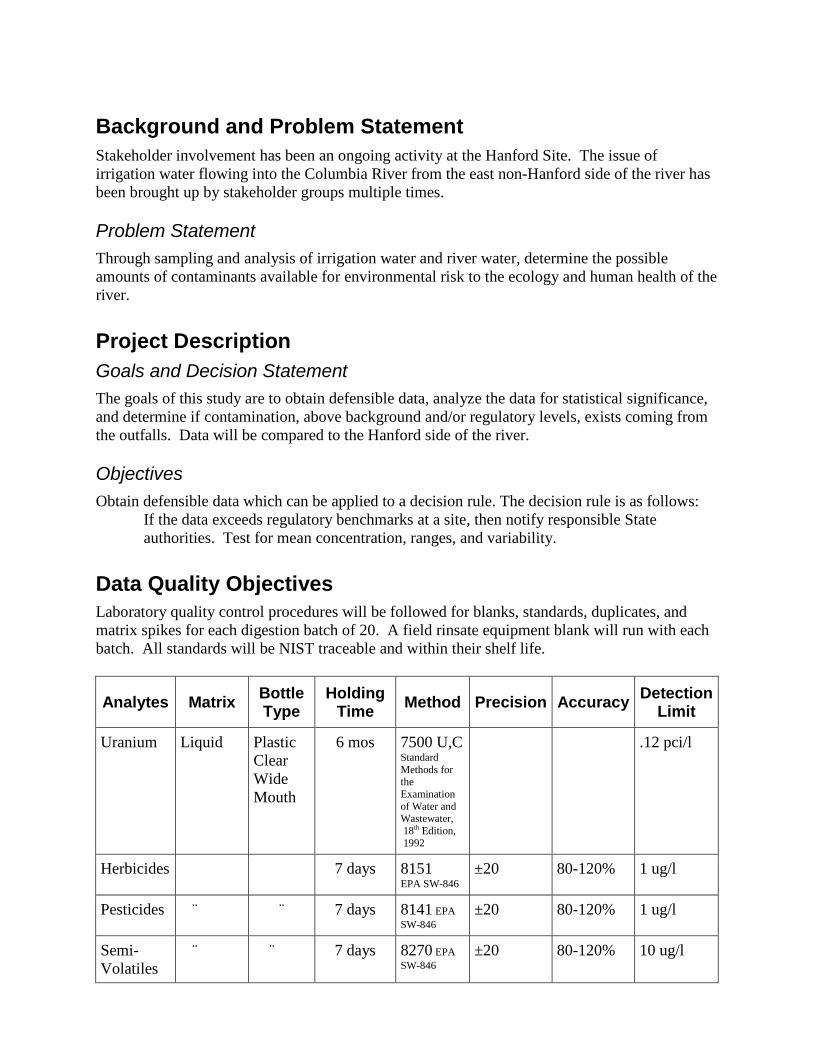
Background and Problem Statement Stakeholder involvement has been an ongoing activity at the Hanford Site. The issue of irrigation water flowing into the Columbia River from the east non-Hanford side of the river has been brought up by stakeholder groups multiple times. Problem Statement Through sampling and analysis of irrigation water and river water, determine the possible amounts of contaminants available for environmental risk to the ecology and human health of the river. Project Description Goals and Decision Statement The goals of this study are to obtain defensible data, analyze the data for statistical significance, and determine if contamination, above background and/or regulatory levels, exists coming from the outfalls. Data will be compared to the Hanford side of the river. Objectives Obtain defensible data which can be applied to a decision rule. The decision rule is as follows:
If the data exceeds regulatory benchmarks at a site, then notify responsible State authorities. Test for mean concentration, ranges, and variability.
Data Quality Objectives Laboratory quality control procedures will be followed for blanks, standards, duplicates, and matrix spikes for each digestion batch of 20. A field rinsate equipment blank will run with each batch. All standards will be NIST traceable and within their shelf life.
Analytes Matrix Bottle Type
Holding Time Method Precision Accuracy Detection
Limit
Uranium Liquid Plastic Clear Wide Mouth
6 mos 7500 U,C Standard Methods for the Examination of Water and Wastewater, 18th Edition, 1992
.12 pci/l
Herbicides 7 days 8151 EPA SW-846
±20 80-120% 1 ug/l
Pesticides ¨ ¨ 7 days 8141 EPA SW-846
±20 80-120% 1 ug/l
Semi-Volatiles
¨ ¨ 7 days 8270 EPA SW-846
±20 80-120% 10 ug/l

Analytes Matrix Bottle Type
Holding Time Method Precision Accuracy Detection
Limit
Metals ¨ ¨ 6 mos 6010 EPA SW-846
±20 80-120% .005-1 mg/l
Nitrate ¨ ¨ 48 hrs 353.2 EPA SW-846
±20 80-120% 0.2mg/l
Phosphate ¨ ¨ 48 hrs 365.2 EPA SW-846
±20 80-120% 0.5 mg/l