UraMin Inc. NI 43-101 Technical Report Preliminary
187
UraMin Inc. NI 43-101 Technical Report Preliminary Assessment Trekkopje Uranium Project Swakopmund and Karibib Districts, Erongo Region, Namibia UraMin Inc. 204 Rivona Road, Block A Morningside, Sandton, Gauteng 2057 South Africa 27-11-783-5056 SRK Project Number 163701 3275 West Ina Road. Suite 240 Tucson, AZ 85741 April 26, 2007 Compiled by: Endorsed by QP: SRK Consulting (U.S.) Inc. Allan V. Moran; R.G., C.P.G. SENET Frank Daviess; R. SME, M. AusIMM Turgis Consulting (Pty) Ltd. Mountain States R & D, International Inc. SRK Consulting Inc. – Johannesburg Bitner Water Consult _________________________ _________________________ Project Consultants Qualified Person
Transcript of UraMin Inc. NI 43-101 Technical Report Preliminary

UraMin Inc.
NI 43-101 Technical Report Preliminary Assessment
Trekkopje Uranium Project Swakopmund and Karibib Districts,
Erongo Region, Namibia
UraMin Inc. 204 Rivona Road, Block A
Morningside, Sandton, Gauteng 2057 South Africa
27-11-783-5056
SRK Project Number 163701
3275 West Ina Road.
Suite 240 Tucson, AZ 85741
April 26, 2007 Compiled by: Endorsed by QP: SRK Consulting (U.S.) Inc. Allan V. Moran; R.G., C.P.G. SENET Frank Daviess; R. SME, M. AusIMM Turgis Consulting (Pty) Ltd. Mountain States R & D, International Inc. SRK Consulting Inc. – Johannesburg Bitner Water Consult _________________________ _________________________ Project Consultants Qualified Person

UraMin, Inc. I Trekkopje Uranium Project Preliminary Assessment
SRK Consulting (US), Inc. April 2007 Trekkopje.NI 43-101 Preliminary Assessment.163701.MA.006.doc
Summary (Item 3)
Property Description and Accessibility The Trekkopje Project is a very large, low-grade, shallow uranium resource that consists of two uranium deposits, the Trekkopje deposit and the Klein Trekkopje deposit, located approximately 7.0km apart. The Project area is located on nearly flat, gently west-sloping topography in the very arid desert region of western Namibia, southwestern Africa. The deposits, are broad, shallow, calcrete-hosted uranium deposits hosted in calcium carbonate cemented (calcrete) conglomerates of Tertiary age.
The Trekkopje Project is approximately 65km in a straight line northeast of the coastal town of Swakopmund. Access is via paved highway east from Swakopmund 70km, and then by graded gravel road 23km North to the project site. The project site is readily accessible, and close to power and rail transport. Water resources would be supplied via pipeline from the coast.
The Trekkopje Project is a pre-development uranium property with established resources that is mid-way in feasibility level study. This Preliminary Assessment Technical Report provides the results of a recent resource update and the status as of the end of January, 2007 of the Bankable Feasibility Study (BFS) in progress.
History Anomalous uranium was first detected in the area by airborne geophysical surveys conducted in 1970 as part of a country-wide geological investigations program sponsored by the South West Africa (now Namibia) government. Detailed radiometric anomalies were followed up with several periods of drilling and shallow pitting, culminating in historical resource estimates.
UraMin began exploration on the ground in late 2005 and accelerated drilling in 2006 to first confirm historical mineralization, and subsequently drill-define resources that match or exceeded historical estimates; resources defined by NI 43-101 compliant CIM classifications. In June 2006, UraMin initiated feasibility level studies with the goal of completion by September 2007.
Geology The Trekkopje uranium deposits are one of a number of uranium deposits located in the coastal plain of the Namib Desert region of western Namibia. These deposits are hosted within surficial calcrete deposits formed in fluviatile and valley-fill sediments. The calcrete-hosted uranium deposits are the results of broad-scale surficial weathering of uraniferous granites and schist of Precambrian and Mesozoic age in the Namib hinterlands to the east. Uranium was dissolved as uranyl ions and transported in groundwater down the hydraulic gradient to the southwest. Deposition was focused into narrow paleo-stream channels in permeable shallow stream detritus at chemical and oxidation/reduction (redox) and evaporation interfaces. Uranium and vanadium was transported by groundwater and deposited within calcrete-cemented conglomerates, silts, and sands occupying the paleo-drainage channels.
The uranium-vanadium mineralization at the Trekkopje Project consists of one deposit type, calcrete-hosted mineralization. Calcrete uranium-vanadium deposits are a genetic type of secondary uranium mineralization found in arid desert regions of the world, such as Western Australia and western Namibia.
UraMin, Inc. II Trekkopje Uranium Project Preliminary Assessment
SRK Consulting (US), Inc. April 2007 Trekkopje.NI 43-101 Preliminary Assessment.163701.MA.006.doc
The deposits are typified by carnotite uranium mineralization irregularly disseminated in the host rocks, which are typically paleo-channel sands and gravels that have been cemented to varying degrees by calcium carbonate cement. Carnotite [K2(UO2)2V2O8·3H2O (hydrated potassium uranyl vanadate)] is the dominant uranium-vanadium mineral.
Calcrete uranium deposits have been known from exploration discoveries in western Namibia and western Australia since the early 1970s. Deposit size and grade can vary significantly from a few million tonnes to over 100 million tonnes (Mt); with grades ranging from 100ppm U3O8 (0.01% U3O8) to over 0.10% U3O8. In addition to the Trekkopje Project uranium deposits, known calcrete-hosted uranium deposits worldwide include the Yeelirrie deposit in Western Australia and the Langer Heinrich deposit in western Namibia less than 100km south of Trekkopje.
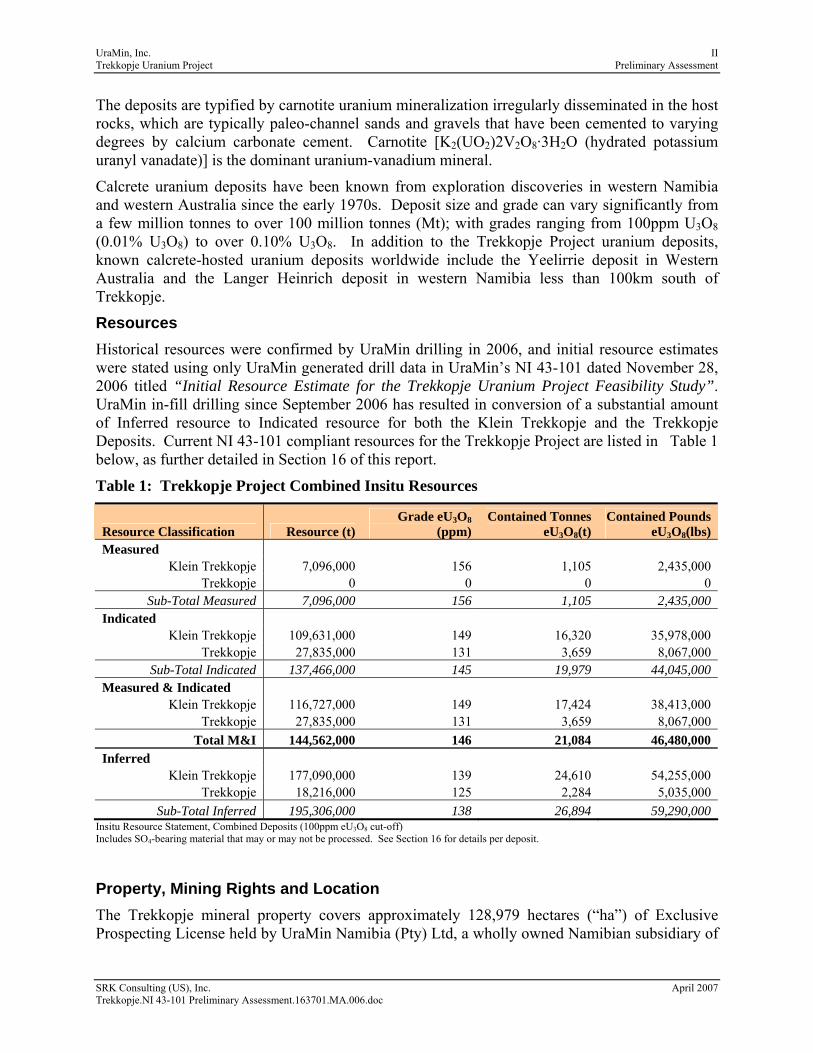
Resources Historical resources were confirmed by UraMin drilling in 2006, and initial resource estimates were stated using only UraMin generated drill data in UraMin’s NI 43-101 dated November 28, 2006 titled “Initial Resource Estimate for the Trekkopje Uranium Project Feasibility Study”. UraMin in-fill drilling since September 2006 has resulted in conversion of a substantial amount of Inferred resource to Indicated resource for both the Klein Trekkopje and the Trekkopje Deposits. Current NI 43-101 compliant resources for the Trekkopje Project are listed in Table 1 below, as further detailed in Section 16 of this report.
Table 1: Trekkopje Project Combined Insitu Resources
Resource Classification Resource (t) Grade eU3O8
(ppm) Contained Tonnes
eU3O8(t) Contained Pounds
eU3O8(lbs) Measured
Klein Trekkopje 7,096,000 156 1,105 2,435,000 Trekkopje 0 0 0 0
Sub-Total Measured 7,096,000 156 1,105 2,435,000 Indicated
Klein Trekkopje 109,631,000 149 16,320 35,978,000 Trekkopje 27,835,000 131 3,659 8,067,000
Sub-Total Indicated 137,466,000 145 19,979 44,045,000 Measured & Indicated
Klein Trekkopje 116,727,000 149 17,424 38,413,000 Trekkopje 27,835,000 131 3,659 8,067,000
Total M&I 144,562,000 146 21,084 46,480,000 Inferred
Klein Trekkopje 177,090,000 139 24,610 54,255,000 Trekkopje 18,216,000 125 2,284 5,035,000
Sub-Total Inferred 195,306,000 138 26,894 59,290,000 Insitu Resource Statement, Combined Deposits (100ppm eU3O8 cut-off) Includes SO4-bearing material that may or may not be processed. See Section 16 for details per deposit.
Property, Mining Rights and Location The Trekkopje mineral property covers approximately 128,979 hectares (“ha”) of Exclusive Prospecting License held by UraMin Namibia (Pty) Ltd, a wholly owned Namibian subsidiary of
UraMin, Inc. III Trekkopje Uranium Project Preliminary Assessment
SRK Consulting (US), Inc. April 2007 Trekkopje.NI 43-101 Preliminary Assessment.163701.MA.006.doc
UraMin Inc.(UraMin). Pending a positive result of the BFS, UraMin intends to file for mining licenses and proceed to mine development.
Exploration/Development Potential The smaller Trekkopje deposit has a long-dimension of N60E in plan, with dimensions of 4.0km northeast-southwest by 2.0km across strike, with thicknesses varying from 1.0m to more than 10.0m. All mineralization exists at depths of from 0.0m to more than 25.0m, with most from 0.0 to 10.0m in depth. The Klein Trekkopje deposit has a northeast-southwest strike extent of 16.0km, a width of 1.5 to 4.5km, and a thickness and depth of mineralization similar to Trekkopje. The deposits locally outcrop and may be covered by sand and/or gypcrete of 0.5 to 1.5m; such that they are readily accessible to shallow open pit mining. There is significant exploration potential in extensions to known paleo-channels on UraMin’s property position; potential that will be addressed with exploration drilling this year. Current conceptual plans for mining would incorporate proposed heap leach pads internal to the pits.
Mining The proposed mining operations are currently envisaged to be open pit mining operations using large hydraulic excavators (up to 60ktpd) or hydraulic shovels, wheel loaders, and haul trucks. The average stripping ratio is expected to be around 0.5:1 (waste to ore) and potentially lower. The highest production case examined (120ktpd of ore) would require mining up to 60Mtpy of material (ore and waste). Mining activities will include ripping, scraping, drilling, blasting, loading, hauling, together with support activities. Ore will be delivered to a moveable primary crusher, located near the pit, for subsequent crushed ore transportation by conveyors. A RoM stockpile located near the primary crusher would help with continuity of ore delivery over short periods. The mining operations are planned to be operated on three eight-hour shifts/day, seven days/week. Ore production is planned for 335 days/yr, based on 92% availability of the primary crushers over 365 days. Waste mining and support operations could be conducted up to 360 days/yr.
The mining concept is similar to a strip mine given the very shallow depth of the deposit. Modular mining areas (pits) are planned which may or may not have buffer zones separating them. For the higher production rates pit dimensions would be of the order of 2km by 1km. (With the geometry of the Klein Trekkopje, deposit there could ultimately be up to eight pits.) A typical pit tonnage would be over 40Mt, or between 1 and 2 years production (depending on the actual production rate), and assuming an ore thickness of 10m.
Mined ore will be dumped by large haul trucks into a moveable crusher. A “moveable” crusher is defined as movable every year or so (affecting production for about two days per move).
For the production scenarios up to and including 60ktpd, hydraulic excavators would be able to operate from the high wall, and could load trucks external to the pit excavation. For deeper ore, deeper than approximately 10m from the top of the orebody, excavators and trucks need to operate on lower benches within the pits. For the higher production rate scenarios (80ktpd and above), hydraulic shovels and trucks would operate within the pit excavation.
The following attributes are associated with the mining concept previously described:
• Pit voids are re-used as heaps, which simplifies the closure issues;
• Mobile crushers minimize truck travel;

UraMin, Inc. IV Trekkopje Uranium Project Preliminary Assessment
SRK Consulting (US), Inc. April 2007 Trekkopje.NI 43-101 Preliminary Assessment.163701.MA.006.doc
• Conveyors do the majority of the ore transportation, and the maximum conveyor distance is about 2km given adjacent mining/heap leach area modules;
• Mining up dip, albeit nominally, should facilitate solution flow from the base of the heap, thereby simplifying solution collection; and
• Given a stripping ratio of about 0.5:1 and an assumed swell of 50%, the heap leach pads should be at, or close to, original topography.
Metallurgy and Processing A metallurgical testwork program was developed for the Trekkopje Project to support the process and flow sheet development and to provide process and plant design criteria.
Three options were considered for processing the uranium/vanadium ore from the Trekkopje/Klein Trekkopje deposits:
• In-situ leaching: In-situ leaching is the simplest of the processes being considered whereby Injection wells are drilled into the ore through which a leach solution is injected into the deposit to dissolve the uranium and vanadium, or sprayed on ore placed in-situ. “Production wells” (additional drill holes, or the injection wells themselves) are used to withdraw the leach solution containing the uranium and vanadium from the deposit. No mining of the ore is required and thus, this is a low capital and operating cost option. The primary disadvantage with this option is the environmental permitting, as it is extremely difficult to demonstrate containment of the PLS without an engineered system, such as a geosynthetic liner. Therefore, this option has not been considered in detail at this time;
• Agitation or tank leaching: In agitation leaching the ore is mined and crushed to a fine powder and mixed with the leach solution to form a slurry which is agitated in a tank for a sufficient time for the metals to be dissolved. The PLS containing the uranium and vanadium is then processed to recover the metal values. The attrition tests completed to date indicate that milling will not be an economic means of uranium recovery; and
• Heap Leaching: After the ore is mined, it is crushed, and stacked on a Heap Leach Pad constructed by preparing a gently sloping surface, which is covered with one, or two layers of very low permeability geomembrane. Leach solution is sprayed on top of the heap, and PLS recovered as it flows from the bottom edge (toe) of the heap. Heap leaching offers the theoretical advantage of being able to control solution flow through the broken ore in the heap and increased metal recovery due to the finer size of the ore particles being leached, provided that ore is placed and solution applied in a uniform manner. Generally, the finer the particle size the ore is crushed to the faster the metal will be leached out of the ore and the greater will be the percentage of metal in the ore, which is ultimately recovered. However, the finer crush also means increased capital and operating costs. Heap leaching is the preferred approach from a cost perspective, and the results of the column testing thus far has confirmed this.
Initially, it was believed that for the Trekkopje ore, the conventional sulfuric acid process was not an option because of the chemical nature of the ore (high calcium carbonate content – more than 10.0%) which resulted in excessive reagent consumption and unfavorable economics and as such the sodium carbonate/bicarbonate process was deemed to be the only economical process for leaching the ore. However, it has since been suggested that gypsum containing ores may be

UraMin, Inc. V Trekkopje Uranium Project Preliminary Assessment
SRK Consulting (US), Inc. April 2007 Trekkopje.NI 43-101 Preliminary Assessment.163701.MA.006.doc
processed by the sulfuric acid technique, and metallurgical testing is ongoing to investigate this option..
Two proven pregnant leach solution (PLS) treatment schemes are ion exchange and direct precipitation. The test work to date has shown that the grade of the PLS is too low for a direct precipitation route and hence ion exchange will be the preferred process for the treatment of the PLS to recover U3O8 and V2O5.
Three sources of water have been identified for the Trekkopje Project; groundwater, seawater, and desalinated seawater. Given the selection of heap leaching and ion exchange as the preferred process route, a desalinated water source will be required since chloride in both the seawater and saline water will inhibit the ion exchange process. A reverse osmosis (RO) water treatment plant would be constructed to treat seawater, and would be pumped to the site. This is currently the preferred water source option.
All efforts are now being directed towards further column testwork and the design of the heap leaching option.
Infrastructure Various infrastructure and preliminary design scoping studies have been initiated to examine preferred options for improved site access, power supply and distribution, site facilities, and bulk water supply.
The selection of a carbonate/bi-carbonate heap leach and ion exchange as the preferred process route has resulted in desalinated seawater as the preferred bulk water supply option in the short term. A mine production rate of 100ktpd to be crushed and placed on the heaps and irrigated would require an annual bulk water supply of 12Mm3. This would be supplied from a conventional RO desalination plant to be located on the coast to the north of Swakopmund some 50km from the Trekkopje Project site.
Environmental/Permitting The Trekkopje Project is located in a sensitive, hyper-arid zone adjacent to two protected areas of national significance in Namibia (see Figure 9-1). Furthermore, the site is located with the //Gaingu Conservancy, a designated community-based natural resource management area. As consequence, potential social and environmental impacts have been carefully scoped and will be addressed in the project’s environmental and social management plans.
Substantial progress has been made in the EIA process. The initial scoping for the project commenced in early February 2006. Specialist studies have been completed for the following aspects of the project:
• Socio-economic analysis of the proposed project’s immediate area of influence;
• Baseline photo survey of the site;
• Geological assessment;
• Climate assessment;
• Topographic analysis;
• Land use and land capability assessment;

UraMin, Inc. VI Trekkopje Uranium Project Preliminary Assessment
SRK Consulting (US), Inc. April 2007 Trekkopje.NI 43-101 Preliminary Assessment.163701.MA.006.doc
• Archaeological and cultural site investigation;
• Vegetation survey; and
• Faunal survey.
Studies into the following are ongoing:
• Technical feasibility assessment–the feasibility of mining and processing the ore, with special emphasis on the supply of water and power;
• Surface water analysis;
• Air quality analysis;
• Radiology analysis;
• Sensitive area and visual impacts analysis;
• The public participation process is ongoing. This process is continually updated to accommodate changes in the technical design;
• Exploration activities at Trekkopje are currently being conducted in terms of a permit issued as an Exclusive Prospecting License (EPL). This EPL has an environmental management program (EMP) approved by the Ministry of Mines and Energy (MME). Work is currently underway on an addendum to this EMP to provide for management of impacts arising from heap leach treatment of bulk samples–a technology not previously addressed in the EMP; and
• The EIA report for the full project is currently on hold until the detailed impacts arising from the preferred options for processing and mining activities are finalized. Once the impact assessment and EMP chapters are complete, the report will be sent out for public scrutiny, followed by public meetings in Swakopmund and Windhoek. An independent review will be conducted simultaneously by the Southern African Institute for Environmental Assessment. After the review comments have been received, the report will be edited and submitted to the Ministry of Environment and Tourism (MET) for adjudication. A positive record of decision results in an environmental contract and an enforceable EMP.
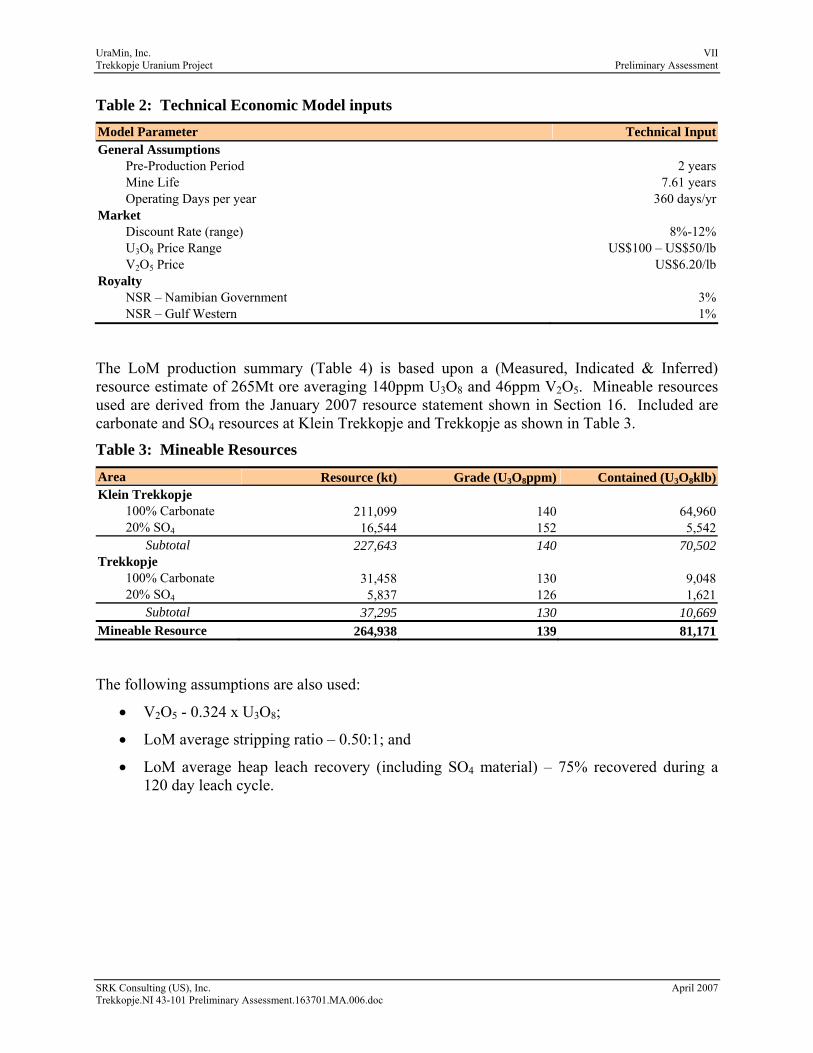
Capital and Operating Costs & Project Economics Scoping level evaluation of the preferred development options were conducted, and an indicative technical-economic analysis of the Trekkopje Project has been completed. This work is preliminary in nature and will be examined in more detail in the BFS. This Preliminary Assessment includes Inferred resources that have not been sufficiently drilled to have economic considerations applied to them. Until the additional drilling in progress is completed, and a final resource estimate is done, there is no certainty that Inferred resources will be converted to Measured and Indicated resources; therefore, there can be no certainty that this Preliminary Assessment will be realized. Technical inputs are shown in Table 2.
UraMin, Inc. VII Trekkopje Uranium Project Preliminary Assessment
SRK Consulting (US), Inc. April 2007 Trekkopje.NI 43-101 Preliminary Assessment.163701.MA.006.doc
Table 2: Technical Economic Model inputs Model Parameter Technical InputGeneral Assumptions Pre-Production Period 2 years Mine Life 7.61 years Operating Days per year 360 days/yrMarket Discount Rate (range) 8%-12% U3O8 Price Range US$100 – US$50/lb V2O5 Price US$6.20/lbRoyalty NSR – Namibian Government 3% NSR – Gulf Western 1%
The LoM production summary (Table 4) is based upon a (Measured, Indicated & Inferred) resource estimate of 265Mt ore averaging 140ppm U3O8 and 46ppm V2O5. Mineable resources used are derived from the January 2007 resource statement shown in Section 16. Included are carbonate and SO4 resources at Klein Trekkopje and Trekkopje as shown in Table 3.
Table 3: Mineable Resources
Area Resource (kt) Grade (U3O8ppm) Contained (U3O8klb)Klein Trekkopje 100% Carbonate 211,099 140 64,960 20% SO4 16,544 152 5,542 Subtotal 227,643 140 70,502Trekkopje 100% Carbonate 31,458 130 9,048 20% SO4 5,837 126 1,621 Subtotal 37,295 130 10,669Mineable Resource 264,938 139 81,171
The following assumptions are also used:
• V2O5 - 0.324 x U3O8;
• LoM average stripping ratio – 0.50:1; and
• LoM average heap leach recovery (including SO4 material) – 75% recovered during a 120 day leach cycle.

UraMin, Inc. VIII Trekkopje Uranium Project Preliminary Assessment
SRK Consulting (US), Inc. April 2007 Trekkopje.NI 43-101 Preliminary Assessment.163701.MA.006.doc
Table 4: LoM Production Summary Model Parameter TotalResource Resource (Mt) 264.9Mt Waste (Mt) 133.0Mt U3O8 Grade 140ppm V2O5 Grade 46ppm Contained U3O8 81.2Mlb Contained V2O5 26.3MlbProduction Mine Production Rate 100,000tpd Heap leach Recovery U3O8 75% Heap Leach Recovery V2O5 75% U3O8 Produced 60.9Mlb V2O5 Produced 19.7Mlb
LoM Operating costs are summarized in Table 5.
Table 5: LoM Operating Cost Summary (US$000) Description TotalMining $422,975Process $685,924G&A $113,242Total $1,222,141US$/t-ore $4.61US$/lb- U3O8 $20.08
LoM Capital costs are summarized in Table 6 Freight and import duties are included in the unit cost. VAT is excluded in all capital cost projections. A 25% contingency factor is applied to all capital cost estimates. Working capital is estimated based upon seven days cash, 30 days receivables and 60 days payables.
Table 6: LoM Capital Cost Summary (US$000) Description TotalMining $121,273Process $225,226Infrastructure $186,854Owner Costs $69,603Total $602,956
Mine capital costs are estimated to be US$121.3million over the LoM. Initial mining costs are estimated to be US$118.6million and sustaining costs are estimated to be US$2.6million.
Model results developed are summarized in Table 7. Based upon current assumptions presented in this section, pre-tax project NPV10% is US$1.0billion with an IRR of 67%.

UraMin, Inc. IX Trekkopje Uranium Project Preliminary Assessment
SRK Consulting (US), Inc. April 2007 Trekkopje.NI 43-101 Preliminary Assessment.163701.MA.006.doc
Table 7: Indicative Economic Results (US$000) Description Technical Input or ResultProduction Ore Mined (kt) 264,938 U3O8 Produced (klb) 60,878 V2O5 Produced (klb) 19,725 Operating Margin Gross Revenue U3O8 3,974,190 V2O5 122,292
Gross Revenue $4,096,482 Royalty Namibian Government $122,894 Gulf Western $40,965
Royalty $163,895 Gross Income from Mining $4,055,517
US$/ton-ore $15.31US$/lb- U3O8 $66.62
Operating Costs Production Mining $422,975 Process $685,924 G&A $113,242
Subtotal Production $1,222,142US$/ton-ore $4.61
US$/lb- U3O8 $20.08 Other Corporate Management Fee $8,050 Property Tax $0 Insurance $0
Subtotal Other $8,050 Total Operating Costs $1,230,192
US$/ton-ore $4.64US$/lb- U3O8 $20.21
Operating Margin (EBITDA) $2,825,325US$/ton-ore $10.66
US$/lb- U3O8 $46.41Capital Costs Mining $121,273 Process $225,226 Infrastructure $186,854 Owner $69,603 Total Capital Costs $602,956Cash Flow $2,222,369
IRR 67%NPV8% $1,206,946
NPV10% $1,041,720NPV12% $900,939

UraMin, Inc. X Trekkopje Uranium Project Preliminary Assessment
SRK Consulting (US), Inc. April 2007 Trekkopje.NI 43-101 Preliminary Assessment.163701.MA.006.doc
Conclusions and Recommendations The Trekkopje Project is potentially economic as a large scale open pit mine and heap-leach recovery uranium development project. Work to date, approximately mid-way to completion of a Bankable Feasibility Study, has demonstrated significant Indicated resources and the likelihood of conversion of Inferred resources to additional Indicated classification with the completion of in-fill drilling. Conceptual mining and preferred processing options have been selected, as have infrastructure requirements. The EIA/permitting process is well advanced. Preliminary economic models indicate the project will be able to produce uranium at about US$20/lb (LoM). The BFS is positive at this interim stage.
The recommendation is to complete the various ongoing BFS studies for a total expenditure of approximately US$820,000 by October, 2007, as detailed in Section 19 of this report.

UraMin, Inc. i Trekkopje Uranium Project Preliminary Assessment
SRK Consulting (US), Inc. April 2007 Trekkopje.NI 43-101 Preliminary Assessment.163701.MA.006.doc
Table of Contents SUMMARY (ITEM 3) .......................................................................................................................... I 1 INTRODUCTION (ITEM 4) ................................................................................................ 1-1
1.1 Terms of Reference & Purpose of the Report............................................................ 1-1 1.1.1 Sources of Information ................................................................................ 1-1 1.1.2 Terms of Reference ..................................................................................... 1-1 1.1.3 Definitions of Terms.................................................................................... 1-1 1.1.4 Purpose of Report ........................................................................................ 1-2 1.1.5 Conclusions and Recommendations............................................................ 1-2
1.2 Sources of Information .............................................................................................. 1-3 1.3 Mineral Resource Statements .................................................................................... 1-3 1.4 Qualifications of Consultants (SRK) ......................................................................... 1-3
2 RELIANCE ON OTHER EXPERTS (ITEM 5) ................................................................. 2-1 3 PROPERTY DESCRIPTION & LOCATION (ITEM 6) ...................................................... 3-1
3.1 Property Location....................................................................................................... 3-1 3.1.1 Property Description.................................................................................... 3-1 3.1.2 Surface Area of the Property ....................................................................... 3-1
3.2 Mineral Titles............................................................................................................. 3-2 3.2.1 Mineral Rights in Namibia .......................................................................... 3-2 3.2.2 Uramin Mineral Titles ................................................................................. 3-3 3.2.3 Other Titles.................................................................................................. 3-3 3.2.4 Requirements to Maintain the Claims in Good Standing............................ 3-4 3.2.5 Titles and Obligations/Agreements ............................................................. 3-6 3.2.6 Exceptions to Title Opinion......................................................................... 3-6
3.3 Royalty Agreements & Encumbrances...................................................................... 3-7 3.3.1 Royalty in Namibia...................................................................................... 3-7 3.3.2 Black Economic Empowerment Legislation in Namibia ............................ 3-8 3.3.3 Royalties – Share Purchase Agreement at Trekkopje ................................. 3-8 3.3.4 Required Permits & Status .......................................................................... 3-8
3.4 Environmental Liabilities........................................................................................... 3-9 4 ACCESSIBILITY, CLIMATE, LOCAL RESOURCES, INFRASTRUCTURE & PHYSIOGRAPHY (ITEM 7) ............................................................................................................ 4-1
4.1 Access to Property ..................................................................................................... 4-1 4.2 Climate....................................................................................................................... 4-1
4.2.1 Vegetation.................................................................................................... 4-2 4.3 Physiography.............................................................................................................. 4-4 4.4 Local Resources & Infrastructure .............................................................................. 4-4
4.4.1 Access Road ................................................................................................ 4-4 4.4.2 Water Supply ............................................................................................... 4-4 4.4.3 Electrical Power Supply .............................................................................. 4-4 4.4.4 Buildings & Ancillary Facilities.................................................................. 4-4 4.4.5 Political System........................................................................................... 4-5 4.4.6 Population.................................................................................................... 4-5 4.4.7 Economy...................................................................................................... 4-5 4.4.8 Local Resources........................................................................................... 4-5

UraMin, Inc. ii Trekkopje Uranium Project Preliminary Assessment
SRK Consulting (US), Inc. April 2007 Trekkopje.NI 43-101 Preliminary Assessment.163701.MA.006.doc
4.4.9 Regional Infrastructure................................................................................ 4-5 5 HISTORY (ITEM 8).............................................................................................................. 5-1
5.1 Ownership .................................................................................................................. 5-1 5.1.1 Klein Trekkopje Farm ................................................................................. 5-3 5.1.2 Arandis Farm............................................................................................... 5-4 5.1.3 Trekkopje Farm ........................................................................................... 5-4 5.1.4 Combined Land Holdings............................................................................ 5-5 5.1.5 Project Expenditures.................................................................................... 5-6
5.2 Historic Mineral Resource Estimates......................................................................... 5-6 6 GEOLOGIC SETTING (ITEM 9) ......................................................................................... 6-1
6.1 Regional Geology ...................................................................................................... 6-1 6.2 Local Geology............................................................................................................ 6-2
6.2.1 Local Lithology ........................................................................................... 6-3 6.2.2 Alteration..................................................................................................... 6-4 6.2.3 Structure ...................................................................................................... 6-4
7 DEPOSIT TYPES (ITEM 10) ............................................................................................... 7-1 8 MINERALIZATION (ITEM 11)........................................................................................... 8-1
8.1.1 Uraniferous calcrete deposits ...................................................................... 8-1 8.1.2 Trekkopje Mineralization ............................................................................ 8-1 8.1.3 Trekkopje Mineralization Types ................................................................. 8-2 8.1.4 Geochemistry............................................................................................... 8-2
9 EXPLORATION (ITEM 12) ................................................................................................. 9-1 9.1.1 Exploring Drilling Results........................................................................... 9-2
10 DRILLING (ITEM 13) ........................................................................................................ 10-1 11 SAMPLING METHOD & APPROACH............................................................................. 11-1
11.1 RC Drilling............................................................................................................... 11-1 11.2 Percussion Drilling................................................................................................... 11-1 11.3 Core Drilling ............................................................................................................ 11-2
12 SAMPLE PREPARATION, ANALYSES & SECURITY (ITEM 15) ............................... 12-1 12.1 Analytical Procedures .............................................................................................. 12-1 12.2 Sample Preparation & Assaying .............................................................................. 12-1 12.3 Quality Controls & Quality Assurance .................................................................... 12-1 12.4 Sample Security ....................................................................................................... 12-2 12.5 Analytical Laboratory Certifications ....................................................................... 12-2 12.6 Radiometric Analyses .............................................................................................. 12-2 12.7 Recommendations.................................................................................................... 12-4
13 DATA VERIFICATION (ITEM 16) ................................................................................... 13-1 13.1 Historical Data Confirmation................................................................................... 13-1 13.2 Confirmation RC Drilling Program ......................................................................... 13-1 13.3 Database Verification............................................................................................... 13-2 13.4 QA/QC Results ........................................................................................................ 13-2 13.5 Recommendations.................................................................................................... 13-3
14 ADJACENT PROPERTIES (ITEM 17).............................................................................. 14-1 15 MINERAL PROCESSING & METALLURGICAL TESTING (ITEM 18)....................... 15-1

UraMin, Inc. iii Trekkopje Uranium Project Preliminary Assessment
SRK Consulting (US), Inc. April 2007 Trekkopje.NI 43-101 Preliminary Assessment.163701.MA.006.doc
16 MINERAL RESOURCES & RESERVES (ITEM 19)........................................................ 16-1 16.1 Background Corrections .......................................................................................... 16-1 16.2 Disequilibrium ......................................................................................................... 16-3 16.3 Data Acquisition ...................................................................................................... 16-4 16.4 Bulk Density Measurements .................................................................................... 16-4 16.5 Data Analysis ........................................................................................................... 16-4 16.6 Geological Model..................................................................................................... 16-4
16.6.1 Topography................................................................................................ 16-5 16.6.2 Sulfate Surface........................................................................................... 16-5 16.6.3 Bedrock Surface ........................................................................................ 16-5
16.7 Compositing, Composite Statistics & Domain Analysis ......................................... 16-6 16.7.1 Compositing .............................................................................................. 16-6 16.7.2 Composite Statistics & Domain Analysis ................................................. 16-6
16.8 Variography ............................................................................................................. 16-7 16.9 Search Neighborhood Strategy/Resource Confidence Classification...................... 16-8 16.10 Block Model Extents................................................................................................ 16-8 16.11 Block Grade Interpolation........................................................................................ 16-9 16.12 Block Model Density Assignment ........................................................................... 16-9 16.13 Resource Model Validation ..................................................................................... 16-9 16.14 Resource Methodology and Classification ............................................................ 16-10 16.15 Resource Statement................................................................................................ 16-11 16.16 Resource Statement Trekkopje .............................................................................. 16-14 16.17 Resource Summary & Recommendations ............................................................. 16-16
17 OTHER RELEVANT DATA & INFORMATION (ITEM 20) .......................................... 17-1 17.1 Summary of Exploration Activities and Progress.................................................... 17-1 17.2 Resource Estimation ................................................................................................ 17-3
17.2.1 Initial Resource Estimate-September 2006 ............................................... 17-3 17.2.2 Current Resource Estimate-January 2007 ................................................. 17-3
17.3 Geotechnics.............................................................................................................. 17-4 17.3.1 Summary of Principal Objectives.............................................................. 17-4 17.3.2 Work Program ........................................................................................... 17-4 17.3.3 Results ....................................................................................................... 17-5
17.4 Hydrogeological Investigations ............................................................................... 17-6 17.4.1 Aquifer Dimensions, Abstractable Groundwater Reources ...................... 17-7 17.4.2 Groundwater Quality ................................................................................. 17-7 17.4.3 Interim Conclusions................................................................................... 17-7
17.5 Mining...................................................................................................................... 17-8 17.5.1 Mining Overview....................................................................................... 17-8 17.5.2 Mining Concept ......................................................................................... 17-8 17.5.3 Mine Design Attributes ............................................................................. 17-9 17.5.4 Mining Fleet .............................................................................................. 17-9 17.5.5 Mine Schedule, Equipment Availability and Utilization .......................... 17-9 17.5.6 Drilling ...................................................................................................... 17-9 17.5.7 Blasting.................................................................................................... 17-10 17.5.8 Loading.................................................................................................... 17-10 17.5.9 Hauling .................................................................................................... 17-10

UraMin, Inc. iv Trekkopje Uranium Project Preliminary Assessment
SRK Consulting (US), Inc. April 2007 Trekkopje.NI 43-101 Preliminary Assessment.163701.MA.006.doc
17.5.10 Mining Support Equipment ..................................................................... 17-10 17.5.11 Mine Geology and Engineering............................................................... 17-10 17.5.12 Mine Labor .............................................................................................. 17-11 17.5.13 Other Mine Operations ............................................................................ 17-11
17.6 Metallurgy and Process Description ...................................................................... 17-11 17.6.1 Processing Options .................................................................................. 17-11 17.6.2 Preferred Process Route .......................................................................... 17-13 17.6.3 Process Description ................................................................................. 17-14
17.7 Infrastructure.......................................................................................................... 17-15 17.7.1 Site Drainage ........................................................................................... 17-15 17.7.2 Access...................................................................................................... 17-16 17.7.3 Power Supply and Electrical Distribution ............................................... 17-16 17.7.4 Power Distribution................................................................................... 17-16 17.7.5 Communication ....................................................................................... 17-17 17.7.6 Fire Alarm System................................................................................... 17-17 17.7.7 Bulk Water Supply and Distribution ....................................................... 17-17 17.7.8 Desalinated Water Storage ...................................................................... 17-17 17.7.9 Fire Water Distribution............................................................................ 17-17 17.7.10 Fresh Water Distribution ......................................................................... 17-18 17.7.11 Potable Water Distribution ...................................................................... 17-18 17.7.12 Sewage Collection and Treatment........................................................... 17-18 17.7.13 Fuel and Lubricant Storage and Distribution .......................................... 17-18 17.7.14 Architectural Specifications .................................................................... 17-19 17.7.15 Workshop/Warehouse ............................................................................. 17-19 17.7.16 Administration Building.......................................................................... 17-19 17.7.17 Mine Dry and Canteen............................................................................. 17-19 17.7.18 Assay Laboratory..................................................................................... 17-19 17.7.19 Miscellaneous Site Buildings .................................................................. 17-19 17.7.20 Accommodation Buildings...................................................................... 17-20
17.8 Environmental Management.................................................................................. 17-20 17.8.1 Location................................................................................................... 17-20 17.8.2 Climate .................................................................................................... 17-20 17.8.3 Conditions................................................................................................ 17-20
17.9 Environmental Studies and Background Information............................................ 17-21 17.9.1 Permitting ................................................................................................ 17-21 17.9.2 Baseline Investigations............................................................................ 17-22 17.9.3 Impacts .................................................................................................... 17-23 17.9.4 Preliminary Environmental and Social Management Plan...................... 17-24
17.10 Preliminary Assessment......................................................................................... 17-25 17.10.1 Model Inputs............................................................................................ 17-26 17.10.2 Operating Costs ....................................................................................... 17-27 17.10.3 Capital Costs............................................................................................ 17-28 17.10.4 Indicative Technical-Economic Results .................................................. 17-31
18 INTERPRETATION AND CONCLUSIONS (ITEM 21) .................................................. 18-1 18.1 Opportunity .............................................................................................................. 18-1
18.1.1 Resources................................................................................................... 18-1

UraMin, Inc. v Trekkopje Uranium Project Preliminary Assessment
SRK Consulting (US), Inc. April 2007 Trekkopje.NI 43-101 Preliminary Assessment.163701.MA.006.doc
18.1.2 Mining and Processing .............................................................................. 18-1 18.2 Project Risks ............................................................................................................ 18-1
18.2.1 Commodity Price Fluctuation.................................................................... 18-1 18.2.2 Infrastructure ............................................................................................. 18-1 18.2.3 Metallurgical Characteristics..................................................................... 18-1 18.2.4 Environmental/Socio-Economic Considerations....................................... 18-2
19 RECOMMENDATIONS (ITEM 22) .................................................................................. 19-1 19.1 Drilling..................................................................................................................... 19-1 19.2 Resource Estimation Update.................................................................................... 19-1 19.3 Metallurgical Testing ............................................................................................... 19-1 19.4 Mining...................................................................................................................... 19-1 19.5 Processing/ Process Flow Sheet/Process Design ..................................................... 19-1 19.6 Infrastructure............................................................................................................ 19-2 19.7 Environmental and Permitting ................................................................................. 19-2 19.8 Economic Analysis and BFS Report........................................................................ 19-2 19.9 Proposed Budget ...................................................................................................... 19-2
19.9.1 Phase I Proposed Budget ........................................................................... 19-2 19.9.2 Phase II Proposed Budget.......................................................................... 19-2
20 REFERENCES (ITEM 23) .................................................................................................. 20-1 21 GLOSSARY ........................................................................................................................ 21-1
21.1 Mineral Resources & Reserves................................................................................ 21-1 21.2 Glossary ................................................................................................................... 21-2
List of Tables Table 1: Trekkopje Project Combined Insitu Resources .....................................................................II
Table 2: Technical Economic Model inputs .....................................................................................VII
Table 3: Mineable Resources............................................................................................................VII
Table 4: LoM Production Summary ................................................................................................VIII
Table 5: LoM Operating Cost Summary (US$000).........................................................................VIII
Table 6: LoM Capital Cost Summary (US$000) .............................................................................VIII
Table 7: Indicative Economic Results (US$000)............................................................................... IX
Table 1.3.1: Trekkopje Project Combined Insitu Resources ............................................................ 1-3
Table 3.1.2.1: Trekkopje Project Property Boundary ....................................................................... 3-2
Table 5.1.1: Summary of Exploration Activities: Trekkopje Properties 1970 – 2005 ..................... 5-2
Table 6.1.1: Stratigraphic column of the Central Damara Belt ........................................................ 6-2
Table 6.2.1.1: Lithologic Associations of Trekkopje Ssediments .................................................... 6-4
Table 10.1: Summary of UraMin drilling at Trekkopje Project (November 2006)........................ 10-1
Table 16.1.1: Items of background Radiation for Trekkopje and Klein Trekkopje ....................... 16-2

UraMin, Inc. vi Trekkopje Uranium Project Preliminary Assessment
SRK Consulting (US), Inc. April 2007 Trekkopje.NI 43-101 Preliminary Assessment.163701.MA.006.doc
Table 16.7.2.1: eU3O8 ppm Composite Statistics by Grade Shell Zone ......................................... 16-7
Table 16.8.1: Variogram Model - Klein Trekkopje & Trekkopje Deposits ................................... 16-7
Table 16.9.1: Search parameters/Confidence Classification - Klein Trekkopje deposit ................ 16-8
Table 16.9.2: Search Parameters/Confidence Classification - Trekkopje Deposit. ........................ 16-8
Table 16.10.1: Block Model Limits - Klein Trekkopje Deposit..................................................... 16-9
Table 16.10.2: Block Model Limits - Trekkopje Deposit............................................................... 16-9
Table 16.12.1: Block Model Density.............................................................................................. 16-9
Table 16.13.1: Klein Trekkopje Block Model/Composite Statistics eU3O8 (ppm) ...................... 16-10
Table 16.13.2: Trekkopje Block Model/Composite Statistics eU3O8 (PPM) ................................... 16-10
Table 16.15.1: Trekkopje Project Combined Insitu Resources .................................................... 16-11
Table 16.15.2 Klein Trekkopje Resources..................................................................................... 16-12
Table 16.15.3: Klein Trekkopje Measured Resources by CoG .................................................... 16-13
Table 16.15.4: Klein Trekkopje Indicated Resources by CoG ..................................................... 16-13
Table 16.15.5: Klein Trekkopje Inferred Resources by CoG ....................................................... 16-14
Table 16.16.1: Trekkopje Resources ............................................................................................ 16-14
Table 16.16.2: Trekkopje Indicated Resources by CoG............................................................... 16-15
Table 16.16.3: Trekkopje Inferred Resources by CoG................................................................. 16-15
Table 17.1: BFS Project Teams and Responsibilities..................................................................... 17-1
Table 17.10.1.1: Model Parameters .............................................................................................. 17-26
Table 17.10.1.2: Mineable Resources........................................................................................... 17-26
Table 17.10.1.3: LoM Production Summary ................................................................................ 17-27
Table 17.10.2.1 LoM Operating Cost Summary (US$000).......................................................... 17-27
Table 17.10.2.2: LoM Mine Operating Costs ............................................................................... 17-27
Table 17.10.2.3: LoM Process Operating Costs ........................................................................... 17-28
Table 17.10.2.4: LoM G&A Operating Costs............................................................................... 17-28
Table 17.10.3.1: LoM Capital Cost Summary (US$000) ............................................................. 17-29
Table 17.10.3.2: Mine Capital Costs (US$000)............................................................................ 17-29
Table 17.10.3.3: Process Capital Costs (US$000)........................................................................ 17-29
Table 17.10.3.4: Infrastructure Capital Costs (US$000) .............................................................. 17-30
Table 17.10.3.5: Owner Capital Costs (US$000) ......................................................................... 17-31
Table 17.10.4.1: Indicative Economic Results (US$000)............................................................. 17-32
Table 19.9.1.1: Phase I Estimated Costs......................................................................................... 19-2

UraMin, Inc. vii Trekkopje Uranium Project Preliminary Assessment
SRK Consulting (US), Inc. April 2007 Trekkopje.NI 43-101 Preliminary Assessment.163701.MA.006.doc
List of Figures Figure 3-1: Location Map Namibia ................................................................................................ 3-11
Figure 3-2: Location of Uranium in Namibia ................................................................................. 3-12
Figure 3-3: Trekkopje Project Location Map ................................................................................. 3-13
Figure 6-1: Tectonostratigraphic Map of Namibia ........................................................................... 6-6
Figure 6-2: Trekkopje Project Geology Map.................................................................................... 6-7
Figure 6-5: Fluviatile Setting of Trekkopje Deposits, Namibia ....................................................... 6-8
Figure 9-2: Plan Map of Phase 2A RC Drilling – Trekkopje Project............................................... 9-3
Figure 9-3: Drill Hole Location Map – Trekkopje Deposit, All Holes; 200 x 200m Grid............... 9-4
Figure 9-4: Drill Hole Location Map – Klein Trekkopje Deposit, All Holes; 200 x 200m Grid ..... 9-5
Figure 11-1: Gamma Log for TKPC159......................................................................................... 11-3
Figure 12-1: Quality Control Sample Insertion Map-Template ..................................................... 12-5
Figure 12-2: Gamma Log of Percussion Hole TKPC159 – Trekkopje Deposit ............................. 12-6
Figure 12-3: Half-Amplitude Method of Grade Estimation ........................................................... 12-7
Figure 13-1: Trekkopje Deposit Comparison of XRF U3O8 and Gamma Log eU3O8.................... 13-4
Figure 13-2: Klein Trekkopje Deposit Comparison of XRF U3O8 and Gamma Log eU3O8.......... 13-5
Figure 13-3: SGS Analyses with ALS-Chemex Check Analyses .................................................. 13-6
Figure 13-4: Duplicate Analyses .................................................................................................... 13-7
Figure 13-5: Example Gamma-Log Comparison for TKRC-037, UraMin vs GAP....................... 13-8
Figure 13-6: UraMin vs GAP eU3O8 Comparison for 0.5m Intervals............................................. 13-9
Figure 13-7: Calibration Hole TK021 – Gamma Log CPS Plot Over Time ................................ 13-10
Figure 16-1: XRF and eU3O8 Data - Trekkopje............................................................................. 16-17
Figure 16-2: X-Y Scatter Plot of XRF and eU3O8 Data - Klein Trekkopje.................................. 16-18
Figure 16-3: Disequilibrium with Depth – Trekkopje .................................................................. 16-19
Figure 16-4: Histogram of Relative Disequilibrium at Klein Trekkopje Deposit ........................ 16-20
Figure 16-5: Disequilibrium with Depth – Klein Trekkopje ........................................................ 16-21
Figure 16-6: CF Plot of Trekkopje eU3O8 (ppm) Composites ...................................................... 16-22
Figure 16-7: Klein Trekkopje Relative Variograms ..................................................................... 16-23
Figure 16-8: Klein Trekkopje Deposit 500m Level Plan.............................................................. 16-24
Figure 16-9: Trekkopje Deposit 760m Level Plan ....................................................................... 16-25
Figure 16-10: Klein Trekkopje Swath Plot East-West eU3O8 (ppm)............................................ 16-26
Figure 16-11: Klein Trekkopje Swath Plot North-South eU3O8 (ppm) ........................................ 16-27

UraMin, Inc. viii Trekkopje Uranium Project Preliminary Assessment
SRK Consulting (US), Inc. April 2007 Trekkopje.NI 43-101 Preliminary Assessment.163701.MA.006.doc
Figure 16-12: Klein Trekkopje Swath Plot Elevations eU3O8 (ppm) ........................................... 16-28
Figure 16-13: Trekkopje Swath Plot East-West eU3O8 (ppm)...................................................... 16-29
Figure 16-14: Trekkopje Swath Plot North-South eU3O8 (ppm) .................................................. 16-30
Figure 16-15: Trekkopje Swath Plot Elevations eU3O8 (ppm) ..................................................... 16-31
Figure 16-16: Klein Trekkopje Block Model CF Plot .................................................................. 16-32
Figure 17-1: Conceptual Layout of Pits, Heaps and Dumps ........................................................ 17-33
Figure 17-2: North-South Profile of In-Pit Heap Leach Pad ........................................................ 17-34
Figure 17-3: Location of the Trekkopje Project ........................................................................... 17-35
Figure 17-4: Trekkopje EIA Process ............................................................................................ 17-36
List of Appendices
Appendix A Certificates of Authors
Appendix B Technical Economic Model

UraMin, Inc. 1-1 Trekkopje Uranium Project Preliminary Assessment
SRK Consulting (US), Inc. April 2007 Trekkopje.NI 43-101 Preliminary Assessment.163701.MA.006.doc
1 Introduction (Item 4) 1.1 Terms of Reference & Purpose of the Report 1.1.1 Sources of Information The Trekkopje Project is a very large, low-grade, shallow uranium resource that consists of two uranium deposits, the Trekkopje deposit and the Klein Trekkopje deposit. The Project area is located on nearly flat, gently west-sloping topography in the very arid desert region of western Namibia, southwestern Africa. The deposits, located approximately 7.0km apart, are broad, shallow, calcrete-hosted uranium deposits hosted in calcium carbonate cemented (calcrete) conglomerates of Tertiary age which lie on a peneplaned surface of Precambian/Cambrian age meta-sedimentary rocks and intrusive granite.
The Trekkopje project uranium mineralization was first drilled in the 1970s, had some confirmatory work performed on it during the 1990s, and was re-established as a uranium development project by UraMin in 2005. Confirmation and new drilling by UraMin in 2006 has brought the Trekkopje deposits to Measured, Indicated, and Inferred resource status (by CIM resource classifications). Drilling and other studies are continuing as the Trekkopje advances in the Feasibility Study process.
This Preliminary Assessment report is a technical document based on the information currently available for the Trekkopje Project. This report has been prepared at the request of UraMin Inc. (stock symbol is UMN on the Toronto (TSX) and the London (AIM) stock exchanges), with offices at 204 Rivona Road, Block A, Morningside, Sandton, Gauteng, 2057, South Africa (web site: www.uramin.com).
1.1.2 Terms of Reference SRK Consulting (U.S.) Inc. (SRK) was commissioned by UraMin Inc. (UraMin) in May of 2005 to prepare a Bankable Feasibility Study (BFS) on the Trekkopje Project, including a Technical Report that is compliant with Canadian National Instrument 43-101 requirements. The initial Technical Report, dated November 28, 2006 was filed on www.sedar.com. This report is an updated NI 43-101 Technical Report, as a Preliminary Assessment for the Trekkopje Project, and it includes updated NI 43-101 compliant resource estimates for the project and Preliminary Assessment information on the status of the BFS as of March 20, 2007. It is anticipated that updated NI 43-101 Technical Reports will be forthcoming as the BFS continues to completion. This Technical Report contains basic descriptive information on the project, historical project data, UraMin’s in-fill drilling and other project activities during the period September 2006 through January 2007, discussion in Section 16.0 on the updated resource estimates and procedures used by SRK Consulting (U.S.) Inc., and Other Information relating to the BFS in progress (Section 17).
1.1.3 Definitions of Terms Metric (SI System) units of measure are generally used in this report as these are the commonly used units of measure in Namibia. Analytical results are reported as parts per million (ppm) contained for uranium (the element U, often analyzed for and expressed as U3O8) and vanadium (the element V, often expressed as V2O5). Uranium determinations by the equivalent of chemical analyses will be stated in this report as ppm U3O8. Uranium determinations by conversion of radiometric probe measurements will be stated in this report as ppm eU3O8 (“e”

UraMin, Inc. 1-2 Trekkopje Uranium Project Preliminary Assessment
SRK Consulting (US), Inc. April 2007 Trekkopje.NI 43-101 Preliminary Assessment.163701.MA.006.doc
for equivalent). Calcium (Ca) and sulfur (S, directly related to sulfate [SO4] content) are reported as percent (%), and other trace elements are commonly reported in ppm.
Tables and Figures in this report are numbered consecutively and referenced to the major sections of the report (i.e., Figures 17.1 through 17.5 for figures in Section 17.0).
The metric system has been used throughout this report unless otherwise stated. All currency is in U.S. dollars. Market prices are reported in US$ per pound of U3O8. Tonnes are metric of 1,000kg, or 2,204.6lbs.
1.1.4 Purpose of Report The purpose of this report on the Trekkopje Project is to provide an updated resource estimate, and to provide interim information on the BFS. This report is prepared according to Canadian National Instrument NI 43-101 guidelines. Form NI 43-101F1 was used as the format for this report.
The intent of this technical report is to provide the reader with a comprehensive review of the project activities conducted through February 2007 at the Trekkopje Project.. This report is prepared using the industry accepted “Best Practices and Reporting Guidelines” for disclosing mineral exploration information, and the revised Canadian Securities Administrators guidelines for NI 43-101 and Companion Policy 43-101CP.
The focus of this Preliminary Assessment Technical Report is on Resource updates and Other Information related to the status of BFS studies in progress; Sections 16 and 17, respectively, of this report. Other sections of this report may be abbreviated in content, and the reader is referred to the technical report dated November 28, 2006 titled “Initial Resource Estimate for The Trekkopje Project Feasibility Study, Swakopmund and Karibib Districts, Erongo Region, Namibia” for further detail (SRK, 2006).
1.1.5 Conclusions and Recommendations Initial resource estimation in September, 2006 for the Trekkopje and Klein Trekkopje uranium deposits confirmed or exceeded historical resource estimates, and established NI 43-101 compliant resources according to CIM categories of resource classification. In-fill drilling since the initial resource estimate in September 2006 has converted a substantial amount of Inferred resources to Indicated resources for both deposits and provides a more robust resource model. In addition, BFS activities advanced include metallurgical testing, selection of heap leaching as the preferred processing option, advancements on project permitting, and scoping of project infrastructure options including water supply, access routes, and proposed site facilities. A recommended program of in-fill drilling of both deposits from the existing 200m x 200m grid with 5-spot RC drillholes is ongoing and will be the basis for a final resource model update prior to mine planning and reserve estimation. A recommended budget of US$800,000 for follow-up Phase I and Phase II programs combined is suggested to cover the cost of additional drilling, and other ongoing studies to bring the BFS to completion in a six month time frame.
Additional geological work is required to provide a deposit model with clear definition of mineralized envelopes, depth of alluvium and gypsum content relative to uranium mineralization. Additional work will include mine planning, metallurgical testing, a definitive process flow sheet, infrastructure scoping studies, completion of the EIA and EMP permitting, refinement of estimated capital and operating costs.
UraMin, Inc. 1-3 Trekkopje Uranium Project Preliminary Assessment
SRK Consulting (US), Inc. April 2007 Trekkopje.NI 43-101 Preliminary Assessment.163701.MA.006.doc
1.2 Sources of Information The author reviewed data provided by UraMin and conducted field investigations to confirm the data. Those data sources include hard copy data and files and digital files located in the offices of UraMin, Johannesburg, South Africa. In addition, drill core and reverse circulation (RC) and percussion drill cuttings were examined at the camp site for the Trekkopje Project. UraMin’s Chief Geologist John Sanders, Senior Geologist Andrew Pedley, and site Project Geologist Jonathan Church facilitated the data review and onsite investigations, provided historical and UraMin project information, and provided input to discussions on the resource estimation process. The drill hole assay database was prepared by UraMin and verified by SRK.
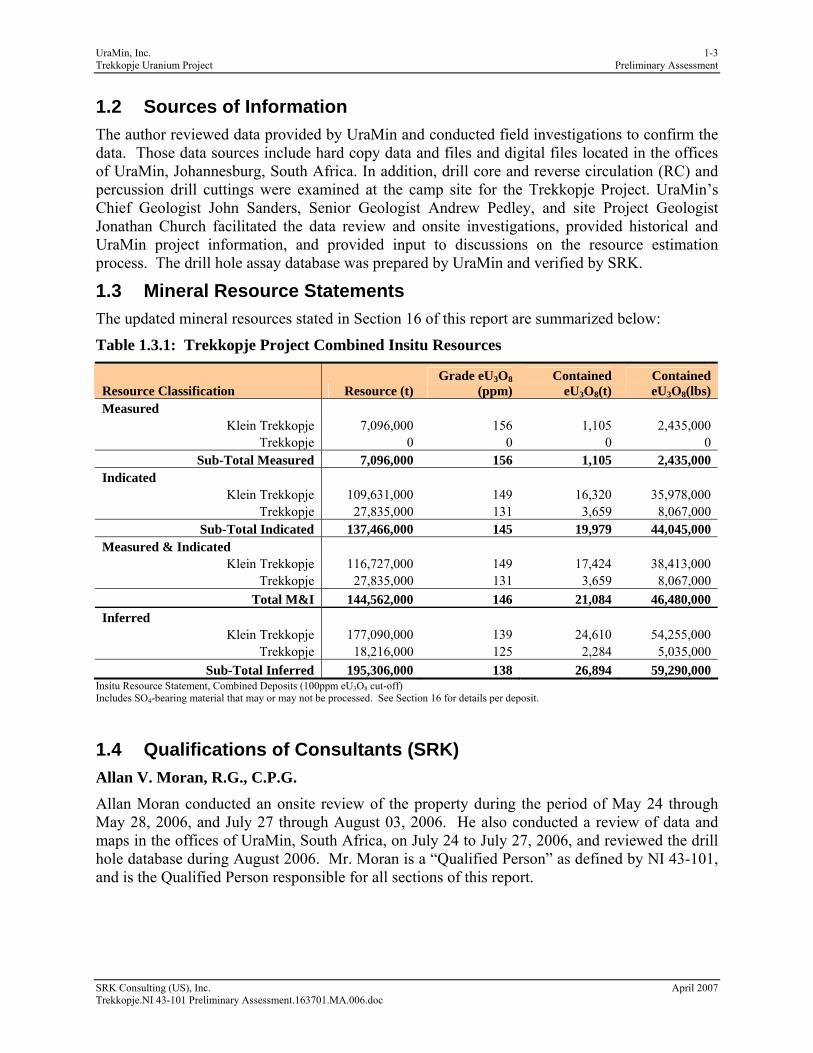
1.3 Mineral Resource Statements The updated mineral resources stated in Section 16 of this report are summarized below:
Table 1.3.1: Trekkopje Project Combined Insitu Resources
Resource Classification Resource (t) Grade eU3O8
(ppm) Contained
eU3O8(t) Contained eU3O8(lbs)
Measured Klein Trekkopje 7,096,000 156 1,105 2,435,000
Trekkopje 0 0 0 0 Sub-Total Measured 7,096,000 156 1,105 2,435,000
Indicated Klein Trekkopje 109,631,000 149 16,320 35,978,000
Trekkopje 27,835,000 131 3,659 8,067,000 Sub-Total Indicated 137,466,000 145 19,979 44,045,000
Measured & Indicated Klein Trekkopje 116,727,000 149 17,424 38,413,000
Trekkopje 27,835,000 131 3,659 8,067,000 Total M&I 144,562,000 146 21,084 46,480,000
Inferred Klein Trekkopje 177,090,000 139 24,610 54,255,000
Trekkopje 18,216,000 125 2,284 5,035,000 Sub-Total Inferred 195,306,000 138 26,894 59,290,000
Insitu Resource Statement, Combined Deposits (100ppm eU3O8 cut-off) Includes SO4-bearing material that may or may not be processed. See Section 16 for details per deposit.
1.4 Qualifications of Consultants (SRK) Allan V. Moran, R.G., C.P.G. Allan Moran conducted an onsite review of the property during the period of May 24 through May 28, 2006, and July 27 through August 03, 2006. He also conducted a review of data and maps in the offices of UraMin, South Africa, on July 24 to July 27, 2006, and reviewed the drill hole database during August 2006. Mr. Moran is a “Qualified Person” as defined by NI 43-101, and is the Qualified Person responsible for all sections of this report.

UraMin, Inc. 1-4 Trekkopje Uranium Project Preliminary Assessment
SRK Consulting (US), Inc. April 2007 Trekkopje.NI 43-101 Preliminary Assessment.163701.MA.006.doc
Frank Daviess, M. AusImm, R. SME Frank Daviess examined the Trekkopje project database , conducted geo-statistical evaluations of the database and constructed the block model uses for resource estimation. Mr. Daviess is a Qualified Person responsible for the resources stated in this report.

UraMin, Inc. 2-1 Trekkopje Uranium Project Preliminary Assessment
SRK Consulting (US), Inc. April 2007 Trekkopje.NI 43-101 Preliminary Assessment.163701.MA.006.doc
2 Reliance on Other Experts (Item 5) The author, as a Qualified Person, has relied upon data provided by UraMin Inc. for the basic data that supports the Trekkopje Uranium Project exploration results and resource estimates. In the opinion of the author, that information is both credible and verifiable in the field. It is also the opinion of the author, that no material information relative to the Trekkopje Project has been neglected or omitted from the database. Sufficient information is available to prepare this report, and any statements in this report related to deficiency of information are directed at information which, in the opinion of the author, has not yet been gathered, is intended to be gathered, or is recommended information to be collected as the project moves forward.
The author has relied upon others to describe issues of mineral rights and land title in Namibia (referring respectively to Sections 4.4 – Mineral Rights in Namibia, and Section 4.6 – Titles and Obligations/Agreements). The author is not a qualified person with respect to environmental laws in Namibia, regarding issues addressed in Section 4.9 of this report – Environmental Liabilities. And the author has compile Other Information (Section 17) from several consulting companies providing input, engineering and design work toward completion of the BFS.
The author’s statements and conclusions in this report are based upon the information at the time of the property visit, and the exploration database and BFS studies as of January 2007. Exploration is ongoing at the Trekkopje Project, particularly in the form of in-fill drilling at closer spacing to improve the confidence and understanding of grade continuity and therefore in resource estimation classifications. The Preliminary Assessment information listed in Section 17 of this report are a snapshot in time and therefore are preliminary in nature, and subject to change at the BFS evaluations continue. It is to be expected that new data and exploration results may change some interpretations, conclusions, and recommendations going forward.
This report includes technical information, which requires subsequent calculations to derive sub-totals, totals, and weighted averages. Such calculations inherently involve a degree of rounding and consequently can introduce a margin of error. Where these rounding errors occur, SRK does not consider them to be material.
The author and SRK are not insiders, associates, or affiliates of UraMin. The results of this Technical Report are not dependent upon any prior agreements concerning the conclusions to be reached, nor are there any undisclosed understandings concerning any future business dealings between UraMin and the authors or SRK. SRK will be paid a fee for its work in accordance with normal professional consulting practice.

UraMin, Inc. 3-1 Trekkopje Uranium Project Preliminary Assessment
SRK Consulting (US), Inc. April 2007 Trekkopje.NI 43-101 Preliminary Assessment.163701.MA.006.doc
3 Property Description & Location (Item 6)
3.1 Property Location The Trekkopje Project is located in the Republic of Namibia, which is an independent republic bordered by the Atlantic Ocean and situated in southwestern Africa, north of South Africa, west of Botswana, and south of Angola Figure 3-1. The Trekkopje Project is approximately 65km in a straight line northeast of the coastal town of Swakopmund, which is approximately 30km north of the major port of Walvis Bay.
The Trekkopje Project is located near two operating uranium mines, Rössing and Langer Heinrich, as well as Valencia, which is a prospective uranium mine (Figure 3-2). The Rössing Uranium mine is located 35km south of the Trekkopje Project area and has been in production since 1977. The Langer Heinrich uranium mine, which is a calcrete uranium deposit similar to Trekkopje, is located 80km southeast of the Trekkopje Project and began production in September 2006. The Valencia Property, which is a granite-hosted uranium deposit similar to Rössing, is an advanced stage exploration project.
The location of the Trekkopje Project mineral occurrence is shown with respect to other uranium occurrences in the Spitzkoppe region in Figure 3-2. (map from UraMin Inc CPR, 2006)
3.1.1 Property Description The Trekkopje Project mineral property includes parts of the Trekkopje, Klein Trekkopje, and Arandis farms. The project area consists of two deposits in close proximity to each other – Trekkopje and Klein Trekkopje. The Trekkopje deposit is the smaller of the two and lies on the Trekkopje Farm. The Klein Trekkopje deposit straddles the boundary between the Klein Trekkopje and Arandis Farms (Turgis, 2005). The Trekkopje Project is located at approximately latitude 22°10' South and longitude 14°15’ to 15° East.
3.1.2 Surface Area of the Property The Trekkopje mineral property covers approximately 37,368ha (Turgis, 2006) in EPL 2218, and an additional 91,611ha in EPL 3573, for a combined total of 128,979ha .
The coordinates of the property boundary are shown on Figure 3-3, and listed with decimal degrees of latitude and longitude in Table 3.1.2.1.

UraMin, Inc. 3-2 Trekkopje Uranium Project Preliminary Assessment
SRK Consulting (US), Inc. April 2007 Trekkopje.NI 43-101 Preliminary Assessment.163701.MA.006.doc
Table 3.1.2.1: Trekkopje Project Property Boundary License Corner Latitudeº Longitudeº EPL 2218 EPL 2218 1 -22.19195264 14.70342069 EPL 2218 2 -22.04332473 14.96668951 EPL 2218 3 -22.12939243 15.01715965 EPL 2218 4 -22.17715706 15.05048668 EPL 2218 5 -22.17483224 14.94156327 EPL 2218 6 -22.27478369 14.75884397 EPL 3573 EPL 3573 1 -22.05565801 14.93883613 EPL 3573 2 -22.19195264 14.70342069 EPL 3573 3 -22.27478369 14.75884397 EPL 3573 4 -22.17483224 14.94156327 EPL 3573 5 -22.17699956 15.05299684 EPL 3573 6 -22.10842393 15.00440669 EPL 3573 7 -22.04157823 14.96580272 EPL 3573 8 -22.00224763 15.04135550 EPL 3573 9 -22.06810970 15.05939814 EPL 3573 10 -22.10862691 15.03115111 EPL 3573 11 -22.16951383 15.09125486 EPL 3573 12 -22.18659680 15.05298607 EPL 3573 13 -22.23697517 15.05162406 EPL 3573 14 -22.38937697 14.73427117 EPL 3573 15 -22.18277106 14.59366564 EPL 3573 16 -22.04146230 14.83965796
3.2 Mineral Titles UraMin controls 128,979ha of land covering the former Trekkopje, Klein Trekkopje, and Arandis farm exploration license areas, which cover the Trekkopje deposit and the Klein Trekkopje deposit (formerly called the Klein Trekkopje/Arandis deposits that were split only by a property line), and an area surrounding the deposits. The center of the Trekkopje Project, consisting of the Trekkopje and Klein Trekkopje deposits and the exploration licenses described in this report, is located at approximately latitude 22°10' South and longitude 14°15’ to 15° East (Figure 3-1 and 3-3).
UraMin Namibia (Pty) Limited [UraMin Namibia] holds the following licenses in respect of the Trekkopje Project area:
• Exclusive Prospecting License (EPL) Number 2218 covering 37,368ha which expires on November 02, 2007; and
• EPL Number 3573 covering 91,611ha expires on November 05, 2007.
UraMin plans to complete a feasibility study on the Trekkopje Project in 2007 and in the event the results of the feasibility study are positive, UraMin plans to apply for a Mining License for the Property.
3.2.1 Mineral Rights in Namibia In Namibia, all mineral rights are vested in the state for the benefit of its citizens and are regulated by the Minerals (Prospecting and Mining) Act 33 of 1992. The Ministry of Mines and

UraMin, Inc. 3-3 Trekkopje Uranium Project Preliminary Assessment
SRK Consulting (US), Inc. April 2007 Trekkopje.NI 43-101 Preliminary Assessment.163701.MA.006.doc
Energy (MME) facilitates and regulates the responsible development and sustainable utilization of mineral and energy resources for the benefit of all Namibians. All applications and issuance of mineral prospecting licenses and enforcement of the regulations fall within the purview of the MME.
The Non-Exclusive Prospecting License (NEPL) permits non-exclusively prospecting in any open ground anywhere in the country not restricted by other mineral rights, and is issued for 12 months.
Mining Claims are issued for development of small-scale mines and mineral deposits, and are valid for a period of three years. Two-year extensions can be granted if the claim is being worked or developed. A maximum of ten claims can be held at any one time.
A Reconnaissance License is reserved for regional remote sensing techniques (radiometric, aeromagnetics, etc), and issued for a six-month term. It is renewable in exceptional cases, and can be made exclusive. A geological evaluation and work plan must be submitted with the application.
An Exclusive Prospecting License (EPL) permits prospecting in areas of up to 100,000ha (386mi2) in extent and is valid for a three-year term. It conveys exclusive exploration rights to the land and may be extended twice for two year periods if demonstrable exploration progress is made. A geological evaluation and work plan, including expenditure accounting estimates, are required with submission for the license.
A Mineral Deposit Retention License (MDRL) allows prospectors to retain rights to mineral deposits which are uneconomical to develop and mine immediately. The license is issued for an initial five-year period, with two-year renewal extensions. The license requires the holder to meet work and expenditure obligations.
A Mining License conveys to the holder the exclusive mining rights in the license area for a period of twenty-five years or the life of the mine and is renewable for fifteen years at a time. The license applicants must have the financial and technical resources to develop and operate the mine.
3.2.2 Uramin Mineral Titles UraMin, through its wholly-owned subsidiary UraMin Namibia (Pty) Limited (previously named Gulf Western Trading Namibia (Pty) Limited), is the owner of EPL No. 2218 over an area of 37,368ha referred to as the “Trekkopje Property” (Trekkopje Project in this report). EPL 2218 was approved by the Ministry of Mines and Energy (MME) on November 03, 2006 for a period of one year; the licence is renewable. UraMin Namibia (Pty) Limited also owns EPL 3573 which surrounds EPL 2218 with 91,611 additional hectares (See Figure 3-3 and Table 3-1). Approval was received on November 06, 2006 for EPL 3573. It is UraMin’s intent to apply for conversion of the EPL’s to Mining Licenses in 2007, pending positive results of the ongoing Feasibility Study.
3.2.3 Other Titles A stone quarrying operation not held by UraMin is present within the boundary of UraMin’s EPL 2218, in the northwestern corner at co-ordinates 471635 East, 7547305 North in UTM WGS84 (Figure 3-3). The operation by Stone Evolution has been in operation since November 2005, under prospecting license 2353 of December 7, 2001 (from Note for the Record, 2006,

UraMin, Inc. 3-4 Trekkopje Uranium Project Preliminary Assessment
SRK Consulting (US), Inc. April 2007 Trekkopje.NI 43-101 Preliminary Assessment.163701.MA.006.doc
letter from UraMin Namibia (Pty) Ltd on August 25, 2006). The stone quarry has no conflict with current or planned operations at the Trekkopje Project.
3.2.4 Requirements to Maintain the Claims in Good Standing The rights and obligations of the holder of an EPL in terms of the provisions of the Minerals Act, 1992, are described in the following list (Lorentz and Bone, 2006):
• The holder of an Exclusive Prospecting License is entitled to carry on prospecting operations in respect of such mineral or group of minerals specified in the License. The holder of the EPL is further entitled to remove any mineral or group of minerals other than a control mineral or sample of such mineral or group of minerals for any purpose other than sale or disposal, found or incidentally won in the course of the prospecting operation to any other place within Namibia.
The holder of the EPL is additionally entitled, with the written permission of the Commissioner:
• To remove any mineral or group of minerals or any control mineral or sample of such mineral for any purpose other than sale or disposal from any place where it was found or incidentally won in the course of prospecting operation to any place whether within or outside Namibia;
• To remove any mineral or group of mineral for purpose of sale or disposal from any place where it was found or incidentally won in the course of the prospecting operation and to sell or otherwise dispose any such mineral or group of minerals;
• The holder of EPL who has removed any mineral or group of minerals other than a control mineral or any sample of such mineral or group of minerals from the place where it was found for any purpose other than for sale or disposal to any place within Namibia shall inform the Commissioner in writing of such removal not later than 14 days or such longer period as the Commissioner may allow after such removal and provide particulars of the nature of such sample, mineral or group of minerals and the place to which it has been so removed.
• The holder of EPL License is further entitled to carry on such other operation including the erection or construction of accessory works as may be reasonable necessary for prospecting operation or for the selling or disposal of mineral or group of minerals found or incidentally won in the course of prospecting operation. The accessory work shall not be erected or constructed without the prior permission in writing of the Commissioner. On the other hand, the Commissioner shall not grant permission to erect accessory work unless the holder of the EPL has paid compensation to the owner of the private land covered by the EPL;
• The holder of EPL is required to exercise his right reasonably and in such a manner that the rights and interest of the owners of the land to which the License relates are not adversely effected except to the extent to which such owners is compensated. Furthermore the holder of the EPL is required to carry on the prospecting operation in accordance with good prospecting practices and to take all reasonable steps necessary to secure the safety, welfare and health of person employed in the Licensed area and to prevent or minimize any pollution of the environment; to maintain in good condition and repair all accessory works in the Licensed area; to remove from such area all structure,

UraMin, Inc. 3-5 Trekkopje Uranium Project Preliminary Assessment
SRK Consulting (US), Inc. April 2007 Trekkopje.NI 43-101 Preliminary Assessment.163701.MA.006.doc
equipment and other goods not used or intended to be used in connection with the prospecting operation; and to take reasonable steps to warn persons who may from time to time be in the vicinity of any accessory work of the possible hazard resulting there from;
• The holder of an EPL is required, to give the Commissioner notice of within 30 days of discovery of any mineral or group of minerals other than a mineral or group of minerals to which the License relates. Furthermore if the holder of an EPL is a company, it is required to give the Commissioner notice of any change of the name of the company, the registered address and principal place of business of the company in Namibia, the directors of the company, the particulars of the beneficiary who owns more than 5 % of the share issued by such company;
• The holder of an EPL, is required to carry on within a particular period in accordance with the work program, prospecting operation or to expend certain expenditures and shall furnish the Commissioner with the particulars of the prospecting operations, either operation or expenditure;
• The EPL is granted for a period not exceeding three years and may be renewed for a further period not exceeding two years at a time. The EPL cannot be renewed for on more than two occasions unless the Minister deems it desirable in the interest of the development of mineral resources of Namibia that such License be renewed in any particular case on a third or subsequent occasion;
• The holder of an EPL is required to keep an address in Namibia in relation to the location and result of all photo-geological studies, imaging, geological mapping, geochemical sampling, geophysical surveying, drilling, pitting and trenching, sampling and bulk sampling carried within the licensed area. He is further required to keep the results of all analytical, meteorological, and mineralogical work incidental to the prospecting operation. The record must also incorporate the interpretation and assessment of studies and surveys;
• The holder of EPL is required to keep the record of employees, the nature, mass, volume and value of minerals produced, the expenses incurred in the course of such operation and such other work as may be determined by the Mining Commissioner;
• The holder of EPL is further required to prepare and maintain at all times plans and maps in respect of the prospecting area. He is further required to prepare a statement of income and expenditure and such other financial statements as a Commissioner may determine. Such financial statement shall be submitted to the Commissioner within 30 days after the end of each quarter during the currency of the EPL. Within 60 days of the end of the currency of the terms of the License or together with a renewal application report or reports must be submitted to the Commissioner setting out an evaluation of the prospect of the discovery of any mineral or group of minerals in such prospecting area, all information including photographs, tabulation, tapes and discs the records to be kept and including plans and maps the report must also deal with the nature, mass or volume and value of any mineral group or minerals sold or otherwise disposed; and
• Should the EPL be cancelled or expired, the holder is required within one month of such cancellation or expiry to deliver to the Commissioner all records, maps, plans, reports,

UraMin, Inc. 3-6 Trekkopje Uranium Project Preliminary Assessment
SRK Consulting (US), Inc. April 2007 Trekkopje.NI 43-101 Preliminary Assessment.163701.MA.006.doc
photographs, tabulation, tapes and disc prepared by the house in the course of the prospecting operation. Failure to do so amounts to an offence. The Commissioner is also afforded powers to enter and search and seize such information.
UraMin’s specific obligations with respect to EPL 2218 and EPL 3573 include the following standard terms and conditions:
• Continue exploration with a program and budget, without undue interruption or delay;
• Conduct such additional work and expenditures as the Ministry deems warranted;
• The funds raised anywhere in respect of the EPL shall be committed to the license and shall be banked in a Financial Institution in Namibia;
• UraMin shall enter into an Environmental Contract with the Ministry of Environment and Tourism and the Ministry of Mines and Energy within one (1) month after the license issue date (completed on December 01, 2006); and
• Annual payments to the Ministry of Mines and Energy of N$5,000.00.
3.2.5 Titles and Obligations/Agreements In June 2005, UraMin acquired the entire share capital of UraMin Namibia, which held an MDRL over the Trekkopje Property in Namibia. Under the terms of the UraMin Namibia Acquisition Agreement, Mrs. Shirley Christodoulou, as the previous owner, is entitled to a 1% royalty of the gross production of uranium or other minerals mined from the Trekkopje Property. Further details on the UraMin Namibia Acquisition Agreement are contained in paragraph 12.4 of Part 5 of the UraMin Admission document (London AIM Stock Exchange Admission Document) (UraMin, 2006), which is reproduced below.
“UraMin Namibia Acquisition Agreement Pursuant to an agreement dated 15 May 2005, between the Company (1), Shirley Christodoulou (2) and UraMin Namibia (3), the Company agreed to acquire the entire issued share capital of UraMin Namibia. The consideration was made up of a non-refundable deposit of $250,000 payable on signature, a cash sum of $3 million payable on completion, and the issue to Mrs. Christodoulou, or as she might direct, of 3,300,000 Ordinary Shares, credited as fully paid. In addition, following a decision to mine and the commencement of mining operations on the Trekkopje Property, Mrs. Christodoulou will be entitled to receive a royalty equal to one percent of the gross production of uranium or other processed or unprocessed mineral mined or extracted from the Trekkopje Property, payable quarterly in arrears. In the event that mining ore extraction processes are not commenced on the Trekkopje Property by the earlier of 1 January 2008 and one year following completion of a bankable feasibility study, the Company will pay to Mrs. Christodoulou an annual sum of $200,000 from such date until extraction commences. (US$)
The agreement contains warranties, representations and indemnities among and between the parties. The agreement provided for completion on 29 June 2005; it was in fact completed on 29 June 2005.”
3.2.6 Exceptions to Title Opinion The author is not aware of any exceptions to clear title to the property.

UraMin, Inc. 3-7 Trekkopje Uranium Project Preliminary Assessment
SRK Consulting (US), Inc. April 2007 Trekkopje.NI 43-101 Preliminary Assessment.163701.MA.006.doc
3.3 Royalty Agreements & Encumbrances Under the terms of the UraMin Namibia Acquisition Agreement, Mrs. Shirley Christodoulou, as the previous owner of UraMin Namibia, is entitled to a 1% royalty of the gross production of uranium or other minerals mined from the Trekkopje Property. The terms of the agreement follow:
“iv.) Gross Royalty. Following a decision to mine and after Mining Operations commence, Purchaser shall pay Christodoulou a 1 percent Royalty of the gross production of Uranium or other processed mineral or unprocessed mineral that are mined or extracted through any other Beneficiation process from the “GWTN Assets”. (GWTN refers to former Gulf Western Trading Namibia property, which is the Trekkopje Project).
The Royalty shall be calculated on a calendar monthly basis and will be equal to one percent of the Gross Revenue received from the sale of all commercial minerals extracted and processed from the Property.
Gross Revenue means the aggregate of the following amounts received in each monthly period:
a.)i.) the revenue received by Purchaser from arms length purchase of all mineral products;
ii.) the fair market value of all mineral products sold by Purchaser in such month to persons not products; dealing at arms length with Purchaser; and
iii.) any proceeds of insurance on mineral products.
b.) The Royalty will be calculated and paid quarterly in arrears. Smelter settlement sheets, if any, and a statement setting forth calculations in sufficient detail to show the payments derivation shall be submitted with the payment.
c.) In the event that final amounts required for the calculation of the royalty are not available within the time period referred to in clause 3.4.b, then the provisional amounts will be established and the Royalty paid on the basis of this provisional calculation. Positive or negative adjustments will be made to the Royalty of the succeeding quarter.
d.) If Christodoulou objects to a particular royalty statement provided, it will have the right to have the Purchaser accounts relating to the calculation of royalty audited, if such audit determines that there is a deficiency or an excess in payments made to Christodoulou, then such deficiency or excess will be resolved by adjusting the next quarterly Royalty payment due hereunder. All books and records used and kept by Purchaser to calculate royalty due hereunder will be kept in accordance with internationally generally accepted accounting principles.
e) Purchaser agrees to pay to the Seller for each year there has been a failure to commence ore exploitation mining commencing with the beginning of the calendar year 2008 or within twelve months of completion of a bankable feasibility study, whichever is the earlier, the sum of US $200,000 (two hundred thousand dollars) per annum in the event that there has been no mining ore extraction process on the concession properties.”
3.3.1 Royalty in Namibia Section 114 of the Minerals Act, 1992 makes provision for royalties to be payable to the government of Namibia on the market value of minerals won or mined in Namibia, none of which royalties may exceed 5% in the case of minerals other than precious stones and dimension stone (UraMin, 2006).

UraMin, Inc. 3-8 Trekkopje Uranium Project Preliminary Assessment
SRK Consulting (US), Inc. April 2007 Trekkopje.NI 43-101 Preliminary Assessment.163701.MA.006.doc
Section 114 contains detailed provisions in terms whereof the Minister is required to consult and take into account representations by the person affected by such royalties. In terms of Section 114, royalties become payable only after the Minister has: (i) given a general notice in the Government Gazette specifying the royalty; (ii) has given a notice of intention to levy the royalty to the person on whom the royalty is to be imposed; (iii) has afforded the person affected a right to make representations; and (iv) has thereafter raised the royalty by giving written notice to the person.
In terms of Government Notice 248 (GN 248), as published in Government Gazette 3322 on November 15, 2004, the Minister has levied a royalty of 5% in respect of the nuclear fuels minerals group. Although it appears that GN 248 may not be in compliance with the requirements of section 114 of the Minerals Act, 1992, it may be expected that the MME intends to charge a 5% royalty on nuclear fuels and the Minister can simply rectify GN 248. The MME is currently in consultation with advisers and/or experts on the matter from South Africa, where the same issue is also under consideration.
3.3.2 Black Economic Empowerment Legislation in Namibia There is currently no legislation on Black Economic Empowerment (BEE) in Namibia. In July 2004, the Office of the Prime Minister announced that it was having consultations on the content of a BEE policy and its legislative framework for the country. It was stated that once consultations had been finalized, the draft policy document would be presented to the Cabinet for approval and thereafter for drafting into a Bill which would then be presented to Parliament. It could take some time before a BEE policy in Namibia is finalized, especially given the fact that there has been a change of governments since the announcement was made in July 2004, with a new Prime Minister and a new President coming into office on March 21, 2005. Any BEE policy eventually enacted in Namibia could potentially have an impact on the UraMin Namibia’s activities and ownership in the country.
3.3.3 Royalties – Share Purchase Agreement at Trekkopje R.G. Carr is to receive N$1 million when mining operations commence.
3.3.4 Required Permits & Status The primary license, at this stage of the project activities, is the EPL, described in Section 3.2.1, and the EMP (Environmental Management Plan) submitted to the EPL to cover existing operations.
Other permits and/or licenses may be required for activities beyond the current exploration work ongoing at the Trekkopje Project. These permits and/or licenses will be further defined as part of the current feasibility studies and will be described in a subsequent Bankable Feasibility Study, which is beyond the current scope of this NI 43-101 Technical Report.
As the Trekkopje Project lands are within the //Gaingu Conservancy, a tract of land set aside for the benefit of local indigenous people, UraMin Namibia will need to submit an application to the Land Board for a lease over the communal lands. Approval for the current activities is not needed from the Conservancy. A letter of consent, signed by the Chief of the Oe#Gan Traditional Authority and the //Gaingu Conservancy Committee must accompany the application. Uramin has initiated the process. Land Board’s consent is then submitted with a mining license application. UraMin Namibia has engaged with the Conservancy Committee and the community during the course of the EIA, via meetings. UraMin Namibia has also been

UraMin, Inc. 3-9 Trekkopje Uranium Project Preliminary Assessment
SRK Consulting (US), Inc. April 2007 Trekkopje.NI 43-101 Preliminary Assessment.163701.MA.006.doc
involved at a local level with the Conservancy by assisting with a game count, and the local Chief has been engaged in discussions. The local Chief’s consent is necessary as a primary step in doing business, and he is very happy with the interaction between UraMin and the community, which includes the Conservancy (Marie Hoadley, Turgis, 2006).
3.4 Environmental Liabilities SRK is unaware of any environmental liabilities for the Trekkopje Project.
UraMin Namibia’s operations are subject to environmental regulation (including regular environmental impact assessments and the requirement to obtain and maintain certain permits) in all the jurisdictions in which it operates (UraMin, 2006). Such regulation covers a wide variety of matters, including, without limitation, prevention of waste, pollution and protection of the environment, labor regulations, and health and safety. UraMin may also be subject under such regulations to clean-up costs and liability for toxic or hazardous substances that may exist on or under any of its properties or which may be produced as a result of its operations. Environmental legislation and permitting requirements are likely to evolve in a manner which will require stricter standards and enforcement, increased fines and penalties for non-compliance, more stringent environmental assessments of proposed projects, and a heightened degree of responsibility for companies and their directors and employees; none of which is deemed by UraMin to be detrimental to the potential development of the Trekkopje Project.
The License holder is required to prepare a report dealing with environmental impact assessment, indicating the extent of any pollution of the environment before any prospecting or mining operations are carried out and an estimate of any pollution such prospecting or mining operations is likely to cause (Lorentz and Bone, 2006). If any pollution is likely to be caused, the License holder is required to submit an environment management plan indicating the proposed steps to be taken in order to minimize or prevent, to the satisfaction of the Mining Commissioner, any pollution of the environment in consequence of the prospecting or mining operations. The License holder is required from time to time to revise the environment management plan as the environment’s conditions change or demand. Furthermore, the License holder is required to report any spilling, pollution, losses or damages to the environment and take steps at its own cost to remedy such spilling, pollution, loss or damage.
The Environment Investment Fund of Namibia Act, 2001, empowers the Minister to make regulations relating to the determination of levies by a person engaged in the exploitation of natural resources for commercial purposes. According to information, this Fund has not yet been established. The Minister of Finance stated in her budget speech of 2005 that Namibia would in the near future introduce environmental tax. No further details are as yet available on this matter.
There is no legislative enactment in place governing the implementation of environmental issues. The Ministry of Environment and Tourism (MET) has overall oversight over environmental matters at the national level. The Ministry’s activities are guided by the 1994 Environmental Assessment Policy. The Environmental Assessment Act has been in draft form for a number of years and has not yet been promulgated into an Act of Parliament. The mining industry has adopted a self-regulatory and proactive approach to the environmental issues by establishing, on their own accord, Decommissioning and Rehabilitation Funds.

UraMin, Inc. 3-10 Trekkopje Uranium Project Preliminary Assessment
SRK Consulting (US), Inc. April 2007 Trekkopje.NI 43-101 Preliminary Assessment.163701.MA.006.doc
UraMin has been proactive in dealing with environmental, health, and safety issues in the course of Trekkopje Project activities. An Environmental Impact Statement (EIA) is being compiled by Turgis Consulting (Pty) Ltd, and will be submitted to the MET in the coming months.

UraMin, Inc. 3-11 Trekkopje Uranium Project Preliminary Assessment
SRK Consulting (US), Inc. April 2007 Trekkopje.NI 43-101 Preliminary Assessment.163701.MA.006.doc
Figure 3-1: Location Map Namibia

UraMin, Inc. 3-12 Trekkopje Uranium Project Preliminary Assessment
SRK Consulting (US), Inc. April 2007 Trekkopje.NI 43-101 Preliminary Assessment.163701.MA.006.doc
Figure 3-2: Location of Uranium in Namibia
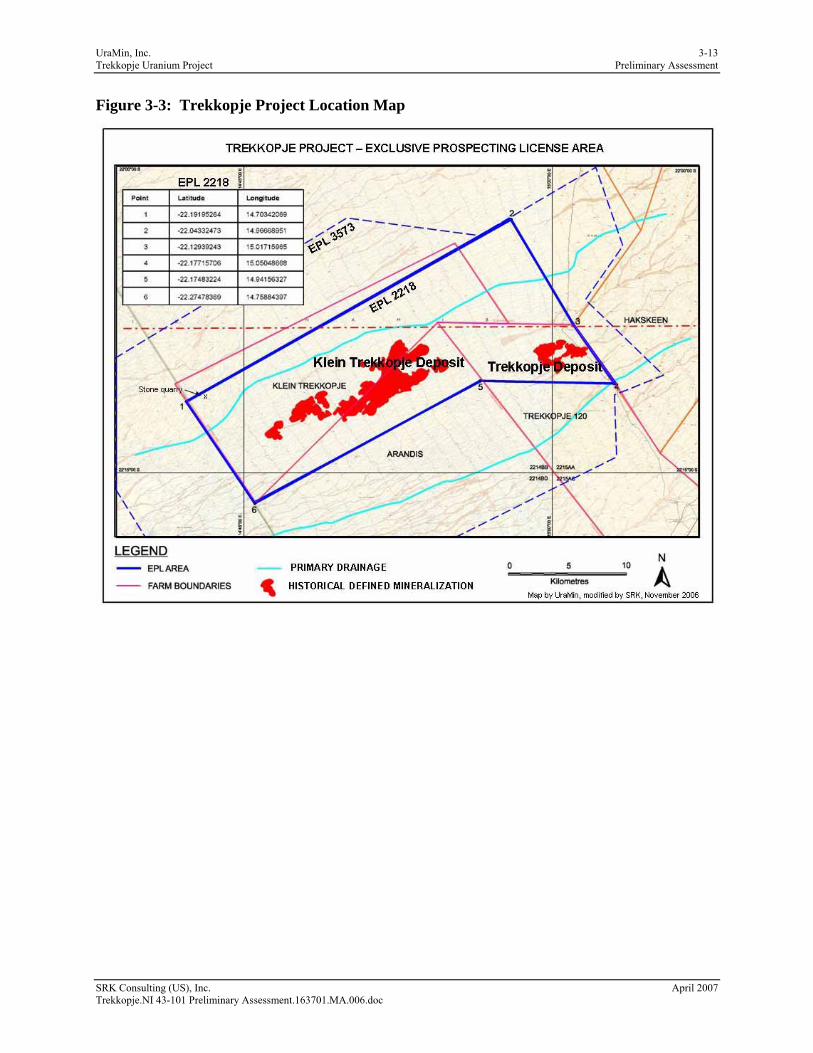
UraMin, Inc. 3-13 Trekkopje Uranium Project Preliminary Assessment
SRK Consulting (US), Inc. April 2007 Trekkopje.NI 43-101 Preliminary Assessment.163701.MA.006.doc
Figure 3-3: Trekkopje Project Location Map

UraMin, Inc. 4-1 Trekkopje Uranium Project Preliminary Assessment
SRK Consulting (US), Inc. April 2007 Trekkopje.NI 43-101 Preliminary Assessment.163701.MA.006.doc
4 Accessibility, Climate, Local Resources, Infrastructure & Physiography (Item 7)
Namibia is a politically stable country with excellent infrastructure and an established diverse mining industry involving uranium, diamonds, gold, and base metals. Operating mines include the Rössing Uranium mine located 35km south of the Trekkopje Project area, which has been in production since 1977, and the Langer-Heinrich uranium mine, which is located 80km southeast of the Trekkopje Project and which began production in September 2006. The Namibian Government actively encourages growth of its mining industry.
4.1 Access to Property The Trekkopje Project site is located approximately 23km northwest of the main Swakopmund to Usakos hard-surfaced road (Highway 40, the Trans Kalahari Highway). The project is 30km from Arandis, which is on the main Swakopmund – Usakos road. A 23km stretch of graded gravel road connects the Trekkopje property with the main Swakopmund – Usakos surfaced road. Repairs and grading are required periodically to maintain the quality of this dirt road from the highway turn-off to the project site.
The Walvis Bay – Windhoek railway line follows the Usakos – Swakopmund main road. The Trekkopje Siding is 22km southeast of the Trekkopje mineral property and is one km north of Highway 40.
Immediately south of Highway 40 is a Nampower transmission line, which connects the coastal towns with the national grid at Windhoek. A new line from Windhoek directly to Walvis Bay (220KW) is planned, which may leave some spare capacity on the existing line (InterConsult, 1999). A national grid sub-station is located approximately 40km due east of the Trekkopje Project.
The Trekkopje Project is 220km west of the capital city of Windhoek, which is located approximately in the centre of the country, although the highway from Trekkopje to Windhoek first goes northeast to Karibib, east to Okahandja, then south to Windhoek. Windhoek and Walvis Bay have international airports with daily flights to many other African and European destinations. Windhoek and Walvis Bay are also linked by rail. Swakopmund, the nearest city, has a population of 35,000.
4.2 Climate The climate of the Trekkopje Project area is classified as desert and is dry and at times dusty, with rather large variations in temperature and humidity. Annual rainfall is between 14mm and 100mm (less than one inch). Most of the rainfall occurs in late summer during the period from February through March. Rainfall can be of short duration and high intensity. In general, the climate is typified by hot and dry conditions with cool nights. Rainfall is highly variable, unpredictable and locally patchy. Some areas may not receive rain for many years, while areas in the vicinity of higher topography, for example, may receive rains more frequently.
The lack of moisture is related to the subtropical high pressure area (the South Atlantic anticyclone), whose strong south-westerly onshore winds drive the cold Benguela current (from the Antarctic) that induces a cold layer over the desert, cutting off any moisture from the Atlantic Ocean. The westerly winds draw strong, hot, dry ‘Bergwinds’ from the interior plateau into the

UraMin, Inc. 4-2 Trekkopje Uranium Project Preliminary Assessment
SRK Consulting (US), Inc. April 2007 Trekkopje.NI 43-101 Preliminary Assessment.163701.MA.006.doc
Namib Desert, further decreasing the already dry atmosphere. The wind speed in winter is stronger than in summer, mostly due to the dominant high-pressure system of the inland regions that result in subsiding air moving toward the coastal regions.
A steep temperature gradient between air over the ocean, which is cooled by the cold current, and the air above it, which is warmed by the intense sunshine at this latitude, prevents the ocean air from rising and building rain-bearing clouds. The temperature inversion causes cool, moist air to be trapped close to the surface, resulting in the formation of fog and low cloud. Prevailing onshore winds blow the fog inland, but it is burnt off quickly when the land surface starts warming up during the day. Fog along the coastal region can be a significant contributor to total annual precipitation.
Temperatures in the Trekkopje Project area range between 4°C and 40°C (40° to 104°F) and humidity ranges between 5 and 80% (data from Rössing). The operating season is 12 months of the year.
In most of Namibia, a single wet season occurs in summer, generally between the months of November and March. Annual rainfall distribution is not evenly distributed, as annual rainfall is below average more years than it is above average. The average rate of evaporation in the Trekkopje Project area is between 3,200 and 3,400mm/yr and the annual potential evapo-transpiration exceeds annual precipitation by ratios of more than 30:1. Hence, drought conditions are a common phenomenon throughout most of the country.
Water is mainly found only as sub-flow beneath the streambeds of the larger streams. In some cases, dissolved salts render the water non-potable. The rainfall is low and the rivers are normally dry. Occasionally storm water entering the rivers in the upland areas reaches the sea. Perennial surface water occurs at a few points in the rivers, but subsurface water is present in the larger rivers all year.
Present day westward directed river drainages are the Omaruru, Khan, and Swakop rivers, which flow westward during rare periods of rainfall. The paleo-channel in which the Trekkopje Project is situated has a similar westward paleo-flow direction.
The closest surface water gauging station is on the Swakop River at Dorstrivier, southwest of the Trekkopje Project. During the period between 1977 and 1987, the Swakop River flowed on three occasions, February 1980, March 1984 and February 1985.
The temperature variation can approach and even exceed 30°C on any given day. Mean daily temperatures exceed 20°C for most months, except in July and September. Due to the relative close proximity to the coast, frost will be a rare experience at this site. In winter, the strong easterly winds are a function of the high-pressure system dominating the region that causes air to subside and then drain towards the coast. Autumn and spring are transitional between characteristics of summer and winter wind frequency distribution.
4.2.1 Vegetation Vegetation is sparse in the vicinity of the Trekkopje Project and mainly consists of stunted grasses and small trees. Desert vegetation is largely confined to drainage channels.
The Namib Desert stretches in a band along the coast, and vegetative cover increases with rainfall away from the coast. The dunes of the northern Namib and the plains of the central Namib are largely bare, but support scattered annual grasses (Sporobolus and Stipagrostis spp.
UraMin, Inc. 4-3 Trekkopje Uranium Project Preliminary Assessment
SRK Consulting (US), Inc. April 2007 Trekkopje.NI 43-101 Preliminary Assessment.163701.MA.006.doc
after rain). Toward the east, the Namib is composed of gravel and sandy plains, interspersed with isolated mountains (inselbergs) towards the escarpment. The vegetation is described as succulent steppe and characterized by a dominance of leaf-succulents, such as several Brownanthus and Ruschia species. The eastern plains of the Namib, known as the pro-Namib become covered with dense stands of perennial grasses such as Stipagrostis obtusa and S. ciliata after the sporadic rains (Muller, 1984).
The dwarf shrub savanna (mainly <200mm rainfall) is characterized by Rhigozum trichotomum, Catophractes alexandrii, Eriocephalus species and various small Karoo bushes. The unpalatable Euphorbia gregaria covers large areas of the southern dwarf shrub savanna. The most common grasses are Stipagrostis species (S. uniplumis, S. brevifolia, S. obtusa and S. anomala) but vary with soil types and can include valuable species such as Panicum arbusculum, Setaria appendiculata, Antephora pubescens and Digitaria eriantha. The dwarf shrub savanna is mainly used for sheep and goat farming.
Of the three major vegetation zones in Namibia (deserts, savannas, and woodlands), the Trekkopje Project is in the central Namib desert. The central Namib vegetation zone lies between the Huab River in the north and the Kuiseb River in the south, the Atlantic Ocean in the west and the escarpment in the east. The central Namib provides a number of different habitats to plants, including expansive gravel and gypsum plains, dry river courses and drainage lines, and rock outcrops which rise from just a few to several hundred meters above the plains. There are also many more confined habitats, which are usually related to soil conditions or water sources such as saline springs, pans and calcrete hardpan areas. Near the coast, dunes and sand-plain habitats are dominant, pockets of which also occur along the main river courses and in isolated spots where continuous sand transport has created small dune islands.
The main river courses in the central Namib, from south to north, are the Kuiseb, Swakop, Khan, Omaruru, Ugab, and Huab Rivers. Along the coast, where rainfall is a very rare event, fog becomes the most important source of moisture. This has a tremendous effect on the vegetation, as plant life relying largely on fog for moisture differs greatly from vegetation dependent on rainfall. The fog belt extends approximately 20 – 30km inland, and can be clearly recognized by the evenly-distributed, sparse cover of dwarf shrubs.
In the central Namib, the extensive formation of gypsum crust in the soil are most prominent in the fog belt. These gypsum-bearing soils and shallow substrates support diverse lichen fields.
The central Namib is part of southern Africa’s Desert Biome. Macro-vegetation is sparse to non-existent and is concentrated mostly in the Swakop River. Although plant diversity is comparable to other desert regions of the world, there are many native species in this biome that are not present in other continents. Approximately 400 plant species, about 10% of the flora of Namibia, occur in the central Namib.
Although a definitive survey of the fauna has not yet been conducted, gemsbok, springbok, common duiker, and klipspringer are relatively common species in Southern Africa and may be expected in the project area. A likely mammalian predator is the brown hyena. Reptile species are likely to be common on the site and in suitable habitat in the wider region. Bird species are likely, although none are considered as endangered within Namibia. The habitat and environmental features on the proposed mining site and those in the general vicinity are generally not restricted in extent. Those habitats present in the Trekkopje Project are also presented in the Namib-Naukluft Park, south of the Swakop River. The total area that would be

UraMin, Inc. 4-4 Trekkopje Uranium Project Preliminary Assessment
SRK Consulting (US), Inc. April 2007 Trekkopje.NI 43-101 Preliminary Assessment.163701.MA.006.doc
affected by the proposed mining activities is relatively small in regional terms, and has been subjected to intense exploration activities in the past.
4.3 Physiography The three north-south-trending physiographic zones in Namibia consist of the Namib Desert along the Atlantic coast, the Central Plateau, and the Kalahari Desert in the east. Perennial rivers, such as the Okavango, Kunene, Zambezi, and Orange, are confined to Namibia's northern and southern borders.
The Namib Desert is a broad strip of sand dunes and bare rock outcrops that is about 60km wide and that extends for about 1,900km along the Atlantic Coast. This desert, which was arid 80 million years ago, covers approximately 15% of Namibia with dune seas, gravel plains and locally deeply eroded canyons. The Namib Desert gradually rises from sea level at the Atlantic Coast to elevations of approximately 975m at the base of the foothills of the Central Plateau. The western coastal plains are largely composed of mobile dunes and gravel and sandy plains.
The Central Plateau (also called the Scarp) is a 100km-wide zone of rugged hills composed of metamorphic rocks, at elevations of 975 to 1,980m. The Trekkopje Project is located in the Namib Desert near the eastern edge of the desert where it slopes upward to the Central Plateau. The project area is situated within a broad expanse of relatively flat desert plain. The surface consists of sheet-wash alluvial sand covering broad, shallow, sand- and conglomerate-filled paleo-channels on peneplaned bedrock composed of granite, schist, and marble. The mineralized area is 800m above mean sea level at its high point and descends gradually toward the west to an elevation of 450m, 22km distant. The low hills are bare rock and the valley and desert floors are covered by coarse grit, the finer sands and clays having been winnowed towards the coast by the strong prevailing north-easterly winds.
4.4 Local Resources & Infrastructure Details of Infrastructure, as currently defined for the purpose of the BFS, are discussed in Section 17 – Other Information. A brief description is provided here.
4.4.1 Access Road The current access road to the project is an unimproved graded gravel road 23km in length that connects to paved Highway 40.
4.4.2 Water Supply There is no water supply for the Trekkopje Project. Potable water is currently hauled from the town of Arandis to support the Exploration Camp.
4.4.3 Electrical Power Supply While there is an electrical power line that crosses the Trekkopje Project, the power is fully utilized for the town of Henties Bay on the coast. Currently power for the project ongoing exploration activities is provided by portable generators and small portable solar panels.
4.4.4 Buildings & Ancillary Facilities UraMin has constructed temporary facilities, as an exploration camp, near the Trekkopje Deposit. Those facilities include housing and anciliary facilities including generator power, to accomodate 5 to 10 persons. There are no other facilities on the Trekkopje Project.

UraMin, Inc. 4-5 Trekkopje Uranium Project Preliminary Assessment
SRK Consulting (US), Inc. April 2007 Trekkopje.NI 43-101 Preliminary Assessment.163701.MA.006.doc
4.4.5 Political System Namibia is a multiparty, multiracial democracy, with a president who is elected for five-year term. The constitution establishes a bicameral Parliament and provides for general elections every five years and regional elections every six years. Members of the 72-seat National Assembly are elected on a party list system on a proportional basis. Members of the 26-seat National Council are elected from within popularly elected Regional Councils. The three branches of government are subject to checks and balances, and provision is made for judicial review. The judicial structure in Namibia largely parallels that of South Africa and comprises a Supreme Court, the High Court, and lower courts. Roman-Dutch law has been the common law of the territory since 1919. Namibia's unitary government is currently in the process of decentralization. The constitution provides for the private ownership of property and for human rights protections, and states that Namibia should have a mixed economy and encourage foreign investment.
4.4.6 Population Most of the two million population of Namibia reside in the northern part of the country or in the capital city of Windhoek. The official language is English; other languages spoken include Afrikaans, German, and local traditional languages.
4.4.7 Economy The economy is heavily dependent on the extraction and processing of minerals for export. Mining accounts for 20% of GDP. Rich alluvial diamond deposits make Namibia a primary source for gem-quality diamonds. Namibia is the fourth-largest exporter of nonfuel minerals in Africa, the world's fifth-largest producer of uranium, and the producer of large quantities of lead, zinc, tin, silver, and tungsten.
The mining sector employs only about 3% of the population, while about half of the population depends on subsistence agriculture for its livelihood. The Namibian economy is closely linked to South Africa with the Namibian dollar tied to the South African rand at 1:1.
4.4.8 Local Resources The population of the Erongo region is 107,629, which is approximately 6.7% of the total population of Namibia. Most of the local population lives in urban areas with 63% living in the towns of Walvis Bay, Swakopmund, Omaruru, Karibib, Arandis, Usakos, Uis and Henties Bay (IDC, 1995). The closest city of size to the Trekkopje Project is Swakopmund, with a population of approximately 35,000. The closest town to the Trekkopje Project is Arandis, with a population of less than 4,000.
4.4.9 Regional Infrastructure The national road network connects the Erongo region to the rest of the country via Okahandja, Windhoek, and Otjiwarongo. The trunk roads between Windhoek, Okahandja, Swakopmund, Walvis Bay and Omaruru are all paved. Other major connections are gravel or salt roads.
Railway connections exist between Walvis Bay, Otjiwarongo, and Windhoek. This railway network connects further to South Africa. A class A airport is located at Walvis Bay. The harbor at Walvis Bay is one of the key economic features of the region. The harbor has two bulk terminals, cold storage facilities, ship repair, and marine engineering services. A border post exists at the harbor as well as at the Walvis Bay airport.

UraMin, Inc. 4-6 Trekkopje Uranium Project Preliminary Assessment
SRK Consulting (US), Inc. April 2007 Trekkopje.NI 43-101 Preliminary Assessment.163701.MA.006.doc
Swakopmund and Walvis Bay are linked by a 220kV power line from the national grid. Power for the project would be tied into the existing national grid.

UraMin, Inc. 5-1 Trekkopje Uranium Project Preliminary Assessment
SRK Consulting (US), Inc. April 2007 Trekkopje.NI 43-101 Preliminary Assessment.163701.MA.006.doc
5 History (Item 8) The Trekkopje uranium property is an advanced exploration target with established resources. The history of the property recounted in this section consists of the exploration efforts expended on the property over the last three decades by several lessors, along with a summary of the results of their investigations.
Anomalous uranium was first detected in the area by airborne geophysical surveys conducted in 1970 as part of a country-wide geological investigations program sponsored by the South West Africa (now Namibia) government. Large areas of the region were flown at a 1km line spacing, which provided information for detailed radiometric and aeromagnetic maps. Detailed radiometric anomalies were followed up with several periods of drilling and shallow pitting.
The record of historical exploration on the Trekkopje Project is incomplete, but is summarized here as accurately as possible. The purpose is to provide the reader with a synopsis of the magnitude of information that was gathered by previous workers, much of the detailed data not currently available to UraMin.
5.1 Ownership Uranium mineralization in the license area is contained in the adjoining Klein Trekkopje and Arandis historic license grants, which geologically constitute a singular body, and the Trekkopje deposit, which is located several kilometers to the east-southeast. The historical exploration accounting divisions result from the separate licenses issued for the three properties, each with separate statutory reporting requirements.
The earliest exploration history at the Klein Trekkopje property is incompletely documented in the available files. Rio Tinto first investigated the property in 1974 by commissioning airborne radiometric surveys over the properties to refine the earlier government survey. The maps revealed a pronounced potassium anomaly in the northeast and a uranium anomaly in the southwest over the Klein Trekkopje-Arandis deposit. The further extent of investigations by Rio Tinto is unknown.
In 1976, Anglo American and its DeBeers Diamond subsidiary apparently were briefly involved with data review of the property. No further information is available for clarification of their interest or depth of inquiry.

UraMin, Inc. 5-2 Trekkopje Uranium Project Preliminary Assessment
SRK Consulting (US), Inc. April 2007 Trekkopje.NI 43-101 Preliminary Assessment.163701.MA.006.doc
Table 5.1.1: Summary of Exploration Activities: Trekkopje Properties 1970 – 2005
Company Era Surveys Property No. DHs Rptd/ No. DHs Used
Drill meters Pitting
Met. Testing Resource Estimate
Rep. SA 1970 Regional aeromagnetic and radiometric Regional Rio Tinto 1974 Radiometric flights KT Unknown Unk. Unk. Elf Aquitaine: Cadrim; 1979-1984 Ground Radiometric; Geol. KT 1222 / 1080 20502.5 Yes Initial (XRF) (1980); Gesostat. Elf Aquitaine: Cadrim; 1979 Ground radiometric; Geol. A 505 / 420 6 Yes Gesostat. (eU3O8) (1983) Elf Aquitaine: Omitara 1979-1984 Ground radiometric; Geol. T 445 / 214 Yes Gesostats/ BRGM 1983 Gulf Western Trading/CRN 1989-1999 Evaluative: Confirm drilling/ met. 18 Unk. Yes Mintek (heap leach) EET - AEC-SA 1991-1994 Res. Estimates Gesostat. (eU3O8) (1991) Namibia 1993 Pit resampling 10 Unk. 5 (eU3O8) (1991), Ministry of Mines and Energy 1994-1996 Re-flights Sysmin detailed KT-A-T AEC 1997 Res. Estimates 10 Mintek (heap + tank leach) Uranco/ UraMin 1999-2005 Evaluation/Pre-feasibility InterConsult /Mintek 1999 Pre-Feas. Study Update – MRL 10 Mintek (tank leach) World Ind. Mins. 2005 CPR review RSG Global 2005 Indpt. Tech. Review TK Turgis Consulting 2005 Indpt. Tech. Review/ Viljoens TK CPR

UraMin, Inc. 5-3 Trekkopje Uranium Project Preliminary Assessment
SRK Consulting (US), Inc. April 2007 Trekkopje.NI 43-101 Preliminary Assessment.163701.MA.006.doc
5.1.1 Klein Trekkopje Farm Beginning in 1979, Cadrim Namibia (Pty) Ltd and Omitara Mines (Pty) Ltd, South West Africa, subsidiaries companies of Elf Aquitaine, France, acquired prospecting licenses over the anomalous radiometric portions of the survey. These consisted of license number 46/3/725 (22,000ha) on Klein Trekkopje, license number 46/3/1148 on Arandis Farms (18,000ha), and license number 46/3/887 (10,000ha) on Trekkopje (Omitara Mines). A hand-held scintillometer ground survey, along a 50m x 400m grid, confirmed the presence of numerous radiometric anomalies in the Klein Trekkopje and northern part of the Arandis license area. The initial ground radiometric survey revealed a 15km long, narrow anomaly that attained widths of 1km and up to 3km in places.
Cadrim made 1:20,000-scale geologic maps of the two farms, commissioned aerial photography, and conducted ground and radiometric surveys of the license areas. Cadrim geologists recognized that anomalous uranium mineralization was the source of the radiometric anomalies, and that mineralization was confined to shallow paleostream channels concealed beneath a thin, 1 to 2m-thick blanket of sands and gypcrete. Geologic mapping confirmed the paleo-channel geologic model, and indicated the prospective area was 18km long by 2 to 5km wide. A resistivity geophysical survey conducted over three cross (fence) lines of the anomaly at Klein Trekkopje and Arandis tested the applicability of the methodology to map paleo-channel sedimentary deposits by the electrical resistivity contrast between sediments and bedrock. The surveys demonstrated that uranium mineralization was associated with the deeper parts of paleo-channels and with certain paleoterraces on the sides of paleodrainages.
In 1980, Cadrim tested the paleo-channel calcrete mineralization at Klein Trekkopje with a program of percussion drilling along an 800m x 800m grid. In this first exploratory phase, some 214 holes were completed to depths of 20m. Twenty meters drill depths had been selected, based on early drilling that indicated uranium mineralization persisted to this depth. Later drilling showed mineralization extended deeper in places. All drill holes were radiometrically logged. Samples of cuttings, which were collected at 0.5m intervals, were sent off to South African laboratories and analyzed by X-Ray Fluorescence (XRF) methods on samples prepared as fused beads. Little disequilibrium was noted in the drill holes across the deposit in early results.
A follow-up, detailed drill program of 225 drill holes sited along a 200m x 400m grid was initiated. In addition, four 100m cross lines with drill holes spaced at 2, 10, and 20m apart were made to investigate the geostatistical variability of uranium mineralization. In 1981, the drill grid spacing was further reduced to 200m x 200m, and four additional cross or fence line drilling grids were completed. Four test pits were excavated to 7m depth (29.5m3) for bulk sample metallurgical testing. In 1981, percussion drill holes at 0.4 to 0.5m spacing were followed by excavation of 16 test pits to depths of 6 to 19m. The historical pits were backfilled and are not now accessible.
In late 1981, Elf Aquitaine passed control of Cadrim to Compagnie Miniere Dong-Trieu (Uranium Division) of France. In 1982, several deeper holes were drilled to test the reliability of assay and radiometric measurements and to answer a question of possible disequilibrium in the deposit. Their deeper drilling demonstrated that uranium mineralization was absent below 30m, and that the extreme “nugget” effect was sufficient to conceal any evidence of disequilibrium effects.

UraMin, Inc. 5-4 Trekkopje Uranium Project Preliminary Assessment
SRK Consulting (US), Inc. April 2007 Trekkopje.NI 43-101 Preliminary Assessment.163701.MA.006.doc
At the cessation of activities on Klein Trekkopje in 1983, the total number of drill holes completed through 1982 was 575 drill holes sited along the regular grid and 418 holes sited along eight fence lines. An additional 187 drill holes were placed to test mineralization in 20 pit excavations, and 42 drill holes were placed to test for deeper mineralization beneath the water table and to establish depth of paleo-channels to bedrock. The total number of drill holes completed on Klein Trekkopje by Cadrim was 1,222 reported drill holes. Of these, 1,080 were identified to the AEC – South Africa in annual submitted reports and presumably were used in resource estimation. The cumulative drilling at Klein Trekkopje totaled 20,502.5m.
5.1.2 Arandis Farm At the Arandis deposit (Arandis Farm portion of the Klein Trekkopje deposit), Cadrim conducted a ground scintillometer survey in 1981 and prepared detailed 1:20,000 geological maps along north-south traverse lines spaced at 400m. Anomalous radiometric areas were then drill tested with 27 percussion drill holes drilled in a 1,600m x 800m grid for a total of 412.5m of drilling. Boreholes were spectrometrically logged and cuttings were collected at 0.5m intervals and shipped to South African laboratories for XRF fused-bead preparation and analysis. An additional 77 percussion drill holes were added to further test mineralization and to establish depth to bedrock (>100m spacing), totaling 1,381m of drilling. In 1982, 250 additional infill drill holes were completed.
Thus, a combined total of 505 reported drill holes were completed on the Arandis grant for a total of 9,380m of drilling through 1982. Of this total, 420 drill holes were identified to the AEC – South Africa and presumably were utilized in the Cadrim database. The drilling demonstrated that mineralization on the northern portion of Arandis is an extension of Klein Trekkopje paleo-channel mineralization, and that the uranium mineralization on the southern portion of Arandis is minimal.
5.1.3 Trekkopje Farm At the Trekkopje deposit, Omitara Mines conducted a ground scintillometer survey in 1979 at 50m stations along a 400m fence grid. This survey delineated a 2.5km x 4.5km zone of anomalous readings. A resistivity geophysical survey conducted over several lines of the anomaly at Trekkopje Farm tested the applicability of the methodology to map paleo-channel sedimentary deposits by the electrical resistivity contrast of sediments with bedrock. The survey revealed the paleo-channel centers were quite deep (>100m). Later in 1979, drilling along a 800m x 800m grid commenced with standard 20m deep drill holes. Omitara Mines discovered that uranium mineralization at Trekkopje Farm was sited similarly to that at Klein Trekkopje-Arandis and was within the paleo-channel fill beneath a gypcrete cap.
In 1980, more detailed drilling was conducted on a 200m x 400m grid, and along four additional fence lines, each 200 to 400m in length, at drill hole spacings of 2, 10, or 20m. After drilling on 0.4 x 0.4m centers, two pits were excavated for bulk sample testing of mineralization. This sample testing was conducted to establish correlation of drilled versus excavated mineralization and to correlate radiometric versus XRF-determined U3O8 assay grades. Sidewall faces were mapped and radiometrically scanned. Samples of 1t/0.5m were collected, and were split down to 50kg samples for analysis. All drill holes were spectrometrically logged, with cuttings collected at 0.5m intervals and sent to analytical labs in South Africa for fused bead preparation and XRF analysis.
UraMin, Inc. 5-5 Trekkopje Uranium Project Preliminary Assessment
SRK Consulting (US), Inc. April 2007 Trekkopje.NI 43-101 Preliminary Assessment.163701.MA.006.doc
In 1981, 12 percussion drill holes were drilled on 0.4 x 0.4m center, after which five additional pits were excavated. One line of deeper drill holes was completed to test the depth to bedrock. The drilling established that the thickness of uranium mineralization at Trekkopje Farm was considerably less than mineralization at Klein Trekkopje-Arandis, as mineralization showed a sharp decrease below 10m. Drilling at Trekkopje Farm includes 184 drill holes on the regular grid, 190 drill holes on fence lines, 58 pit drill holes, and 13 deep drill holes to explore depths of paleo-channels. Thus, drilling at Trekkopje Farm totaled 445 drill holes, of which 214 were identified to the AEC – South Africa and presumably were used for database reporting. Historical pits at Trekkopje were backfilled and are not now accessible.
In April 1984, Compagnie Miniere Dong-Trieu formally relinquished their Klein Trekkopje, Trekkopje, and Arandis exploration licenses to the AEC – South Africa. This action was due to the depression in the nuclear fuel metals commodity market and due to political instability within the South African region of influence.
5.1.4 Combined Land Holdings In 1989, the Klein Trekkopje, Arandis, and Trekkopje prospecting licenses (covering the now-combined Klein Trekkopje/Arandis and Trekkopje deposits) were acquired by Gulf Western Trading Namibia (Pty) Ltd (GWTN). In 1991, the Atomic Energy Commission –South Africa and its Earth and Environmental Technology Division performed a geostatistical reserves estimation on the Trekkopje deposit. This reserves estimate was conducted at the request of Consolidated Resources Namibia (CRN), a company in which majority shares were held by Gulf Western Trading. Eighteen drill holes were placed by Gulf Western for confirmation. In 1993, CRN re-opened 15 of the pit excavations at Cadrim’s Klein Trekkopje and channel sampled the faces for another comparison of chemical U3O8 versus radiometric U3O8 assays.
From 1994 to 1996, the Namibian Ministry of Mines and Energy flew detailed aeromagnetic and radiometric surveys at 200m flight spacings over portions of the region, including the Trekkopje areas. These surveys used more advanced and more sensitive instruments that had lower detection limits.
In 1997, Gulf Western and InterConsult drilled 18 holes along the original Cadrim grid line for additional confirmation/validation and for metallurgical testing by Mintek – South Africa.
From 1999 to 2005, Uranco (UraMin) commissioned several mining consulting groups and individuals to examine and report on the historical geo-statistical resource estimates made for the Trekkopje deposits.
In December 1999, UraMin Inc, which is the parent company of UraMin Namibia, acquired control of the combined Klein Trekkopje and Arandis uranium properties (hereafter referred to as Klein Trekkopje deposit). UraMin commissioned several technical reviews and a Competent Persons Report (CPR) of the economic and metallurgical merits of the Trekkopje Project deposits. In 2005, UraMin Inc. began moving the property forward with exploration drilling and initiation of a mine feasibility study.
UraMin Inc.’s 100% Namibian subsidiary, UraMin Namibia (Pty) Ltd, is the operator of the Trekkopje Project.

UraMin, Inc. 5-6 Trekkopje Uranium Project Preliminary Assessment
SRK Consulting (US), Inc. April 2007 Trekkopje.NI 43-101 Preliminary Assessment.163701.MA.006.doc
5.1.5 Project Expenditures Total project expenditures by Cadrim for the period 1979 to December 1982 are noted in their 1982 annual project report submitted to the AEC – SA. (Note: Cadrim did not provide accountings to separate property payment, administrative and overhead expenses from direct property exploration expenses). A minimum US$4.6 million in historical dollars are estimated to have been spent on the properties, of which Cadrim/Omitara Mines share constitutes the largest block (R 2.313M, conversion demarcated at 1R = US$1.2225 posting for December 1983).
5.2 Historic Mineral Resource Estimates Historical resource and reserve estimates are not presented in this report, as UraMin is reporting current and NI 43-101 compliant resources in Section 16 of this report. A discussion of historical resources/reserves is presented in UraMin’s initial NI 43-101 technical report dated November 28, 2006 titled “Initial Resource Estimate for The Trekkopje Project Feasibility Study, Swakopmund and Karibib Districts, Erongo Region, Namibia” (SRK Consulting, 2006)

UraMin, Inc. 6-1 Trekkopje Uranium Project Preliminary Assessment
SRK Consulting (US), Inc. April 2007
6 Geologic Setting (Item 9) The Trekkopje uranium deposits are one of a number of uranium deposits located in the coastal plain of the Namib Desert region of western Namibia. These deposits are hosted within surficial calcrete deposits formed in fluviatile and valley-fill sediments.
The calcrete-hosted uranium deposits are the results of broad-scale surficial weathering of uraniferous granites and schist of Precambrian and Mesozoic age in the Namib hinterlands to the east. Uranium was dissolved as uranyl ions and transported in groundwater down the hydraulic gradient to the southwest. Deposition was focused into narrow paleostream channels in permeable shallow stream detritus at chemical and oxidation/reduction (redox) and evaporation interfaces. The upgrading of weak regional background uranium values by three to ten times (or more) background occurs in this unique fluviatile setting of groundwater migration into suitable chemical traps. Uranium and vanadium is transported by groundwater and deposited within calcrete-cemented conglomerates, silts, and sands occupying the drainage channels at an oxidizing interface by an evaporation-abetted salinity increase.
6.1 Regional Geology The Namib Desert is underlain by a bedrock complex of Late Proterozoic Damaran Sequence schists, gneisses, and later granites of the Pan African Orogeny (800 to 500 million years ago or Mega-annum [Ma]), forming one of the mobile orogenic belts separating the Kaapvaal and Congo cratons. The Damaran metamorphic belt trends northeast and is composed of a sequence of metasediments, including biotite schists and marbles of the Karibib Formation. The sequence represents stable platform carbonates to the north and a variety of metasedimentary rocks to the south. The Karibib Formation unconformably overlies a 2 billion year old (Giga-annum or Ga) Mesoproterozoic basement complex of granite-gneiss. The schists are intruded by both late- to post-tectonic 528Ma granites and most importantly by a series of post-Karoo 124-137Ma, high-level, anorogenic, peralkaline, slightly peraluminous, topaz-bearing granites with moderately-elevated background uranium counts (e.g, Rossing). The latter younger granites (Spitzkoppe) are related to the break-up of Gondwanaland (130 – 80Ma) and constitute the ultimate source rocks for Trekkopje mineralization, with background contents of 20-30ppm uranium in places.
Between 80Ma and 50Ma, the Namib rocks were eroded to a smooth peneplain, the Namib Unconformity. Namib Group Tertiary and Quaternary sedimentary debris was deposited in east-west to southwest-trending paleo-channels incised into Karibib marbles and schists on that Cretaceous age unconformity. From mid-Tertiary to present, the central Namib region has maintained profoundly arid climatic conditions for the last 50 or more million years. The perpetually dry conditions were interspersed with sporadic regimes of flash floods and high-energy, clastic deposition.
The retreating eastern escarpment was uplifted in the mid-Tertiary, which resulted in renewed incision and erosion of the Namib plain under arid conditions. The uplift initiated the post-African erosion surface that filled valleys and channels with poorly-sorted angular material, with little evidence of chemical weathering or organic debris.
The Quaternary erosion cycle was marked by uplift of coastal areas and marine regression with planation and incision of the post-African erosion surface, with river valleys becoming younger towards the coast. This regional uplift across the Southern African subcontinent resulted in renewal of deposition of coarse sedimentary debris into incised drainage ways, creating the

UraMin, Inc. 6-2 Trekkopje Uranium Project Preliminary Assessment
SRK Consulting (US), Inc. April 2007 Trekkopje.NI 43-101 Preliminary Assessment.163701.MA.006.doc
current drainage channels. Precipitation fluctuations in this period are believed to have effected uranium deposition, dissolution, and re-deposition.
Recent sedimentary cover over much of the region is thin, with 1 to 2m of recent sands and silts mostly covering stream channel detritus, schists, marbles, and dolerite dikes.
Table 6.1.1: Stratigraphic column of the Central Damara Belt
Sequence Group Subgroup Formation Epoch
Sossus Sand
Bloedkoppie (in east) Gawib
Tumas (in west)
Recent to Pliocene
Unconformity Langer Heinrich
Namib
Gobabeb Tsondab
Miocene
Unconformity
Kuiseb
Karibib Khomas
Chuos
Late Precambrian
Unconformity
Swakop
Ugab Rössing Precambrian
Unconformity Khan
Damara Sequence
Nosib Etusis
Precambrian
Unconformity
Abbabis Complex Proterozoic
6.2 Local Geology Uranium mineralization in the Trekkopje Project area is the product of uranium fixation within calcrete deposits. Prospecting of calcrete deposits within the fluviatile systems both in the Namib Desert and in Western Australia has resulted in the discovery of numerous uranium occurrences and deposits that are known collectively as the calcrete-hosted uranium deposit type.
Calcretes are largely calcium carbonate-cemented fluvial and pedogenic shallow sediments that are extensively developed along ancient drainage valleys of arid inland regions, particularly where the rate of evaporation greatly exceeds the rate of recharge in the drainage basin. The arid environment both promotes and contributes to the preservation of calcrete deposits. Groundwater collected over a broad catchment area is transported laterally and focused into the axes of valleys. Near-surface groundwater flow and extremely high evaporation rates promote deposition of calcite plus minor dolomite, celestite, and barite as an inter-granular cement of pebbly grits, sands, and conglomerates. The calcrete deposits are thin (20 to 30m thick in places) and cap paleo-channels or paleo-gorges choked with coarse clastic sediments that can attain up to

UraMin, Inc. 6-3 Trekkopje Uranium Project Preliminary Assessment
SRK Consulting (US), Inc. April 2007 Trekkopje.NI 43-101 Preliminary Assessment.163701.MA.006.doc
several hundred meters in thickness. The upper 1m of alluvium is often cemented by gypcrete, which is a mixture of gypsum and calcite.
6.2.1 Local Lithology The Trekkopje Project paleo-channels trend northeast to southwest and tend to follow the inherited northeast-trending, basement structural grain. Loose surface sands with a depth of 0.5-1.5m cover parts of the deposits. The scale of paleo-channels in the Namib can be on the order of tens of kilometers width to over hundreds of kilometers in length; they are extensive from escarpment to coastal plain. Locally, paleo-channels may be as narrow as 1.0 to 2.0km.
Surface deflation and weathering processes in some parts of the Namib have resulted in the formation of shallow soil profiles. The surface of the Trekkopje deposits is a gently undulating deflation surface composed of poorly-sorted, milky white, quartz fragments and off-white potassium-feldspar fragments ranging in size from a few millimeters to more than 15cm.
The deflation surface (6-4) is underlain by light-brown, unconsolidated, somewhat gritty sediments with coarse and fine layering. This near-surface unit contains or is cemented by gypsum locally. Intense gypsification of the upper surface is a phenomenon observed in Namib sediments from the coast to 100km from the coast but diminishing inland. The deflation surface lies in unconformable contact with the upper calcrete portion of the conglomerates.
The conglomeratic clasts in the paleo-channel valley-fill consist of poorly sorted, rounded to sub-angular, basement debris (marble, gneiss, granite, quartz, dolerite, and pegmatite). The valley fill sediments are highly variable and consist of alternating layers of variable thicknesses of conglomerate, grit, sand, clay-grit, and clay. The sediments are largely conglomeratic (~80%), with minor lenses of sands (~10%) and clays (~5%), interspersed with rare boulders and cobbles (<5%). This variable lithology reflects rapid changes in water velocity, with erratic deposition of bed loads noted throughout prospective horizons. The sediments are poorly consolidated, ranging from friable in the upper zones to massive and weakly lithified at depth. Later cementation by calcium carbonate has produced a hard compact rock beginning at depths of one to two meters or more.
Cementation of the clastic material began at some time in the mid-Tertiary, and proceeded in intermittent stages with deposition of calcite, plus minor dolomite, celestite, and barite. In the cementation process, calcite crystallization increases permeability of the horizon by wedging clasts apart to form voids and fracture sites favorable for precipitation of later uranium mineralization. The calcretes of the Namib are stratiform in nature, but locally vary in development due to the inherent permeability contrasts of the various sedimentary lithologies. Drilling in the Trekkopje deposits indicates that calcrete horizons begin at surface or typically 1 to 2m depths, and can occasionally occur deeper at 7 to 10m depths. On the average, the calcrete horizons persist to a depth of 20m; exceptional horizons persist to 30m.
Historical drill logs (Cadrim/Dong-Trieu, Gulf Western, and InterConsult) fail to provide any in-depth representative descriptions of the upper prospective calcretized portions of paleo-channel conglomerates. Drilling by UraMin and detailed logging and observation of drillcore by UraMin geologists have led to construction of drill logs that abstract the range of clastic stratigraphy and calcrete features that are important for prospecting and geologic modeling. The four sedimentary units listed in Figure 6-2 can occur in any order, although the calcrete conglomerate (Horizon A) and the porous/permeable conglomerate (Horizon C) are by far the more common lithological

UraMin, Inc. 6-4 Trekkopje Uranium Project Preliminary Assessment
SRK Consulting (US), Inc. April 2007 Trekkopje.NI 43-101 Preliminary Assessment.163701.MA.006.doc
assemblages observed. Detailed Stratigraphy correlation between Trekkopje drill holes is not possible, due to the aforementioned chaotic nature of deposition of sediments, and the inability to define units in RC or percussion drilling.
Table 6.2.1.1: Lithologic Associations of Trekkopje Ssediments Unit Name Description
Rudaceous Pink-orange in color Matrix calcrete > 50 % Rounded to sub-rounded clasts Variable clast sizes from a few millimeters to > few centimeters in diameter
A Competent Calcrete/Conglomerate
Competent calcrete Arenaceous Ferruginous (matrix) Matrix calcrete < 15 % Rounded to> sub-rounded fragments Clast sizes 1/16 to 2 mm;; few patches of calcite @ places
B Sandstone
Friable sand Intermediate or arenite to rudite Ferruginous in arenitic places and pink-orange in ruditic places Matrix calcrete 15 - 40 % % Rounded, sub-rounded, and subangular clasts Variable clast sizes
C Porous/Permeable Calcrete/Conglomerate
Moderately competent Argillaceous Calcareous to weakly ferruginous Overall grain size < 1/16 mm D Mudstone/Muddy Sandstone
Develops dessication cracks when it dries E Bedrock Marble F Bedrock Bedrock schist
6.2.2 Alteration Dominant alteration of the sedimentary sands and conglomerates is calcium carbonate cementation (calcrete), which is often an indicator of uranium mineralization. Both calcrete and carnotite precipitation occur in low-temperature, neutral to alkaline solutions where groundwater is in equilibrium with calcrete. Silicate alteration of clastic sediments within the deposits has not been identified. Acidic transport phases (below pH of 3) are absent indicating absence of acidic conditions; therefore, feldspar, mica, and clay remain in their diagenetically deposited state, essentially unaltered. The development of various minerals, such as sepiolites, and mixed-layer clays in a localized saline environment appears likely, but has not been investigated from a rigorous sedimentary/petrological approach.
6.2.3 Structure The predominant and indirect structural control on the Trekkopje deposits has been the inherent basement control that in part determined the northeast-trending geometry of the stream channels. Paleo-channel sedimentary deposition and calcrete development have occurred over a 50Ma interval, during which the Central Namib region has been relatively tectonically stable, as the air/moisture movements in the region have not changed significantly since the mid-Tertiary. The structural grain is a reflection of the Damaran orogenic belt and internal lithologic contacts, which were influenced or inherited from Mesoproterozoic crustal structures. The second major structural feature is an eastward-retreating escarpment, along which differential uplift has
UraMin, Inc. 6-5 Trekkopje Uranium Project Preliminary Assessment
SRK Consulting (US), Inc. April 2007 Trekkopje.NI 43-101 Preliminary Assessment.163701.MA.006.doc
provided renewed erosion, incision, and deposition to the west. Both aeromagnetic and remote-sensing surveys reveal the pronounced northeast-trending basement grain and a lesser east-west incision grain.
The calcrete horizons below a depth of approximately five-to-seven meters become quite massive and hard, jointed, and, on rare occasions, fractured. Fracturing within the calcretes tends to be minor overall and is related to primary or secondary sedimentary processes. Fracturing has been observed in one of UraMin’s four excavated pits at the Trekkopje deposit. The pit, situated near the edge of a paleo-channel above shallow bedrock, shows vertical fracturing within the calcrete that is suggestive of sedimentary compaction during carbonate diagenesis or groundwater withdrawal and of the resultant settling along a paleostream edge. Both carnotite and gypsum crystals lining the fracture walls are observed in these open-spaced fracture systems. Jointing observed in drill core tends to be low-angle and sub-parallel to inferred bedding. This jointing possibly reflects original permeability differences, rather than tectonism, and is often filled with gypsum in the near surface environment.

UraMin, Inc. 6-6 Trekkopje Uranium Project Preliminary Assessment
SRK Consulting (US), Inc. April 2007 Trekkopje.NI 43-101 Preliminary Assessment.163701.MA.006.doc
Figure 6-1: Tectonostratigraphic Map of Namibia

UraMin, Inc. 6-7 Trekkopje Uranium Project Preliminary Assessment
SRK Consulting (US), Inc. April 2007 Trekkopje.NI 43-101 Preliminary Assessment.163701.MA.006.doc
Figure 6-2: Trekkopje Project Geology Map
Map by Geological Survey of Namibia

UraMin, Inc. 6-8 Trekkopje Uranium Project Preliminary Assessment
SRK Consulting (US), Inc. April 2007 Trekkopje.NI 43-101 Preliminary Assessment.163701.MA.006.doc
Figure 6-5: Fluviatile Setting of Trekkopje Deposits, Namibia
Note: map from Hambleton-Jones and others, 1986

UraMin, Inc. 7-1 Trekkopje Uranium Project Preliminary Assessment
SRK Consulting (US), Inc. April 2007 Trekkopje.NI 43-101 Preliminary Assessment.163701.MA.006.doc
7 Deposit Types (Item 10) The uranium-vanadium mineralization at the Trekkopje Project consists of one deposit type, calcrete-hosted mineralization. Calcrete uranium-vanadium deposits are a genetic type of secondary uranium mineralization found in arid desert regions of the world, such as Western Australia and western Namibia. The key regional features that are typically related to calcrete uranium-vanadium deposition include the following characteristics (Mann and Deutscher, 1978):
• Primary uranium-bearing source rocks, such as uraniferous granites which can, upon erosion, provide dissolved uranium into groundwater from a large source area;
• Closed or constricted drainage basins that provide selective pathways for uraniferous groundwater;
• Vanadium present in the groundwater; possibly sourced from basement rocks along the path of the groundwater movement; and
• A catchment basin or other geo-hydrological constraint that allows for the slow moving groundwater to up-well, partially evaporate, and in the process, through changes in salinity and/or reduction-oxidation states, to precipitate carnotite along with calcium carbonate.
The deposits are typified by carnotite uranium mineralization irregularly disseminated in the host rocks, which are typically paleo-channel sands and gravels that have been cemented to varying degrees by calcium carbonate cement. In most desert regions, “caliche” or carbonate-cemented surficial sands and gravels are a local analogue. Carnotite [K2(UO2)2V2O8·3H2O (hydrated potassium uranyl vanadate)] is the dominant uranium-vanadium mineral. However, tyuyamunite (Ca(UO2)2V2O8·5-8H2O), a similar associated mineral with calcium substituted for the potassium and with a different degree of hydration, can also be present and is indistinguishable from carnotite in hand specimens.
Calcrete uranium deposits have been known from exploration discoveries in western Namibia and western Australia since the early 1970s. Deposit size and grade can vary significantly from a few million tonnes to over 100 million tonnes (Mt); with grades ranging from 100ppm U3O8 (0.01% U3O8) to over 0.10% U3O8. Known calcrete uranium deposits worldwide include the Yeelirrie deposit in Western Australia and the Langer Heinrich deposit in western Namibia. Langer Heinrich is located less than 100km south from the Trekkopje deposit. The Namib calcrete deposits are hosts to six documented uranium deposits: Aussinanis, Tubas, Tumas, Langer Heinrich, Trekkopje (Klein Trekkopje and Trekkopje), and Spitskoppe. The deposits share much in common with the calcrete deposits of Australia’s Yilgarn terrane (Yeelirrie and Hinkler Well deposits).
The Trekkopje deposit has a long-dimension of N60E in plan, with dimensions of 4.0km northeast-southwest by 2.0km across strike, with thicknesses varying from 1.0m to more than 10.0m. All mineralization exists at depths of from 0.0m to more than 25.0m, with most from 0.0 to 10.0m in depth. The Klein Trekkopje deposit has a northeast-southwest strike extent of 16.0km, a width of 1.5 to 4.5km, and a thickness and depth of mineralization similar to Trekkopje.

UraMin, Inc. 8-1 Trekkopje Uranium Project Preliminary Assessment
SRK Consulting (US), Inc. April 2007 Trekkopje.NI 43-101 Preliminary Assessment.163701.MA.006.doc
8 Mineralization (Item 11)
8.1.1 Uraniferous calcrete deposits The uraniferous calcrete deposits worldwide are unique in that the mineralogy of the uranium mineralization is restricted largely to one mineral species, carnotite, which is a potassium uranyl vanadate with the formula K2(UO2)2V2O8.1-3(H2O). Other rare minerals noted in this class of deposits are tyuyamunite (CaUO2)2(VO4)2.5-8H2O, which is a calcium analog of carnotite. Differentiation between the two minerals requires laboratory confirmation, but metallurgically they behave similarly. Soddyite (UO2)2SiO4.2(H2O), which is a product of oxidized uranium mineralization, has been identified elsewhere in the Namib uraniferous calcretes. Dating of the Trekkopje deposits indicates an age of 2 to 5Ma for the most recent mobilization of uranium mineralization. Further mineralogical work is being done by Uramin to verify carnotite as the dominant uranium-vanadium mineral, and to identify other suspected vanadium mineral species.
8.1.2 Trekkopje Mineralization Carnotite mineralization at Trekkopje is authigenic, with potassium and uranium leached from source granites and carried in an aqueous state as uranyl ions in chloride or carbonate complexes. The overall stratiform nature of carnotite mineralization reflects the nature of the groundwater oxidation/evaporation interface within calcrete horizons. Perturbations in the undulating geometry of the uranium horizons drilled at Trekkopje may be attributed to the interplay of local calcrete development and void space, clay content, and permeability contrasts within individual groundwater regimes through time that affect the Eh-pH balance of the system.
Carnotite mineral growth occurs in zones of high porosity as clast coatings and interstitially in cavities within clastic sediments, along grain boundaries, and in fractures and cavities associated with development of calcite, dolomite, and gypsum. Clast wedging and fractures related to diagenesis or groundwater withdrawal, and by the growth of calcium carbonate crystallization, create void space within calcrete, which is a necessary factor for precipitation of carnotite. Mineralization seen in Trekkopje drill core is largely lemon- or canary- yellow in color, with minor greenish-yellow carnotite seen in samples collected nearer the surface. The mineralization tends to be friable, and hence necessitates care in sampling programs. Small carnotite grains are also associated with or attached to fine clay particles.
At Trekkopje, some carnotite has been dissolved and re-precipitated down the hydraulic gradient to the west by changes in chemistry and successive groundwater regimes. Uranium decay results in radioactive daughter products remaining in place after the parent uranium grains are dissolved and removed. This uranium dissolution process can lead to spurious radiometric readings obtained from the remnant, in-place, daughter products that would otherwise indicate the presence of uranium, while chemical analyses show the uranium has been depleted. This process is referred to as disequilibrium, and has obvious ramifications in resource/reserves estimates. At Trekkopje, there are indications that disequilibrium is a minor factor, affecting portions of the Klein Trekkopje deposit (see Section 16-2 for a discussion of disequilibrium for the Trekkopje Project).
Gangue mineralization affiliated with the Trekkopje deposits includes the earlier calcrete minerals and gypsum. Calcite, dolomite, celestite, and barite occur within the upper 20 to 30m of paleo-channels, and recent gypsum occurs in the upper meter or two beneath the loose surface sediments.

UraMin, Inc. 8-2 Trekkopje Uranium Project Preliminary Assessment
SRK Consulting (US), Inc. April 2007 Trekkopje.NI 43-101 Preliminary Assessment.163701.MA.006.doc
The identification and extent of sulfate minerals is important at Trekkopje, as their presence in the mined rock can result in increased reagent consumption during metallurgical processing. Mintek’s X-Ray Diffraction (XRD) – Scanning Electron Microscope (SEM) –Atomic Absorption Spectroscopy (AAS) – X-Ray Fluorescence (XRF) – Inductively Coupled Plasma (ICP) examination of 40 mineralized samples collected by InterConsult’s 1999 drilling program identified celestite (SrSO4) that was locked in a calcite/clay mixture. Celestite, along with carnotite and barite, also occur as liberated grains and associated with matrix clay and calcite, or sometimes simply attached to gangue minerals. XRD peak plots indicate differing concentrations of gangue minerals within and between drill holes, corresponding to aforementioned permeability contrasts of original sediments. Gypsum is the predominant sulfate mineral present at the Trekkopje Project, usually forming gypcrete crusts in surficial deposits, and gypsum fracture filling in sub-horizontal joints in the near surface few meters.
Other gangue minerals include minor clay present within a calcite matrix. Iron oxide or hydroxyl minerals occur as fine coatings on other minerals. Other minerals identified in Mintek’s 1999 mineralogical examination include the host conglomerate rock-form minerals quartz, feldspar, zircon, fluorite, monazite, Fe-Ti minerals, and locally significant barite (liberated or in association with other matrix minerals), and trace sphene and xenotime.
Minor manganese oxides (possibly braunite (Mn+2Mn+3)(6)SiO12)) tend to occur with carnotite in the upper portions of the Trekkopje deposits as a fine- to coarsely-disseminated mineral. It is not clear if manganese mineralization is a surficial weathering product or is syn-depositional with carnotite; however, the presence of manganese oxides is relatively minor.
8.1.3 Trekkopje Mineralization Types Mineralization at the Trekkopje Project is noted as being visible disseminations, encrustations, and coatings of carnotite in the matrix of calcrete-cemented conglomerate. Visual observations in shallow prospecting pits and drill core completed as of early August 2006 indicate two types of carnotite mineralization:
Type 1 mineralization consists of disseminations of carnotite mineral aggregates, and is located interstitial to conglomerate clasts in the matrix, on fracture surfaces (rare and only seen in one pit), and coating clasts within the conglomerate. Type I mineralization is, as subjectively observed, the dominant type of mineralization noted thus far with core drilling that is still ongoing at Klein Trekkopje. Type I mineralization is common in the more porous and permeable portions of partially calcium carbonate cemented conglomerate (logged as Unit C) (Figures 8-2 through Figures 8-8).
Type 2 mineralization consists of carnotite that is internal to calcium carbonate cement in matrix of conglomerate, as shown in Figures 8-2, 8-7 and 8-8.
Carnotite is the only uranium-bearing mineral identified thus far at Trekkopje. It is bright yellow, non-fluorescent, soft (hardness of 2), and radioactive. Carnotite is readily visible in pits and core at Trekkopje, and generally is visible in rocks with anomalous radioactivity.
8.1.4 Geochemistry There is limited historical information pertaining to the multi-element geochemistry of the deposits. Multi-element geochemical data are being collected by UraMin for evaluation as the project progresses.

UraMin, Inc. 8-3 Trekkopje Uranium Project Preliminary Assessment
SRK Consulting (US), Inc. April 2007 Trekkopje.NI 43-101 Preliminary Assessment.163701.MA.006.doc
Mintek (1999) examined 40 samples from three InterConsult drill holes by various methods. Their laboratory studies indicated that higher uranium values in general were associated with higher vanadium values, but the association was not proportional. Strontium values, while showing distinct highs, do not correlate with uranium values, and are observed to occur at differing intervals in the sequence. Gypsum concentrations, while highest in most holes in the top several meters, can occur at variable depths, and can vary in concentration.
Uranium and vanadium are the primary metals of interest. Vanadium occurs in carnotite in the ratio of 3.087 units of U3O8 for every 1.0 units of V2O5; the vanadium is tied up in the crystal lattice of carnotite. V2O5 assays that are greater than this ratio indicate additional vanadium is present in likely association with clays. See Section 15.0 regarding the potential for recovery of vanadium along with uranium in proposed mineral processing options.

UraMin, Inc. 9-1 Trekkopje Uranium Project Preliminary Assessment
SRK Consulting (US), Inc. April 2007 Trekkopje.NI 43-101 Preliminary Assessment.163701.MA.006.doc
9 Exploration (Item 12) Discussion in this section relates to UraMin exploration efforts beginning in late 2005 and continuing through January 2007. For a discussion of historical exploration activities, see Section 5.0 – History.
UraMin conducted initial exploration efforts as a Phase 1 drilling to confirm the historical work that delineated the Trekkopje and Klein Trekkopje deposits. That work consisted of initial drilling of 50 percussion drill holes for which spear sampling of the sample cutting piles were collected and analyses by XRF methods for uranium and vanadium. That effort was not conducted on a particular grid, but rather was designed to test various portions of both deposits based on historical information. Gamma probe eU3O8 data and XRF assay data were received that indicated the presence of both uranium and vanadium in amounts similar to that from historical drilling. Due to the nature of the sampling, and poor cross-lab correlation on XRF data from those samples, these Phase I drilling results are not used in the current drill hole database or the resource estimate described in Section 16. Phase 1 drilling set the stage for a more comprehensive program of test pits and grid drilling programs.
A total of four test pits were excavated at the Trekkopje deposit early in 2006. These pits were excavated to depths of 5.0m, and were sampled by the channel-cut method for uranium mineralization. Test pits provided a first look at the geology of the host rocks and also confirmed uranium mineralization.
In May 2006, UraMin initiated a program of reverse circulation (RC) confirmation drilling (Phase 2A) across a 600m x 800m grid over both the Trekkopje and Klein Trekkopje deposits. The Phase 2A program was laid out along the resurrected historical drill grid and with the following multiple purposes:
• Provide RC samples for analysis along with quality QA/QC standards, blanks and replicates to verify chemical uranium content;
• Confirm across the full length and width of each deposit, the location and grade ranges of historically defined uranium mineralization;
• Comparison of RC sample analyses with down-hole radiometric probe gamma logs to examine chemical/radiometric equilibrium across the deposits; and
• Provide geological information; depth of alluvial cover, depth to bedrock, and depth of water table.
Phase 2B drilling was initiated in June, as percussion drilling on 200m x 400m spacing coincident with the same historical drill grid. This was done as re-opening and or re-drilling historical holes at the approximate location of historical holes. It was done to re-generate the information that was defined historically, as the historical drilling data lacks backup historical gamma logs and assay certificates, and therefore could not be relied upon completely for the purpose of CIM-compliant resource estimation.
A Phase 3 drilling, which consists of infill drilling on 200m x 200m spacing, was initiated in late July, and was completed by November 15, 2006 for both deposits.
An area 400m x 400m at the Klein Trekkopje deposit was drilled on 50m x 50m spacing for examination of grade variations and variography – Phase 4 drilling. It was concluded that 200m

UraMin, Inc. 9-2 Trekkopje Uranium Project Preliminary Assessment
SRK Consulting (US), Inc. April 2007 Trekkopje.NI 43-101 Preliminary Assessment.163701.MA.006.doc
x 200m spacing was sufficient to quantify a large potion of the deposits into the Measured and Indicated resource categories; and is the basis for the current resource estimation in Section 16 of this report. Subsequent to the resource estimation update in January and February 2007, it was determined that a significant total tonnage, approximately 97Mt of material, contains sufficient sulfate to be of concern in the proposed mineral processing, and b) the SO4 grade of the sulfate-bearing material was defined only by widely spaced RC drilling of Phase 2A (see above), an insufficient amount of information to establish reportable grades. To quantify the sulfate-bearing material, which also contains uranium grade, UraMin initiated a Phase 5 drill program in mid-January 2007, a 5-spot drilling pattern for both Trekkopje and Klein Trekkopje, as RC drilling. The goal of this last phase of resource definition drilling is three-fold:
• Provide sufficient samples for assay to accurately define the SO4 grade of sulfate-bearing material;
• Provide sufficient samples for U3O8 assays to quantify in sufficient detail areas of potential dis-equilibrium of radiometric versus chemical uranium analyses; and
• Provide for further conversion of inferred resource to measured and Indicated as a result of the increased drill density across the deposits.
A 5-spot drillhole is a hole drilled as infill in the center of each 200m x 200m drill grid of 4 holes, hence the term 5-spot. It results in a nominal grid spacing of 141m, is ongoing, and will used for the final resource estimate to input into the mine planning and reserve estimation part of the BFS.
UraMin completed a detailed topographic survey tied to the regional survey monuments and to the drill holes, established with differential GPS equipment to 100mm accuracy; providing a topographic map with 0.5m countour intervals.
Additional exploration activities ongoing or anticipated by UraMin in the coming months include exploration drilling to be conducted in areas of prospective historical holes exterior to the Trekkopje and Klein Trekkopje deposits and within the existing property boundary, and untested exploration targets.
UraMin is conducting exploration at the Trekkopje project from a camp facility at the site. Total project expenditures at the Trekkopje Project from January 1, 2005 through December 31, 2006 total approximately US$1,500,000.
9.1.1 Exploring Drilling Results UraMin’s exploration has been well planned and executed, is using industry standard methodologies, and is generating the information necessary to accurately describe and document the uranium mineralization at Trekkopje and Klein Trekkopje. The exploration data is appropriate for the style of mineralization.
All drill holes are vertical holes to 20 to 30m depths in nearly horizontal mineralization; therefore, they represent true thickness intercepts of mineralization. Exploration results are not discussed in detail here, as they are discussed in Section 16.0 as the basis for resource estimates. Drill hole locations maps are shown below in Figures 9-3 and 9-4.

UraMin, Inc. 9-3 Trekkopje Uranium Project Preliminary Assessment
SRK Consulting (US), Inc. April 2007 Trekkopje.NI 43-101 Preliminary Assessment.163701.MA.006.doc
Figure 9-2: Plan Map of Phase 2A RC Drilling – Trekkopje Project
Note: map by UraMin, 2006 showing colored radiometric signature, the outline of historical mineral resource boundaries, and location of UraMin RC drill holes – 600 by 800m grid. Note: Phase 2A RC drilling was completed in early July with 123 drill holes for 2,153 m of drilling. Results confirmed historical grade ranges and locations of uranium mineralization.

UraMin, Inc. 9-4 Trekkopje Uranium Project Preliminary Assessment
SRK Consulting (US), Inc. April 2007 Trekkopje.NI 43-101 Preliminary Assessment.163701.MA.006.doc
Figure 9-3: Drill Hole Location Map – Trekkopje Deposit, All Holes; 200 x 200m Grid

UraMin, Inc. 9-5 Trekkopje Uranium Project Preliminary Assessment
SRK Consulting (US), Inc. April 2007 Trekkopje.NI 43-101 Preliminary Assessment.163701.MA.006.doc
Figure 9-4: Drill Hole Location Map – Klein Trekkopje Deposit, All Holes; 200 x 200m Grid
Note: Area of 50 x 50m grid drilling shown by black square.

UraMin, Inc. 10-1 Trekkopje Uranium Project Preliminary Assessment
SRK Consulting (US), Inc. April 2007 Trekkopje.NI 43-101 Preliminary Assessment.163701.MA.006.doc
10 Drilling (Item 13) Drilling conducted at the Trekkopje Project by UraMin has been by a combination of RC (reverse circulation), percussion, and core drilling techniques. Drilling methods utilized were observed by the author, at various times, during the period of May 25 though August 5, 2006. Drilling techniques and the equipment used are industry-standard procedures and equipment and are appropriate for the mineralization at Trekkopje and Klein Trekkopje. All drilling is as vertical holes to test essentially flat lying mineralization, and therefore drilled intercepts are true thickness intercepts.
RC drilling was conducted with a rubber-tired buggy drill using a face-discharge drill bit to minimize the possibility of sample contamination. Drilling was done with air injection and samples were collected in a double cyclone to minimize sample loss. Most drilling was dry.
Percussion drilling used the same or similar drill rigs without the dual-walled RC steel. In addition, a track-mounted, production blast-hole drill was used. The percussion holes were drilled with the primary purpose of providing a drill hole within which to conduct down-hole gamma logging; drill samples were a secondary objective.
Core drilling was done with a truck-mounted standard Longyear 38 core drill and HQ size core.
A summary of the drill programs is listed in Table 10.1.
Table 10.1: Summary of UraMin drilling at Trekkopje Project (November 2006) Deposit Drilling Type Number of Drill Holes Meters
Trekkopje RC 35 530 Trekkopje Percussion 425 7,477 Trekkopje Core 21 475 Trekkopje All 481 8,482 Klein Trekkopje RC 87 1,624 Klein Trekkopje Percussion 1,199 28,010 Klein Trekkopje Core 36 767 Klein Trekkopje All 1,322 30,401 Project Total All 1,803 38,883 Note: Only drilling utilized for resource estimation; includes 50m x 50m drilling; excludes Phase I drilling and 5-spot drilling in progress
Drill hole locations were originally determined by hand-held global positioning system (GPS) measurements, and then were surveyed in the field to provide better accuracy in collar X, Y, and Z coordinates. Drill hole collars are compared for Z (elevation) accuracy against topography.
SRK considers the drilling methods, equipment used, drill orientations, and nominal drill spacing to be adequate to support the resource estimations provided in Section 16 of this report.

UraMin, Inc. 11-1 Trekkopje Uranium Project Preliminary Assessment
SRK Consulting (US), Inc. April 2007 Trekkopje.NI 43-101 Preliminary Assessment.163701.MA.006.doc
11 Sampling Method & Approach 11.1 RC Drilling Phase 2A drilling was by RC drilling methods as described in Section 10. RC samples were collected from a cyclone as dry samples and were collected for 1.0m drilled intervals. The entire sample was split twice on site in a riffle splitter, to produce an A-split sample of approximately 5 to 7kg, which was bagged and shipped for geochemical analysis. The remaining B-split samples have been bagged and stored at site. The same drilling procedures are used for the ongoing 5-spot RC drilling. RC drill holes are gamma logged for comparison against uranium assays from RC samples (see discussion of gamma logging in Section 11.2)
UraMin’s procedure of RC drilling to provide samples for uranium and vanadium analyses as a check against radiometric probe data is an industry-standard procedure and is an appropriate sampling technique for the calcrete-hosted mineralization. Sample intervals of 1.0m are also appropriate and sufficient to test the mineralized intervals at Trekkopje and Klein Trekkopje.
11.2 Percussion Drilling Typical for uranium projects, most sample analytical work is done as a check on the primary grade measuring tool, which is the down-hole gamma probe. Down-hole gamma logging (down-hole probing) is conducted at the Trekkopje Project in all drill holes, the majority of which are percussion drill holes. UraMin is using their own gamma probe, which is a Model 4MGX II logging system, and a 2PGA-1000 gamma probe manufactured by Mount Sopris Instrument Company Inc, of Golden, Colorado. Mount Sopris has been a manufacturer of bore hole logging instrumentation since the 1960s. The method of down-hole radiometric logging is further discussed in Section 13.6 - Radiometric Analyses.
Percussion holes are drilled for the primary purpose of providing a drill hole in which to conduct gamma logging. Percussion samples are collected and numbered, and have been analyses for some holes at Klein Trekkopje, but sample results indicate down-hole contamination; therefore, PC damples are not used in the database for resource estimation purposes. Percussion samples can be used for minimal geological purposes, such as defining the depth of cover rock, depth to bedrock, depth to water table, and possibly lithological changes within the calcrete bedrock. For this reason, the percussion samples are bagged and retained as 1.0m samples from each hole, and are stored for future use.
UraMin is using the radiometric probe data, converted to eU3O8 grades as the basic data in the drill hole database for both Trekkopje and Klein Trekkopje. This was accomplished on all percussion holes and on RC holes as well. Using radiometric probe data is an acceptable industry-standard procedure for evaluating uranium deposits, provided there is sufficient QA/QC data collected as defined in Section 13.4 of this report. UraMin’s application of radiometric logging to determine grades at the Trekkopje Project is well planned and executed, has been calibrated against a known uranium source, continues to be checked for instrument error and/or drift; and is therefore acceptable eU3O8 data.
Typical radiometric data is gathered as 1.0cm down-hole counts per second (CPS) readings, collected as digital data and plotted as graphical data. Figure 11-1 is an example of a graphical depiction of the gamma log derived from the down-hole probe in drill hole TKPC159 at

UraMin, Inc. 11-2 Trekkopje Uranium Project Preliminary Assessment
SRK Consulting (US), Inc. April 2007 Trekkopje.NI 43-101 Preliminary Assessment.163701.MA.006.doc
Trekkopje, showing uranium mineralization from 0.75 to 3.0m in drill depth that equates to 149ppm eU3O8.
11.3 Core Drilling Core drilling samples are HQ-sized (63.5mm dia) core, collected as whole core and placed in metal core trays. Core was collected for the following three purposes:
• Examination of geological controls, lithology, uranium mineralization, carbonates and gypsum content throughout the deposits;
• Geotechnical information on rock competency and excavatability, and specific gravity; and
• Additional assay information and/or samples for metallurgical testing.
Geological and geotechnical information are the primary use for core; analytical purposes are secondary. Core from both Trekkopje and Klein Trekkopje have been logged for geology and geotechnical information. Core was saw-cut in half, and one half of the core was used for analytical samples, retaining the other half in storage. Core will be sampled based on observable or radiometric defined mineralized intervals. Analytical purposes include bulk material for metallurgical testing.
Core logs are simple but are satisfactory to describe the rock units and the mineralization at the Trekkopje Project. Core logs describe the basic rock type; competent calcrete conglomerate (Unit A), sandstone (Unit B), porous and permeable calcrete conglomerate (Unit C), and mudstone or muddy sandstone (Unite D), as well as bedrock lithology where observed. Core log descriptions include clast lithology, clast size, and degree of rounding, as well as a description of the mineralization, and notes on rock competency.
UraMin’s sampling methods and approach to gathering deposit information are appropriate and adequate to provide a proper representation of the deposit mineralization for the Trekkopje and Klein Trekkopje uranium deposits.

UraMin, Inc. 11-3 Trekkopje Uranium Project Preliminary Assessment
SRK Consulting (US), Inc. April 2007 Trekkopje.NI 43-101 Preliminary Assessment.163701.MA.006.doc
Figure 11-1: Gamma Log for TKPC159

UraMin, Inc. 12-1 Trekkopje Uranium Project Preliminary Assessment
SRK Consulting (US), Inc. April 2007 Trekkopje.NI 43-101 Preliminary Assessment.163701.MA.006.doc
12 Sample Preparation, Analyses & Security (Item 15)
Sample preparation relates to RC drill samples. Percussion drill samples are not regularly used for analyses at this point in time. Digital gamma log data are converted to equivalent assays and therefore the process is described in this section as an analytical procedure. Core samples largely been used to collect samples for specific gravity, geology, and for metallurgical/mineralogical study.
12.1 Analytical Procedures Industry-standard analyses for chemical uranium (expressed as either ppm or percentage U or U3O8) are typically done by two methods; induction coupled plasma-mass spectrography (ICP-MS), and X-ray fluorescence spectrometry (XRF). In XRF, a beam of electrons strikes a target element causing the target to release a primary source of X-rays. These primary X-rays are then used to irradiate a secondary target (the sample), causing the sample to produce fluorescent (secondary) X-rays. These fluorescent secondary X-rays are emitted with characteristic energies that can be used to identify the element from which they arise. The number of X-rays measured at each characteristic energy can therefore be used to measure the concentration of the element from which it arises. Samples of unknown concentration are compared with well-known international standard reference materials in order to define precise concentration levels of the unknown sample. XRF analyses for uranium comprise the primary method of the analyses performed on RC samples from the Trekkopje Project.
The ICP method, which involves an acid digestion of the sample, can also be used for analysis of uranium and many other elements. The XRF method is the primary method of analysis at the Trekkopje Project, with ICP used for check assays.
12.2 Sample Preparation & Assaying The preparation of samples for analyses involves one of two methods. Samples for ICP analyses typically are prepared by sample digestion with four acids to achieve maximum dissolution of elements. Samples for XRF analyses are prepared by fusion of the sample material with another compound to form a glass-like disk. The fusion technique of sample preparation minimizes particle size effects that could otherwise cause problems with the measurement process. Numerous trace elements can also be determined from the same fused disk. The disks themselves can be stored indefinitely.
12.3 Quality Controls & Quality Assurance UraMin Inc has instituted a system of QA/QC protocols for all exploration projects, including the Trekkopje Project. The protocols are documented and were adhered to at the Trekkopje Project. The program consists of insertion of 20 quality control samples per hundred explorations samples submitted to the analytical lab. The standard program is implemented by following one or more templates as per the sample below:
The result is 20 QC samples submitted per 100 drill samples, or 20% of the samples stream to the lab; a higher percentage than typically used industry-wide. At the Trekkopje Project, a uranium standard, UREM-4 was used; a Mintek, South Africa standard with 100ppm U3O8. A total of 560 QC samples were submitted with the RC drill samples. Results were monitored for
UraMin, Inc. 12-2 Trekkopje Uranium Project Preliminary Assessment
SRK Consulting (US), Inc. April 2007 Trekkopje.NI 43-101 Preliminary Assessment.163701.MA.006.doc
significant deviations and those few sample batches with indicated deviations in the QC sample results have been re-run.
The resource estimates in Section 16 of this report are based entirely on radiometrically determined eU3O8 data; and the radiometric probe data QA/QC procedure is described in Section 13.4
12.4 Sample Security RC samples were collected at the drill site under the supervision of UraMin staff geologists, transported by UraMin staff to storage at the camp site, and then to the town of Arandis for commercial truck transport to the SGS analytical laboratory in Johannesburg, South Africa. Samples retained are under UraMin supervision at the camp site.
12.5 Analytical Laboratory Certifications SGS-Lakefield of South Africa, and ALS Chemex of South Africa and Vancouver, Canada, are the analytical labs used for the Trekkopje Project. Both labs are internationally known labs that have provided analytical services to the mining industry for decades.
SGS Lakefield is and accredited ISO/IEC 17025 laboratory, accredited through SANAS (South African national Accreditation System) for chemical testing.
ALS Chemex holds ISO 9002:1994 and ISO 9001:2000 certifications. The purpose of the ISO 9002:1994 standard is described in this quote from Praxiom Research Group’s internet site at http://www.connect.ab.ca/~praxiom/9002.htm. The quote applies to ISO 9002, but the intent of ISO 9001:2000 is similar.
“ISO 9002 is a quality assurance model made up of quality system requirements. This model applies to organizations that produce, install, and service products. ISO expects organizations to apply this model, and to meet these requirements, by developing a quality system.”
12.6 Radiometric Analyses The basic analysis that supports the resource estimate for the Trekkopje Project is the down-hole gamma log derived from the down-hole radiometric probe. That data is gathered as digital data on 1.0cm intervals as the radiometric probe is extracted from a drill hole, reading from the bottom of the hole upwards.
The down-hole radiometric probe measures total gamma radiation from all natural sources including uranium-bearing minerals plus potassium (K) and thorium (Th). In most uranium deposits, K and Th often provide a minimal component to the total radioactivity, measured by the instrument as counts per second (CPS). At the Trekkopje Project, the uranium content is low enough that the component of natural radiation that is contributed by K and Th can be 10% or more of the total CPS, and is therefore accounted for in the conversion of CPS to equivalent uranium concentrations. Thus, determined equivalent uranium analyses are typically expressed as parts per million (ppm) eU3O8 (“e” for equivalent) and should not be confused with U3O8 determination by standard XRF or ICP analytical procedures. Radiometric probing (gamma logs) and the conversion to eU3O8 data have been industry-standard practices used for in situ uranium determinations since the 1960s. The conversion process can involve one or more data corrections; and therefore the process used for the Trekkopje Project is described here.

UraMin, Inc. 12-3 Trekkopje Uranium Project Preliminary Assessment
SRK Consulting (US), Inc. April 2007 Trekkopje.NI 43-101 Preliminary Assessment.163701.MA.006.doc
The Mount Sopris 2PGA 1000 probe is about 5cm in diameter and just under a meter in length. The probe has a standard sodium iodide (NaI) crystal that is common to both hand-held and down-hole gamma scintillation counters. The Mount Sopris 4MGX II logging system consists of the winch mechanism and digital data collection device that controls the probe in and out of the hole and the rate at which it is logged, and the interface with a portable computer that collects the radiometric data as CPS.
Raw data is plotted by Wellcad software to provide a graphic down-hole plot of CPS. The CPS radiometric data may need corrections prior to conversion to eU3O8 data. Those corrections account for water in the hole (water factor), the instrumentation lag time in counting (dead time factor), and corrections for reduced signatures when the readings are taken inside casing (casing factor). The water factor and casing factor account for the reduction in CPS that the probe reads while in water or inside casing, as the probes are typically calibrated for use in air-filled drill holes. Water factor and casing factor corrections are made where necessary to Trekkopje Project gamma log data; however, very few drill holes or drill hole intervals are affected. The dead time factor for the 2PGS-1000 probe is a number that is approximately 8 x 10⁻⁶ (0.000008), and is therefore insignificant to the CPS corrections at the Trekkopje Project.
Conversion of CPS to ppm eU3O8 is done by calibration of the probe against a source of known uranium and thorium concentration. This was done for the UraMin Probe at the Pelindaba Calibration Facility in South Africa by QuickLog Geophysics (Pty) Ltd. of Johannesburg, in January 2006 (Campbell and others, January 2006). The calibration calculation results in a “K-factor” for UraMin’s 2PGA-1000 probe; the K-factor is 1.0CPS total count = 0.128ppm eU3O8, 1.0CPS total count = 0.384ppm eTh, and 1.0CPS total count = 0.06% eK (semi-quantitative). The following can be stated for thick (+60cm) radiometric sources detected by the gamma probe:
1ppm eU3O8 = 7.81CPS total count
1ppm eTh = 2.61CPS total count
1% eK = 17.0CPS total count
As the total CPS at the Trekkopje project is dominantly from the carnotite uranium mineralization, the conversion K factor of 0.128 is used to estimate grade. The calibration constants are only applicable to source widths in excess of 60cm. When the calibration constant is applied to source widths of less than 60cm, widths of mineralization will be over-stated and radiometric determine grades will be understated. Figure 12-2 depicts graphically the down-hole 1.0cm CPS readings, and how the conversion using a K factor equates to ppm eU3O8.
The industry standard approach to estimating grade for a graphical plot as in Figure 12-2 is shown in Figure 12-3, and is referred to as the half amplitude method.
The half-amplitude method follows the formula:
GT = K x A;
where GT is the grade-thickness product,
K is the probe calibration constant, and
A is the area under the curve (cm-CPS units).

UraMin, Inc. 12-4 Trekkopje Uranium Project Preliminary Assessment
SRK Consulting (US), Inc. April 2007 Trekkopje.NI 43-101 Preliminary Assessment.163701.MA.006.doc
The Area under the curve is estimated by the summation of the 1.0cm (grade-thickness) intervals between E1 and E2 plus the tail factor adjustment to the CPS reading of E1 and E2, according to the following formula:
A = [ ∑N + (1.38 x (E1 + E2)];
where A is the area under the curve,
N is the CPS per unit of thickness, here 1.0cm, and
E1 and E2 are the half-amplitude picks on the curve.
This process is used in reverse for known grade to determine the K factor constant. For short intervals, ignoring the tail effect results in the formula:
G = K x N
T
and for each 1.0cm thickness, G = K x N = 0.128 x CPS.
The procedure used at Trekkopje is to convert CPS per 1.0cm interval and average those eU3O8 values for each 0.5m interval in all the drill holes. This is a reasonable approximation of the area under the curve or half-amplitude method, and results in a 0.5m composite of the data as eU3O8 grades.
In conclusion, UraMin’s sample preparation, methods of analysis, and sample and data security are being implemented with acceptable industry standard procedures, and are applicable to the uranium deposits at the Trekkopje Project.
12.7 Recommendations SRK has several recommendations going forward to improve on the estimation of grade by the gamma logging process.
• Total count gamma logging should be checked with direct uranium-reading down-hole probes (probes that measure protactinium 234, which is a direct daughter product of uranium that has a half-life of 26 days; thus, it is reading uranium directly); and
• Deconvolution of the gamma log data, or measuring the area under the curve to estimate grade x thickness can be done with the assistance of computer algorithms to calculate the data. Commercial software to do this is not readily available and is not in use by UraMin. This is a recommendation going forward as a check on the current method of eU3O8 determinations.

UraMin, Inc. 12-5 Trekkopje Uranium Project Preliminary Assessment
SRK Consulting (US), Inc. April 2007 Trekkopje.NI 43-101 Preliminary Assessment.163701.MA.006.doc
Figure 12-1: Quality Control Sample Insertion Map-Template
Note: Template and program as per Keith Kenyon, UraMin, 2006

UraMin, Inc. 12-6 Trekkopje Uranium Project Preliminary Assessment
SRK Consulting (US), Inc. April 2007 Trekkopje.NI 43-101 Preliminary Assessment.163701.MA.006.doc
Figure 12-2: Gamma Log of Percussion Hole TKPC159 – Trekkopje Deposit

UraMin, Inc. 12-7 Trekkopje Uranium Project Preliminary Assessment
SRK Consulting (US), Inc. April 2007 Trekkopje.NI 43-101 Preliminary Assessment.163701.MA.006.doc
Figure 12-3: Half-Amplitude Method of Grade Estimation

UraMin, Inc. 13-1 Trekkopje Uranium Project Preliminary Assessment
SRK Consulting (US), Inc. April 2007 Trekkopje.NI 43-101 Preliminary Assessment.163701.MA.006.doc
13 Data Verification (Item 16) Data Verification for the Trekkopje Project has been accomplished by several means:
• Visual confirmation of mineralization in outcrop, pits, and core;
• On the ground identification of historical drill holes and test pits which defined historical resources;
• Confirmation gamma logs from open historical drill holes;
• Confirmation RC drilling across both deposits, with XRF analyses to verify uranium and vanadium mineralization;
• Comparison of gamma logs with RC sample analyses;
• Comparison of analytical laboratory assay certificates with the electronic database;
• Examination of gamma log raw data output files and conversion of CPS to eU3O8 data, and comparison with the electronic drill hole database;
• QA/QC assay and gamma log probe results; and
• Visual confirmation of uranium mineralization.
Uranium mineralization is visible in outcrop, in excavated pits, and in drill core as bright yellow carnotite mineralization. That mineralization, as described in Section 8.0 – Mineralization, also exhibits strongly anomalous radiation as noted on hand held scintillation counters. It is present in outcrop in a few exposures at Klein Trekkopje and Trekkopje, in four 5.0m deep test pits excavated by UraMin at the Trekkopje deposit, and is present as thin coatings on the top of surficial gypsum crusts in the alluvium and on top of calcrete on the west end of the Klein Trekkopje deposit.
13.1 Historical Data Confirmation Historical drill hole pattern at Trekkopje and Klein Trekkopje were identified in the field, and UraMin logged numerous open historical drill holes to verify mineralization; however those drill holes are not part of the UraMin resource database unless the hole was re-drilled. Historical grid locations and gamma logs from the open historical holes confirmed uranium mineralization. There is no reason to further examine historical determined eU3O8 data with UraMin gamma log data, as none of the historical drill hole data has been used in the current resource estimations. A direct comparison of historical resource estimates with current resource estimates is not relevant given the greater detail available in the UraMin data; however, gross magnitude of tonnages have been confirmed, and grade ranges are quite similar.
13.2 Confirmation RC Drilling Program UraMin completed an RC drilling program across both Trekkopje and Klein Trekkopje as described in section 10.0 – Drilling, and Section 11.1- Sampling Method and Approach, RC Drilling. The RC drilling program accomplished data verification in two ways; gamma logging of the RC drill holes confirmed the location and range of grades reported in historical documents, and XRF analyses of RC samples verified gamma log determinations of eU3O8 to be correlative with U3O8 uranium analyses. Figure 13-1 and Figure 13-2 show, for Trekkopje and Klein

UraMin, Inc. 13-2 Trekkopje Uranium Project Preliminary Assessment
SRK Consulting (US), Inc. April 2007 Trekkopje.NI 43-101 Preliminary Assessment.163701.MA.006.doc
Trekkopje respectively, the cumulative frequency plots of background corrected eU3O8 and XRF analyses from the RC drilling (see background eU3O8 corrections in Section 17). The black and green graphic plots show that the XRF U3O8 and the background corrected probe eU3O8 data have similar grade distributions. The lines have similar shape and are closely coincident, without taking into account disequilibrium as discussed in Section 17).
13.3 Database Verification Database verification was accomplished by two means: comparison of XRF laboratory assay certificates with the UraMin digital database, and comparison of gamma log digital output logs with the grade determinations in the UraMin digital database. Approximately 550 individual XRF assay values for RC samples, from the original SGS certificate of analysis were verified with the UraMin digital database, and no errors were found. This is as expected, as the data is received from the lab in electronic format, and is directly input into the UraMin database.
Raw data files produced from the down-hole gamma probe are converted to Excel spreadsheet data as 1.0cm interval data with corresponding total CPS, for each drill hole logged. This is done by UraMin using WellCAD software. UraMin database management is handled in the Johannesburg office, where conversion of down-hole CPS to eU3O8 data is done and data composited to 0.5m down-hole eU3O8 intervals. The U3O8 database was checked by examining the raw data files (*.rd digital files), using Log Cruncher software, and comparing 0.5m intervals randomly for a number of drill holes, with only insignificant rounding errors noted.
13.4 QA/QC Results As described in Section 12.3 – Quality Control Procedures, UraMin has a rigorous program of insertion of blanks, standards and sample replicates into the batches of RC samples shipped to the labs. The program has limits-of-error trigger points that dictate re-assay of sample batches if standards are off by ±10%. That happened on one sample batch of RC samples which were then all re-run. SGS analytical data has been verified as to accuracy and precision by the QA/QC program, within acceptable limits. Secondary lab checks have been initiated on sample pulps, and sent to ALS-Chemex for U3O8 and multi-element analyses by XRF and ICP-MS method. The initial results are plotted in Figure 13.3, which shows a good correlation of the primary samples analysis by XRF at SGS with both XRF an ICP analyses at ALS-Chemex.
RC sample rejects were checked against the original samples at SGS which also shows a good correlation – Figure 13-4
The conclusion is that the uranium analyses for the Trekkopje Project have been replicated at the primary lab (SGS) and have been checked by ALS-Chemex, and the data shows very good correlation.
UraMin’s QA/QC procedures for the gamma logging probe consist of: 1) re-log of a local calibration hole each day to examine graphic logs for instrument drift, and 2) use of a portable Th source calibration to check for instrument drift prior to logging each drill hole. All re-logging of drill hole TK021 (the local calibration hole at Trekkopje) is plotted against the average high reading from 0.0 to 5.0m (initially set at 1107CPS), and examined for variance within limits of ±10%. The average low reading of 303 CPS is also plotted and tracked at ±10%. Figure 13-7 is the plot of daily calibration logs. On one occasion, June 6, 2006, the readings were less than the 10% acceptability threshold on the average high value, and all the drill holes logged that day

UraMin, Inc. 13-3 Trekkopje Uranium Project Preliminary Assessment
SRK Consulting (US), Inc. April 2007 Trekkopje.NI 43-101 Preliminary Assessment.163701.MA.006.doc
were re-logged (approximately 20 holes). Individual hole calibrations with the portable Th source allow for immediate detection of spurious instrumentation errors or drift.
UraMin completed a third party spectral down-hole logging, by GAP Geophysics, of 94 holes across both deposits on the Trekkopje Project. This spectral gamma-logging provides an independent comparison of eU3O8 determinations. The results indicate a reasonable correlation of gamma logs as shown in Figures 13-5 and 13-6 .
All forms of data verification suggest the Trekkopje and Klein Trekkopje deposit databases that support in situ resource estimation are valid and a reasonable representation of the deposits.
13.5 Recommendations Additional check assays, by ICP and XRF should be done as drilling progresses. That work should include third part labs to check SGS labs XRF data. And direct uranium-reading down-hole probes should be used to check current total gamma logging instrumentation, and as a further check on disequilibrium.

UraMin, Inc. 13-4 Trekkopje Uranium Project Preliminary Assessment
SRK Consulting (US), Inc. April 2007 Trekkopje.NI 43-101 Preliminary Assessment.163701.MA.006.doc
Figure 13-1: Trekkopje Deposit Comparison of XRF U3O8 and Gamma Log eU3O8

UraMin, Inc. 13-5 Trekkopje Uranium Project Preliminary Assessment
SRK Consulting (US), Inc. April 2007 Trekkopje.NI 43-101 Preliminary Assessment.163701.MA.006.doc
Figure 13-2: Klein Trekkopje Deposit Comparison of XRF U3O8 and Gamma Log eU3O8

UraMin, Inc. 13-6 Trekkopje Uranium Project Preliminary Assessment
SRK Consulting (US), Inc. April 2007 Trekkopje.NI 43-101 Preliminary Assessment.163701.MA.006.doc
Figure 13-3: SGS Analyses with ALS-Chemex Check Analyses
Note: Data graphs from UraMin, September 2006

UraMin, Inc. 13-7 Trekkopje Uranium Project Preliminary Assessment
SRK Consulting (US), Inc. April 2007 Trekkopje.NI 43-101 Preliminary Assessment.163701.MA.006.doc
Figure 13-4: Duplicate Analyses
Note: Data graphs from UraMin, September 2006

UraMin, Inc. 13-8 Trekkopje Uranium Project Preliminary Assessment
SRK Consulting (US), Inc. April 2007 Trekkopje.NI 43-101 Preliminary Assessment.163701.MA.006.doc
Figure 13-5: Example Gamma-Log Comparison for TKRC-037, UraMin vs GAP
0
100
200
300
400
1.0 2.5 4.0 5.5 7.0 8.5 10.0
11.5
13.0
14.5
Depth
eU3O
8 - p
pm
GAPURAMIN

UraMin, Inc. 13-9 Trekkopje Uranium Project Preliminary Assessment
SRK Consulting (US), Inc. April 2007 Trekkopje.NI 43-101 Preliminary Assessment.163701.MA.006.doc
Figure 13-6: UraMin vs GAP eU3O8 Comparison for 0.5m Intervals
URAMIN eU3O8 ppm vs GAP eU3O8y = 0.8727x - 2.0769
R2 = 0.9072
0
100
200
300
400
500
600
700
800
900
0.000 100.000 200.000 300.000 400.000 500.000 600.000 700.000 800.000 900.000 1000.000
GAP eU3O8
UraM
in e
U3O
8
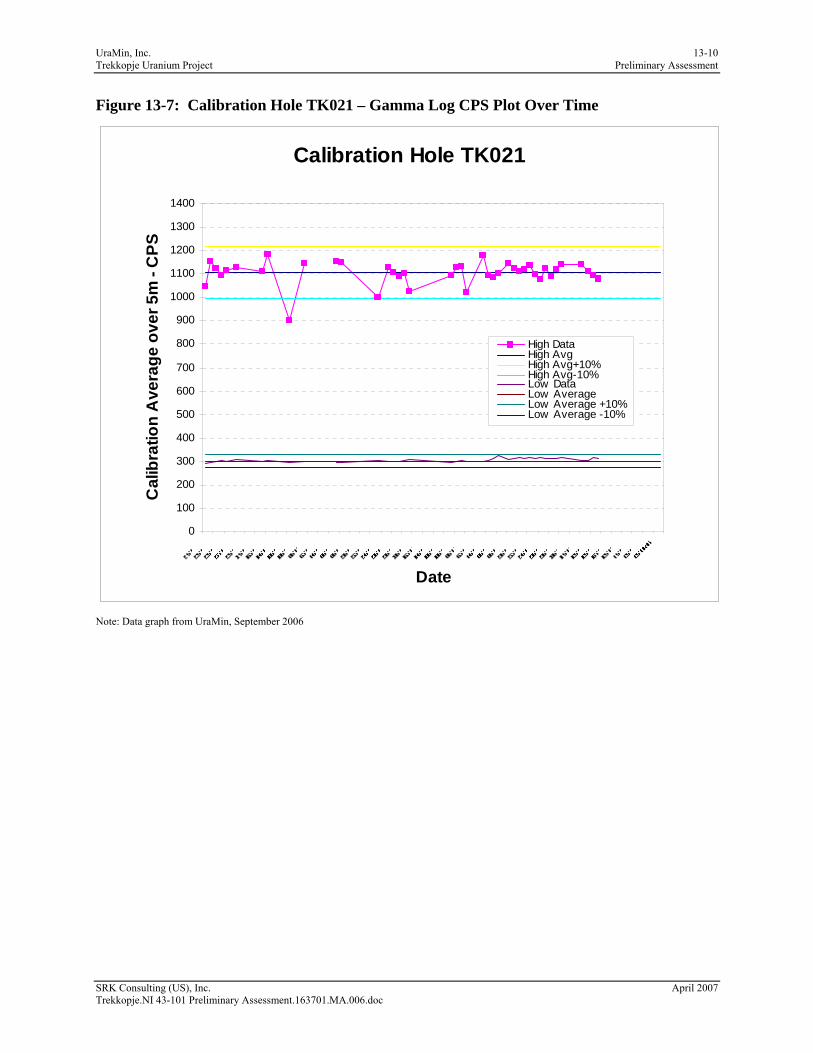
UraMin, Inc. 13-10 Trekkopje Uranium Project Preliminary Assessment
SRK Consulting (US), Inc. April 2007 Trekkopje.NI 43-101 Preliminary Assessment.163701.MA.006.doc
Figure 13-7: Calibration Hole TK021 – Gamma Log CPS Plot Over Time
Calibration Hole TK021
0
100
200
300
400
500
600
700
800
900
1000
1100
1200
1300
1400
Date
Cal
ibra
tion
Ave
rage
ove
r 5m
- C
PS
High DataHigh AvgHigh Avg+10%High Avg-10%Low DataLow AverageLow Average +10%Low Average -10%
Note: Data graph from UraMin, September 2006

UraMin, Inc. 14-1 Trekkopje Uranium Project Preliminary Assessment
SRK Consulting (US), Inc. April 2007 Trekkopje.NI 43-101 Preliminary Assessment.163701.MA.006.doc
14 Adjacent Properties (Item 17) There are no immediately adjacent mineral properties that have bearing upon the Trekkopje and Klein Trekkopje deposits or the Trekkopje Project.
There is an active stone quarry located internal to the UraMin Namibia property boundary as shown in Figure 3-3. This stone quarry, called the Stone Evolution Quarry, has no direct bearing on and in no way interferes with any current or planned exploration or development at the Trekkopje Project uranium deposits.

UraMin, Inc. 15-1 Trekkopje Uranium Project Preliminary Assessment
SRK Consulting (US), Inc. April 2007
15 Mineral Processing & Metallurgical Testing (Item 18)
A significant amount of historical data is available relative to metallurgical processing and potential methods of mineral processing. That information was gathered in previous extensive studies of the Trekkopje and Klein Trekkopje deposits. While that information is worthwhile, it is not expounded upon here. It has been used as the background information database to guide the present metallurgical testing that is being done by UraMin as part of a Bankable Feasibility Study (BFS) that is in progress. This section of the report will focus on the current metallurgical testing program.
As part of the BFS, Mountain States Research and Development Inc., Tucson, Arizona, is directing the current metallurgical testing program, with the help of with SENET (a design, engineering and project management company) and Mintek (specialists in mineral and metallurgical technology), both based in Johannesburg, South Africa. All three companies have a long history of providing mineral processing, metallurgical testing, and process plant design services to the mining industry worldwide.
While historical data suggests that carnotite mineralization at Trekkopje and Klein Trekkopje is recoverable, the current program is designed to address the following goals:
• Confirm the leachability of carnotite uranium-vanadium mineralization;
• Determine the leaching characteristics of the mineralization; and
• Determine an optimal plan(s) for processing options to recover uranium/vanadium from material to be mined.
To that end, a series of metallurgical tests are in progress or have been completed, including the following:
• Beaker leach tests on RC drill samples. These tests will confirm leachability and provide some leaching characteristics;
• Scrubbing tests on 150kg+ samples of mineralized material to examine the potential for up-grading mined material prior to leach processing; and
• Column leach tests on 150+kg samples of core and/or material removed from exploration pits. This testing examines the characteristics of percolation leaching and reverse flow column leaching, to examine the options of heap leaching and vat or agitation leaching.
Leach processing of carnotite-bearing calcrete mineralization will use industry standard carbonate/bi-carbonate leach solution technologies.
Leaching to recover carnotite mineralization essentially puts the carnotite in solution, which will allow a potential to separate and recover both uranium and vanadium. The expected minimum relative recovery is according to the mineralogical relationship of the two elements by weight in the carnotite. That relationship indicates that for every 1.0 units of U3O8 that can be recovered, 0.324 units of V2O5 will also be recovered, at a minimum. There is indication by the analytical work to date that U3O8 and V2O5 exist in RC samples at slightly more V2O5 that the expected fixed ratio. That vanadium is expected to be in part tied up in clay minerals, and the potential for extraction of vanadium beyond the fixed ratio is not yet known, but will be determined in the

UraMin, Inc. 15-2 Trekkopje Uranium Project Preliminary Assessment
SRK Consulting (US), Inc. April 2007 Trekkopje.NI 43-101 Preliminary Assessment.163701.MA.006.doc
ongoing metallurgical testing. While the primary potential economic value of the Trekkopje Project is the uranium content, the vanadium content is expected to provide added economic potential, and will be further evaluated in the ongoing metallurgical testing.
A summary of the metallurgical testing program and processing options considered in presented in Section 17 – Other Relevant Information, as a mid-term status of the BFS evaluation. The current preferred processing option is heap leaching.

UraMin, Inc. 16-1 Trekkopje Uranium Project Preliminary Assessment
SRK Consulting (US), Inc. April 2007 Trekkopje.NI 43-101 Preliminary Assessment.163701.MA.006.doc
16 Mineral Resources & Reserves (Item 19) The basis for the resource estimation described in this section is the eU3O8 database for the Trekkopje and Klein Trekkopje deposits. The eU3O8 data are not a direct measurement of chemically extractable uranium; therefore, the data are first examined for any corrections that might be required to normalize or level the data. The typical corrections necessary are:
• Corrections for instrument drift or calibration;
• Water factor corrections to gamma log data for mineralization below the water table;
• Casing factor correction to gamma log data for mineralization detected through drill hole casing;
• Background radiation corrections for the non-recoverable uranium, potassium and thorium components of radiation on gamma logs; and
• Disequilibrium corrections for chemical uranium mineralization that has not equilibrated with its radioactive daughter products.
The first three bullet points were discussed in Section 12.6, Radiometric Analyses. Instrument calibration has been done at the Pelindaba Calibration Facility in South Africa, and is done daily and with each drill hole gamma log. Water factor and PVC casing factor corrections were made to those few drill hole intercepts that are affected. The last two bullet points, background radiation and disequilibrium corrections are potentially significant at the Trekkopje Project and are discussed in further detail here.
16.1 Background Corrections Radiometric readings as counts per second (CPS) are readings of total gamma radiation from all sources. Most natural gamma radiation is from potassium, uranium and thorium sources; cosmic radiation is minimal and relatively insignificant. Normally, background CPS are not removed from gamma log data prior to determining eU3O8 grades, because average background radiation is typically insignificant relative to the gamma radiation from most uranium deposits. Trekkopje and Klein Trekkopje differ from most deposits in the low grade, and background CPS needs to be taken into account as a background eU3O8 of 20ppm would be 10% of the average grade of a 200ppm deposit; and the background eU3O8 may represent non-recoverable U, K, or Th.
Background CPS at Trekkopje and Klein Trekkopje will be derived from the host rocks to the calcrete mineralization; coarse sands, pebble, and cobble conglomerates composed of all the bedrock lithological units in the region upstream of the paleo-channel deposits. Granitic rocks anomalous in CPS and uranium are known for the area and are the likely source of both the uranium mineralization as well as the background radiation count in the host rocks. A significant contributor to background radiation is potassium feldspars in the sand matrix and in rock forming minerals. Non-soluble uranium silicate minerals and thorium bearing resistate minerals may also be present in small amounts in the host rock conglomerates and sand matrix. A good method to determine the makeup of the background CPS is to perform down-hole spectral probing which will provide CPS applicable to K, U and Th; and to look at the non-mineralized portions of drill holes for average CPS. This was done for the Trekkopje Project and indicates a non-U background CPS equivalent to about 14ppm eU3O8. Additionally a background radiation was determined separately for Trekkopje and for Klein Trekkopje, determined as follows:

UraMin, Inc. 16-2 Trekkopje Uranium Project Preliminary Assessment
SRK Consulting (US), Inc. April 2007 Trekkopje.NI 43-101 Preliminary Assessment.163701.MA.006.doc
• A = statistical examination of eU3O8 data for all drill holes;
• B = statistical examination of the eU3O8 data for only those RC drill hole intervals that returned less than 10ppm U3O8 by XRF analysis;
• C = examination of the background count in a non-mineralized drill hole in bedrock marble;
• D = examination of the K and Th analytical data for the host rocks; and
• E = eU3O8 determinations on non-mineralized portions of gamma logs.
Table 16.1.1: Items of background Radiation for Trekkopje and Klein Trekkopje
Description Trekkopje
eU3O8 Klein Trekkopje
eU3O8 CF plot of eU3O8 data showing background threshold as change is slope of curve 25 25
Statistical examination of eU3O8 for XRF < 10ppm 22 27 Marble bedrock ( should be < 2ppm U3O8 chemical) 7.5 7.5 Background due to 3% K and 7ppm Th, 4ppm U 13.8 13.8 eU3O8 determinations for non-mineralized portions of several gamma logs 14.7 to 23.8 14.7 to 23.8 VALUE USED in Resource Estimation 18 18
Item A is the break in the CF curve for Trekkopje and Klein Trekkopje
Item B is simply the mean of the eU3O8 data for the equivalent 1.0m RC sample intervals for which the XRF analyses indicate less that detectable (<10ppm) U3O8.
Item C indicates that the gamma logging probe is capable of measuring eU3O8 values consistently at less than 10ppm. Thus, Items A and B are not the lower threshold of the instrument capabilities. Even 7.5ppm eU3O8 for marble is about 5ppm higher than expected actual chemical U3O8 values.
Item D was determined by back estimating eU3O8 using the probe calibration constants and ICP analyses of Trekkopje conglomerates that have on average 3%k, 7.8ppm Th, and an estimated 4ppm U in non-recoverable U3O8 from resistate minerals; thus combined would be a minimum of 13.8ppm eU3O8.
Item E was determined from visual examination of a number of drill logs that either had no radiometric spikes or for the portion of holes that were away from mineralization, and determining the corresponding eU3O8 values.
A value of 18ppm eU3O8 was used for background radiation that equated to K, Th, and non-recoverable U, and perhaps to the calibration error of the probe at such low eU3O8 values. The value of 18ppm eU3O8 was removed from all eU3O8 data in the database for Trekkopje and Klein Trekkopje.
As a further check, approximately 50RC samples were selected from drill hole intervals that show gamma-log background radiometric response of 18ppm on average. Those samples were subjected to beaker leach tests to determine if any chemical uranium is available for leach recovery under estimated processing conditions, with the exception that the test used heated leach solutions. The results showed on average only less than 2.0ppm U3O8 to be chemically

UraMin, Inc. 16-3 Trekkopje Uranium Project Preliminary Assessment
SRK Consulting (US), Inc. April 2007 Trekkopje.NI 43-101 Preliminary Assessment.163701.MA.006.doc
available; verifying the 18ppm as a reasonable number to use for background correction to all eU3O8 data.
16.2 Disequilibrium Disequilibrium in uranium deposits relates to uranium dissolution and re-deposition by groundwater prior to the time required for the radiometric daughter products to equilibrate with the chemical uranium. Correcting for disequilibrium in the database is not necessarily a straightforward process, and depends upon the data distributions of both the XRF (chemical U) and the eU3O8 (radiometric U) data sets. Disequilibrium was examined separately for Trekkopje and Klein Trekkopje, based on the probe data and the XRF analytical data from the RC drilling program.
At Trekkopje and Klein Trekkopje, the XRF and eU3O8 data sets are essentially the same, as shown previously in Figures 13-1 and 13-2 respectively. Upon a data reduction for background, the Cumulative Frequency plots of XRF and eU3O8 data are very close, and have the same shape. A scatter plot of XRF and eU308 is shown in Figure 16-1 and 16-2 for Trekkopje and Klein Trekkopje respectively. The linear best line fit to the data is also shown and is essentially a 1:1 relationship for Trekkopje. Therefore, the disequilibrium in the Trekkopje deposit can be loosely described as the difference between the XRF data and the eU3O8 probe data (subtract the eU3O8 from the XRF values).
Figure 16-2 shows the same plot fro the Klein Trekkopje deposit. The best fit line has a slope of 0.85, which is close to a 1:1 relationship but biased toward higher XRF values (or positive disequilibrium); however, there is a significant amount of scatter in the data.
Several points can be summarized from Figure 16-1 and 16-2:
• There is a direct relationship between XRF and eU3O8 data;
• There is both positive and negative disequilibrium in individual sample pairs, where negative disequilibrium is the over-estimation of probe data grades relative to chemical or XRF assay grades (XRF-eU3O8 being a negative number). Positive disequilibrium is exhibited when there is more XRF U3O8 than radiometric eU3O8 (XRF-eU3O8 being a positive number). This is only a relative indication of disequilibrium, as often disequilibrium is stated as the ratio of U3O8 to eU3O8, with 1.0 being in 100% equilibrium;
• There are 33 data pairs at Trekkopje with greater than ± 50ppm relative disequilibrium, representing 6% of the data pairs;
• Overall, there is no significant disequilibrium at Trekkopje that needs to be accounted for in the database in the resource estimation for Trekkopje;
• There are more sample pairs that show disequilibrium at Klein Trekkopje, with a broader scatter to the data. There are 99 samples with positive disequilibrium from > +50 to +1,250, and 134 samples with relative negative disequilibrium from > -50 to -346ppm; together these 233 samples represent 15% of the data at Klein Trekkopje;
• There is no significant disequilibrium at Klein Trekkopje that needs to be accounted for in the database in the resource estimation for Klein Trekkopje; and

UraMin, Inc. 16-4 Trekkopje Uranium Project Preliminary Assessment
SRK Consulting (US), Inc. April 2007 Trekkopje.NI 43-101 Preliminary Assessment.163701.MA.006.doc
• Disequilibrium at portions of the Klein Trekkopje deposit will need to be examined more closely prior to subsequent resource/reserve estimations, as additional XRF data is gathered in the 5-spot drilling.
While the best fit lines in Figure 16-1 and Figure 16-2 suggest a nearly 1:1 relationship for both deposits, the line can be heavily skewed by a just a few points at the upper end of the grade ranges. On investigating further, Figures 16-3 and 16-5 shows that most disequilibrium (expressed as XRF – eU3O8) is at shallow depths of less than 10m. And the current water table in most holes is below 10m, so the disequilibrium noted is apparently not related to the current water table at either deposit.
Relative disequilibrium at Klein Trekkopje is shown as a histogram in Figure 16-4 below. The majority of RC samples show a neutral or near neutral difference (XRF U3O8 value minus eU3O8 radiometric value).
16.3 Data Acquisition Data for both deposits was provided by UraMin as Excel spreadsheets, at 0.5m down-hole, composited, eU3O8 data in assay tables, and with separate collar file tables. The Trekkopje and Klein Trekkopje drill hole databases were examined by SRK as described in Section 16.5 – Data Analysis.
16.4 Bulk Density Measurements SGS completed insitu bulk density measurements on 60 samples of core from across the deposits using the standard water displacement method and paraffin wax seals. Results show minor varioation is the host rocks. The average for conglomerate Units A and C, which are the dominant host rocks is 2.17g/ml which equates to 2.17t/m3. Values used for resource estimation are 2.20 for host rock calcrete, 2.15 for SO4 bearing calcrete (due to higher porosity and void space), and 2.5 (assumed) for bedrock marble, schist, and granite.
16.5 Data Analysis The database was reviewed by SRK and a few minor adjustments were made. A value of 18ppm eU3O8 was deducted from all eU3O8 assay values to account for background. The eU3O8 values were reduced by 18ppm, but only to a minimum value of 1ppm. The modified database was used for the estimate.
The drill hole depths vary between 3m and 31m for a total drilled length of 38,883m.
Radiometric eU3O8 data were compiled by UraMin at 0.5m intervals down-hole. This information was used to create a sample database using the Datamine® modeling software.
16.6 Geological Model Geology of the mineralized rocks is rather uniform, with +99% of the mineralization is the host calcrete conglomerates. Discrimination of sub-units in the calcrete is not possible from RC or PC drill cuttings. The geological controls that were utilized for constraint of the mineralization is a grade shell established at 35ppm eU3O8, after correction of the database for 18ppm eU3O8 background. The 35ppm was determined as a threshold break in the CF plot of eU3O8 grades. The shape of mineralization based on the 35ppm grade shell indicates some internal higher grade zones that have a northeast trend. This trend is sub-parallel to the regional trend of basement geology and in particular mafic dikes which transect the basement rock lithologies. The

UraMin, Inc. 16-5 Trekkopje Uranium Project Preliminary Assessment
SRK Consulting (US), Inc. April 2007 Trekkopje.NI 43-101 Preliminary Assessment.163701.MA.006.doc
basement lithologies are thought to provide local basement highs across the paleo-channels (as the dikes do on the current surface) which would impact groundwater flow in the overlying conglomerates by slowing of fluid flow or upwelling of groundwaters, thus enhancing uranium deposition. This northeast trend to portions of the mineralization supports the variography which developed a similar azimuth 35º primary direction.
A sulfate surface was created on cross sections, based on RC drill data, at 0.3% SO4. The sulfate surface was used to segregate near surface material containing uranium mineralization and SO4 greater than 0.3%. Thin alluvium or sand sheet-wash cover was not separately defined, because where present, it is generally high in sulfate; therefore, alluvium was lumped in the SO4-bearing rock domain. A bedrock surface was identified and used to segregate the bedrock mineralization, which is less than 1% of the tonnage.
16.6.1 Topography UraMin provided SRK with topography for Klein Trekkopje (KT) and Trekkopje (TK) in the form of digital data with a 10m resolution (grid X and Y). There were some minor portions of the deposits that did not have complete topographic coverage. These were on the peripheries of the deposits and outside of areas with significant mineralization. UraMin has obtained additional coverage for these areas for future resource estimation. Existing data was extrapolated to cover these zones. For the purpose of block model construction the topographic data was declustered to a 20m grid, which is adequate resolution for these resources. A digital terrain model (DTM) of topography was created and loaded into a Datamine® block model for each deposit.
SRK noted a discrepancy of approximately 1 to 5m between topographic elevations and ground surveyed drillhole collar elevations. UraMin determined that there were errors with the ground survey. Collar elevations were adjusted, by UraMin, to match topography. In SRKs opinion, the volumetric error resulting from these survey errors will not significantly affect the global resource estimate. UraMin has resurveyed all drillholes to be used in future resource estimation and more importantly for mine design.
16.6.2 Sulfate Surface For each deposit, SRK created a surface representing the bottom of a potentially deleterious area of higher sulfate contamination using Leapfrog® modeling software. It is SRKs opinion that since only RC drillholes could be used to create the surfaces they are only rough approximations.
Surfaces were created by digitizing the 0.3% SO4 iso-line, hole-to-hole, on cross-sections using the 600m x 800m RC drill data for each deposit. These lines were then connected using Leapfrog® software to create a 3-D surface. The SO4 surface is generally sub-parallel to the topography surface with SO4 bearing material extending to depths of 1 to 3m on average, and locally to +10m. DTMs of the sulfate surfaces were created and loaded into the Datamine® system assigning potential higher sulfate codes to both model blocks and sulfate samples above the surface.
16.6.3 Bedrock Surface For KT, UraMin provided a DTM of the bedrock surface below which the mineralization is interpreted to be of a different population (rock type) from the primary mineralization. At TK, with very few samples in bedrock, UraMin and SRK did not consider such a surface to be required.

UraMin, Inc. 16-6 Trekkopje Uranium Project Preliminary Assessment
SRK Consulting (US), Inc. April 2007 Trekkopje.NI 43-101 Preliminary Assessment.163701.MA.006.doc
16.7 Compositing, Composite Statistics & Domain Analysis 16.7.1 Compositing The expected mining bench height for both the KT and TK deposits is approximately 5m. To represent overall mining selectivity, while allowing selective mine planning at the upper alluvial/higher sulfate interface and the lower bedrock interface, the selected composite length was 2.5m. and assays were bench composited to 2.5m intervals. At KT, compositing was controlled by the bedrock interface provided by UraMin; compositing terminates and restarts at the interface. A unique ROCK code is assigned to composites above and below the interface. At Trekkopje, since drillholes do not intersect a significant bedrock surface compositing was not controlled by a bedrock interface.
16.7.2 Composite Statistics & Domain Analysis As discussed in 16.5 above, background corrections continue to be evaluated, but for the purpose of resource estimation at TK and KT a factor of 18 eU3O8 ppm was used. Erratic, lower grades, contribute to the overall geostatistical nugget effect of the populations. To define mineralization, areas of lower grade peripheral material, were spatially segregated from the primary mineralization of the deposits. SRK examined grade composite statistics, composite analyses and cumulative frequency (CF) distribution diagrams. For both KT and TK, a break, or threshold, as observed as an inflection point for the CF distributions (Figure 17.1) is interpreted at approximately 35 eU3O8 (ppm). This is well below any anticipated economic cut-off. Bounding the mineralization with this value leaves sufficient lower grade material for dilution in the model.
SRK modeled the boundary, or shell, of the three-dimensional 35 eU3O8 (ppm) spatial distribution of the composites using Leapfrog®.
UraMin, using Datamine®, also created three-dimensional “solid” models of the shells from cross-sectional interpretations. SRK constructed horizontal slices through both the Leapfrog® shapes and the solid models at 2.5m intervals and adjusted these, in conjunction with displays of the 2.5m composites, to create the final grade domains, or shells, for each deposit. Lower grade areas and composites were segregated on the exterior boundaries of the mineralization. Lower grade areas, and composites, bounded by mineralization, are incorporated within the shells. Composites interior to the shells are assigned a Zone code of one while those exterior were assigned a ZONE code of zero. Table 16.7.2.1 summarizes the composite statistics.

UraMin, Inc. 16-7 Trekkopje Uranium Project Preliminary Assessment
SRK Consulting (US), Inc. April 2007 Trekkopje.NI 43-101 Preliminary Assessment.163701.MA.006.doc
Table 16.7.2.1: eU3O8 ppm Composite Statistics by Grade Shell Zone Population KT eU3O8 KT Zone 0 KT Zone 1 TK eU3O8 TK Zone 0 TK Zone 1 Grade Shell all outside inside all outside inside Sample size (N) 10769 4672 6046 2489 1716 773 Minimum 0.00 0.00 0.24 0.01 0.01 6.66 Maximum 826.13 29.59 826.13 790.09 35.92 790.09 Std deviation 64.10 8.64 70.85 52.87 9.57 67.92 Variance 4108.63 74.72 5019.30 2795.69 91.52 4612.90 Std error 0.62 0.13 0.91 1.06 0.23 2.44 C.V. 1.17 0.70 0.83 1.49 0.87 0.77 Mean 54.90 12.40 84.87 35.44 10.95 88.74 Median 35.95 11.23 63.56 15.70 8.02 69.23 Mode -1.96 8.90 20.96 -23.79 2.14 30.22 Kurtosis 15.61 -1.14 13.12 34.67 -0.30 25.49 Skewness 3.03 0.31 2.79 4.30 0.88 3.85
Percentiles 10 4.27 1.54 27.35 1.57 0.95 39.56 25 13.56 4.62 41.68 4.89 3.07 49.04 50 35.95 11.23 63.56 15.70 8.02 69.23 75 71.48 19.77 103.99 46.93 16.68 106.10 90 127.37 25.38 167.27 90.17 26.57 158.15
Quartiles First: 13.56 4.62 41.68 4.89 3.07 49.04 Second: 35.95 11.23 63.56 15.70 8.02 69.23 Third: 71.48 19.77 103.99 46.93 16.68 106.10
95% Confidence Interval lower limit 53.69 12.16 83.08 33.36 10.50 83.94 upper limit 56.12 12.65 86.65 37.51 11.41 93.53
16.8 Variography Directional and isotropic, relative and ordinary variograms were constructed for Zone one and Zone zero composites, using both the KT and TK databases, separately and combined. SRK interprets a preferential orientation at approximately N 35 E for KT. On Figure 16-2 is a fitted two structure relative variogram. This orientation roughly corresponds to the geometry of the interpreted geology. With the limited data set for TK, a preferential direction could not be demonstrated with variography, however given the similarity and proximity of the two deposits, a preferential orientation is assumed to exist. Variography with the combined data sets yielded, as expected with the predominance of KT data, the same parameters as determined to KT. The nugget is estimated from down-hole variograms. The variogram model parameters are tabulated on Table 16.8.1.
Table 16.8.1: Variogram Model - Klein Trekkopje & Trekkopje Deposits
Nugget Sill 1 Sill 2 Range Structure 1 Range Structure 2 Zone Co C1 C2 (X) (Y) (Z) (X) (Y) (Z) Rotation
Interior 0.09 0.24 0.07 50 150 6 100 300 10 35 Exterior 0.09 0.3 0.4 170 170 6 400 400 10 0

UraMin, Inc. 16-8 Trekkopje Uranium Project Preliminary Assessment
SRK Consulting (US), Inc. April 2007 Trekkopje.NI 43-101 Preliminary Assessment.163701.MA.006.doc
16.9 Search Neighborhood Strategy/Resource Confidence Classification
Table 16.9.1 displays the search parameters and resource confidence classification used at KT. It is required, for measured and indicated assignments, to use a minimum of six and five, 2.5m composites, respectively, with only two composites from any given hole. This minimizes, with the regular 200m x 200m sampling grid, any extrapolation. The mineralized shell itself also minimizes extrapolation. For measured and indicated assignments, a minimum of three different holes must exist in the search neighborhood. Model blocks are bounded on at least three sides. In the interior of the shell, the assumption is that nearly all the remaining material is inferred.
Table 16.9.1: Search parameters/Confidence Classification - Klein Trekkopje deposit
Search Distance Minimum Number Maximum From Zone Class X Y Z Of Composites One Drillhole
Interior measured 100 200 2 6 2 Exterior measured 100 100 2 6 2 Interior Indicated 150 300 3 5 2 Exterior Indicated 200 200 4 5 2 Interior Inferred 400 800 8 3 2 Exterior Inferred 400 400 8 3 2
Table 16.9.2 displays the search parameters and confidence classification used at TK. The parameters differ in that, subsequent to the KT model construction, it was decided to increase the vertical search for TK and allow a maximum of three composites to be from any given hole. The requirement for measured and indicated assignment to use a minimum of three different holes is maintained by raising the minimum number of composites to seven. Measured and indicated blocks are bounded on three sides.
Table 16.9.2: Search Parameters/Confidence Classification - Trekkopje Deposit.
Zone Class X Y Z
Minimum Number Of Composites
Maximum From One Drillhole
Interior Measured 75 150 5 7 3 Exterior Measured 100 100 5 7 3 Interior Indicated 150 300 10 7 3 Exterior Indicated 200 200 10 7 3 Interior Inferred 300 600 20 4 3 Exterior Inferred 400 400 20 4 3
16.10 Block Model Extents Two Datamine® block models were created with the origins and extents noted below.

UraMin, Inc. 16-9 Trekkopje Uranium Project Preliminary Assessment
SRK Consulting (US), Inc. April 2007 Trekkopje.NI 43-101 Preliminary Assessment.163701.MA.006.doc
Table 16.10.1: Block Model Limits - Klein Trekkopje Deposit Parameter Northing Easting Elevation Minimum Coordinates 7,543,200 475,000 390 Maximum Coordinates 7,553,000 491,000 660 Block Size 100 100 2.5
Table 16.10.2: Block Model Limits - Trekkopje Deposit
Parameter Northing Easting Elevation Minimum Coordinates 7,548,000 497,000 700 Maximum Coordinates 7,552,200 503,400 830 Block Size 100 100 2.5
Topography, the surface representing higher sulfate material, the bedrock surface, and the grade shell were loaded into these models.
16.11 Block Grade Interpolation Grades of eU3O8 (ppm) were assigned to model block positions via ordinary kriging (OK) using the variogram model (Table 16.8.1) and the search neighborhood strategies described in section 16.9. For both models the grade shell was used as a hard boundary; composites inside the shell were used for grade assignment in the interior and vice versa. For Klein Trekkopje the bedrock surface was also used as a hard boundary. Parent cells were estimated; that is sub cells of the initial 100m x 100m block have the same value.
Sulfate values were assigned to model blocks above the sulfate surface using sulfate sample values from above and an inverse to the distance squared methodology. As noted above only limited samples were available for sulfate estimation and inordinately large search volumes had to be used. Figures 16-8 and 16-9 are representative level maps from KT and TK respectively showing model block (color-coded) and bench composited grades.
16.12 Block Model Density Assignment Table 16.12.1: Block Model Density
Rock Type Density Alluvium/Sulfate Zone 2.15 Conglomerate 2.20 Bed Rock 2.5
Table 16.12.1 lists the insitu dry bulk densities applied for resource computation. These are discussed in Section 16.4 above and were provided by UraMin.
16.13 Resource Model Validation Both the KT and TK models were validated through a visual comparison between the estimated block grades and the grades of the bench composites as shown on Figures 16-8 and 16-9. As is expected with ordinary kriging (OK) the grades in the model have been smoothed, or averaged,

UraMin, Inc. 16-10 Trekkopje Uranium Project Preliminary Assessment
SRK Consulting (US), Inc. April 2007 Trekkopje.NI 43-101 Preliminary Assessment.163701.MA.006.doc
but they are an accurate representation of the underlying drillhole data. Tables 16.13.1 and 16.13.2 summarize the smoothing; the model and declustered, nearest neighbor (NN) composite means are similar while the variation of the composites is much greater.
Table 16.13.1: Klein Trekkopje Block Model/Composite Statistics eU3O8 (ppm)
Declustered Composites Model Maximum 826.1259 401.716 Minimum 0 0 Mean 84.7258 84.0769 Variance 5022 1842 Standard Deviation 70.87 42.92 CV 0.836463 0.510485
Table 16.13.2: Trekkopje Block Model/Composite Statistics eU3O8 (PPM)
Declustered Composites Model Maximum 790.089 378.1809 Minimum 6.664 0 Mean 88.7387 88.5418 Variance 4607 1065 Standard Deviation 67.87 32.64 CV 0.76483 0.356558
Swath Plots (Drift Analysis) is a graphical display of the grade distribution derived from a series of bands, or swaths, generated in several directions through the deposit. Grade variations from the ordinary kriged (OK) model are compared, using the swath plot, to the distribution derived from the declustered, nearest neighbor (NN) grade model. On a local scale, the NN model does not provide reliable estimations of grade, but on a larger scale, the NN is an unbiased estimator of the average grade based on the underlying data. If the OK model is performing correctly, the grade OK model plot will be somewhat smoother than the NN value. Swath plots have been generated for eU3O8 (ppm) in both models. Inferred resources were excluded. The results for the two models are shown in Figures 19-9 to 16-15. Overall there is good correspondence between the models.
The smoothing effect of OK can also be seen in figure 16-16 which is a cumulative frequency (CF) plot of OK and NN grades.
16.14 Resource Methodology and Classification As described in the sections above SRK used industry-standard methods of resource estimation by block modeling techniques. These resources follow the CIM (Canadian Institute of Mining, Metallurgy and Petroleum) resource categories as defined in the CIM Standards on Mineral Resources and Reserves – Definitions and Guidelines, as adopted by the CIM council on August 20, 2000. Those definitions are provided below:
An ‘Inferred Mineral Resource’ is that part of a Mineral Resource for which quantity and grade or quality can be estimated on the basis of geological evidence and limited sampling and reasonably assumed, but not verified, geological and grade continuity. The estimate is based on

UraMin, Inc. 16-11 Trekkopje Uranium Project Preliminary Assessment
SRK Consulting (US), Inc. April 2007 Trekkopje.NI 43-101 Preliminary Assessment.163701.MA.006.doc
limited information and sampling gathered through appropriate techniques from locations such as outcrops, trenches, pits, workings and drill holes.
An ‘Indicated Mineral Resource’ is that part of a Mineral Resource for which quantity, grade or quality, densities, shape and physical characteristics, can be estimated with a level of confidence sufficient to allow the appropriate application of technical and economic parameters, to support mine planning and evaluation of the economic viability of the deposit. The estimate is based on detailed and reliable exploration and testing information gathered through appropriate techniques from locations such as outcrops, trenches, pits, workings and drill holes that are spaced closely enough for geological and grade continuity to be reasonably assumed.
A ‘Measured Mineral Resource’ is that part of a Mineral Resource for which quantity, grade or quality, densities, shape, physical characteristics are so well established that they can be estimated with confidence sufficient to allow the appropriate application of technical and economic parameters, to support production planning and evaluation of the economic viability of the deposit. The estimate is based on detailed and reliable exploration, sampling and testing information gathered through appropriate techniques from locations such as outcrops, trenches, pits, workings and drill holes that are spaced closely enough to confirm both geological and grade continuity.
16.15 Resource Statement Table 16.15.1: Trekkopje Project Combined Insitu Resources
Resource Classification Resource (t) Grade eU3O8
(ppm) Contained
eU3O8(t) Contained eU3O8(lbs)
Measured Klein Trekkopje 7,096,000 156 1,105 2,435,000
Trekkopje 0 0 0 0 Sub-Total Measured 7,096,000 156 1,105 2,435,000
Indicated Klein Trekkopje 109,631,000 149 16,320 35,978,000
Trekkopje 27,835,000 131 3,659 8,067,000 Sub-Total Indicated 137,466,000 145 19,979 44,045,000
Measured & Indicated Klein Trekkopje 116,727,000 149 17,424 38,413,000
Trekkopje 27,835,000 131 3,659 8,067,000 Total M&I 144,562,000 146 21,084 46,480,000
Inferred Klein Trekkopje 177,090,000 139 24,610 54,255,000
Trekkopje 18,216,000 125 2,284 5,035,000 Sub-Total Inferred 195,306,000 138 26,894 59,290,000
Insitu Resource Statement, Combined Deposits (100ppm eU3O8 cut-off) Includes SO4-bearing material that may or may not be processed. See Section 16 for details per deposit.

UraMin, Inc. 16-12 Trekkopje Uranium Project Preliminary Assessment
SRK Consulting (US), Inc. April 2007 Trekkopje.NI 43-101 Preliminary Assessment.163701.MA.006.doc
Table 16.15.2 Klein Trekkopje Resources
Resource Classification - 100ppm cut-off Resource
(t) Grade eU3O8
(ppm) Contained
eU3O8(t) Contained eU3O8(lbs)
Measured Conglomerate 2,835,000 143 404 891,000
SO4 Rock* 4,261,000 164 700 1,544,000 Bedrock 0 0 0 0
Sub-Total Measured 7,096,000 156 1,105 2,435,000 Indicated
Conglomerate 88,430,000 144 12,744 28,095,000 SO4 Rock* 21,076,000 169 3,561 7,851,000
Bedrock 125,000 115 14 32,000 Sub-Total Indicated 109,631,000 149 16,320 35,978,000
Measured & Indicated Conglomerate 91,265,000 144 13,148 28,986,000
SO4 Rock* 25,337,000 168 4,262 9,395,000 Bedrock 125,000 115 14 32,000
Total M&I 116,727,000 149 17,424 38,413,000 Inferred
Conglomerate 119,579,000 136 16,288 35,909,000 SO4 Rock* 57,381,000 145 8,307 18,313,000
Bedrock 130,000 116 15 33,000 Sub-Total Inferred 177,090,000 139 24,610 54,255,000
SO4 Rock is material for which sulfate (gypsum) is present above a process determined cut-off of 0.30% SO4. The average SO4 grade of SO4 rock is not yet determined as too few assays are present to allow grade estimation. SO4 material may or may not need special attention in processing. In-fill RC drilling is in progress will establish SO4 grade distribution.

UraMin, Inc. 16-13 Trekkopje Uranium Project Preliminary Assessment
SRK Consulting (US), Inc. April 2007 Trekkopje.NI 43-101 Preliminary Assessment.163701.MA.006.doc
Table 16.15.3: Klein Trekkopje Measured Resources by CoG
Conglomerate Rock SO4 Rock Bedrock Rock
Cut-off eU3O8 (ppm) kt U3O8(t)
eU3O8 (ppm) kt U3O8(t)
eU3O8 (ppm) kt U3O8(t)
20 112 4,911 549 - - - - - - - - - - - - 29 475 14 30 115 4,717 544 - - - - - - - - - - - - 39 173 7 40 117 4,648 542 - - - - - - - - - - - - - - - - - - - - - - - - 50 119 4,483 534 151 5,043 762 51 61 3 60 123 4,236 521 152 4,993 760 - - - - - - - - - - - - 70 128 3,894 499 154 4,888 753 80 129 3,827 494 158 4,644 735 90 137 3,229 443 162 4,393 713
100 143 2,835 404 164 4,261 700 110 150 2,375 356 171 3,826 655 120 154 2,136 329 177 3,490 616 130 164 1,560 257 184 3,031 558 140 167 1,448 242 187 2,872 537 150 176 1,022 180 195 2,430 473 160 184 717 132 204 1,975 402 170 190 562 106 215 1,545 331 180 202 320 65 221 1,327 293 190 208 236 49 225 1,193 269 200 216 144 31 240 827 198
Table 16.15.4: Klein Trekkopje Indicated Resources by CoG
Conglomerate Rock SO4 Rock Bedrock Rock
Cut-off eU3O8 (ppm) kt U3O8(t)
eU3O8 (ppm) kt U3O8(t)
eU3O8 (ppm) kt U3O8(t)
20 85 300,197 25,555 106 49,754 5,268 32 14,226 461 30 91 273,789 24,913 114 45,206 5,159 43 6,313 271 40 94 259,992 24,428 118 43,231 5,089 54 2,974 160 50 99 234,213 23,254 125 39,039 4,898 62 1,577 98 60 107 198,371 21,281 133 35,132 4,685 81 453 37 70 116 163,536 19,016 141 31,458 4,446 - - - - - - - - - - - - 80 126 133,191 16,741 149 28,091 4,193 103 188 19 90 135 108,386 14,636 159 24,338 3,872 - - - - - - - - - - - -
100 144 88,430 12,744 169 21,076 3,561 115 125 14 110 153 71,840 11,003 176 19,053 3,349 - - - - - - - - - - - - 120 162 58,813 9,511 183 17,132 3,128 128 63 8 130 170 48,401 8,211 191 15,047 2,868 - - - - - - - - - - - - 140 179 38,154 6,829 197 13,402 2,645 150 190 28,655 5,451 208 11,075 2,306 160 199 22,923 4,562 216 9,655 2,087 170 207 18,441 3,823 224 8,425 1,884 180 215 15,025 3,228 232 7,216 1,673 190 226 10,874 2,459 236 6,586 1,556 200 238 7,879 1,875 246 5,358 1,316
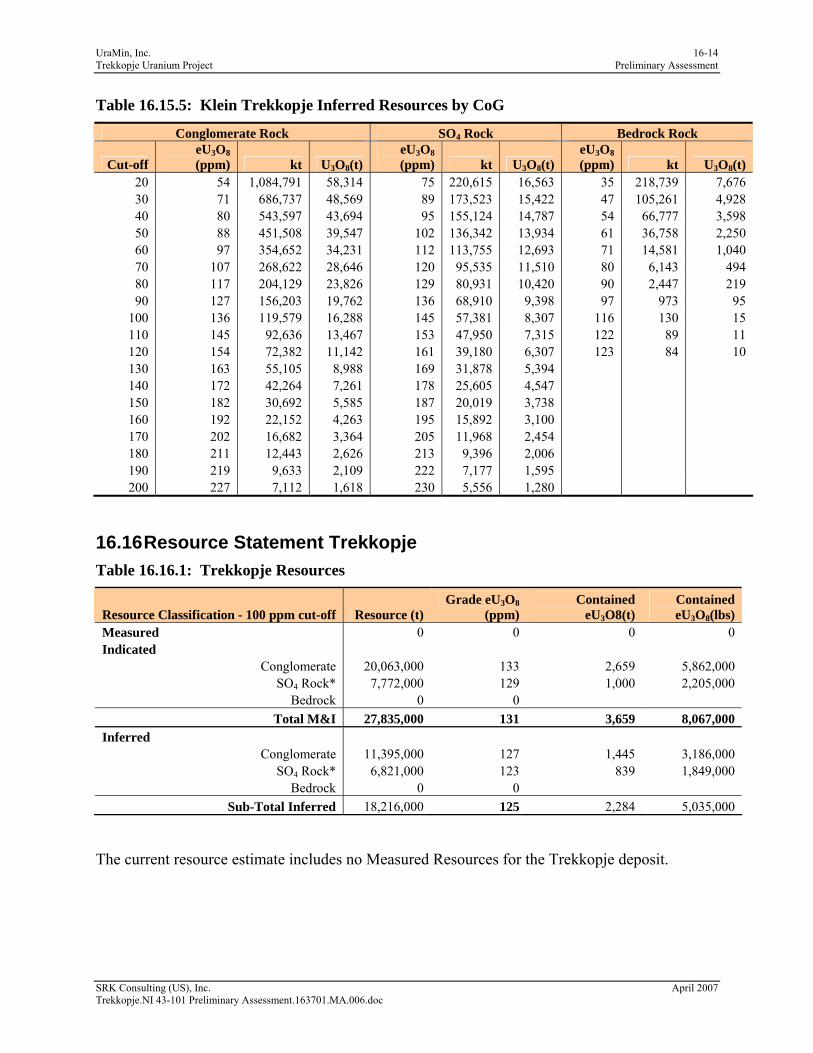
UraMin, Inc. 16-14 Trekkopje Uranium Project Preliminary Assessment
SRK Consulting (US), Inc. April 2007 Trekkopje.NI 43-101 Preliminary Assessment.163701.MA.006.doc
Table 16.15.5: Klein Trekkopje Inferred Resources by CoG
Conglomerate Rock SO4 Rock Bedrock Rock
Cut-off eU3O8 (ppm) kt U3O8(t)
eU3O8 (ppm) kt U3O8(t)
eU3O8 (ppm) kt U3O8(t)
20 54 1,084,791 58,314 75 220,615 16,563 35 218,739 7,676 30 71 686,737 48,569 89 173,523 15,422 47 105,261 4,928 40 80 543,597 43,694 95 155,124 14,787 54 66,777 3,598 50 88 451,508 39,547 102 136,342 13,934 61 36,758 2,250 60 97 354,652 34,231 112 113,755 12,693 71 14,581 1,040 70 107 268,622 28,646 120 95,535 11,510 80 6,143 494 80 117 204,129 23,826 129 80,931 10,420 90 2,447 219 90 127 156,203 19,762 136 68,910 9,398 97 973 95
100 136 119,579 16,288 145 57,381 8,307 116 130 15 110 145 92,636 13,467 153 47,950 7,315 122 89 11 120 154 72,382 11,142 161 39,180 6,307 123 84 10 130 163 55,105 8,988 169 31,878 5,394 140 172 42,264 7,261 178 25,605 4,547 150 182 30,692 5,585 187 20,019 3,738 160 192 22,152 4,263 195 15,892 3,100 170 202 16,682 3,364 205 11,968 2,454 180 211 12,443 2,626 213 9,396 2,006 190 219 9,633 2,109 222 7,177 1,595 200 227 7,112 1,618 230 5,556 1,280
16.16 Resource Statement Trekkopje Table 16.16.1: Trekkopje Resources
Resource Classification - 100 ppm cut-off Resource (t) Grade eU3O8
(ppm) Contained
eU3O8(t) Contained eU3O8(lbs)
Measured 0 0 0 0 Indicated
Conglomerate 20,063,000 133 2,659 5,862,000 SO4 Rock* 7,772,000 129 1,000 2,205,000
Bedrock 0 0 Total M&I 27,835,000 131 3,659 8,067,000
Inferred Conglomerate 11,395,000 127 1,445 3,186,000
SO4 Rock* 6,821,000 123 839 1,849,000 Bedrock 0 0
Sub-Total Inferred 18,216,000 125 2,284 5,035,000
The current resource estimate includes no Measured Resources for the Trekkopje deposit.

UraMin, Inc. 16-15 Trekkopje Uranium Project Preliminary Assessment
SRK Consulting (US), Inc. April 2007 Trekkopje.NI 43-101 Preliminary Assessment.163701.MA.006.doc
Table 16.16.2: Trekkopje Indicated Resources by CoG
Conglomerate Rock SO4 Rock Cut-off eU3O8 (ppm) kt U3O8(t) eU3O8 (ppm) kt U3O8(t)
20 79 75,173 5,925 90 17,883 1,618 30 92 60,769 5,591 109 14,029 1,527 40 93 59,669 5,553 110 13,832 1,521 50 94 58,775 5,513 110 13,832 1,521 60 99 51,343 5,097 110 13,718 1,514 70 107 41,587 4,464 112 13,347 1,490 80 115 33,715 3,876 115 12,139 1,399 90 124 26,207 3,239 120 10,339 1,244
100 133 20,063 2,659 129 7,772 1,000 110 141 15,560 2,187 137 5,656 776 120 150 11,534 1,725 148 3,794 562 130 160 8,005 1,284 162 2,400 389 140 172 5,522 951 183 1,362 249 150 188 3,486 656 229 621 142 160 201 2,495 502 244 513 125 170 209 2,041 427 256 448 115 180 219 1,601 350 256 448 115 190 226 1,315 298 264 405 107 200 235 1,030 242 264 402 106
Table 16.16.3: Trekkopje Inferred Resources by CoG
Conglomerate Rock SO4 Rock Cut-off eU3O8 (ppm) kt U3O8(t) eU3O8 (ppm) kt U3O8(t)
20 57 79,618 4,572 77 27,031 2,078 30 84 44,980 3,777 94 20,495 1,926 40 85 43,770 3,737 94 20,339 1,921 50 87 42,518 3,680 95 20,286 1,918 60 94 34,033 3,208 97 19,122 1,852 70 101 27,618 2,794 100 17,300 1,734 80 110 20,554 2,262 106 14,215 1,502 90 119 15,360 1,821 113 10,514 1,186
100 127 11,395 1,445 123 6,821 839 110 134 8,654 1,157 133 4,470 593 120 143 5,748 823 145 2,599 378 130 152 3,896 593 160 1,536 246 140 162 2,459 399 174 995 173 150 173 1,535 266 199 531 106 160 182 1,023 187 213 413 88 170 193 632 122 219 365 80 180 204 394 80 232 279 65 190 208 326 68 239 244 58

UraMin, Inc. 16-16 Trekkopje Uranium Project Preliminary Assessment
SRK Consulting (US), Inc. April 2007 Trekkopje.NI 43-101 Preliminary Assessment.163701.MA.006.doc
16.17 Resource Summary & Recommendations SRK has conducted the Interim BFS resource estimate and makes the following observations and recommendations for inclusion into the final BFS resource model:
• Closer drill spacing is recommended to confirm the grades within the current block model. SRK recommends infill RC drilling with a “five spot” pattern not only to confirm grades but also to better define the higher sulfate surface and sulfate grades (in progress);
• While globally, disequilibrium may not be a critical problem, disequilibrium should be modeled at least qualitatively, if not quantitatively, for reserve and mine planning purposes. (Data gathering of XRF U3O8 assays are in progress with the 5-spot drilling);
• Topographic coverage should be ensured (in progress);
• All drillhole collar locations should be resurveyed (completed); and
• Additional studies should be conducted to determine density (in progress).

UraMin, Inc. 16-17 Trekkopje Uranium Project Preliminary Assessment
SRK Consulting (US), Inc. April 2007 Trekkopje.NI 43-101 Preliminary Assessment.163701.MA.006.doc
Figure 16-1: XRF and eU3O8 Data - Trekkopje
Comparions of XRF an eU3O8 data - Trekkopje Deposit
Best Fit line: y = 0.9863x + 22.915; R2 = 0.755
0100200300400500600700
0 100 200 300 400 500 600
XRF-ppm
eU3O
8 in
cl b
ackg
roun
d
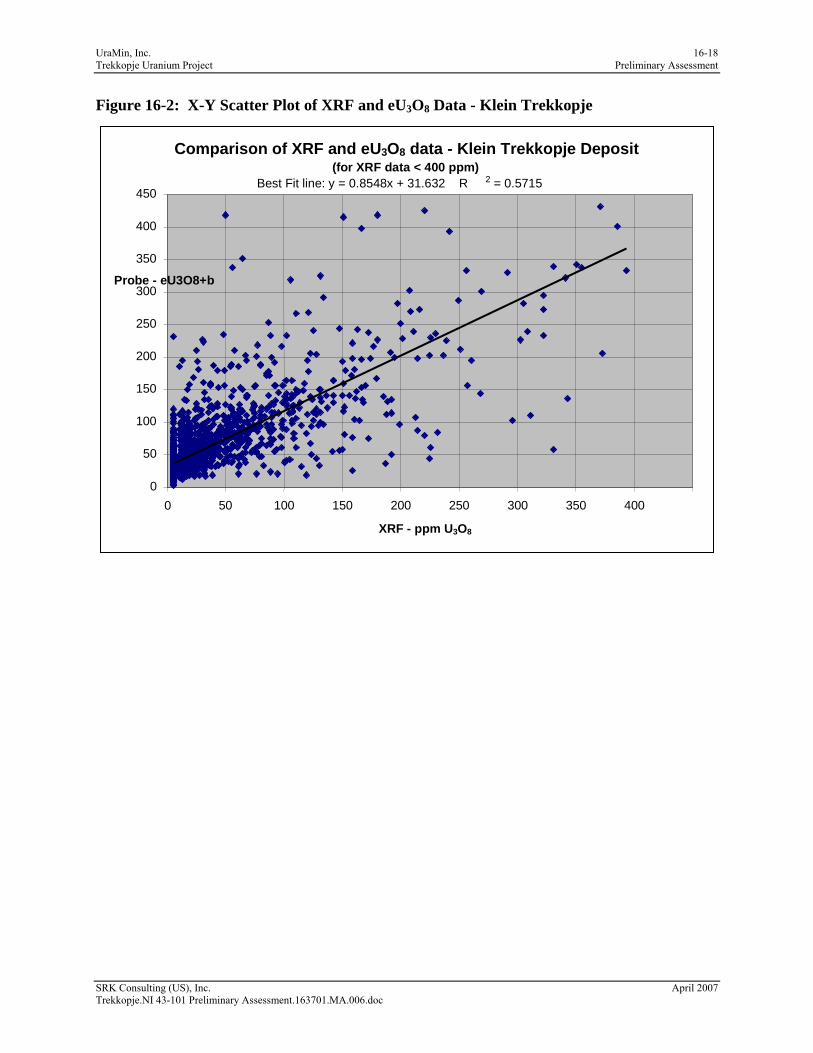
UraMin, Inc. 16-18 Trekkopje Uranium Project Preliminary Assessment
SRK Consulting (US), Inc. April 2007 Trekkopje.NI 43-101 Preliminary Assessment.163701.MA.006.doc
Figure 16-2: X-Y Scatter Plot of XRF and eU3O8 Data - Klein Trekkopje
Comparison of XRF and eU3O8 data - Klein Trekkopje Deposit
(for XRF data < 400 ppm)Best Fit line: y = 0.8548x + 31.632 R 2 = 0.5715
0 50
100 150 200 250 300 350 400 450
0 50 100 150 200 250 300 350 400 XRF - ppm U3O8
Probe - eU3O8+b

UraMin, Inc. 16-19 Trekkopje Uranium Project Preliminary Assessment
SRK Consulting (US), Inc. April 2007 Trekkopje.NI 43-101 Preliminary Assessment.163701.MA.006.doc
Figure 16-3: Disequilibrium with Depth – Trekkopje
Disequilibrium = XRF-(eU3O8 corrected for background)
-300
-200
-100
0
100
200
300
0 5 10 15 20 25 30
Drill Depth (m)
Dis
equi
libri
um

UraMin, Inc. 16-20 Trekkopje Uranium Project Preliminary Assessment
SRK Consulting (US), Inc. April 2007 Trekkopje.NI 43-101 Preliminary Assessment.163701.MA.006.doc
Figure 16-4: Histogram of Relative Disequilibrium at Klein Trekkopje Deposit
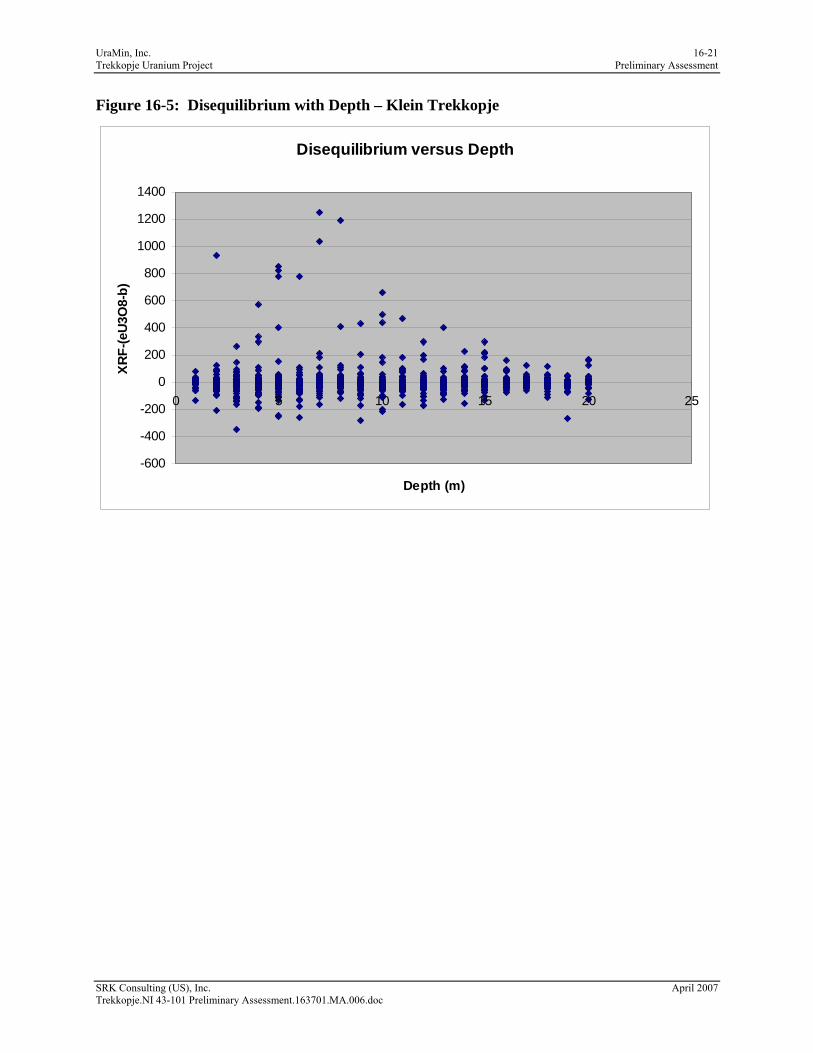
UraMin, Inc. 16-21 Trekkopje Uranium Project Preliminary Assessment
SRK Consulting (US), Inc. April 2007 Trekkopje.NI 43-101 Preliminary Assessment.163701.MA.006.doc
Figure 16-5: Disequilibrium with Depth – Klein Trekkopje
Disequilibrium versus Depth
-600
-400
-200
0
200
400
600
800
1000
1200
1400
0 5 10 15 20 25
Depth (m)
XRF-
(eU3
O8-
b)

UraMin, Inc. 16-22 Trekkopje Uranium Project Preliminary Assessment
SRK Consulting (US), Inc. April 2007 Trekkopje.NI 43-101 Preliminary Assessment.163701.MA.006.doc
Figure 16-6: CF Plot of Trekkopje eU3O8 (ppm) Composites

UraMin, Inc. 16-23 Trekkopje Uranium Project Preliminary Assessment
SRK Consulting (US), Inc. April 2007 Trekkopje.NI 43-101 Preliminary Assessment.163701.MA.006.doc
Figure 16-7: Klein Trekkopje Relative Variograms

UraMin, Inc. 16-24 Trekkopje Uranium Project Preliminary Assessment
SRK Consulting (US), Inc. April 2007 Trekkopje.NI 43-101 Preliminary Assessment.163701.MA.006.doc
Figure 16-8: Klein Trekkopje Deposit 500m Level Plan

UraMin, Inc. 16-25 Trekkopje Uranium Project Preliminary Assessment
SRK Consulting (US), Inc. April 2007 Trekkopje.NI 43-101 Preliminary Assessment.163701.MA.006.doc
Figure 16-9: Trekkopje Deposit 760m Level Plan

UraMin, Inc. 16-26 Trekkopje Uranium Project Preliminary Assessment
SRK Consulting (US), Inc. April 2007 Trekkopje.NI 43-101 Preliminary Assessment.163701.MA.006.doc
Figure 16-10: Klein Trekkopje Swath Plot East-West eU3O8 (ppm)
Swath Plot East
0
20
40
60
80
100
120
140
XC 476500 477800 478800 479800 480800 481800 482800 483800 484800 485800 486800 487800 488800 489800
East
U308
ppm
U3O8NNU3O8

UraMin, Inc. 16-27 Trekkopje Uranium Project Preliminary Assessment
SRK Consulting (US), Inc. April 2007 Trekkopje.NI 43-101 Preliminary Assessment.163701.MA.006.doc
Figure 16-11: Klein Trekkopje Swath Plot North-South eU3O8 (ppm)
Swath Plot North
0
20
40
60
80
100
120
140
YC 7544800 7545800 7546800 7547800 7548800 7549800 7550800 7551800
North
U3O
8ppm U3O8
NNU3O8
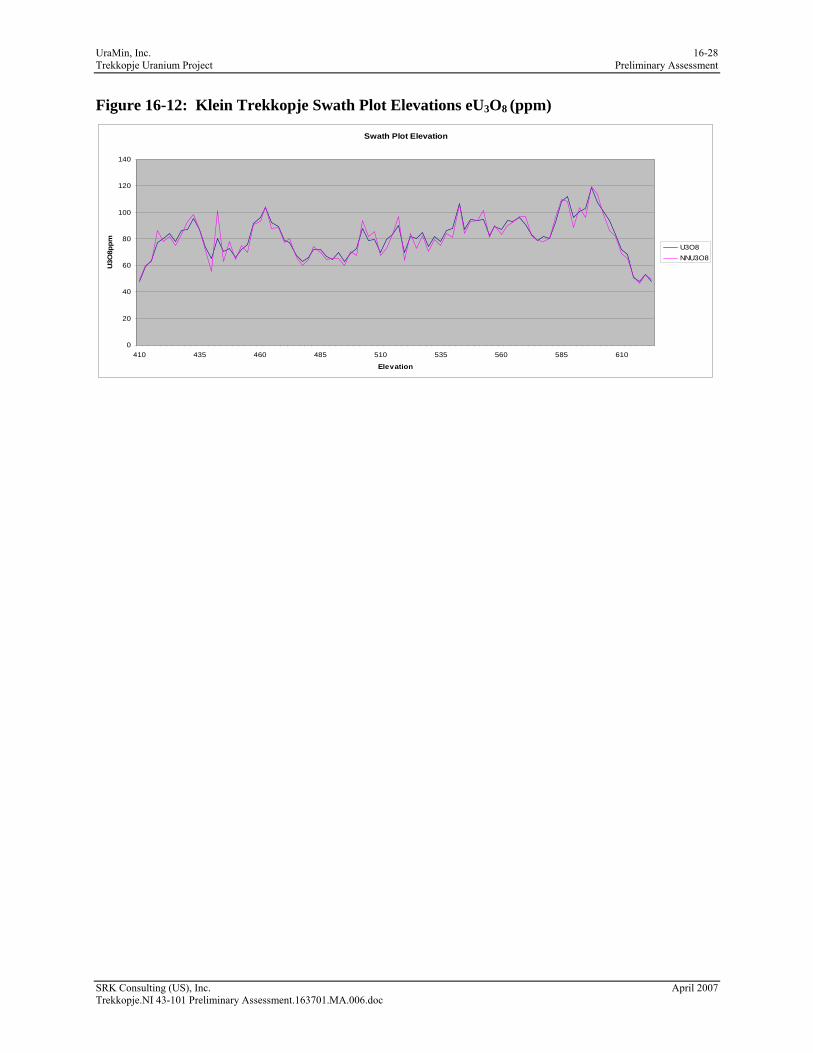
UraMin, Inc. 16-28 Trekkopje Uranium Project Preliminary Assessment
SRK Consulting (US), Inc. April 2007 Trekkopje.NI 43-101 Preliminary Assessment.163701.MA.006.doc
Figure 16-12: Klein Trekkopje Swath Plot Elevations eU3O8 (ppm)
Swath Plot Elevation
0
20
40
60
80
100
120
140
410 435 460 485 510 535 560 585 610
Elevation
U3O
8ppm U3O8
NNU3O8

UraMin, Inc. 16-29 Trekkopje Uranium Project Preliminary Assessment
SRK Consulting (US), Inc. April 2007 Trekkopje.NI 43-101 Preliminary Assessment.163701.MA.006.doc
Figure 16-13: Trekkopje Swath Plot East-West eU3O8 (ppm)
Swath Plot East
0
20
40
60
80
100
120
140
160
180
XC 498300 498500 498700 498900 499100 499300 499500 499700 499900 500100 500300 500500 501200 501400 501700 502100
East
U3O
8ppm U3O8
NNU3O8

UraMin, Inc. 16-30 Trekkopje Uranium Project Preliminary Assessment
SRK Consulting (US), Inc. April 2007 Trekkopje.NI 43-101 Preliminary Assessment.163701.MA.006.doc
Figure 16-14: Trekkopje Swath Plot North-South eU3O8 (ppm)
Swath Plot North
0
20
40
60
80
100
120
140
160
YC 7548700 7548900 7549100 7549300 7549500 7549700 7549900 7550100 7550300 7550500 7550700 7550900 7551100
North
U3O
8ppm U3O8
NNU3O8

UraMin, Inc. 16-31 Trekkopje Uranium Project Preliminary Assessment
SRK Consulting (US), Inc. April 2007 Trekkopje.NI 43-101 Preliminary Assessment.163701.MA.006.doc
Figure 16-15: Trekkopje Swath Plot Elevations eU3O8 (ppm)
Swath Plot Elevation
0
50
100
150
200
250
ZC 722 730 735 740 745 750 755 760 765 770 775 780 785 790 795 800 805
Elevation
U3O
8ppm U3O8
NNU3O8

UraMin, Inc. 16-32 Trekkopje Uranium Project Preliminary Assessment
SRK Consulting (US), Inc. April 2007 Trekkopje.NI 43-101 Preliminary Assessment.163701.MA.006.doc
Figure 16-16: Klein Trekkopje Block Model CF Plot

UraMin, Inc. 17-1 Trekkopje Uranium Project Preliminary Assessment
SRK Consulting (US), Inc. April 2007 Trekkopje.NI 43-101 Preliminary Assessment.163701.MA.006.doc
17 Other Relevant Data & Information (Item 20) This Section of the report presents a summary progress update for the Bankable Feasibility Study (BFS) of the UraMin’s Trekkopje Uranium Project (the Trekkopje Project) in Namibia.
The BFS is being undertaken by a team of collaborating consultants and engineering companies, as presented in Table 17.1. SRK is the overall BFS manager. A strong UraMin owner’s team compliments the work of the BFS team.
Table 17.1: BFS Project Teams and Responsibilities Study Element Responsibility Resource Estimation SRK Mine Design SRK Geotechnics SRK Hydrogeology BWIC Process Flowsheet MSRDI Process Plant Design SENET Infrastructure SENET/Turgis Environmental Management Turgis Marketing and Product Pricing Independent Consultant Project Economics SRK
The study, as of end of January, 2007, is approximately seven months into a projected 15 month schedule and all study activities are progressing reasonably according to plan with all project milestones having been achieved to schedule.
On-going field and analytical work includes 5-spot in-fill drilling and column and ion exchange metallurgical testwork. The bulk of the additional work to completion of the BFS will largely involve refinement of conceptual designs with the setting of detailed design criteria and improving the accuracy of capital and operating cost estimates from a combination of improved designs, material take-offs and vendor operations.
In parallel with the technical BFS work, the Environmental Impact Assessment (EIA) and Environmental Management Plan (EMP) will be completed to ensure the timely application for the necessary permits and authorizations
This Section represents the latest view of project concepts, designs and likely project outcomes based on the work conducted to date, industry accepted practice and certain project specific assumptions. Readers are cautioned that the results reported are not definitive and are subject to change as further work is undertaken. Project outcomes may ultimately be materially different from those projected in this report.
17.1 Summary of Exploration Activities and Progress Since inception of BFS related project activities in May 2006, the exploration program at Trekkopje and Klein Trekkopje has advanced significantly from deposit confirmation drilling, an initial resource estimation, to the current geologically constrained resource model for Klein Trekkopje and Trekkopje. A summary of exploration activities that have resulted in the current resource status are listed below:

UraMin, Inc. 17-2 Trekkopje Uranium Project Preliminary Assessment
SRK Consulting (US), Inc. April 2007 Trekkopje.NI 43-101 Preliminary Assessment.163701.MA.006.doc
• Initial exploration and historical data review resulted in both deposits being re-drilled by UraMin with standard industry drilling techniques and sampling and gamma logging procedures sufficient to allow NI 43-101 compliant resource reporting, as determined by SRK’s QP;
• Drilling progressed from 600m x 800m grid confirmation RC drilling and sampling to the current 200m x 200m percussion drilling with gamma logging, which is the basis for resource estimation at both Trekkopje and Klein Trekkopje;
• The 200m x 200m drilling at Klein Trekkopje significantly increased the Indicated resource, by conversion from Inferred to Indicated, strictly as a function of the increased drill density.
• Drilling is ongoing with 5-spot in-fill to the 200m x 200m drill grid to convert, internal to the grade shells, Inferred resource to Indicated or better;
• Deposit modeling has progressed to definition of grade shells at a statistical break of 35ppm U3O8, which provides geological constraint to grade interpolations; and the resulting variography is demonstrating a preferred orientation, internal to the grade shells, of N35E, which mimics regional basement geology;
• Chemical analysis has verified the background level of 18ppm U3O8 that has been removed from the gamma probe data. Preliminary beaker leach test results on “background” drill samples show only 1ppm or 2ppm chemical U3O8 as available under heap leach conditions, which are within the error limits of estimation and analytical procedures; and
• The ongoing 5-spot drilling is RC drilling, with 1.0m down-hole samples that will provide additional analytical information for;
o SO4 assays sufficient to define SO4 grades internal to the currently defined 83Mt of SO4 bearing rock at Klein Trekkopje and 15Mt at Trekkopje; thus allowing for better discrimination of this material in the final resource estimate,
o CO3 assays that will be used to model the carbonate content of the SO4-bearing rock, as input to the investigation of the potential to acid leach this material, and
o Sufficient U3O8 chemical data to allow a better determination of local areas of disequilibrium (both + and -).
• The exploration drill data for Klein Trekkopje is the basis for the selection of a 200m x 400m area that will be the focus of definition drilling on 25m spacing for detailed deposit definition to reconcile with trail mining of initially 30,000t and subsequently 1Mt of material to be placed on test heaps;
• The program in eight months has defined, by NI 43-101 reportable standards, Measured and Indicated resources totaling 144.6Mt grading 146ppm U3O8 for 46.5Mlb contained U3O8; and the Inferred resource is 195.3Mt grading 138ppm U3O8 for 59.3Mlb contained U3O8, as a project total for Klein Trekkopje and Trekkopje; and
• UraMin has not yet had time to address additional exploration targets on the property; however, there exists opportunity to define drill targets as extensions to known

UraMin, Inc. 17-3 Trekkopje Uranium Project Preliminary Assessment
SRK Consulting (US), Inc. April 2007 Trekkopje.NI 43-101 Preliminary Assessment.163701.MA.006.doc
mineralization and perhaps yet unidentified targets on UraMin held Exclusive Prospecting Licenses.
17.2 Resource Estimation Resource estimation at the Trekkopje Project has progressed from an initial resource estimate in September 2006 to the second geologically constrained resource estimate in January 2007 following additional in-fill drilling. A third resource estimate will be completed in early April to feed into reserve estimation and mine planning for the BFS. Salient aspects of the process are as follows.
17.2.1 Initial Resource Estimate-September 2006 • An unconstrained block model was completed by ordinary kriging of the drillhole gamma
log determined U3O8 data, for both Klein Trekkopje and Trekkopje;
• A Block model was constructed that was based on the prior Turgis concept study that indicated perhaps 70% of the deposits as freely diggable; hence, block size was 100m x 200m x 0.5m vertical to allow for vertical selectivity of mining. The grade interpolation was isotropic as no geological information was present to constrain the model and the variography was ill-defined at the largely 200m x 400m drill pattern that then existed;
• The results largely confirmed the historical resource estimates as to grade, but with a major reduction in tonnage at Trekkopje. The discrepancies with historical resources at Trekkopje were reviewed with M. Viljoen, R. Viljoen and UraMin, and accounted for in the historical estimation process as over-extending low grade and assignment of estimated average grade to low grade blocks; and
• The initial resources were included in UraMin’s NI 43-101 as part of their TSX listing completed in December 2006.
17.2.2 Current Resource Estimate-January 2007 The initial resources are superseded by the current resources defined at Klein Trekkopje, and at Trekkopje.
• Drill data were examined statistically to define an 18ppm “background” radiometric U3O8 base above which mineralization exists. This was removed from the U3O8 down-hole U3O8 data for all drill holes at both Trekkopje and Klein Trekkopje; as was the procedure for the initial resource estimate;
• Statistical data defined a 35ppm break to corrected U3O8 data as the basis for grade shells at both deposits. Grade shells were constructed on section and by Leapfrog software and adjusted in plan to fit the data;
• Data was composited to 2.5m down-hole intervals to allow for the likelihood of bulk tonnage mining methods, while permitting better vertical discrimination of the deposit at the top and bottom of mineralization in the event selectivity in mining can be used on the boundaries of the deposits;
• Increased density of drilling allowed for 100m x 100m x 2.5m blocks; grade interpolation was by ordinary kriging internal to the grade shells, using acceptable variography parameters;

UraMin, Inc. 17-4 Trekkopje Uranium Project Preliminary Assessment
SRK Consulting (US), Inc. April 2007 Trekkopje.NI 43-101 Preliminary Assessment.163701.MA.006.doc
• Resources were classified based on a proportion of the range, number of composites, and a minimum number of drill holes; standard protocols for CIM classifications of Measured, Indicated and Inferred resources, which are NI 43-101 compliant; and
• SO4 grades area based on very limited data, are not currently reliable, and will be augmented with additional information from the current 5-spot drilling in the next resource update. SO4 grades are not reported as they are not NI 43-101 compliant estimated grades.
For the purpose of a Preliminary Assessment, there is a total of 97.3Mt grading 148ppm U3O8 for which sufficient SO4 is present that only a portion of the material, approximately 22Mt, is currently in the plan as processable material, pending further testing and drill assay results.
Resource estimation details and resource estimate tabulations are presented in Section 16 of this report.
17.3 Geotechnics 17.3.1 Summary of Principal Objectives The primary objectives of the mining geotechnics investigation were to:
• Assimilate geotechnical data pertaining to the in-situ rock mass at both the Trekkopje and Klein Trekkopje sites respectively;
• Geotechnically characterize the in-situ rock mass, at both the Trekkopje and Klein Trekkopje sites, according to Laubscher’s (1990) Mine Rock Mass Rating System;
• Assimilate laboratory data pertaining to the geotechnical properties of the in-situ rock mass at both the Trekkopje and Klein Trekkopje sites respectively;
• Classify the in-situ rock mass at both the Trekkopje and Klein Trekkopje sites in terms of excavatability in order to ascertain the free-dig mining potential;
• Make recommendations pertaining to optimal slope angles and the pit architecture at both the Trekkopje and Klein Trekkopje sites for mine design purposes; and
• Make recommendations pertaining to the implementation of a pit slope management program for both the Trekkopje and Klein Trekkopje sites.
17.3.2 Work Program The principal stages of the mining geotechnics investigation work program comprised the following:
• The geotechnical logging of drill core recovered from thirteen rotary cored exploration boreholes from the Trekkopje site and 23 rotary cored exploration boreholes from the Klein Trekkopje site;
• The geotechnical in-pit mapping of the four test pits excavated at the Trekkopje site;
• The selection of 28 representative drill core samples from the respective lithological units intersected in the exploration boreholes drilled at both the Trekkopje and Klein Trekkopje sites;

UraMin, Inc. 17-5 Trekkopje Uranium Project Preliminary Assessment
SRK Consulting (US), Inc. April 2007 Trekkopje.NI 43-101 Preliminary Assessment.163701.MA.006.doc
• The selection of three grab samples, two of overburden material from the test pits at the Trekkopje site and one of residual calcrete from the historical French workings at the Trekkopje site;
• The submission of the representative drill core and grab samples to the CSIR and Soiltech Laboratories in Pretoria and Johannesburg respectively for geomechanical testing;
• The analysis and interpretation of the Trekkopje and Klein Trekkopje site geotechnical borehole logs and laboratory test results; and
• The compilation of a mining geotechnics report incorporating recommendations pertaining to proposed slope angles and pit architecture for the two sites, and the implementation of a pit slope management program.
17.3.3 Results The following is a summary of the results:
• Depth of Weathering;
o The depth of weathering at both the Trekkopje and Klein Trekkopje sites is variable. At the Trekkopje site, the weathering extends to depths of between approximately 15m and 32m. At the Klein Trekkopje site, the depth of weathering extends to depths of between approximately 8m and 30m.
• Jointing;
o Analysis of the geotechnical borehole logs indicate that, typically, two primary joint sets corresponding to joint dip angles of 30º-60º (oblique) and 60º-90º (sub-horizontal) measured relative to the core axis, plus random joints are developed at both the Trekkopje and Klein Trekkopje sites. Sub-horizontal joints constitute the primary joint set, followed by oblique and sub-vertical joints respectively,
o On a macro-scale, the large-scale expression of the joints at the two sites appears to be straight/planar, while on a micro-scale, the joint surface condition is variable. Typically, the joint surfaces are rough undulating and/or rough stepped/irregular. This notwithstanding, smooth planar, slickensided undulating, smooth undulating and slickensided stepped joint surfaces were noted from drill core recovered from the Trekkopje site. Similarly, isolated slickensided undulating stepped joint surfaces were noted from drill core recovered from the Klein Trekkopje site, and
o Joint surfaces are typically clean (devoid of infill material). However, where present at the Trekkopje site, infill typically comprises soft-sheared (fine material), while at the Klein Trekkopje site it comprises either non-softening (coarse), soft-sheared (medium) or soft-sheared (fine) material respectively.
• Excavatability and Rippability;
o Based on the thirteen-geotechnical borehole logs, the excavatability/rippability analysis results for the Trekkopje site indicate that it will be possible to rip/free dig to a maximum depth of approximately 7m, and to a mean depth of approximately 3m, and

UraMin, Inc. 17-6 Trekkopje Uranium Project Preliminary Assessment
SRK Consulting (US), Inc. April 2007 Trekkopje.NI 43-101 Preliminary Assessment.163701.MA.006.doc
o Based on the 23 geotechnical borehole logs, the excavatability/rippability analysis results for the Klein Trekkopje site indicate that it will be possible to rip/free dig to a maximum depth of approximately 8m, and to a mean depth of approximately 5m.
• Limit Equilibrium Analysis;
o Sensitivity analysis results indicate that the both Trekkopje and Klein Trekkopje sites may be mined at slope angles of between 50º and 60º, with the increase in slope angle being associated with a decrease in the Factor of Safety and concomitant increase in the risk of instability.
• Slope Angles and Pit Architecture;
o Confirmation of an appropriate slope angle for the Trekkopje Project should be based on the outcome of the Trekkopje site trial mining.
• Civil Engineering;
o Road Construction Materials,
Based on the Atterberg Limits, the materials tested from the Trekkopje site are suitable for use as sub base and base course material respectively in road construction. However, additional testing of these materials would be required to determine their crushing strength, bearing strength, swell, and compaction criterion before their suitability may be confirmed.
o Concrete Aggregate,
Crushed calcrete may be used as concrete aggregate. However, the possibility of alkali-aggregate reactions should be taken into consideration.
o Foundation Materials,
With the exception of areas of outcrop, founding material at both sites will comprise calcrete. Consequently, the following should be taken into consideration:
• Heavy structures should not be founded on strong calcrete layers unless an adequate thickness has been proven; and
• The use of bilateral plate-jacking tests is recommended for the in-situ evaluation of calcrete.
Light structures may be able to take advantage of the rafting action of strong calcrete layers to spread load and minimize differential settlement caused by underlying softer material
17.4 Hydrogeological Investigations The Bittner Water Consult was appointed by UraMin to select drill sites in hard rock formations within the perimeter of the Trekkopje EPL and investigate the potential for the establishment of a well field for supply of local groundwater for the Trekkopje Project.
Altogether 23 boreholes were sited applying geological and geophysical investigation techniques. Main targets were faulted marbles of the Karibib Formation (Damara Sequence).

UraMin, Inc. 17-7 Trekkopje Uranium Project Preliminary Assessment
SRK Consulting (US), Inc. April 2007 Trekkopje.NI 43-101 Preliminary Assessment.163701.MA.006.doc
Initially the palaeo-channel was also targeted but it showed at an early stage that the groundwater potential is small and after four boreholes drilled with only one successful (TW10) the palaeo-channel investigation was halted.
17.4.1 Aquifer Dimensions, Abstractable Groundwater Reources The calculated aquifer parameters together with the aquifer dimensions derived from the geological and geophysical survey and the air photo interpretation were used to assess the abstractable groundwater reserves. The pumping tests clearly indicated negative boundary conditions and recharge was therefore neglected for the calculations.
17.4.2 Groundwater Quality The groundwater of boreholes TK0001, TW-05, TW-07 and TW-10 was tested for standard parameters. The water is class D according to Namibian drinking water regulations, not suitable for human or livestock consumption. The salinity varies between TDS = 9,000 and TDS = 16,000mg/l.
The water could be utilized for dust suppression and processing, but is not suitable untreated as process water due to its salinity.
17.4.3 Interim Conclusions • Altogether 23 groundwater exploration boreholes were drilled between September and
December 2006, of which five are observation boreholes used for test pumping evaluation;
• From the 23 boreholes drilled, five (TW-05, TW-07, TW-12, TW-13, TW-10) plus the existing borehole TK0001 are recommended as production boreholes;
• Test pumping showed that pumping rates of up to 100m3/hr can be achieved due to the high aquifer transmissivity of the fractured and partly karstified marble rock;
• The abstractable groundwater reserves in the main two marble aquifers nKMA and sKMS are calculated as 5.3Mm3, based on the aquifer dimensions and a specific yield of 10%;
• The abstractable groundwater reserves depend on the depth at which the exploration borehole strikes the water. Additional drilling of exploration boreholes aiming at intersecting the groundwater at greater depth (up to 200m) could further increase the abstractable groundwater volume;
• The recommended short-term (<2 years) unsustainable annual pump rate from the existing six production boreholes is about 1Mm3;
• The recommended longer-term (>2 years) sustainable annual pump rate from the existing six production boreholes is about 0.25Mm3;
• Groundwater abstraction would not have an obvious negative effect on the environment and because it is saline it also does not have any economic value apart from the potential utilization in mining operations; and
• Groundwater recharge is difficult to estimate because of lack of relevant data. Further studies including hydrochemical and groundwater isotope analysis as well as continuous

UraMin, Inc. 17-8 Trekkopje Uranium Project Preliminary Assessment
SRK Consulting (US), Inc. April 2007 Trekkopje.NI 43-101 Preliminary Assessment.163701.MA.006.doc
groundwater level monitoring are necessary to get a proper recharge figure, which is of importance for the realistic assessment of the aquifer potential.
17.5 Mining 17.5.1 Mining Overview SRK has undertaken conceptual mining studies for the Klein Trekkopje mining operations for ore production rates of 40ktpd, 60ktpd, 80ktpd, 100ktpd and 120ktpd.
The mining operations are currently envisaged to be open pit mining operations using large hydraulic excavators (up to 60ktpd) or hydraulic shovels, wheel loaders, and haul trucks. The average stripping ratio is expected to be around 0.5:1 (waste to ore) and potentially lower. The highest production case examined (120ktpd of ore) would require mining up to 60Mtpy of material (ore and waste). Mining activities will include ripping, scraping, drilling, blasting, loading, hauling, together with support activities. Ore will be delivered to a moveable primary crusher, located near the pit, for subsequent crushed ore transportation by conveyors. A RoM stockpile located near the primary crusher would help with continuity of ore delivery over short periods. The mining operations are planned to be operated on three eight-hour shifts/day, seven days/wk. Ore production is planned for 335 days/yr, based on 92% availability of the primary crushers over 365 days. Waste mining and support operations could be conducted up to 360 days/yr.
The mining would be similar to a strip mine given the very shallow depth of the deposit. Modular mining areas (pits) are planned which will use the mined-out pits in which to locate heap leach pads. For the higher production rates pit dimensions would be of the order of 2km x 1km. A typical pit tonnage would be over 40Mt, or between 1 and 2 years production (depending on the actual production rate), and assuming an ore thickness of 10m. Waste will be placed in dumps outside of the pit, or backfilled into previous pits where possible.
Conceptual mining studies are in progress and the currently costed scenarios will be updated to include revised approaches to mining high sulphate (near surface) ore with some smaller equipment.
17.5.2 Mining Concept The mining concept is similar to a strip mine given the very shallow depth of the deposit. Modular mining areas (pits) are planned which may or may not have buffer zones separating them.
For the higher production rates pit dimensions would be of the order of 2km x 1km. (With the geometry of the Klein Trekkopje, deposit there could ultimately be up to eight pits.) A typical pit tonnage would be over 40Mt, or between 1 and 2 years production (depending on the actual production rate), and assuming an ore thickness of 10m.
Figure 17-1 and 17-2 show a conceptual layout of the mining operations and an in-pit heap pad. Pit one (P1) will have an external Heap Leach Pad 1 (HP1). Once mined out, pit voids will become in-pit heap leach pads (with installed liners), such that P1 becomes HP2, P2 becomes HP3, P3 becomes HP4, and so on. P2 ore is placed on HP2, P3 ore on HP3 and so on.
Mined ore will be dumped by large haul trucks into a moveable crusher. A “moveable” crusher is defined as movable every year or so (affecting production for about two days per move).

UraMin, Inc. 17-9 Trekkopje Uranium Project Preliminary Assessment
SRK Consulting (US), Inc. April 2007 Trekkopje.NI 43-101 Preliminary Assessment.163701.MA.006.doc
(Moveable crushers of the size envisaged have been in operation at the Phelps Dodge Sierrita mine in Arizona for many years.)
For the production scenarios up to and including 60ktpd, hydraulic excavators would be able to operate from the high wall, and could load trucks external to the pit excavation. For deeper ore, deeper than approximately 10m from the top of the orebody, excavators and trucks need to operate on lower benches within the pits. For the higher production rate scenarios (80ktpd and above), hydraulic shovels and trucks would operate within the pit excavation.
Other major equipment working at the faces will include tracked and rubber-tired dozers. Trucks would backfill waste into the mined-out areas and pits where possible, or where required to raise the pit floor elevation.
17.5.3 Mine Design Attributes The following attributes are associated with the mining concept previously described:
• Pit voids are re-used as heaps, which simplifies the closure issues;
• Mobile crushers minimize truck travel;
• Conveyors do the majority of the ore transportation, and the maximum conveyor distance is about 2km given adjacent mining/heap leach area modules;
• Mining up dip, albeit nominally, should facilitate solution flow from the base of the heap, thereby simplifying solution collection; and
• Given a stripping ratio of about 0.5:1 and an assumed swell of 50%, the heap leach pads should be at, or close to, original topography.
17.5.4 Mining Fleet 17.5.5 Mine Schedule, Equipment Availability and Utilization Mining activities will include ripping, scraping, drilling, blasting, loading, hauling, together with support activities. Ore will be delivered to a moveable primary crusher, located near the pit, for subsequent transportation by conveyors. A RoM stockpile located near the primary crusher would help with continuity of ore delivery over short periods. The mining operations are planned to be operated on three eight-hour shifts per day, seven days per week. Ore production is planned for 335 days/yr, based on 92% availability of the primary crushers over 365 days. Waste mining and support operations could be conducted over 360 days per year.
Investigations have indicated that up to 20% of rock would be rippable for mining operations. As the 100ktpd mining scenario appears to be the most likely scenario at present results for this case are presented in further detail in the remainder of this section.
17.5.6 Drilling The drilling equipment fleet was planned to consist of five rotary drills (diesel-powered units) capable of drilling 251mm blastholes up to a depth of 11.5m (including 1.5m sub-drill) to develop up to 10m high benches. The planned nominal production blasthole pattern was 6.9m x 6.9m (spacing and burden). Allowance was made for an additional 20% of drilling (for a closer pattern) to avoid the need for secondary blasting in rocks with higher strengths. An instantaneous drilling penetration rate of 0.6m/min. was estimated.
UraMin, Inc. 17-10 Trekkopje Uranium Project Preliminary Assessment
SRK Consulting (US), Inc. April 2007 Trekkopje.NI 43-101 Preliminary Assessment.163701.MA.006.doc
17.5.7 Blasting Predominantly ANFO bulk explosives will be used with use of emulsion explosives where necessary for wet blastholes. 90% of waste blastholes and 85% of ore blastholes were estimated to be dry. The powder factor for production blasting was estimated to be 0.30kgpt based on similar situations for blasting calcrete.
Two ANFO/emulsion trucks would deliver bulk explosives to the blast sites, and rubber-tired skid steer loaders will be used for blasthole stemming. The mine blasting crew would have the responsibility for conducting and managing the blasting operations.
17.5.8 Loading The main loading equipment fleet was planned to consist of four hydraulic front shovels with 28m³ buckets capable of loading 177t trucks (Caterpillar 789 class) in four passes. An additional wheel loader with a 17m³ bucket (Caterpillar 994 class) was included for loading most of the ripped material, and which will add mobility and flexibility in the mining operations. Allowances were made in the loading productivity estimates for cleaning up working faces, and moving to new working areas. The loading capacity of each excavator was estimated to be 14Mtpy to 15Mtpy for mining ore or waste respectively.
As part of the general loader operations, an allowance was made for re-handling approximately 800,000t of ore annually from a RoM stockpile placed in front of the primary crusher. This made allowance for feeding the crusher at times when the main pit operations could be shut down for various reasons.
17.5.9 Hauling The main hauling equipment fleet was planned to consist of thirteen 177t diesel mechanical drive trucks. Ore will be hauled to a primary crusher for processing (average distance 1.65km), and waste will normally be placed into the nearest waste dump (average distance 2.65km), or backfilled.
Overall haulage cycle times were calculated including the truck loading time, hauling time and dumping time, all factored for efficiency (allowing for typical operational delays and inefficiencies). Representative truck hauling productivities were calculated for waste and ore, and used to calculate haul truck fleet requirements, as well as for estimating hauling operating costs.
17.5.10 Mining Support Equipment A fleet of mining support equipment confusing dozers, graders, and general purpose loaders and trucks has been included in the equipment list.
17.5.11 Mine Geology and Engineering Grade control will be accomplished by probe measurements, and to a lesser extent assaying the blasthole samples. Data will be entered into a computer system. The mine will utilize a dispatch system with GPS features. The mine department will be also be provided with mine surveying equipment, mine engineering and geology equipment (instruments, computers, software, plotter etc.), and mine communications (radios).

UraMin, Inc. 17-11 Trekkopje Uranium Project Preliminary Assessment
SRK Consulting (US), Inc. April 2007 Trekkopje.NI 43-101 Preliminary Assessment.163701.MA.006.doc
17.5.12 Mine Labor The supervision and technical salaried staff total is planned to be up to 52 positions. Four mine production hourly crews will be necessary. The mine production hourly employee total was planned to be 366. Equipment operator labor allocations are based on the operating hours required, and on the assumption that some of the operators will be cross-trained, and when not required to be on one type of heavy equipment unit will be able to operate another. To maintain this situation it is planned for the mine department to have four equipment trainers on staff. A mining equipment maintenance department was included.
Allowances were included for benefits and vacations in the wages, and were based on information provided through Turgis.
17.5.13 Other Mine Operations To the extent possible, diversion ditches will be located above the open pit areas to drain water flowing into the pit areas and re-direct it into natural drainages. Mine dewatering, as and when needed, would also be accomplished using diesel generator powered submersible pumps placed in sumps at strategic locations. The water would be pumped from the pits and discharged into drainages.
17.6 Metallurgy and Process Description A metallurgical testwork program was developed for the Trekkopje Project to support the process and flow sheet development and to provide process and plant design criteria.
17.6.1 Processing Options In general, the greater the amount of ore processed, the more metals recovered from the ore but with corresponding increases in capital and operating costs; and not necessarily associated increase in recovery efficiency. Three options were considered for processing the uranium/vanadium ore from the Trekkopje/Klein Trekkopje deposits:
• In-situ leaching: In-situ leaching is the simplest of the processes being considered whereby Injection wells are drilled into the ore through which a leach solution is injected into the deposit to dissolve the uranium and vanadium, or sprayed on ore placed in-situ. “Production wells” (additional drill holes, or the injection wells themselves) are used to withdraw the leach solution containing the uranium and vanadium from the deposit. No mining of the ore is required and thus, this is a low capital and operating cost option. The primary disadvantage with this option is the environmental permitting, as it is extremely difficult to demonstrate containment of the PLS without an engineered system, such as a geosynthetic liner. Therefore, this option has not been considered in detail at this time;
• Agitation or tank leaching: In agitation leaching the ore is mined and crushed to a fine powder and mixed with the leach solution to form a slurry which is agitated in a tank for a sufficient time for the metals to be dissolved. The PLS containing the uranium and vanadium is then processed to recover the metal values. The attrition tests completed to date indicate that milling will not be an economic means of uranium recovery; and
• Heap Leaching: After the ore is mined, it is crushed, and stacked on a Heap Leach Pad constructed by preparing a gently sloping surface, which is covered with one, or two layers of very low permeability geomembrane. Leach solution is sprayed on top of the

UraMin, Inc. 17-12 Trekkopje Uranium Project Preliminary Assessment
SRK Consulting (US), Inc. April 2007 Trekkopje.NI 43-101 Preliminary Assessment.163701.MA.006.doc
heap, and PLS recovered as it flows from the bottom edge (toe) of the heap. Heap leaching offers the theoretical advantage of being able to control solution flow through the broken ore in the heap and increased metal recovery due to the finer size of the ore particles being leached, provided that ore is placed and solution applied in a uniform manner. Generally, the finer the particle size the ore is crushed to the faster the metal will be leached out of the ore and the greater will be the percentage of metal in the ore, which is ultimately recovered. However, the finer crush also means increased capital and operating costs. Heap leaching is the preferred approach from a cost perspective, and the results of the column testing thus far has confirmed this.
Initially, it was believed that for the Trekkopje ore, the conventional sulfuric acid process was not an option because of the chemical nature of the ore (high sulphate content – more than 0.5%) which resulted in excessive reagent consumption and unfavorable economics and as such the sodium carbonate/bicarbonate process was deemed to be the only economical process for leaching the ore. However, it has since been suggested that gypsum containing ores may be processed by the sulfuric acid technique.
The rationale behind this suggestion is that:
• Any gypsum in the ore leached by carbonate will consume carbonate. In addition, the sulfate released into solution by the reaction of the gypsum with carbonate will be detrimental to the performance of the IX process of extracting the uranium from the PLS. Therefore, there is an economic limit to the percent of gypsum the economically treatable ore can contain;
• Alternatively, high gypsum ores which are economically unsuitable feed to the carbonated leach process can be leached with sulfuric acid. However, the calcite in the ore consumes acid and excessive amounts of calcite will make sulfuric acid leaching of the ore uneconomical; and
• Therefore, low gypsum ores with any amount of calcium carbonate can be leached in a carbonate leach process and any ores with any amount of gypsum can be leached in a sulfuric acid leach process. However, ore containing a high calcium carbonate content and a high gypsum content cannot be leached economically by either process. The limits of gypsum and calcium carbonate are determined by the economics and ultimately the cost of a suite of reagents required throughout the mineral recovery process chain.
Two proven pregnant leach solution (PLS) treatment schemes are ion exchange and direct precipitation. The test work has shown that the grade of the PLS is too low for a direct precipitation route and hence ion exchange will be the preferred process for the treatment of the PLS to recover U3O8 and V2O5.
Three sources of water have been identified for the Trekkopje Project. These consist of the following:
• Groundwater. Groundwater from the production wells envisioned for the site was considered not suitable for human or livestock consumption. The recommended short-term (<2 years) unsustainable annual pump rate from the existing six production boreholes is about 1Mm3 (about 114m³/hr), while the recommended longer-term (>2 years) sustainable annual pump rate from the existing six production boreholes is about
UraMin, Inc. 17-13 Trekkopje Uranium Project Preliminary Assessment
SRK Consulting (US), Inc. April 2007 Trekkopje.NI 43-101 Preliminary Assessment.163701.MA.006.doc
0.25Mm3 (about 29m³/hr). Therefore, the long-term sustainable pumping rate limits the suitability of groundwater as a long-term water source;
• Seawater: During operations, the application of seawater would apply approximately 35kg of salt/m³ of water and a large volume of salt can be anticipated to precipitate on the heap during operations. This will result in a number of issues that can have a major adverse affect on the project; and
• Desalinated Seawater: A reverse osmosis (RO) water treatment plant would be constructed to treat seawater, and would be pumped to the site. This is currently the preferred water source option.
Given the selection of heap leaching and ion exchange as the preferred process route, a desalinated water source will be required since chloride in both the seawater and saline water will inhibit the ion exchange process.
17.6.2 Preferred Process Route The technical rationalization for selection of the heap leaching option over the tank leach process for the Trekkopje ore is as follows:
• Heap leaching offers a considerably lower cost (opex and capex) process route than tank leach due to the relative complexity of the tank leach process;
• The scrubbing of the ore to obtain a fine fraction rich in U/V has not been as successful as anticipated. The projected recovery of 90% in a fine fraction twice the head grade is not possible on all the samples tested;
• Production of a fine product by scrubbing requires splitting the scrubbed ore of different sizes for different ore samples and this would be difficult if not impossible to accommodate in a commercial operation;
• Results of preliminary tests on both the fine fraction and on minus 25mm ore size shows that the uranium is readily solubilized and that the finer material would not result in significantly higher ultimate recovery than the coarse heap leach material;
• Tank leaching option requires a large CCD circuit because of the nature of the fine product being leached and water requirements are two to three times higher than the heap leaching options. Moreover, the tailings from tank leaching would require a very large tailing pond;
• Complexity of tank leach compared to heap leaching would result in substantially higher capital and operating costs;
• Should further information become available which would enhance the usefulness of tank leaching, this can be done after the heap-leaching option is put into operation. The addition of tank leaching and CCD circuit could be made and the existing heap leaching plant can be used for treating submarginal ores in the future. In this case, the existing PLS treatment plant would be available for both the tank leaching plant and heap leaching. Therefore, minimal capital investment would be wasted; the only loss would be in the incremental recovery from the processing of ores through heap leaching rather than tank leaching; and
UraMin, Inc. 17-14 Trekkopje Uranium Project Preliminary Assessment
SRK Consulting (US), Inc. April 2007 Trekkopje.NI 43-101 Preliminary Assessment.163701.MA.006.doc
• The heap leach option would entail considerably less ore haulage as the heap would be located close to the modular pits, whereas ore in tank leaching would need to be hauled to a central tank leaching facility, which may be up to 5 or 6km from the mine.
Based on the above premise, all efforts are now being directed towards further column testwork and the design of the heap leaching option.
17.6.3 Process Description Crushing Ore will be crushed in-pit through the crushing circuit separately. Permeability testing has indicated that the ore will not require agglomeration. At the time of this reporting, the ore would be crushed to 100% passing 38mm.
Ore will be delivered to the primary crusher/mineral sizer by haul trucks and direct dumped through a mobile crushing facility, combining a stationary grizzly into a bin, allowing capacity for approximately two truckloads. It will be necessary to sort large boulders in the pit to prevent excessive oversize material from reaching the crusher. It is envisaged that two crushing stations will be required.
The ore will be fed from the bin to each of the primary crushers/mineral sizers via Apron Feeders at a rate of approximately 3,500tph. The mechanical utilization of the crushing and conveying packages have been projected to be 72%, which is typical for these types of crushing circuits.
Ore discharging from the primary crusher/mineral sizers will be transferred to the secondary and possibly tertiary crushing and screening units, all of which will be mobile. Continuous belt magnets and metal detectors will be installed to remove and detect tramp metal prior to the fine crushing circuit.
The secondary and tertiary crushing circuits will operate seven days/wk, 24 hours/day, at an average production rate of approximately 3,500tph each.
The crusher product will be transported to two sets of stacking equipment, each comprising overland conveyors and a number of portable conveyors and a radial stacker conveyor to transport the crushed ore to the heap leach pads .
High pressure, low volume spray fogging systems will be used for dust suppression at the dump pocket and at conveyor transfer points throughout the crushing facilities.
Heap Leach Pad Loading The crushed ore will be conveyed to the heap leach pad by 1,350mm overland conveyors. A series of grasshopper conveyors will then transfer the material from the overland conveyor to the stacker, which will distribute the crushed ore evenly to form the heap leach pad.
Heap Leach Pad Layout The pads will be constructed in phases, the first of which will contain approximately one year of production.
The leach pad area will be cleared of organic material and graded to provide drainage and a suitable foundation of natural material. The leach pad will generally follow the existing grade; a 200m wide cut graded at 5% will be created at the low end of the leach pad in order to provide stabilization of the heap. A 300mm layer of compacted low permeability soil will be applied

UraMin, Inc. 17-15 Trekkopje Uranium Project Preliminary Assessment
SRK Consulting (US), Inc. April 2007 Trekkopje.NI 43-101 Preliminary Assessment.163701.MA.006.doc
over the competent native material to act as a base liner. On top of the compacted low permeability soil, a 1.5mm HDPE liner will blaid. The solution collection piping will be placed on top of the liner and covered with 600mm of overliner material. The overliner material will be coarse crushed mine waste ore placed to protect the liner and piping from the ore being stacked and to provide a higher permeability zone. The heap leach pad will be constructed using stacking conveyors.
Series Operation In operation, the solution is pumped from the intermediate ponds to a section of the heap. The intermediate leach solution from the first section returns to the first intermediate pond and is pumped to a second section of the heap. The pregnant solution from the second step will flow through a second drainage channel or pipe to another intermediate pond, and then pumped to a third section of the plant, from where it will then report to a pregnant solution pond.
The layout and drainage design for the heap in this Study incorporates the sectioned pad and parallel solution ditches required to allow recycle of solutions.
Solution Management External solution ponds will be used to contain pregnant, intermediate, barren and excess solutions
Resin Adsorption Once the PLS has achieved a suitable grade (>50ppm U3O8) the solution in the PLS pond will be diverted to the Ion Exchange (IX) section of the Process Plant. The IX Plant will consist of three resin columns, one of which will be the head column, the second of which will serve as a scavenger, whilst the third will either be in a resin regeneration stage or be in standby mode. These columns will be circulated, as once the head column has achieved breakthrough, the scavenger column becomes the head and the regenerated column becomes the scavenger, while the head column undergoes stripping and resin regeneration.
Resin Stripping Once the column has achieved breakthrough (no further adsorption possible) the column will be taken out of circuit and eluted to produce a concentrated uranium bearing solution. A concentrated U3O8 solution will be further recovered, and U3O8 will be recovered either by direct precipitation with peroxide, or further upgraded by means of solvent extraction. Testwork to determine the preferred process is expected to commence before March 2007.
Yellowcake Recovery Yellowcake recovered by precipitation (either directly from resin stripping, or from solvent extraction organic phase) will be dewatered by centrifuge or filtration, after which it will be dried in a kiln, and then drummed for product dispatch.
17.7 Infrastructure 17.7.1 Site Drainage There are no permanent creeks or rivers on the site, however, during periods of rain, there is some surface runoff, open channel flow and standing water in low areas. Nominal grading and ditching will be adequate to maintain a well-drained site.

UraMin, Inc. 17-16 Trekkopje Uranium Project Preliminary Assessment
SRK Consulting (US), Inc. April 2007 Trekkopje.NI 43-101 Preliminary Assessment.163701.MA.006.doc
Finish grade on the plantsite will be constructed to provide positive drainage away from structures. A system of ditches will route runoff around the plantsite and the leach pad.
17.7.2 Access The new access road will be stripped of organic material and surfaced with granular materials. Drainage ditches and culverts will be placed in accordance with the site drainage requirements.
Plantsite roads will be stripped of organic material and surfaced with granular materials. Drainage ditches and culverts will be placed in accordance with the site drainage requirements. Site haul roads will be 17m wide and constructed to meet the requirements of haul trucks. Other roads on site will be 5m wide.
The entire site will be surrounded with a 2m high range fence in order to keep range animals out of the plantsite. Access to the plantsite will be restricted to one access at the main gate, which will include a gatehouse manned 24 hours/day.
A 2m high chain link security fence will be erected around the process plant and ponds, substations and explosive storage areas.
17.7.3 Power Supply and Electrical Distribution The electrical system will be sized to take into account the process loads of the crushing plant, conveyors and process plant as well as the ancillary building loads, including the workshop/warehouse, mine dry/canteen and administration buildings.
Spare capacity will be available within the electrical distribution system to allow for limited future expansion of the process plant.
The incoming power supply will be a new overhead pole line from the national grid, and will terminate at the main substation located near the plantsite.
The main substation will consist of the main disconnect, metering facilities, main transformer, medium voltage circuit breaker and Medium Voltage Switchgear transformer and metering system. The Medium Voltage Switchgear will be enclosed in a self-contained, walk-in modular switch house.
17.7.4 Power Distribution Distribution from the main substation will include the following feeders:
• An 11kV overhead power line will provide power distribution to the ponds, leach pads overland conveyor systems and the process plant; and
• 6.6kV overhead power line will provide power distribution to the electrical distribution equipment for the workshop complex, administration building, dry/canteen, sewage treatment plant and fuel storage facility.
The process building and power system modules will generally include outdoor oil-filled transformers, motor control centers (MCC’s), power distribution centers (PDC’s), indoor dry-type transformers local circuitry 380V, one-phase distribution panels and local control devices. All electrical distribution will be in cable trays using amour interlocked PVC coated cables.

UraMin, Inc. 17-17 Trekkopje Uranium Project Preliminary Assessment
SRK Consulting (US), Inc. April 2007 Trekkopje.NI 43-101 Preliminary Assessment.163701.MA.006.doc
The process and plantsite ancillary facilities switchgear and electrical equipment will be installed in modular electrical rooms adjacent to or within their respective buildings where economically feasible.
In non-process areas, such as the administration building, dry/canteen, sewage treatment plant, fuel storage facility, water tanks and workshop complex, a combination of armored-type cable and rigid galvanized steel conduit and wire system will be used in exposed areas.
Motor control centers will be complete with motor starters, contactors, disconnect switches, transformers, panels, circuit breakers and fuses.
17.7.5 Communication Communication cabling will be supported on messenger wire underbuilt to the poleline and/or run underground in 2in conduit to the respective buildings.
17.7.6 Fire Alarm System A complete self-contained fire alarm system will be installed in all buildings to meet the local codes and insurance underwriter’s regulations for fire protection.
17.7.7 Bulk Water Supply and Distribution The selection of a carbonate/bi-carbonate heap leach and ion exchange as the preferred process route has resulted in desalinated seawater as the preferred bulk water supply option in the short term. A mine production rate of 100ktpd to be crushed and placed on the heaps and irrigated would require an annual bulk water supply of 12Mm3. This would be supplied from a conventional RO desalination plant to be located on the coast to the north of Swakopmund some 50km from the Trekkopje Project site. The bulk water supply system would consist of a seawater abstraction plant, a pre-conditioner, a conventional RO plant, plant water storage reservoir, a reticulation system, comprising pipeline and pumps and storage resistor at the Trekkopje site.
Various meetings have been held with NamWater and other mining bulk water users to explore opportunities for collaboration in the generation of desalinated water, the possibility of such facilities being eligible for EU or other multi-lateral donor funding. However, for the purposes of this interim progress update and preliminary assessment, a stand-alone UraMin facility has been assumed. Engineering and cost estimating work is proceeding on this basis.
Expression of interest to provide an overall project management and technical consulting service for the bulk water supply have been invited from internationally recognized companies who have a track record in this field.
17.7.8 Desalinated Water Storage One desalinated water reservoir will be located on the hill to the South Western end of the pit and will supply water for the whole plant.
The fresh water tanks will be a HDPE lined earthen dam.
The water reservoir serving the plantsite will have a total capacity of 30,000m3.
17.7.9 Fire Water Distribution As both fire/fresh water tanks are elevated on the surrounding hillside, gravity flow will be utilized for the water distribution. Utilizing gravity flow eliminates the need for fire water

UraMin, Inc. 17-18 Trekkopje Uranium Project Preliminary Assessment
SRK Consulting (US), Inc. April 2007 Trekkopje.NI 43-101 Preliminary Assessment.163701.MA.006.doc
jockey pumps and diesel driven fire water pumps. An alarm will be sounded at the plantsite for low system pressure.
The fire water system will consist of a buried fire water loop and hydrant system at the plantsite and ancillary buildings and at the process plant. Hose cabinets will be placed at the fire hydrant locations and the system supplemented with portable fire extinguishers placed within the process facilities. The administration building and mine dry and canteen will have sprinkler systems.
Emergency showers and eyewash stations will be located throughout the process facilities.
17.7.10 Fresh Water Distribution The fresh water distribution system at the plantsite will include fresh water makeup to the process and for road watering. Road watering will be provided by a standpipe located at the primary crusher area.
Fresh water supply will be gravity flow. The supply from the fresh water tank will be buried high-density polyethylene (HDPE) pipe to the point of service. Above ground distribution pipe will be carbon steel.
17.7.11 Potable Water Distribution Potable water will be supplied to the ancillary facilities at the plantsite. Fresh water will be treated and stored in a lined, above-ground potable water storage tank adjacent to the fresh water tank.
Potable water treatment will consist of filtering and a hypochlorate addition system consisting of a small mix tank and a metering pump. The hypochlorinator will be located inside a container.
Bottled potable water will be supplied to all other locations, i.e. administration building, control rooms and the process plant.
17.7.12 Sewage Collection and Treatment The sewage collection treatment and disposal system at the plantsite will be comprised of a buried gravity collection system from the ancillary facilities to the sewage treatment plant. The collection system will be comprised of buried PVC pipe and concrete manholes.
Sewage collection in remote areas will be in holding tanks and pumped out by truck to be deposited in the sewage treatment plant.
The sewage treatment plant effluent will be pumped to a tile field for below ground disposal. There will be no surface disposal to the environment.
17.7.13 Fuel and Lubricant Storage and Distribution Diesel fuel will be delivered to the site by tanker truck.
Diesel fuel requirements for the mining equipment and process and ancillary facilities will be supplied from a diesel fuel storage tank located at the truck shop.
Diesel fuel distribution will be limited to loading and unloading facilities and metering equipment at the diesel fuel tank.
Lubricants will be delivered to the site in drums. The drums will be stored in a secure area. The lubricants will be distributed to hose reels in the truck shop service bay with barrel pumps.

UraMin, Inc. 17-19 Trekkopje Uranium Project Preliminary Assessment
SRK Consulting (US), Inc. April 2007 Trekkopje.NI 43-101 Preliminary Assessment.163701.MA.006.doc
17.7.14 Architectural Specifications Local building materials will be utilized wherever practical and cost effective. Local buildings are primarily concrete and blockwork structures.
17.7.15 Workshop/Warehouse The workshop will be a prefabricated concrete building with spread footing design.
The workshop will include two indoor mobile equipment repair bays equipped with an overhead traveling crane, a small vehicle repair bay and one outdoor wash bay equipped with high pressure water monitors and a sloped concrete pad to an oil/water separator. Also included are a machine shop and a welding shop. A two-story annex is provided and will include a mechanical room housing a compressor, high pressure water and steam cleaning equipment, lubricant distribution pumps, electrical/instrumentation work areas and a tool crib. Offices for warehouse, maintenance and planning personnel will be provided on the second floor of the annex.
The warehouse will be located adjacent to the truckshop. The structure will include personnel access doors, and interior office area, manually operated service door and interior shelving. An outdoor secure storage area surrounded by a chain link fence will be included located between the warehouse and workshop.
17.7.16 Administration Building The administration building will be of a single-storey prefabricated panel construction. The panel construction is considered the least expensive alternative as these buildings can be efficiently transported to site in containers and assembled on a prepared concrete slab quickly and efficiently.
The administration building will include general areas for engineering, geology and administration personnel and offices for the general manager, mine manager, plant superintendent, administration superintendent, chief geologist, chief engineer and security chief.
17.7.17 Mine Dry and Canteen The mine dry and canteen will be centrally located to the administration building and truck shop and be of single-story construction. Prefabricated panel construction will be utilized for this structure with a slab on grade foundation.
In addition to the clean and dirty dry areas and canteen, the building will include offices for the mine general foreman, drilling/blasting foreman, shift supervisor, safety officer and first-air room on the ground floor.
17.7.18 Assay Laboratory A fully equipped assay laboratory will be included on the plantsite. The laboratory will perform daily analysis of mining and process samples. The laboratory will be a single-storey structure.
17.7.19 Miscellaneous Site Buildings A main gatehouse will be located at the entrance to the plantsite. This building will be a simple single-storey blockwork structure. An additional blockwork security shack will be located at the entrance to the process plant.
The explosives storage magazine will be of blockwork construction.

UraMin, Inc. 17-20 Trekkopje Uranium Project Preliminary Assessment
SRK Consulting (US), Inc. April 2007 Trekkopje.NI 43-101 Preliminary Assessment.163701.MA.006.doc
17.7.20 Accommodation Buildings There are plans to erect a temporary construction camp. During construction the camp will consist of pre-fabricated panel construction buildings. Operations personnel will be housed in the surrounding towns and villages.
17.8 Environmental Management 17.8.1 Location The Trekkopje Project is located in a sensitive, hyper-arid zone adjacent to two protected areas of national significance in Namibia (see Figure 9-1). Furthermore, the site is located with the //Gaingu Conservancy, a designated community-based natural resource management area. As consequence, potential social and environmental impacts have been carefully scoped and will be addressed in the project’s environmental and social management plans.
17.8.2 Climate In Africa, Namibia’s climate is second in aridity only to the Sahara Desert with 92% of the land area defined as hyper-arid, arid, or semi-arid. Mean annual rainfall is estimated to be 285mm. Of the total rainfall, 83% evaporates, 14% is used up by vegetation, 1% recharges groundwater and only 2% becomes runoff and may be harnessed in surface storage facilities (FAO, 2005). Net evaporation can be as high as 3,700mm/yr. On the coastal plateau, the average monthly evapotranspiration always exceeds the rainfall by a factor of up to five.
The Erongo coastal zone is under the strong desiccating influence of the cold Benguela current and is positioned in the latitudinal zone of stable descending air, limiting convectional rainfall throughout much of Namibia’s interior.
17.8.3 Conditions Rainfall The annual rainfall of the project area is sparse and highly unpredictable. The annual mean of the Namib Desert ranges from 5mm in the west to about 85mm in the east. There is extraordinary variation in rainfall between years, with the driest parts of the desert having the highest variation (Lovegrove, 1993).
Wind The prevailing wind is southwesterly. This wind is cooled by the Benguela current along the west coast and produces an inland movement of cold air. The cool air regularly forms a layer of fog, which is blown inland as far as 50km. This coastal fog provides life-supporting moisture to a high diversity of fauna and flora in this arid environment. The wind speed is stronger in winter than in summer, mainly due to the dominant high-pressure system of the inland regions that result in subsiding air drainage to the coastal regions.
Temperatures The Trekkopje area lies within the climatic zone of the Namib desert, thus hot and dry day temperatures up to 50°C with cool nights as low as 0°C have been recorded (von Willert et al., 1992). Daily and seasonal temperatures are thus highly variable. Due to the relative close proximity of the coast, frost will be a rare occurrence at the site.
UraMin, Inc. 17-21 Trekkopje Uranium Project Preliminary Assessment
SRK Consulting (US), Inc. April 2007 Trekkopje.NI 43-101 Preliminary Assessment.163701.MA.006.doc
17.9 Environmental Studies and Background Information Substantial progress has been made in the EIA process. The initial scoping for the project commenced in early February 2006. Specialist studies have been completed for the following aspects of the project:
• Socio-economic analysis of the proposed project’s immediate area of influence;
• Baseline photo survey of the site;
• Geological assessment;
• Climate assessment;
• Topographic analysis;
• Land use and land capability assessment;
• Archaeological and cultural site investigation;
• Vegetation survey; and
• Faunal survey.
Studies into the following are ongoing:
• Technical feasibility assessment–the feasibility of mining and processing the ore, with special emphasis on the supply of water and power;
• Surface water analysis;
• Air quality analysis;
• Radiology analysis; and
• Sensitive area and visual impacts analysis.
The public participation process is ongoing. This process is continually updated to accommodate changes in the technical design, for example, an unscheduled series of key stakeholder meetings was held in December 2006 to advise stakeholders of possible changes to the metallurgical processes to be employed at Trekkopje and to collate input from these stakeholders on this.
The Trekkopje EIA process is shown in Figure 17-4.
17.9.1 Permitting Required Permits & Status Exploration activities at Trekkopje are currently being conducted in terms of a permit issued as an Exclusive Prospecting License (EPL). This EPL has an environmental management program (EMP) approved by the Ministry of Mines and Energy (MME). Work is currently underway on an addendum to this EMP to provide for management of impacts arising from heap leach treatment of bulk samples–a technology not previously addressed in the EMP.
The EIA report for the full project is currently on hold as the impact assessment, EMP chapters cannot be completed until the detailed impacts arising from the processing and mining activities are finalised. Once the impact assessment and EMP chapters are complete, the report will be sent out for public scrutiny. This requires a period of between four and five weeks, followed by

UraMin, Inc. 17-22 Trekkopje Uranium Project Preliminary Assessment
SRK Consulting (US), Inc. April 2007 Trekkopje.NI 43-101 Preliminary Assessment.163701.MA.006.doc
public meetings in Swakopmund and Windhoek. An independent review will be conducted simultaneously by the Southern African Institute for Environmental Assessment. After the review comments have been received, the report will be edited and submitted to the Ministry of Environment and Tourism (MET) for adjudication. A positive record of decision results in an environmental contract and an enforceable EMP.
Other permits that may be required include:
• Groundwater abstraction permits;
• Waste water discharge permit (in terms of sections 21(5) and 22(2) for exemption from compliance with the provisions of sections 21(1) and 21(2) of the Water Act–Act 54 of 1956) for;
o Disposal of industrial effluents,
o Domestic waste water treatment,
o Oxidations ponds, and
o Septic tanks and French drains.
17.9.2 Baseline Investigations Social Baseline Two communities are located in close proximity to the Trekkopje Project. These are the towns of Arandis and the Spitzkoppe settlement (see Figure 17-3). Common characteristics of these communities include low skill levels, unemployment, and limited livelihood options. Spitzkoppe experiences extreme underdevelopment and poverty. There are no social services, the community is isolated, has no community cohesion and a fragmented and politicized leadership. Arandis has weak local government. Decaying infrastructure, especially the water reticulation network, affects this former mining town. The town is also characterized by high levels of dependency and of poverty
Environmental Baseline Fauna and flora surveys have been conducted in the mining zones and adjacent areas as the rehabilitation and conservation strategies adopted by the mine have implications for the //Gaingu Conservancy. Significant numbers of endemic, near endemic and protected species have been recorded or are expected to occur in the area. The species list includes:
• Sixty three species of reptiles (snakes, lizards, geckos) with 27 species being endemic;
• Amphibians: Six species expected, three of which are endemic;
• Mammals: 52 species expected (10% endemic); and
• Birds: although not classified as an important birding area, 126 species are expected to occur, 35 of which have been observed.
Critical habitat sites have been identified across the landscape.
Water is the limiting ecological variable in the Namib Desert and is therefore key. Four water abstraction boreholes exist on site. These have been tested and only one is suitable for abstraction. This water can be used for dust suppression and other construction works. The

UraMin, Inc. 17-23 Trekkopje Uranium Project Preliminary Assessment
SRK Consulting (US), Inc. April 2007 Trekkopje.NI 43-101 Preliminary Assessment.163701.MA.006.doc
recommended abstraction rate is 2.5m3/hr. Additional test work has been completed and the possibility of utilizing saline ground water on site is being investigated.
Natural crusting of the soil minimizes the frequency of windblown dust, even at moderate wind speeds of 3 to 5m/s. For this reason, there is little existing dust impact on site.
Although the orebody is low grade, it is proximity to the surface and friable nature presents a potential radiation hazard, especially to the exploration team. Radiation protection measures will have to be implemented. Other areas of concern with respect to radiation are transport of product and the disposal of waste (tailings etc).
Archaeological Baseline The site is generally poor in Holocene remains, these being limited to remains of a small stone tool production site, stone artifact debris and seed cache diggings. The historical Annaberg Tin Mine, adjacent to the current campsite in the east of the property qualifies for protection under the National Heritage Act.
17.9.3 Impacts Social Impacts Two communities are directly impacted by the Trekkopje Project: Spitzkoppe and Arandis, 40 and 30km from Trekkopje respectively. (see Figure 9-1). For Arandis, the potential benefits have been identified as job creation via secondary and service industries, revitalization of the economy of the town and growth in the property market. These developments would benefit the community and the local authority. There may be some growth in employment and support services in Spitzkoppe, but the benefits will be limited. Some fears around radiation were expressed, but the overriding concern of the communities is employment.
The most significant negative impacts are anticipated to be the growth of informal settlements and the inability of social services to meet the demands of a growing population. Again, the impacts would be considerably less in Spitzkoppe.
Social impacts arising from the change in land use at the project site are minimally relevant to Arandis. With regard to Spitzkoppe, the communal land on which the mine will be situated is unsuitable for agriculture of any sort. Future loss of land-use may occur with regard to seasonal grazing, but no trace of this reputed use has been recorded over the last few years. The Conservancy, in its current state, would not be impacted. It has not been developed, the game count is low and the main activity around this is not tourism but poaching. The possibility of future loss of land use for tourism must be considered an impact.
The cumulative impacts of closure are considered very significant. Mitigation and optimization recommendations have been made for all identified impacts.
Biophysical Impacts An important concern across all biophysical components is the impact of vehicular traffic.
All impacts on vegetation are expected to be negative. Within the mined area, there will be permanent loss of vegetation. This loss will also occur at temporary construction lay down sites and permanent structures. Losses in the non-mining areas are uncertain and are dependant on prevention measures. Damage to sensitive lichens will be permanent. Faunal impacts include habitat destruction, with unique habitat especially critical, and road kills. The endemic status of

UraMin, Inc. 17-24 Trekkopje Uranium Project Preliminary Assessment
SRK Consulting (US), Inc. April 2007 Trekkopje.NI 43-101 Preliminary Assessment.163701.MA.006.doc
many species of fauna makes them potentially very sensitive to mining impacts and, consequently, measures to protect specific habitats (such as rocky ridges) will have to be implemented.
Visual impacts are important as the Namib is a protected, scenic landscape of high eco-tourism value. The desert landscape affords long views, which are sensitive to impact by mining infrastructure.
Potential water impacts include the remobilization of salts and radioactive compounds in the regolith by seepage from heap leach facilities, pit, plant and other facilities. There is currently insufficient water in the coastal zone to supply the mine and so, as additional water supply will need to be created, no negative impact is predicted on regional water supply (this may be a positive impact if a desalination plant is constructed).
Atmospherically, the most important impact arises through airborne particulates. The current South African standard is 180µg/m³. The proposed new South African standard is 75µg/m³. The European Community and United Kingdom standard is 50µg/m³. Other potential impacts include gaseous emissions.
Predicated radiation impacts arise in three settings:
• Off-site transport;
• Occupational exposures (Long lived radioactive dust (LLRD), gamma rays and radon gas); and
• Public exposures.
The first two settings are well regulated and will be controlled through IAEA compliant codes of practice. In potential public exposures, the main contributor is the emission of radon gas and dispersion of LLRD from the atmospheric pathway sources, resulting in an airborne radionuclide concentration. These hazards will be controlled as part of an effective dust mitigation program.
Cumulative impacts may arise through synergistic interactions between the environmental and social effects of adjacent uranium producers. Uranium is currently produced by Rössing, Uranium, and Langer Heinrich Uranium in the Erongo Region of Namibia. Up to ten potential ore bodies for future mines have been identified. These potentially include radiation, water, and energy usage, visual impacts and mass job losses and social dislocation from the closure of several near-by operations.
17.9.4 Preliminary Environmental and Social Management Plan Socio-Economic A key to minimizing social impacts lies in the formation of partnerships with local authorities, communities and other mines. This includes buy-in to existing initiatives, such as the sustainability initiative of the Rössing Foundation.
Structures must be put in place to manage the impacts arising from possible informal settlers at Arandis. Skills transfer to, and partnership with, the //Gaingu Conservancy is critical. Support for the growth of SME’s and for training will optimize positive impacts from the projects.
Potential negative social impacts during the construction phase can be limited by effective control of construction camp and workers. Long-term benefits can be derived by strengthening

UraMin, Inc. 17-25 Trekkopje Uranium Project Preliminary Assessment
SRK Consulting (US), Inc. April 2007 Trekkopje.NI 43-101 Preliminary Assessment.163701.MA.006.doc
social networks and development agencies in Arandis and through mutually agreed compensation measures to Spitzkoppe for future loss of access to land.
Environmental Strict control of vehicular traffic is essential. Clearly demarcated roads and turning points should be used during all phases of the operation and the creation of new, parallel tracks next to the main existing road, and additional access tracks, should be stopped immediately. Grader operators must re-use existing scrapes and borrow-pits and not create new ones ad lib. Track discipline should be enforced and speed bumps should be created. Night driving must be avoided.
Loss of important habitat can be limited by demarcating areas to be set aside and/or left pristine. The National Botanical Research Institute (NBRI) should be called on to undertake rescue missions of valuable individual plants. Rehabilitation must be conducted on an ongoing basis. No collection of firewood both on and outside the licensed area should be permitted and areas with high species representation are to be set aside as “nursery” zones. Topsoil must be stockpiled wherever possible and pre-existing disturbed areas will be used for camps or construction lay down were possible. Topsoil conservation is of particular concern in the Trekkopje area as this material contains cyanbacteria and possibly lichens. It is critical to understand the dynamics at this micro level to stabilize the surface of mined areas. When mining starts topsoil, with pebbles and rocks, must be and put aside. This is the best soil to recreate the original surface as it contains spores and seeds. Research is needed to establish how long spores will last if stored in a heap.
The mining area must be fenced and penalties for environmental infringements should be implemented. This will ensure that the main contractors are accountable for environmental management. Endemic species need to be relocated from area to be mined and unique habitats and features must be removed/relocated out of the mining path or included in the mine offices garden layout.
Archaeological The base camp must be moved away from the Annaberg Mine. The new site should large enough for all construction workers in one area, on coarse substrate where there is no need for new access road. This should be enclosed with chain-link fence.
The old mine site should be access-restricted with warning signs and bollards. The Namibian Monuments Commission must be involved in future preservation of the site.
17.10 Preliminary Assessment An indicative technical-economic analysis of the Trekkopje Project has been completed and is presented in this section. The economic model (Model), shown in Appendix B, is pre-tax and assumes 100% equity to depict the technical merits of the project. This Preliminary Assessment includes Inferred resources that have not been sufficiently drilled to have economic considerations applied to them. Until the additional drilling in progress is completed, and a final resource estimate is done, there is no certainty that Inferred resources will be converted to Measured and Indicated resources; therefore, there can be no certainty that this Preliminary Assessment will be realized.
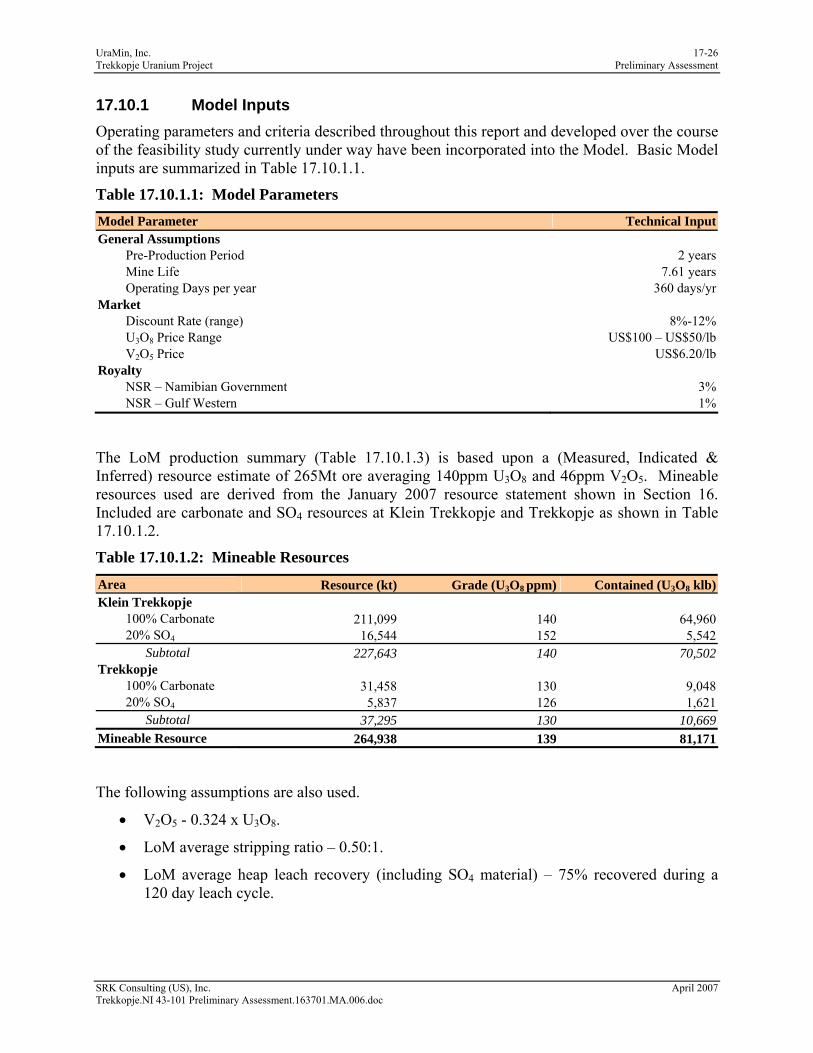
UraMin, Inc. 17-26 Trekkopje Uranium Project Preliminary Assessment
SRK Consulting (US), Inc. April 2007 Trekkopje.NI 43-101 Preliminary Assessment.163701.MA.006.doc
17.10.1 Model Inputs Operating parameters and criteria described throughout this report and developed over the course of the feasibility study currently under way have been incorporated into the Model. Basic Model inputs are summarized in Table 17.10.1.1.
Table 17.10.1.1: Model Parameters Model Parameter Technical InputGeneral Assumptions Pre-Production Period 2 years Mine Life 7.61 years Operating Days per year 360 days/yrMarket Discount Rate (range) 8%-12% U3O8 Price Range US$100 – US$50/lb V2O5 Price US$6.20/lbRoyalty NSR – Namibian Government 3% NSR – Gulf Western 1%
The LoM production summary (Table 17.10.1.3) is based upon a (Measured, Indicated & Inferred) resource estimate of 265Mt ore averaging 140ppm U3O8 and 46ppm V2O5. Mineable resources used are derived from the January 2007 resource statement shown in Section 16. Included are carbonate and SO4 resources at Klein Trekkopje and Trekkopje as shown in Table 17.10.1.2.
Table 17.10.1.2: Mineable Resources
Area Resource (kt) Grade (U3O8 ppm) Contained (U3O8 klb)Klein Trekkopje 100% Carbonate 211,099 140 64,960 20% SO4 16,544 152 5,542 Subtotal 227,643 140 70,502Trekkopje 100% Carbonate 31,458 130 9,048 20% SO4 5,837 126 1,621 Subtotal 37,295 130 10,669Mineable Resource 264,938 139 81,171
The following assumptions are also used.
• V2O5 - 0.324 x U3O8.
• LoM average stripping ratio – 0.50:1.
• LoM average heap leach recovery (including SO4 material) – 75% recovered during a 120 day leach cycle.

UraMin, Inc. 17-27 Trekkopje Uranium Project Preliminary Assessment
SRK Consulting (US), Inc. April 2007 Trekkopje.NI 43-101 Preliminary Assessment.163701.MA.006.doc
Table 17.10.1.3: LoM Production Summary Model Parameter TotalResource Resource (Mt) 264.9Mt Waste (Mt) 133.0Mt U3O8 Grade 140ppm V2O5 Grade 46ppm Contained U3O8 81.2Mlb Contained V2O5 26.3MlbProduction Mine Production Rate 100,000tpd Heap leach Recovery U3O8 75% Heap Leach Recovery V2O5 75% U3O8 Produced 60.9Mlb V2O5 Produced 19.7Mlb
17.10.2 Operating Costs LoM Operating costs are summarized in Table 17.10.2.1.
Table 17.10.2.1 LoM Operating Cost Summary (US$000) Description TotalMining $422,975Process $685,924G&A $113,242
Total $1,222,141US$/t-ore $4.61
US$/lb- U3O8 $20.08
Mine operating cost assumptions are shown in Table 17.10.2.2. LoM mining costs are estimated to be US$423,000 (US$1.60/t-ore, US$1.06/t-material).
Table 17.10.2.2: LoM Mine Operating Costs
Description Unit
(US$/t-material)Total
(US$000)Drilling $0.098 $38,995Blasting $0.190 $75,062Loading $0.145 $57,697Hauling $0.244 $97,089Other Mine Equipment $0.186 $74,011Support Equipment $0.075 $29,843Progressive Rehabilitation $0.020 $7,958Miscellaneous Operating $0.005 $1,990Mine Engineering $0.037 $14,723Mine Administration $0.042 $16,712Freight $0.021 $8,356
Total $1.063 $422,975US$/lb- U3O8 $6.95

UraMin, Inc. 17-28 Trekkopje Uranium Project Preliminary Assessment
SRK Consulting (US), Inc. April 2007 Trekkopje.NI 43-101 Preliminary Assessment.163701.MA.006.doc
Process operating cost assumptions are shown in Table 17.10.2.3. LoM processing costs are estimated to be US$686,000 (US$2.59/t-ore).
Table 17.10.2.3: LoM Process Operating Costs
Description Unit
(US$/t-ore)Total
(US$000)Na2CO3 $1.486 $393,698HCO3 $0.275 $72,858Water $0.214 $56,697Crusher Liners $0.060 $15,896Labor $0.052 $13,777Maintenance Labor $0.057 $15,101Power $0.026 $6,888Parts & Supplies $0.164 $43,450Ammonia $0.005 $1,325Resin $0.092 $24,374Caustic $0.002 $530Diesel Fuel $0.146 $38,681SX $0.010 $2,649
Total $2,589 $685,924US$/lb- U3O8 $11.27
G&A operating cost assumptions are shown in Table 17.10.2.4. LoM G&A costs are estimated to be US$113,000 (US$0.43/t-ore).
Table 17.10.2.4: LoM G&A Operating Costs
Description Unit
(US$/t-ore)Total
(US$000)Marketing & Logistics $0.35 $92,047Labor $0.02 $5,299O&M $0.04 $9,273Environmental $0.03 $6,623
Total $0.427 $113,242US$/lb- U3O8 $1.86
17.10.3 Capital Costs LoM capital costs are summarized in Table 17.10.3.1. Freight and import duties are included in the unit cost. VAT is excluded in all capital cost projections. A 25% contingency factor is applied to all capital cost estimates.
Working capital is estimated based upon 7 days cash, 30 days receivables and 60 days payables.

UraMin, Inc. 17-29 Trekkopje Uranium Project Preliminary Assessment
SRK Consulting (US), Inc. April 2007 Trekkopje.NI 43-101 Preliminary Assessment.163701.MA.006.doc
Table 17.10.3.1: LoM Capital Cost Summary (US$000) Description TotalMining $121,273Process $225,226Infrastructure $186,854Owner Costs $69,603
Total $602,956
Mine capital costs estimated to be US$121.3million over the LoM are shown in Table 17.10.3.2. Initial mining costs are estimated to be US$118.6million and sustaining costs are estimated to be US$2.6million.
Table 17.10.3.2: Mine Capital Costs (US$000) Description Initial Cost Sustaining LoM TotalDrilling $9,108 $0 $9,108Blasting $646 $175 $821Loading $30,897 $0 $30,897Hauling $28,600 $0 $28,600Other Mine Operations $22,409 $319 $22,728Support $3,242 $1,622 $4,864
Subtotal $94,902 $2,116 $97,018Contingency (@25%) $23,726 $529 $24,255
Total $118,628 $2,645 $121,273
Process capital costs estimated to be US$225.2million over the LoM are shown in Table 17.10.3.3. Initial process costs are estimated to be US$177.7million and sustaining costs are estimated to be US$38million.
Table 17.10.3.3: Process Capital Costs (US$000) Description Initial Cost Sustaining LoM TotalStacking Systems $17,000 $0 $17,000Credit from Heap Leach Test Pad $0 $0 $0Overland Conveyor $9,240 $0 $9,240Leach Pads & Ponds $41,441 $0 $41,441RoM Tips $34,500 $0 $34,500Stockpile & Reclaim $0 $0 $0Process Plant $40,000 $0 $40,000Sustaining Allocation $0 $38,000 $38,000
Subtotal $142,181 $38,000 $180,181Contingency (@25%) $35,545 $9,500 $45,045
Total $177,726 $47,500 $225,226
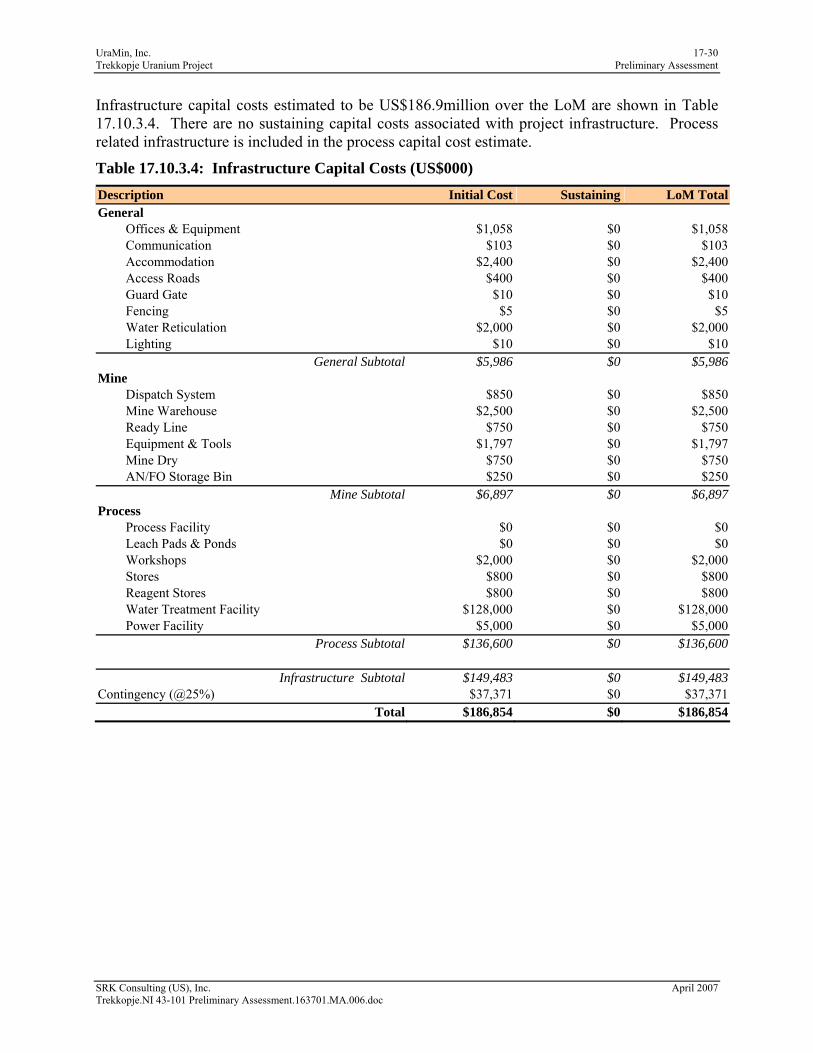
UraMin, Inc. 17-30 Trekkopje Uranium Project Preliminary Assessment
SRK Consulting (US), Inc. April 2007 Trekkopje.NI 43-101 Preliminary Assessment.163701.MA.006.doc
Infrastructure capital costs estimated to be US$186.9million over the LoM are shown in Table 17.10.3.4. There are no sustaining capital costs associated with project infrastructure. Process related infrastructure is included in the process capital cost estimate.
Table 17.10.3.4: Infrastructure Capital Costs (US$000) Description Initial Cost Sustaining LoM TotalGeneral Offices & Equipment $1,058 $0 $1,058 Communication $103 $0 $103 Accommodation $2,400 $0 $2,400 Access Roads $400 $0 $400 Guard Gate $10 $0 $10 Fencing $5 $0 $5 Water Reticulation $2,000 $0 $2,000 Lighting $10 $0 $10
General Subtotal $5,986 $0 $5,986Mine Dispatch System $850 $0 $850 Mine Warehouse $2,500 $0 $2,500 Ready Line $750 $0 $750 Equipment & Tools $1,797 $0 $1,797 Mine Dry $750 $0 $750 AN/FO Storage Bin $250 $0 $250
Mine Subtotal $6,897 $0 $6,897Process Process Facility $0 $0 $0 Leach Pads & Ponds $0 $0 $0 Workshops $2,000 $0 $2,000 Stores $800 $0 $800 Reagent Stores $800 $0 $800 Water Treatment Facility $128,000 $0 $128,000 Power Facility $5,000 $0 $5,000
Process Subtotal $136,600 $0 $136,600
Infrastructure Subtotal $149,483 $0 $149,483Contingency (@25%) $37,371 $0 $37,371
Total $186,854 $0 $186,854

UraMin, Inc. 17-31 Trekkopje Uranium Project Preliminary Assessment
SRK Consulting (US), Inc. April 2007 Trekkopje.NI 43-101 Preliminary Assessment.163701.MA.006.doc
Owner capital costs estimated to be US$69.6million over the LoM are shown in Table 17.10.3.5. There are no sustaining capital costs associated with owner cost capital. EPCM is estimated to be 12.5% of capital cost. Initial spares are estimated to be 5% of related capital cost.
Table 17.10.3.5: Owner Capital Costs (US$000) Description Initial Cost Sustaining LoM TotalEPCM $12,773 $0 $12,773Contractor Fees $6,000 $0 $6,000EIA & Permitting $700 $0 $700Training $3,500 $0 $3,500Security $250 $0 $250Community Relations $150 $0 $150Miscellaneous Permits & Fees $150 $0 $150Corporate Services $3,000 $0 $3,000Initial Spares $11,660 $0 $11,660First Fills $2,500 $0 $2,500Mine Closure & Reclamation $15,000 $0 $15,000
Owner Subtotal $55,683 $0 $55,683Contingency (@25%) $13,921 $0 $13,921
Total $69,603 $0 $69,603
17.10.4 Indicative Technical-Economic Results Model results developed in Appendix B are summarized in Table 17.10.4.1. Based upon current assumptions presented in this section, pre-tax project NPV10% is US$1.0billion with an IRR of 67%.
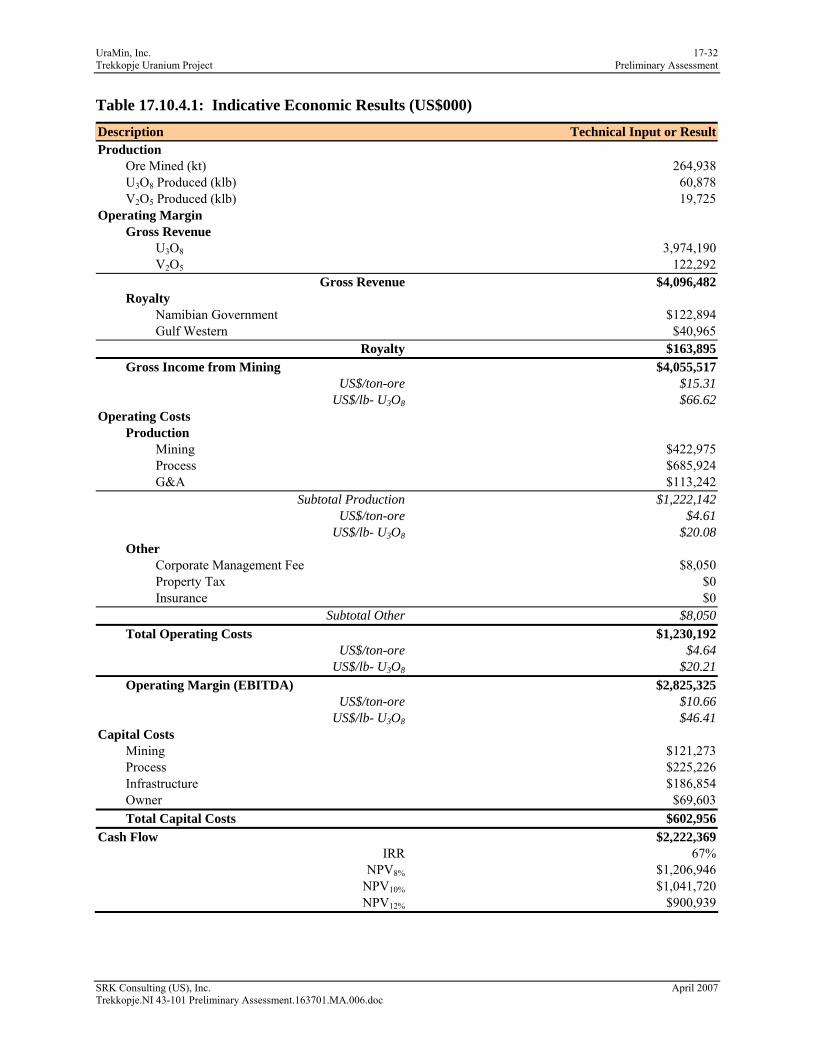
UraMin, Inc. 17-32 Trekkopje Uranium Project Preliminary Assessment
SRK Consulting (US), Inc. April 2007 Trekkopje.NI 43-101 Preliminary Assessment.163701.MA.006.doc
Table 17.10.4.1: Indicative Economic Results (US$000) Description Technical Input or ResultProduction Ore Mined (kt) 264,938 U3O8 Produced (klb) 60,878 V2O5 Produced (klb) 19,725 Operating Margin Gross Revenue U3O8 3,974,190 V2O5 122,292
Gross Revenue $4,096,482 Royalty Namibian Government $122,894 Gulf Western $40,965
Royalty $163,895 Gross Income from Mining $4,055,517
US$/ton-ore $15.31US$/lb- U3O8 $66.62
Operating Costs Production Mining $422,975 Process $685,924 G&A $113,242
Subtotal Production $1,222,142US$/ton-ore $4.61
US$/lb- U3O8 $20.08 Other Corporate Management Fee $8,050 Property Tax $0 Insurance $0
Subtotal Other $8,050 Total Operating Costs $1,230,192
US$/ton-ore $4.64US$/lb- U3O8 $20.21
Operating Margin (EBITDA) $2,825,325US$/ton-ore $10.66
US$/lb- U3O8 $46.41Capital Costs Mining $121,273 Process $225,226 Infrastructure $186,854 Owner $69,603 Total Capital Costs $602,956Cash Flow $2,222,369
IRR 67%NPV8% $1,206,946
NPV10% $1,041,720NPV12% $900,939

UraMin, Inc. 17-33 Trekkopje Uranium Project Preliminary Assessment
SRK Consulting (US), Inc. April 2007 Trekkopje.NI 43-101 Preliminary Assessment.163701.MA.006.doc
Figure 17-1: Conceptual Layout of Pits, Heaps and Dumps
Future pit
Pit 1
Heap Pad 2 (Pit 2 Ore)
Pit 2
Heap Pad 3 (Pit 3 Ore)
Pit 3
Heap Pad 4 (Pit 4 Ore)
Heap 1
(out of pit)
Heap
expanded as required
Waste dump
Waste dump
expanded
Direction of Mining
secondary crushers
movable primary crusher
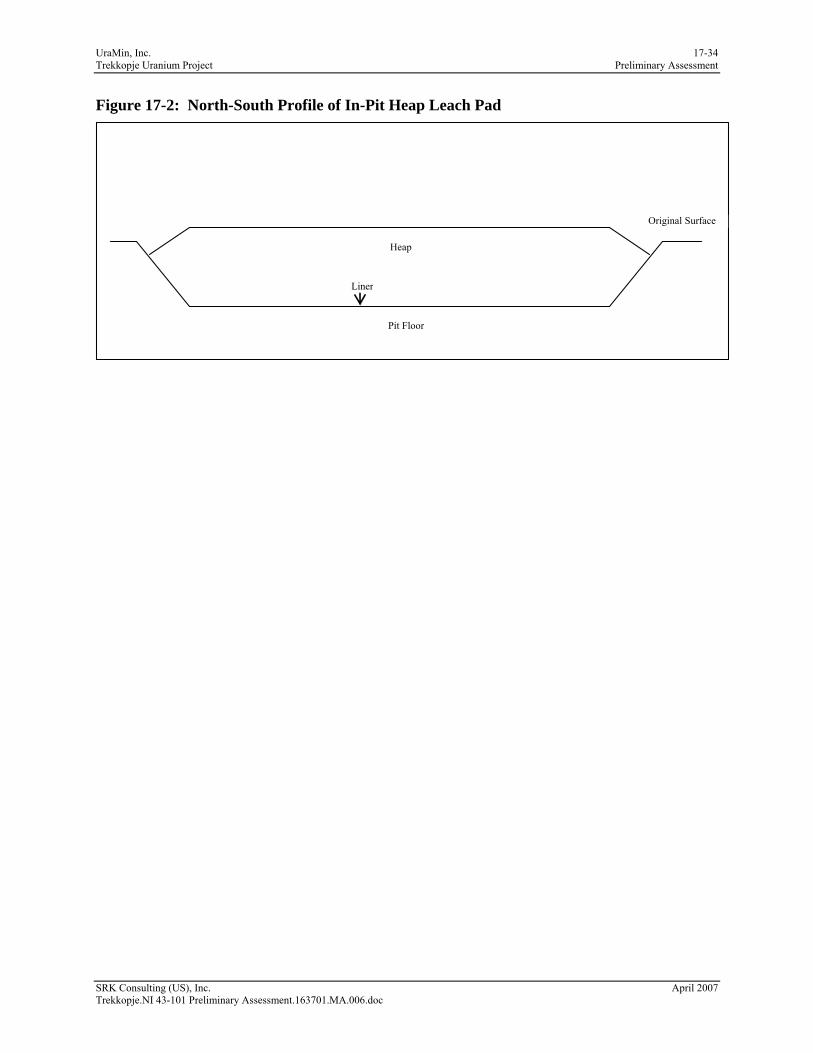
UraMin, Inc. 17-34 Trekkopje Uranium Project Preliminary Assessment
SRK Consulting (US), Inc. April 2007 Trekkopje.NI 43-101 Preliminary Assessment.163701.MA.006.doc
Figure 17-2: North-South Profile of In-Pit Heap Leach Pad
Heap
Pit Floor
Original Surface
Liner
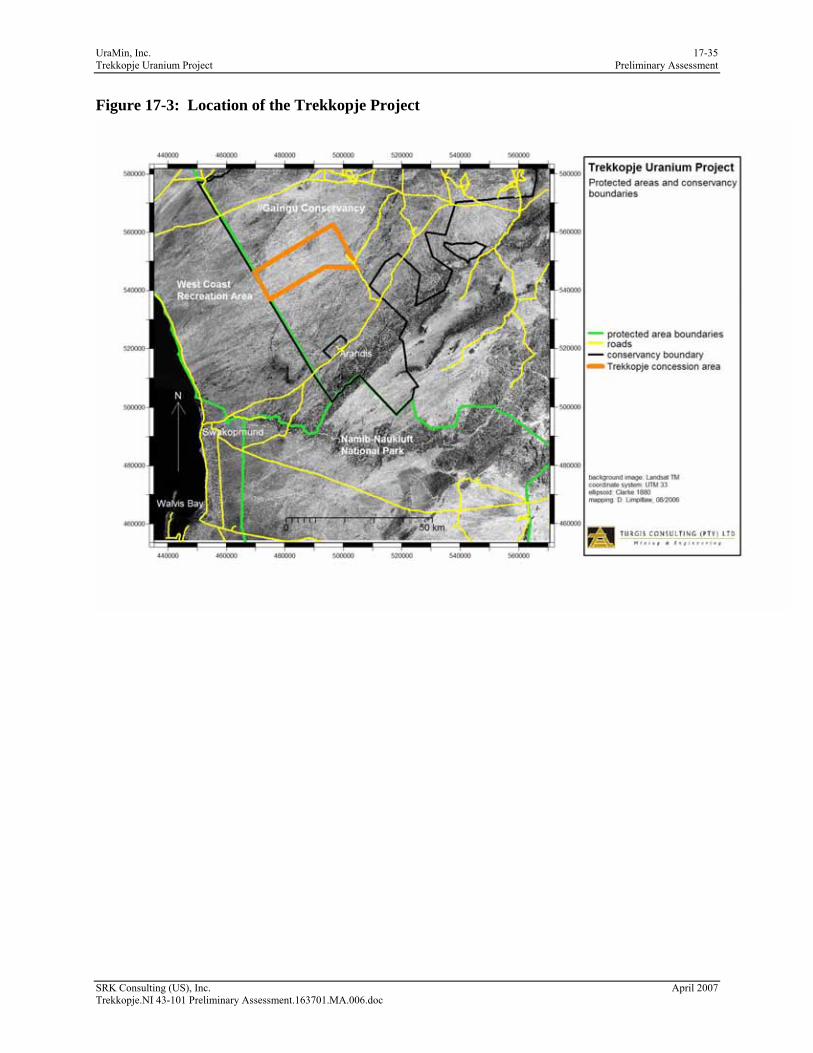
UraMin, Inc. 17-35 Trekkopje Uranium Project Preliminary Assessment
SRK Consulting (US), Inc. April 2007 Trekkopje.NI 43-101 Preliminary Assessment.163701.MA.006.doc
Figure 17-3: Location of the Trekkopje Project

UraMin, Inc. 17-36 Trekkopje Uranium Project Preliminary Assessment
SRK Consulting (US), Inc. April 2007 Trekkopje.NI 43-101 Preliminary Assessment.163701.MA.006.doc
Figure 17-4: Trekkopje EIA Process
Note: (orange blocks indicate completed phases)

UraMin, Inc. 18-1 Trekkopje Uranium Project Preliminary Assessment
SRK Consulting (US), Inc. April 2007 Trekkopje.NI 43-101 Preliminary Assessment.163701.MA.006.doc
18 Interpretation and Conclusions (Item 21) The Trekkopje Project represents, in two deposits, a world-class accumulation of calcrete hosted uranium-vanadium mineralization that merits the feasibility level studies currently being conducted. Resources have been established that confirm and enhance historical estimates. Initial project resources have been established according to CIM categories of resource classification, and are NI 43-101 compliant.
Additional work is warranted to bring the resources to a refined level of resource classification for inclusion in the BFS. The Trekkopje Project, is moving to completion of a BFS with studies ongoing regarding mining, processing, infrastructure, environmental/permitting, and economic evaluation as outline in the interim BFS information presented in Section 17 of this report. As with any project of this stage of exploration/development has inherent risk and opportunity associated with it, some of which is defined below.
18.1 Opportunity 18.1.1 Resources Resource definition has the opportunity to improve with additional in-fill drilling to provide confidence in grade estimation and block modeling methodologies. Resource expansion is possible, but not here quantifiable as all exploration to date has been internal to previously defined mineralization, and exploration step-outs have not yet been undertaken by Uramin. As well, there is the exploration potential of covered mineralization in parallel paleo-channel that might be totally covered by alluvium.
18.1.2 Mining and Processing Studies in progress to define optimum mining and processing methods offer the opportunity to define economic quantities of uranium-vanadium mineralization at the Trekkopje Project; particularly if uranium commodity prices remain at the current levels.
18.2 Project Risks 18.2.1 Commodity Price Fluctuation Uranium commodity prices are at record highs and represent both an opportunity and a project risk. Uranium price is a significant risk factor for Trekkopje given the low grade of the mineralization. The in-progress BFS will address sensitivity of the project to commodity prices and other marketing issues.
18.2.2 Infrastructure Water is a precious commodity in Namibia, and sourcing and delivering water to the project for potential mineral processing is probably the most important infrastructure related cost. This is being addressed and will be better quantified as the feasibility studies move to completion.
18.2.3 Metallurgical Characteristics Metallurgical risk factors are cost related; as the historical and limited current metallurgical test work indicates that the carnotite mineralization is readily leachable with high percentage recoveries. The uncertainties are in the cost related to the processing options yet to be quantified. Metallurgical risks will be defined in the coming months as processing options and

UraMin, Inc. 18-2 Trekkopje Uranium Project Preliminary Assessment
SRK Consulting (US), Inc. April 2007 Trekkopje.NI 43-101 Preliminary Assessment.163701.MA.006.doc
leaching characteristics are further defined and potential processing costs can be established with substantial confidence– all part of the BFS.
18.2.4 Environmental/Socio-Economic Considerations Environmental issues are always a risk factor in project development. The risks can usually be mitigated by proactively defining the risks and engaging the local populous and government administrators and regulators, as UraMin is doing with a well advanced EIA and EMP, and active engagement with those likely to have interest or be affected by project development.

UraMin, Inc. 19-1 Trekkopje Uranium Project Preliminary Assessment
SRK Consulting (US), Inc. April 2007 Trekkopje.NI 43-101 Preliminary Assessment.163701.MA.006.doc
19 Recommendations (Item 22) There are several recommendations with respect to the ongoing BFS programs that need to be completed. The recommendations below are aspects of the BFS that are in-progress and are important to the completion of the BFS.
19.1 Drilling Completion of the drilling program for 5-spot in-fill drilling is nearly complete. This will provide confidence in the resource estimation parameters. Drilling on a 50m x 50m grid for an area approximately 200m x 400m in Klein Trekkopje is planned to assess an area for intended trial mining. It is recommended that this be completed and modeled to compare with current resource estimation parameters, and determine optimum definition drill spacing required in advance of proposed commercial mining operations. Modeling of sulfate and carbonate from the 5-spot drilling is recommended to a) better define the sulfate grades and b) to determine if carbonate content can be modeled to predict locations of highly carbonate cemented calcrete for potential impacts on mining, crushing, and processing.
19.2 Resource Estimation Update A final round of resource estimation is required to accurately define tonnage and grade of the sulfate-bearing material and to improve the confidence in the resource model. This work is intended after completion of the 5-spot drilling.
19.3 Metallurgical Testing Column testing in progress should be completed to define leach characteristics of the uraniferous calcrete. Additional metallurgical testing should examine leaching characteristics of the sulfate-bearing rocks in the resource. Mineralogical testing should be completed to assist in understanding the results of column leach testing results. All recommendations are in progress.
19.4 Mining Trial mining planned for approximately 1Mt of uranium bearing calcrete should be completed to a) determine optimal blasting patterns and fragmentation as it relates to mining and crushing, b) reconcile the resource model with close spaced blast hole drill data, and c) determine optimal grade control procedures to implement during commercial mining. This will be followed by mine design, reserve definition, a LoM mine plan, and capital and operating cost estimates.
19.5 Processing/ Process Flow Sheet/Process Design An initial 80,000t heap leach pad is planned to test uranium leach recovery. Completion of test heap leaching is recommended to demonstrate viability of heap leach processing and uranium recovery technology and determine water consumption requirements.
This is followed by a Phase II program of LoM pad design, design of the final process flow sheet, and process plant design, including capital and operating costs estimates. Process flowsheet development and the process plant design are a major component of the costs necessary work to complete the BFS.

UraMin, Inc. 19-2 Trekkopje Uranium Project Preliminary Assessment
SRK Consulting (US), Inc. April 2007 Trekkopje.NI 43-101 Preliminary Assessment.163701.MA.006.doc
19.6 Infrastructure Completion is recommended of water resource and sourcing studies to determine optimal requirement for a desalination water facility, piping and pumping requirements to the project site, electrical power and other site infrastructure including estimates of capital and operating cost requirements.
19.7 Environmental and Permitting Completion of the EIA and EMP are necessary requirements to move the project timing forward.
19.8 Economic Analysis and BFS Report Following completion of the above technical and engineering studies, and complete economic analysis and final BFS report will be completed in a Phase II program, pending positive results from the technical and engineering studies in progress.
19.9 Proposed Budget 19.9.1 Phase I Proposed Budget Phase I program to complete the above recommended studies is presented in Table 19.9.1.1.
Table 19.9.1.1: Phase I Estimated Costs Item Costs Drilling $100,000 Resource Estimation Update $50,000 Metallurgical Testing $100,000 Mining $20,000 Processing Flow sheet Design $100,000 Infrastructure $30,000 Environmental and Permitting $20,000 Total Phase I Costs $420,000
19.9.2 Phase II Proposed Budget A Phase II program would be completion of BFS engineering and design studies, particularly the process plant design and related facilities, and the BFS report, based upon the results, based on the results of Phase I. Phase II costs will be an additional US$400,000.
The total estimated costs of the Phase I and Phase II programs for the purpose of this report is US$820,000, and is included in the current and planned Feasibility Studies.
The estimated time frame to complete the Phase I work is two to three months, and Phase II work could take an additional three months, completion of the BFS anticipated by October, 2007.

UraMin, Inc. 20-1 Trekkopje Uranium Project Preliminary Assessment
SRK Consulting (US), Inc. April 2007 Trekkopje.NI 43-101 Preliminary Assessment.163701.MA.006.doc
20 References (Item 23) References Cited Ainslie, L.C., Andersen, N.B.J., and Hambleton-Jones, B.B., 1994, Evaluation of pit sampling at
Klein Trekkopje: confidential report prepared for Consolidated Namibia Resources by Earth & Environmental Technology, Atomic Energy Commission of South Africa Ltd, Annexure 5, EET Report, GEA – 1094.
Cadrim, 1984, Exploration Report – Klein Trekkopje 1979-1983: private report prepared for Atomic Energy Commission of South Africa, 15 p.
Cadrim, 1984, Exploration Report – Arandis, 1979-1983: private report prepared for Atomic Energy Commission of South Africa, 23 p.
Cadrim, 1984, Exploration Report – Trekkopje Farm 1979-1983: private report prepared for Atomic Energy Commission of South Africa, 6 p.
Campbell and others, 2006, probe calibration letter, January 2006
Hambleton-Jones, B.B., Levin, M., and Wagener, G.F., 1986, Uraniferous surficial deposits in southern Africa, in Anhaeusser, C.R., and Maske, S., editors, Mineral deposits of southern Africa, volume II: Geological Society of South Africa, p. 2269-2287.
Inter-Consult Namibia (Pty), Ltd, and Hamilton-Jones, B.B., 1999 Pre-feasibility study of the Trekkopje Uranium Deposits: unpublished report for Gulf Western Trading Namibia (Pty) Ltd, 34 p. , 26 p., 17 plates, 5 appendices.
Lorentz and Bone, 2006, Due diligence report on Gulf Western Trading Namibia (Pty) Limited: legal opinion, 28 February 2006.
Mann, A.W., and Deutscher, R.L., 1978a, Genesis principles for the precipitation of carnotite in calcrete drainages in Western Australia: Economic Geology, v. 73, p. 1724-1737.
Muller, M.A.N., 1984, Grasses of South West Africa/Namibia: Department of Nature Conservation, Directorate of Agriculture and Forestry, Windhoek. Quoted in http://www.fao.org/AG/AGP/AGPC/doc/Counprof/Namibia/namibia.htm#2.%20CLIMATE,%20LANDFORMS%20AND
SAMREC Code, 2000, South African Code for Reporting of Mineral Resources and Mineral Reserves (The SAMREC Code): SAIMM/GSSA Working Group Compilation, March 2000.
SRK Consulting (U.S.) Inc, November 28, 2006; Initial Resource Estimate for the Trekkopje Feasibility Study, Swakopmund and Karibib Districts, Erongo Region, Namibia, NI 43-101 Technical Report, filed on www.sedar.com .
Turgis Consulting (Pty) Ltd., 2005, An independent competent persons’ report on the African assets of UraMin Inc.: Turgis Consulting (Pty) Ltd. Report Number 29903-10, 9 December 2005.
Turgis Consulting (Pty) Ltd, 2005, Geology and mineral resources of the Trekkopje deposit: unpublished private draft report prepared for UraMin, Inc., Dec. 7, 2005, 14 p. 8 plates.

UraMin, Inc. 20-2 Trekkopje Uranium Project Preliminary Assessment
SRK Consulting (US), Inc. April 2007 Trekkopje.NI 43-101 Preliminary Assessment.163701.MA.006.doc
Turgis Consulting (Pty) Ltd., 2006, A technical and economic study of the Trekkopje Uranium Project: Turgis Consulting (Pty) Ltd. Report Number 29903-18, 10 March 2006.
UraMin Inc., 2006, AIM Admission document: submitted to London Stock Exchange Alternate Investors Market and including the Turgis Competent Person’s Report.
Viljoen, M.J., and Viljoen, R.P., 2005a, Modeling of the North Eastern Ryst Kuil Ore Body: unpublished report compiled for UraMin, September 2005.
Viljoen, M.J., and Viljoen, R.P., 2005b, An evaluation of the uranium resource on the Farm Trekkopje: unpublished report prepared for UraMin and Turgis Consulting (Pty) Ltd, November 2005, 28 p., 32 plates.
Viljoen, R.P., and Viljoen, M.J., 2005c, An evaluation of the uranium resource on the Farm Trekkopje – summary statement: unpublished report prepared for UraMin and Turgis Consulting (Pty) Ltd, November 25, 2005, 9 p., 6 plates.
Other Pertinent References on Trekkopje
ALS Chemex: www.alschemex.com
Ainslie, L.C., 1991, An investigation of the Trekkopje uranium deposit: unpublished report, Earth & Environmental Technology (EET) Report, GEA-979, Atomic Energy Corporation of S.A. Ltd.
Ainslie, L.C., and Heard, R.G., 1997a, Ore reserve estimation of the Trekkopje Uranium Deposit, Namibia: Atomic Energy Corporation of South Africa: unpublished report for Gulf Western Trading, Volume 1, EET Report GEA – 1255.
Ainslie, L.C., and Heard, R.G., 1997b, Uranium market survey 1997: EET Report, AEC of SA, GEA-1257.
Brynard and others, 1994, Karoo Uranium Project Report: unpublished report for Atomic Energy Corporation, Southern Sphere report, 127 p.
Central Intelligence Agency, 2005, World Factbook: Central Intelligence Agency, USA.
Chetty, D., Kruger, S.J., Gould, D.G., and Pircalaboiu, G., 1997, Uraniferous borehole samples from Trekkopje, Namibia: Mineralogical and Metallurgical Investigation, Mintek. SA. External Investigation No. 4189801C(17), 97 p. (also in 1999, Appendix II to InterConsult Namibia, 1999).
Chilcott, A.J., 1997, A pre-feasibility study for the extraction of uranium from the Klein Trekkopje and Trekkopje deposits: unpublished confidential report prepared for Atomic Energy Corporation of S.A. on behalf of Gulf Western Trading by Mintek, Communication C2496M, 50 p. + 3 appendices.
Chilcott, A.J., and Gould, D.G., 1999, Updated pre-feasibility study for the extraction of uranium from the Klein Trekkopje and Trekkopje deposits: Mintek, S.A., External Investigation No. 4189801C. (Appendix V to InterConsult Namibia 1998).
Cole, D.I., 1998, Uranium, in Wilson, M.G.C., and Anhaeusser, C.R., editors), The mineral resources of southern Africa: Handbook, Council for Geoscience, v. 16, p. 642-658.

UraMin, Inc. 20-3 Trekkopje Uranium Project Preliminary Assessment
SRK Consulting (US), Inc. April 2007 Trekkopje.NI 43-101 Preliminary Assessment.163701.MA.006.doc
DuPlessis, J., 1983, Geological, exploration progress and financial report, Prospecting Grant M46/3/725: unpublished report, Cadrim Namibia (Pty) Ltd, 7 p.
Hambleton-Jones, B.B., 1984, Surficial uranium deposits in Namibia, in Toens, P.D., editor, Surficial uranium deposits: Report of the working group on uranium geology, organized by the International Atomic Energy Agency, Vienna, p. 205-216.
Heard, R.G., Ainslie, L.C., and Hambleton-Jones, B.B., 1991, An investigation of the Trekkopje uranium deposit: prepared for Cadrim and Atomic Energy Commission of South Africa, GEA – 979, Section 4 of Lyle (1992).
Heath, D.C., 1973, Prospecting Grant M46/3/259 Karibib District, South West Africa, final report on the Exploration of the Arandis uranium: unpublished report, Rio Tinto Exploration (Pty) Ltd, 9 p.
Lancaster, J., Lancaster, N., and Seeley, M.K., 1984, Climate of the central Namib Desert: Madoqua, v. 14, no. 1, p. 5-61.
Lomberg, K., and Rupprecht, S., 2005a, Trekkopje Uranium Project, Namibia. Independent Technical Review: RSG Global, Job Number JURA02, 24 June 2005.
Lyle, S.D., 1992, The calcrete uranium deposits of the Namib desert, Namibia (South West Africa) with special emphasis on the Klein Trekkopje/Arandis uranium orebody: AEC of South Africa and Consolidated Resources Namibia for GC Gulf Western Trading and the Department of Minerals, Mines and Energy Affairs, volumes I, II, and III.
Robida, F., 1983, Deposits of Klein Trekkopje and Trekkopje Farm, general estimate of recoverable reserves: unpublished report by BRGM – Departement informatique miniere, for Dong – Trieu Mining Company, tables, figures and plans, February 1983, 33 p. + appendices 52 p.
Roesener, H., and Schreuder, C.P., 1992, Uranium, in Mineral Resources of Namibia, Nuclear and fossil fuels – uranium: Geological Survey of Namibia, Mineral Resource Series 52, p. 7.1-47 through p. 7.1-51.
RSG Global, 2005a, Independent Technical Review, Trekkopje uranium project Namibia; unpublished private report prepared for Uranco, Inc., June 24, 2005, 27 p.
RSG Global, 2005b, Independent Technical Review of Uranium properties in Africa: Prepared by RSG Global on behalf of UraMin Inc. Job Number JURA03, 14 November 2005.
Tarr, Meter, and Tarr, Jacquie, undated, Namibia Report.
Van der Merwe, Andre, 2005, Trekkopje uranium project Namibia, Independent technical review: unpublished report prepared by RSG Global on behalf of Uranco Inc., Job number JURA02, 24 June 2005, 27 p.
Ward, J.D., 1987, Modern analogues for Aeolian and fluvial deposits in the Cenozoic succession of the Central Namib desert: Geological Survey of Namibia, Field Excursion guide (28-31 May, 1987, 16 p.

UraMin, Inc. 20-4 Trekkopje Uranium Project Preliminary Assessment
SRK Consulting (US), Inc. April 2007 Trekkopje.NI 43-101 Preliminary Assessment.163701.MA.006.doc
Other Pertinent References on Trekkopje Airey, P.L., and Roman, D., 1981, Uranium series disequilibria in the sedimentary uranium
deposit at Yeelirrie, Western Australia: Journal of the Geological Society of Australia, v. 28, no. 3-4, p. 357-363.
Arakel, A.V., 1988, Carnotite mineralization in inland drainage areas of Australia, in Gabelman, J.W., editor, Unconventional uranium deposits: Ore Geology Reviews, v. 3, no. 1-3, p. 289-311.
Arakel, A.V., and McConchie, D., 1982, Classification and genesis of calcrete and gypsite lithofacies in paleodrainage systems of inland Australia and their relationship to carnotite mineralization: Journal of Sedimentary Petrology, v. 52, no. 4, p. 1149-1170.
Asher, B.S., Otton, J.K., 1992, Arid-land surficial uranium deposits; a review of examples and their modes of occurrence, in Dickinson, K.A., editor, Short papers of the U.S. Geological Survey uranium workshop, 1990: U.S. Geological Survey Circular C-1069, p. 23-25.
Berning, J., 1986, The Roessing uranium deposit, South West Africa/Nambia, in Anhaeusser, C.R., Maske, S., editors, Mineral deposits of southern Africa: Geological Society of South Africa, Johannesburg, S.A., p. 1819-1832.
Butt, C.R.M., Horowitz, R.C., and Mann, A.W., 1977, Uranium occurrences in calcrete and associated sediments in Western Australia: Rep. CSIRO, Western Australia, Perth, FP 16, 67 p.
Cameron, E., 1976, Uranium in a calcrete environment, Western Australia: paper presented to Australian/New Zealand Association Adv. Of Science, 47th Congress, Hobart, Australia.
Cameron, E., 1990, Yeelirrie uranium deposit, in Hughes, F.E., editor, Geology of the mineral deposits of Australia and Papua new Guinea; volume 2: Australasian Institute of Mining and Metallurgy, Monograph Series, v. 14, p. 1625-1629.
Cameron, E., Mazzucchelli, R.H., and Robbins, T.W., 1980, Yeelirrie calcrete uranium deposit, Murchison region, W.A., in Butt, C.R.M., Smith, R.E., editors, Conceptual models in exploration geochemistry; Australia: Journal of Geochemical Exploration, v. 12, no. 2-3, p. 350-353.
Carlisle, D., 1980, Possible variations on the calcrete-gypcrete uranium model: U.S. Department of Energy Open-file Report, GJBX-53(80), 38 p.
Carlisle, D., 1983, Concentration of uranium and vanadium in calcretes and gypcretes, in Wilson, R.C.L., editor, Residual deposits; surface related weathering processes and materials: Special Publication Geological Society of London, v. 11, p. 185-195.
Carlisle, D., 1984, Surficial uranium occurrences in relation to climate and physical setting, in Toens, P.D., editor, Surficial uranium deposits; report of the Working Group on uranium geology: International Atomic Energy Agency, Nuclear Dev. Corp. South Africa, Pretoria, South Africa, p. 25-35.
Carlisle, D., Merifield, P.M., Orme, A.R., Kohl, M.S., and Kolker, O, 1978, The distribution of calcretes and gypcretes in southwestern United States and their uranium favorability

UraMin, Inc. 20-5 Trekkopje Uranium Project Preliminary Assessment
SRK Consulting (US), Inc. April 2007 Trekkopje.NI 43-101 Preliminary Assessment.163701.MA.006.doc
based on a study of deposits in Western Australia and South West Africa (Namibia): U.S. Department of Energy, Open-file Report GJBX-29(78), 274 p.
Coakley, G.J., Ambrosio, S., Clarke, P., Ellis, M., and Shekarchi, E., 1983, Namibia, in Mineral Perspectives: U.S. Bureau of Mines, Branch of Africa and Middle East, 57 p.
Deutscher, R.L., Mann, A.W., and Butt, C.R.M., 1980, Model for calcrete uranium mineralization, in Butt, C.R.M., and Smith, R.E., editors, Conceptual models in exploration geochemistry; Australia: Journal of Geochemical Exploration, v. 12, no. 2-3, p. 158-161.
Gaskin, A.J., Butt, C.R.M., Deutscher, R.L., Horwitz, R.C., and Mann, A.W., 1981, Hydrology of uranium deposits in calcretes of Western Australia, in Halbouty, M.T., editor, Energy resources of the Pacific region: American Association of Petroleum Geologists, Studies in Geology, v. 12, p. 311-316.
Glassford, D.K., 1987, Cainozoic stratigraphy of the Yeelirrie area, northeastern Yilgarn Block, Western Australia: Journal of the Royal Society of Western Australia, v. 70, no. 1, p. 1-24.
Hambleton-Jones, B.B., 1976, The geology and geochemistry of some epigenetic uranium deposits near the Swakop River, South West Africa: unpublished D.Sci. thesis, Univ. Pretoria, 306 p.
Hartleb, J.W.O., 1988, The Langer Heinrich uranium deposit; Southwest Africa/Namibia, in Gabelman, J.W., editor, Unconventional uranium deposits: Ore Geology Reviews, v. 3, no. 1-3, p. 277-287.
Heine, K., and Geyh, M.A., 1984, Radiocarbon dating of speleo-thems from the Rossing Cave (Namib Desert), SW Africa, palaeoclimatic implications, in Vogel, J.C., Basson, N., Vogel, U., and Fuis, A., Late Cainozoic palaeoclimates of the Southern Hemisphere: Rotterdam, AA Balkema, p. 456-470.
Killick, A.M., 1986, A review of the economic geology of northern South West Africa/Nambia, in Anhaeusser, C.R., and Maske, S., editors, Mineral deposits of southern Africa: Geological Society of South Africa, Johannesburg, S.A., p. 1709-1717.
Langford, F.F., 1978, Mobility and concentration of uranium in arid surficial environments, in Kimberly, M., editor, Short course in uranium deposits; their mineralogy and origin: Mineralogical Association of Canada, Short Course Handbook, v. 3, p. 383-393.
Mann, A.W., 1974a, Calculated solubilities of some uranium and vanadium compounds in pure and carbonated waters as a function of pH: CSIRO Div. Mineralogy Report FP 6.
Mann, A.W., 1974b, Chemical ore genesis models for the precipitation of carnotite in calcrete: Rep. CSIRO, Western Australia, Perth, FP 7, 18 p.
Mann, A.W., 1978, Uranium, sedimentary deposit mining, in Rummery, R.A., and Howes, K.M.W., editors, Management of lands affected by mining: CSIRO, Div. Land Resour. Manage., Australia, p. 98-105.
Mann, A.W., and Deutscher, R.L., 1978b, Hydrogeochemistry of a calcrete-containing aquifer near Lake Way, Western Australia: Journal of Hydrology, v. 38, p. 357-377.

UraMin, Inc. 20-6 Trekkopje Uranium Project Preliminary Assessment
SRK Consulting (US), Inc. April 2007 Trekkopje.NI 43-101 Preliminary Assessment.163701.MA.006.doc
Maynard, J.B., 1991, Uranium; syngenetic to diagenetic deposits in foreland basins, in Force, E.R., Eidel, J.J., and Maynard, J.B., editors, Sedimentary and diagenetic mineral deposits; a basin analysis approach to exploration: U.S. Geological Survey, Reviews in Economic Geology, v. 5, p. 187-197.
Netterberg, F., 1969, The geology and engineering properties of South African calcretes: unpublished Ph.D. thesis, Univ. Witwatersrand, Johannesburg, 1970 p.
Premoli, C., 1976, Formation of, and prospecting for, uraniferous calcretes: Aust. Min., v. 68, no. 4, p. 13-16.
Toens, P.D., and Hambleton-Jones, B.B., 1980, Uraniferous surficial deposits: Atomic Energy Board, South Africa, Pelindaba, PER-57, 16 p.
Von Backstroem, J.W., and Jacob, R.E., 1979, Uranium in South Africa and South West Africa (Namibia), in Bowie, S.H.U., Fyfe, W.S., Ostle, D., Plant, J., and Simpson, P.R., editors, Theoretical and practical aspects of uranium geology: The Royal Society of London, p. 53-65; also Philosophical Transactions of the Royal Society of London, Series A, Mathematical and Physical Sciences, v. 291, no. 1381, p. 307-319.
Wilpolt, R.H., and Simov, S.D., 1977, Uranium deposits in Africa: Uranium deposits in Africa; geology and exploration; proceedings of a regional advisory group meeting: International Atomic Energy Agency, Panel Proceedings Series, STI/PUB/509, p. 3-20.

UraMin, Inc. 21-1 Trekkopje Uranium Project Preliminary Assessment
SRK Consulting (US), Inc. April 2007 Trekkopje.NI 43-101 Preliminary Assessment.163701.MA.006.doc
21 Glossary 21.1 Mineral Resources & Reserves Mineral Resources The mineral resources and mineral reserves have been classified according to the “CIM Standards on Mineral Resources and Reserves: Definitions and Guidelines” (August 2000). Accordingly, the Resources have been classified as Measured, Indicated or Inferred, the Reserves have been classified as Proven, and Probable based on the Measured and Indicated Resources as defined below.
A Mineral Resource is a concentration or occurrence of natural, solid, inorganic or fossilized organic material in or on the Earth’s crust in such form and quantity and of such a grade or quality that it has reasonable prospects for economic extraction. The location, quantity, grade, geological characteristics and continuity of a Mineral Resource are known, estimated or interpreted from specific geological evidence and knowledge.
An ‘Inferred Mineral Resource’ is that part of a Mineral Resource for which quantity and grade or quality can be estimated on the basis of geological evidence and limited sampling and reasonably assumed, but not verified, geological and grade continuity. The estimate is based on limited information and sampling gathered through appropriate techniques from locations such as outcrops, trenches, pits, workings and drillholes.
An ‘Indicated Mineral Resource’ is that part of a Mineral Resource for which quantity, grade or quality, densities, shape and physical characteristics can be estimated with a level of confidence sufficient to allow the appropriate application of technical and economic parameters, to support mine planning and evaluation of the economic viability of the deposit. The estimate is based on detailed and reliable exploration and testing information gathered through appropriate techniques from locations such as outcrops, trenches, pits, workings and drillholes that are spaced closely enough for geological and grade continuity to be reasonably assumed.
A ‘Measured Mineral Resource’ is that part of a Mineral Resource for which quantity, grade or quality, densities, shape, physical characteristics are so well established that they can be estimated with confidence sufficient to allow the appropriate application of technical and economic parameters, to support production planning and evaluation of the economic viability of the deposit. The estimate is based on detailed and reliable exploration, sampling and testing information gathered through appropriate techniques from locations such as outcrops, trenches, pits, workings and drillholes that are spaced closely enough to confirm both geological and grade continuity.
Mineral Reserves A Mineral Reserve is the economically mineable part of a Measured or Indicated Mineral Resource demonstrated by at least a Preliminary Feasibility Study. This Study must include adequate information on mining, processing, metallurgical, economic and other relevant factors that demonstrate, at the time of reporting, that economic extraction can be justified. A Mineral Reserve includes diluting materials and allowances for losses that may occur when the material is mined.
UraMin, Inc. 21-2 Trekkopje Uranium Project Preliminary Assessment
SRK Consulting (US), Inc. April 2007 Trekkopje.NI 43-101 Preliminary Assessment.163701.MA.006.doc
A ‘Probable Mineral Reserve’ is the economically mineable part of an Indicated, and in some circumstances a Measured Mineral Resource demonstrated by at least a Preliminary Feasibility Study. This Study must include adequate information on mining, processing, metallurgical, economic, and other relevant factors that demonstrate, at the time of reporting, that economic extraction can be justified.
A ‘Proven Mineral Reserve’ is the economically mineable part of a Measured Mineral Resource demonstrated by at least a Preliminary Feasibility Study. This Study must include adequate information on mining, processing, metallurgical, economic, and other relevant factors that demonstrate, at the time of reporting, that economic extraction is justified.
21.2 Glossary Assay: The chemical analysis of mineral samples to determine the metal
content.
Capital Expenditure: All other expenditures not classified as operating costs.
Composite: Combining more than one sample result to give an average result over a larger distance.
Concentrate: A metal-rich product resulting from a mineral enrichment process such as gravity concentration or flotation, in which most of the desired mineral has been separated from the waste material in the ore.
Crushing: Initial process of reducing ore particle size to render it more amenable for further processing.
Cutoff Grade (CoG): The grade of mineralized rock, which determines as to whether or not it is economic to recover its gold content by further concentration.
Dilution: Waste, which is unavoidably mined with ore.
Dip: Angle of inclination of a geological feature/rock from the horizontal.
Fault: The surface of a fracture along which movement has occurred.
Footwall: The underlying side of an orebody or stope.
Gangue: Non-valuable components of the ore.
Grade: The measure of concentration of gold within mineralized rock.
Hangingwall: The overlying side of an orebody or slope.
Haulage: A horizontal underground excavation which is used to transport mined ore.
Hydrocyclone: A process whereby material is graded according to size by exploiting centrifugal forces of particulate materials.
Igneous: Primary crystalline rock formed by the solidification of magma.
Kriging: An interpolation method of assigning values from samples to blocks that minimizes the estimation error.
Level: Horizontal tunnel the primary purpose is the transportation of personnel and materials.

UraMin, Inc. 21-3 Trekkopje Uranium Project Preliminary Assessment
SRK Consulting (US), Inc. April 2007 Trekkopje.NI 43-101 Preliminary Assessment.163701.MA.006.doc
Lithological: Geological description pertaining to different rock types.
LoM Plans: Life-of-Mine plans.
LRP: Long Range Plan.
Material Properties: Mine properties.
Milling: A general term used to describe the process in which the ore is crushed and ground and subjected to physical or chemical treatment to extract the valuable metals to a concentrate or finished product.
Mineral/Mining Lease: A lease area for which mineral rights are held.
Mining Assets: The Material Properties and Significant Exploration Properties.
Ongoing Capital: Capital estimates of a routine nature, which is necessary for sustaining operations.
RoM: Run-of-Mine.
Sedimentary: Pertaining to rocks formed by the accumulation of sediments, formed by the erosion of other rocks.
Stratigraphy: The study of stratified rocks in terms of time and space.
Strike: Direction of line formed by the intersection of strata surfaces with the horizontal plane, always perpendicular to the dip direction.
Sulfide: A sulfur bearing mineral.
Tailings: Finely ground waste rock from which valuable minerals or metals have been extracted.
Thickening: The process of concentrating solid particles in suspension.
Total Expenditure: All expenditures including those of an operating and capital nature.
Variogram: A statistical representation of the characteristics (usually grade), of data variance with distance and direction.

UraMin, Inc. 21-4 Trekkopje Uranium Project Preliminary Assessment
SRK Consulting (US), Inc. April 2007 Trekkopje.NI 43-101 Preliminary Assessment.163701.MA.006.doc
Abbreviations The metric system has been used throughout this report unless otherwise stated. All currency is in U.S. dollars. Market prices are reported in US$ per pound of U3O8. Tonnes are metric of 1,000kg, or 2,204.6lbs. The following abbreviations are used in this report.
Abbreviation Unit or Term A ampere
AA atomic absorption
A/m2 amperes per square meter
ANFO ammonium nitrate fuel oil
°C degrees Centigrade
CoG Cut-off-Grade
cm centimeter
cm2 square centimeter
cm3 cubic centimeter
cfm cubic feet per minute
ConfC confidence code
CRec core recovery
CSS closed-side setting
CTW calculated true width
° degree (degrees)
dia. diameter
EIA Environmental Impact Assessment
EMP Environmental Management Plan
FA fire assay
ft foot (feet)
ft2 square foot (feet)
ft3 cubic foot (feet)
g gram
gal gallon
g-mol gram-mole
gpm gallons per minute
gpt grams per tonne
ha hectares

UraMin, Inc. 21-5 Trekkopje Uranium Project Preliminary Assessment
SRK Consulting (US), Inc. April 2007 Trekkopje.NI 43-101 Preliminary Assessment.163701.MA.006.doc
HDPE Height Density Polyethylene
hp horsepower
HTW horizontal true width
ICP induced couple plasma
ID2 inverse-distance squared
ID3 inverse-distance cubed
IFC International Finance Corporation
ILS Intermediate Leach Solution
kA kiloamperes
kg kilograms
km kilometer
km2 square kilometer
kt thousand tonnes
ktpd thousand tonnes per day
ktpy thousand tonnes per year
kV kilovolt
kW kilowatt
kWh kilowatt-hour
kWh/t kilowatt-hour per metric tonne
l liter
lps liters per second
lb pound
LHD Long-Haul Dump truck
LLDDP Linear Low Density Polyethylene Plastic
LOI Loss On Ignition
LoM Life-of-Mine
lps liters per second
m meter
m2 square meter
m3 cubic meter
masl meters above sea level
mg/l milligrams/liter
mm millimeter

UraMin, Inc. 21-6 Trekkopje Uranium Project Preliminary Assessment
SRK Consulting (US), Inc. April 2007 Trekkopje.NI 43-101 Preliminary Assessment.163701.MA.006.doc
mm2 square millimeter
mm3 cubic millimeter
Mt million tonnes
MTW measured true width
MW million watts
m.y. million years
NGO non-governmental organization
NI 43-101 Canadian National Instrument 43-101
OSC Ontario Securities Commission
% percent
PLC Programmable Logic Controller
PLS Pregnant Leach Solution
PMF probable maximum flood
ppb parts per billion
ppm parts per million
QA/QC Quality Assurance/Quality Control
RC rotary circulation drilling
RoM Run-of-Mine
RQD Rock Quality Description
s second
SG specific gravity
SPT standard penetration testing
st short ton (2,000 pounds)
t tonne (metric ton) (2,204.6 pounds)
tph tonnes per hour
tpd tonnes per day
tpy tonnes per year
TSF tailings storage facility
TSP total suspended particulates
µ micron or microns
V volts
VFD variable frequency drive
W watt

UraMin, Inc. 21-7 Trekkopje Uranium Project Preliminary Assessment
SRK Consulting (US), Inc. April 2007 Trekkopje.NI 43-101 Preliminary Assessment.163701.MA.006.doc
XRD x-ray diffraction
XRF x-ray fluoresence
yr year
Units of Measure The following list of conversions is provided for the convenience of readers that are more familiar with the Imperial system.
Linear Measure
1 centimeter (cm)= 0.394 inches
1 meter (m) = 3.2808 feet
1 kilometer (km) = 0.6214 miles
Area Measure
1 hectare = 100 m by 100 m = 2.47 acres
1 square kilometer = 247.1 acres = 0.3861 square miles
Weight
1 metric ton (tonne) = 1000 kg = 2204.6 pounds = 1.1023 short tons
1 kilogram (kg) = 35.274 oz = 2.205 pounds = 32.151 troy ounces
Analytical Values
gram/tonne (g/t) = 1.0 ppm
100 ppm U3O8 = 84.8 ppm U
100 ppm V2O5 = 56.0 ppm V
10.0% SO4 = 3.3 % S
10.0% CaCO3 = 4.0 % Ca

UraMin, Inc. 21-8 Trekkopje Uranium Project Preliminary Assessment
SRK Consulting (US), Inc. April 2007 Trekkopje.NI 43-101 Preliminary Assessment.163701.MA.006.doc
Acronyms Frequently used acronyms are listed below. Terms Definitions AAS Atomic absorption spectroscopy, an analytical procedure BEE Black Economic Empowerment BFS Bankable Feasibility Study CF Plot Cumulative Frequency Plot; a graphical statistical display of a range of data values CPS Counts per second; a relative measure of radioactivity using a hand-held scintillometer or a
down-hole radiometric probe. Determined as the number of excitations (light emissions) occurring in a sodium iodide crystal that are induced by gamma rays and measured as electronic pulses or counts.
EIS Environmental Impact Assessment ICP Inductively-coupled plasma emission spectroscopy, an analytical procedure QA/QC Quality Assurance/Quality Control; procedures used to assure accuracy and consistency of
analytical results Ppm Parts per million Probe The down-hole equivalent of a hand-held scintillometer eU3O8 Equivalent U3O8 determined by calibrations of scintillometer probes to a sample of known
uranium concentration. U3O8 Formula for uranium oxide that is a common way of reporting uranium determinations by the
equivalent of chemical analyses V (V2O5) The element Vanadium, reported as a vanadium oxide XRF X-Ray Fluorescence, an analytical procedure
Glossary of Key Mining, Geological and Other Technical Terms Terms Definitions Background Radiation
That portion of the radiometric total count reading (CPS or counts per second) that are attributable to non-recoverable uranium, potassium and thorium radiation on gamma logs
Calcrete A commonly used rock name for a carbonate-cemented, clastic sedimentary rock Carnotite A naturally occurring uranium and vanadium mineral with the formula K2(UO2)2(VO4)2·3H2O
(hydrated potassium uranyl vanadate). Carnotite contains uranium and vanadium in the U:V ratio of 4.67:1.0 by weight or 3.087:1.0 for U3O8: V2O5 ratio [for every 3.087 units of U3O8 recovered as carnotite, 1.0 unit of V2O5 will be recovered. Or conversely for every 1.0 part U3O8 recovered there will be 0.324 parts V2O5].
Radiation Or radioactivity; meaning the emissions of alpha, beta, and gamma rays from naturally occurring minerals and rocks.
Scintillometer A hand-held instrument or down-hole probe that detects radiation as counts per second (CPS) Spectrometer An instrument that measures CPS radioactivity and differentiates the total CPS spectral
radiation emissions into that derived from potassium (K), uranium (U), and thorium (Th), the most commonly occurring radioactive elements found in rocks and minerals.
Sulfate Refers to sulfate minerals of which gypsum is the most common at Trekkopje, analyses for which are expressed at SO4.
Total Count Total CPS from all radioactive sources, U, K, and Th. Total Count and CPS are commonly used synonymously.
UraMin may be used interchangeably for UraMin Inc and/or UraMin Namibia (Pty) Ltd. (UraMin Inc was formerly called Uranco)
UraMin Namibia
UraMin Namibia (Pty) Ltd, a wholly owned subsidiary of UraMin Inc.
Variography Graphical depiction of the mathematical relationship of the variation of grade with distance and direction for a set of assay points in 3-D space. A method used to determine optimum drill spacing and the preferred orientation of grade within a deposit.

Appendix A Certificate of Author
Allan V. Moran Principal Geologist SRK Consulting (U.S.) Inc. 3275 W. Ina Rd, Suite 240 Tucson, Arizona, U.S.A. 85741 Phone: 520-544-3688 Email: [email protected]
CERTIFICATE of AUTHOR
• I, Allan V. Moran, a Registered Geologist and a Certified Professional Geologist, do hereby certify that:
• I am currently employed as a consulting geologist to the mining and mineral exploration industry, as Principal Geologist with SRK Consulting (U.S.) Inc, with an office address of 3275 W. Ina Rd., Tucson, Arizona, USA, 85741.
• I graduated with a Bachelors of Science Degree in Geological Engineering from the Colorado School of Mines, Golden, Colorado, USA; May 1970.
• I am a Registered Geologist in the State of Oregon, USA, # G-313, and have been since 1978.
• I am a Certified Professional Geologist through membership in the American Institute of Professional Geologists, CPG - 09565, and have been since 1995.
• I have been employed as a geologist in the mining and mineral exploration business, continuously, for the past 35 years, since my graduation from university.
• I have read the definition of “qualified person” set out in National Instrument 43-101 (“NI 43-101”) and certify that by reason of my education, affiliation with a professional association (as defined in NI 43-101) and past relevant work experience, I fulfill the requirements to be a “qualified person” for the purposes of NI 43-101. The Technical Report is based upon my personal review of the information provided by the issuer. My relevant experience for the purpose of the Technical Report is:
• Vice President and U.S. Exploration Manager for Independence Mining Company, Reno, Nevada, 1990-1993
• Manager, Exploration North America for Cameco Gold Inc., 1988-2002
• Exploration Geologist for Freeport McMoRan Gold, 1980-1988
• Uranium exploration experience from 1975 to 1980 with Kerr McGee Resources, and Freeport Exploration

• Experience in the above positions working with and reviewing resource estimation methodologies, in concert with resource estimation geologist and engineers.
• As a consultant, I completed several NI 43-101 Technical reports, 2003-2006.
• I am responsible for the content, compilation, and editing of all sections of the technical report titled “Preliminary Assessment, Trekkopje Project Feasibility Study, Swakopmund and Karibib Districts, Erongo Region, Namibia”, and dated April 26, 2007 (the “Technical Report”) relating to the Trekkopje Project. I have personally visited the Trekkopje Project in the field during the period May 24 through May 28, 2006, and July 27 through August 03, 2006.
• I have not had prior involvement with the property that is the subject of the Technical Report, other than the initial NI 43-101 Technical report dated November 28, 2006.
• As of the date of this certificate, to the best of my knowledge, information and belief, the Technical Report contains all the scientific and technical information that is required to be disclosed to make the Technical Report not misleading.
• I am not aware of any material fact or material change with respect to the subject matter of the Technical Report that is not reflected in the Technical Report, for which the omission to disclose would make the Technical Report misleading.
• I am independent of the issuer applying all of the tests in Item 1.4 of National Instrument 43-101.
• I have read National Instrument 43-101 and Form 43-101F1, and the Technical Report has been prepared in compliance with that instrument and form.
• I consent to the filing of the Technical Report with any stock exchange and other regulatory authority and any publication by them, including electronic publication in the public company files on their websites accessible to the public, of the Technical Report.
Dated in Tucson, Arizona, April 26, 2007.
Signature of Qualified Person
Allan V. Moran
Printed name of Qualified Person (Sealed)
Frank Daviess Associate Resource Geologist
SRK Consulting (U.S.) Inc.
7175 W. Jefferson Avenue, Suite 3000
Lakewood, Colorado, U.S. 80235
Phone: 303-985-1333
Email: [email protected]
CERTIFICATE of AUTHOR
• I, Frank A Daviess do hereby certify that:
• I am currently employed as a consulting resource geologist to the mining and mineral exploration industry and I am currently under contract as an Associate Resource Geologist with SRK Consulting (U.S.) Inc, with an office address of 7175 W. Jefferson Avenue, Suite 3000 Lakewood, Colorado, U.S. 80235.
• I graduated from the University Of Colorado, Boulder, Colorado, USA with a B.A. in Geology in 1971 and a M.A. in Natural Resource Economics and Statistics in 1975
• I am a Member of the Australasian Institute of Mining and Metallurgy (Registration No. 226303).
• I am a Registered Member of the Society for Mining, Metallurgy and Exploration, Inc. (Registration No. 0742250).
• I have been employed as a geologist in the mining and mineral exploration business, continuously, for the past 30 years, since my graduation from university.
• I have read the definition of “qualified person” set out in National Instrument 43-101 (“NI 43-101”) and certify that by reason of my education, affiliation with professional associations (as defined in NI 43-101) and past relevant work experience I fulfill all the requirements to be a “qualified person” for the purposes of NI 43-101. I have authored sections of the Technical Report. The Technical Report is based upon my personal review of the information provided by the issuer. My relevant experience for the purpose of input to the Technical Report is:

• Specialization in the estimation, assessment and evaluation of mineral resources including uranium since 1975.
• Specialization in uranium resource estimation experience as an Ore Reserve Analyst, US Department of Energy, Resource Division, Grand Junction, CO, 1975-1978
• I am responsible for the Mineral Resource section of the technical report titled “NI 43-101 Technical Report, Preliminary Assessment, Trekkopje Uranium Project, Swakopmund and Karibib Districts, Erongo Region, Namibia”, and dated April 26, 2007 (the “Technical Report”) relating to the Trekkopje Project. I have not personally visited the Trekkopje Project in the field.
• I have not had prior involvement with the property that is the subject of the Technical Report.
• As of the date of this certificate, to the best of my knowledge, information and belief, the Technical Report contains all the scientific and technical information that is required to be disclosed to make the Technical Report not misleading.
• I am not aware of any material fact or material change with respect to the subject matter of the Technical Report that is not reflected in the Technical Report, for which the omission to disclose would make the Technical Report misleading.
• I am independent of the issuer applying all of the tests in Item 1.4 of National Instrument 43-101.
• I have read National Instrument 43-101 and Form 43-101F1, and the Technical Report has been prepared in compliance with that instrument and form.
• I consent to the filing of the Technical Report with any stock exchange and other regulatory authority and any publication by them, including electronic publication in the public company files on their websites accessible to the public, of the Technical Report.
Dated in Denver, Colorado, April 26, 2007
Signature of QP (Signed)

Appendix B Economic Model
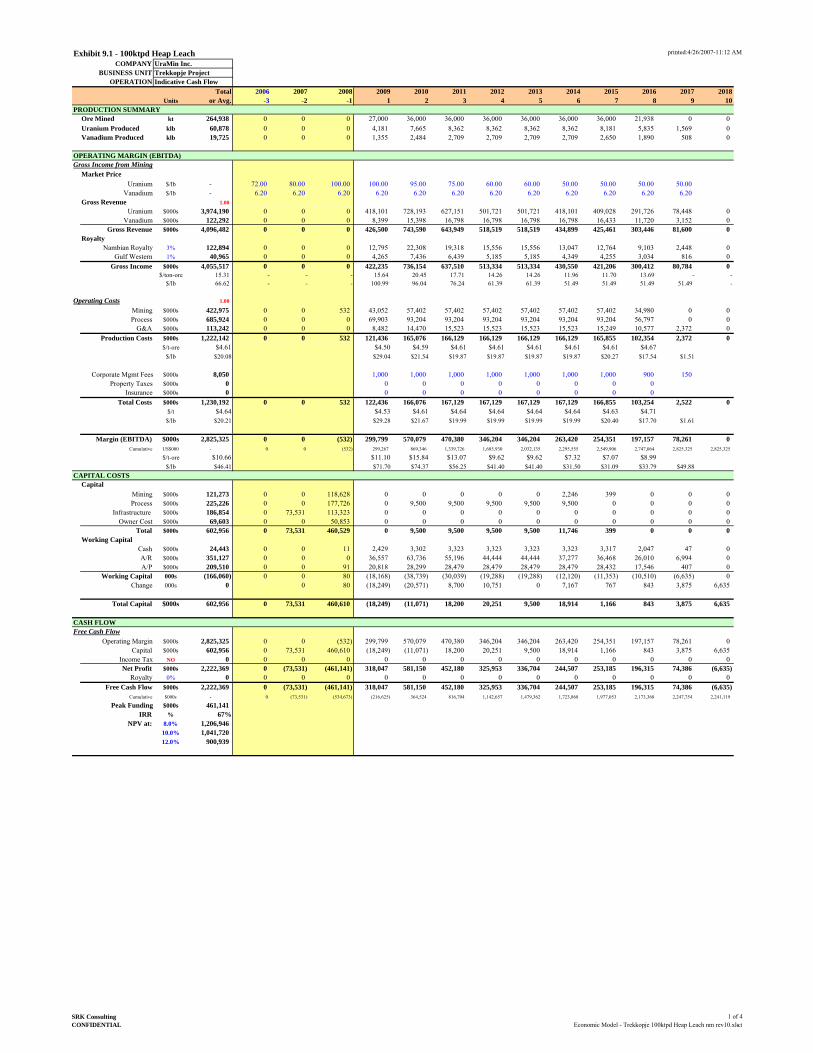
printed:4/26/2007-11:12 AMExhibit 9.1 - 100ktpd Heap LeachCOMPANY UraMin Inc.
BUSINESS UNIT Trekkopje ProjectOPERATION Indicative Cash Flow
Total 2006 2007 2008 2009 2010 2011 2012 2013 2014 2015 2016 2017 2018Units or Avg. -3 -2 -1 1 2 3 4 5 6 7 8 9 10
PRODUCTION SUMMARYOre Mined kt 264,938 0 0 0 27,000 36,000 36,000 36,000 36,000 36,000 36,000 21,938 0 0Uranium Produced klb 60,878 0 0 0 4,181 7,665 8,362 8,362 8,362 8,362 8,181 5,835 1,569 0Vanadium Produced klb 19,725 0 0 0 1,355 2,484 2,709 2,709 2,709 2,709 2,650 1,890 508 0
OPERATING MARGIN (EBITDA)Gross Income from Mining
Market PriceUranium $/lb - 72.00 80.00 100.00 100.00 95.00 75.00 60.00 60.00 50.00 50.00 50.00 50.00
Vanadium $/lb - 6.20 6.20 6.20 6.20 6.20 6.20 6.20 6.20 6.20 6.20 6.20 6.20Gross Revenue 1.00
Uranium $000s 3,974,190 0 0 0 418,101 728,193 627,151 501,721 501,721 418,101 409,028 291,726 78,448 0Vanadium $000s 122,292 0 0 0 8,399 15,398 16,798 16,798 16,798 16,798 16,433 11,720 3,152 0
Gross Revenue $000s 4,096,482 0 0 0 426,500 743,590 643,949 518,519 518,519 434,899 425,461 303,446 81,600 0Royalty
Nambian Royalty 3% 122,894 0 0 0 12,795 22,308 19,318 15,556 15,556 13,047 12,764 9,103 2,448 0Gulf Western 1% 40,965 0 0 0 4,265 7,436 6,439 5,185 5,185 4,349 4,255 3,034 816 0
Gross Income $000s 4,055,517 0 0 0 422,235 736,154 637,510 513,334 513,334 430,550 421,206 300,412 80,784 0$/ton-ore 15.31 - - - 15.64 20.45 17.71 14.26 14.26 11.96 11.70 13.69 - -
$/lb 66.62 - - - 100.99 96.04 76.24 61.39 61.39 51.49 51.49 51.49 51.49 -
Operating Costs 1.00
Mining $000s 422,975 0 0 532 43,052 57,402 57,402 57,402 57,402 57,402 57,402 34,980 0 0Process $000s 685,924 0 0 0 69,903 93,204 93,204 93,204 93,204 93,204 93,204 56,797 0 0
G&A $000s 113,242 0 0 0 8,482 14,470 15,523 15,523 15,523 15,523 15,249 10,577 2,372 0Production Costs $000s 1,222,142 0 0 532 121,436 165,076 166,129 166,129 166,129 166,129 165,855 102,354 2,372 0
$/t-ore $4.61 $4.50 $4.59 $4.61 $4.61 $4.61 $4.61 $4.61 $4.67$/lb $20.08 $29.04 $21.54 $19.87 $19.87 $19.87 $19.87 $20.27 $17.54 $1.51
Corporate Mgmt Fees $000s 8,050 1,000 1,000 1,000 1,000 1,000 1,000 1,000 900 150Property Taxes $000s 0 0 0 0 0 0 0 0 0
Insurance $000s 0 0 0 0 0 0 0 0 0Total Costs $000s 1,230,192 0 0 532 122,436 166,076 167,129 167,129 167,129 167,129 166,855 103,254 2,522 0
$/t $4.64 $4.53 $4.61 $4.64 $4.64 $4.64 $4.64 $4.63 $4.71$/lb $20.21 $29.28 $21.67 $19.99 $19.99 $19.99 $19.99 $20.40 $17.70 $1.61
Margin (EBITDA) $000s 2,825,325 0 0 (532) 299,799 570,079 470,380 346,204 346,204 263,420 254,351 197,157 78,261 0Cumulative US$000 - 0 0 (532) 299,267 869,346 1,339,726 1,685,930 2,032,135 2,295,555 2,549,906 2,747,064 2,825,325 2,825,325
$/t-ore $10.66 $11.10 $15.84 $13.07 $9.62 $9.62 $7.32 $7.07 $8.99$/lb $46.41 $71.70 $74.37 $56.25 $41.40 $41.40 $31.50 $31.09 $33.79 $49.88
CAPITAL COSTSCapital
Mining $000s 121,273 0 0 118,628 0 0 0 0 0 2,246 399 0 0 0Process $000s 225,226 0 0 177,726 0 9,500 9,500 9,500 9,500 9,500 0 0 0 0
Infrastructure $000s 186,854 0 73,531 113,323 0 0 0 0 0 0 0 0 0 0Owner Cost $000s 69,603 0 0 50,853 0 0 0 0 0 0 0 0 0 0
Total $000s 602,956 0 73,531 460,529 0 9,500 9,500 9,500 9,500 11,746 399 0 0 0Working Capital
Cash $000s 24,443 0 0 11 2,429 3,302 3,323 3,323 3,323 3,323 3,317 2,047 47 0A/R $000s 351,127 0 0 0 36,557 63,736 55,196 44,444 44,444 37,277 36,468 26,010 6,994 0A/P $000s 209,510 0 0 91 20,818 28,299 28,479 28,479 28,479 28,479 28,432 17,546 407 0
Working Capital 000s (166,060) 0 0 80 (18,168) (38,739) (30,039) (19,288) (19,288) (12,120) (11,353) (10,510) (6,635) 0Change 000s 0 0 80 (18,249) (20,571) 8,700 10,751 0 7,167 767 843 3,875 6,635
Total Capital $000s 602,956 0 73,531 460,610 (18,249) (11,071) 18,200 20,251 9,500 18,914 1,166 843 3,875 6,635
CASH FLOWFree Cash Flow
Operating Margin $000s 2,825,325 0 0 (532) 299,799 570,079 470,380 346,204 346,204 263,420 254,351 197,157 78,261 0Capital $000s 602,956 0 73,531 460,610 (18,249) (11,071) 18,200 20,251 9,500 18,914 1,166 843 3,875 6,635
Income Tax NO 0 0 0 0 0 0 0 0 0 0 0 0 0 0Net Profit $000s 2,222,369 0 (73,531) (461,141) 318,047 581,150 452,180 325,953 336,704 244,507 253,185 196,315 74,386 (6,635)
Royalty 0% 0 0 0 0 0 0 0 0 0 0 0 0 0 0Free Cash Flow $000s 2,222,369 0 (73,531) (461,141) 318,047 581,150 452,180 325,953 336,704 244,507 253,185 196,315 74,386 (6,635)
Cumulative $000s - 0 (73,531) (534,673) (216,625) 364,524 816,704 1,142,657 1,479,362 1,723,868 1,977,053 2,173,368 2,247,754 2,241,119
Peak Funding $000s 461,141IRR % 67%
NPV at: 8.0% 1,206,94610.0% 1,041,72012.0% 900,939
SRK ConsultingCONFIDENTIAL
1 of 4Economic Model - Trekkopje 100ktpd Heap Leach nm rev10.xls-cf

printed:4/26/2007-11:12 AMExhibit 9.1 - 100ktpd Heap LeachCOMPANY UraMin Inc.
BUSINESS UNIT Trekkopje ProjectOPERATION Production
Total 2006 2007 2008 2009 2010 2011 2012 2013 2014 2015 2016 2017 2018Units or Avg. -3 -2 -1 1 2 3 4 5 6 7 8 9 10
MINE PRODUCTIONAssumptions
Operating Days day/yr 360 360 360 360 360 360 360 360 360Mine Capacity tpd 96,875 75,000 100,000 100,000 100,000 100,000 100,000 100,000 100,000
Annual Capacity kt 279,000 27,000 36,000 36,000 36,000 36,000 36,000 36,000 36,000 0 0
Ore & Waste ProductionWaste Production
Klein Trekkopje kt 114,322 500 13,500 18,000 18,000 18,000 18,000 18,000 10,322Trekkopje kt 18,648 7,679 10,969
kt 0Total Waste kt 132,969 0 0 500 13,500 18,000 18,000 18,000 18,000 18,000 18,000 10,969 0 0
Ore ProductionKlein Trekkopje kt 227,643 27,000 36,000 36,000 36,000 36,000 36,000 20,643
Trekkopje kt 37,295 15,357 21,938kt 0
Total Ore kt 264,938 0 0 0 27,000 36,000 36,000 36,000 36,000 36,000 36,000 21,938 0 0
Total Material kt 397,907 0 0 500 40,500 54,000 54,000 54,000 54,000 54,000 54,000 32,907 0 0Stripping Ratio
Klein Trekkopje waste:ore 0.50 - " - " - " 0.50 0.50 0.50 0.50 0.50 0.50 0.50 - " - " - "Trekkopje waste:ore 0.50 - - - - - - - - - 0.50 0.50 - -
Overall waste:ore 0.50 - - - 0.50 0.50 0.50 0.50 0.50 0.50 0.50 0.50 - -
Ore Grade 1.00
UraniumKlein Trekkopje %U3O8 0.0140% 0.0140% 0.0140% 0.0140% 0.0140% 0.0140% 0.0140% 0.0140%
Trekkopje %U3O8 0.0130% 0.0130% 0.0130%%U3O8 0.0000%
Combined %U3O8 0.0139% 0.0000% 0.0000% 0.0000% 0.0155% 0.0155% 0.0155% 0.0155% 0.0155% 0.0155% 0.0150% 0.0143% 0.0000% 0.0000%Vanadium 1.00
Klein Trekkopje %V2O5 0.005% 0.005% 0.005% 0.005% 0.005% 0.005% 0.005% 0.005%Trekkopje %V2O5 0.004% 0.004% 0.004%
%V2O5 0.000%Combined %V2O5 0.005% 0.000% 0.000% 0.000% 0.000% 0.000% 0.000% 0.000% 0.000% 0.000% 0.000% 0.000% 0.000% 0.000%
Contained MetalUranium
Klein Trekkopje klb 70,502 0 0 0 8,362 11,149 11,149 11,149 11,149 11,149 6,393 0 0 0Trekkopje klb 10,669 0 0 0 0 0 0 0 0 0 4,393 6,276 0 0
klb 0 0 0 0 0 0 0 0 0 0 0 0 0 0Total Uranium klb 81,171 0 0 0 8,362 11,149 11,149 11,149 11,149 11,149 10,786 6,276 0 0
VanadiumKlein Trekkopje klb 22,843 0 0 0 2,709 3,612 3,612 3,612 3,612 3,612 2,071 0 0 0
Trekkopje klb 3,457 0 0 0 0 0 0 0 0 0 1,423 2,033 0 0klb 0 0 0 0 0 0 0 0 0 0 0 0 0 0
Total Vanadium klb 26,299 0 0 0 2,709 3,612 3,612 3,612 3,612 3,612 3,495 2,033 0 0
PROCESSPRODUCTIONHeap Leach
Ore to Pad Note: Assumes no stockpiling of ore.
Begin Tons kton 0 0 0 0 0 0 0 0 0 0 0 0 0from Klein Trekkopje kton 227,643 0 0 0 27,000 36,000 36,000 36,000 36,000 36,000 20,643 0 0 0
from Trekkopje kton 37,295 0 0 0 0 0 0 0 0 0 15,357 21,938 0 0from 3rd Party kton 0 0 0 0 0 0 0 0 0 0 0 0 0 0
to Pad kton 264,938 0 0 0 27,000 36,000 36,000 36,000 36,000 36,000 36,000 21,938 0 0End Tons kton 0 0 0 0 0 0 0 0 0 0 0 0 0
Stockpile GradeBegin %U3O8 - 0.000% 0.000% 0.000% 0.014% 0.014% 0.014% 0.014% 0.014% 0.014% 0.014% 0.013% 0.000% 0.000%
Grade Out %U3O8 - 0.000% 0.000% 0.000% 0.014% 0.014% 0.014% 0.014% 0.014% 0.014% 0.014% 0.013% 0.000% 0.000%End %U3O8 - 0.000% 0.000% 0.000% 0.000% 0.000% 0.000% 0.000% 0.000% 0.000% 0.000% 0.000% 0.000% 0.000%
U3O8 ProductionBegin klb 0 0 0 0 0 0 0 0 0 0 0 0 0
U3O8 In klb 81,171 0 0 0 8,362 11,149 11,149 11,149 11,149 11,149 10,786 6,276 0 0to Pad klb 81,171 0 0 0 8,362 11,149 11,149 11,149 11,149 11,149 10,786 6,276 0 0
End klb 0 0 0 0 0 0 0 0 0 0 0 0 0U3O8 Recovery 1.00 Note: 120 day Leach Cycle is estimated.
Material Processed klb 81,171 0 0 0 8,362 11,149 11,149 11,149 11,149 11,149 10,786 6,276 0 0Recovery Rate % 75.0% 75.0% 75.0% 75.0% 75.0% 75.0% 75.0% 75.0% 75.0% 75.0%
U3O8 Produced klb 60,878 0 0 0 4,181 7,665 8,362 8,362 8,362 8,362 8,181 5,835 1,569 0Stockpile Grade
Begin %V2O5 - 0.000% 0.000% 0.000% 0.005% 0.005% 0.005% 0.005% 0.005% 0.005% 0.004% 0.004% 0.000% 0.000%Grade Out %V2O5 - 0.000% 0.000% 0.000% 0.005% 0.005% 0.005% 0.005% 0.005% 0.005% 0.004% 0.004% 0.000% 0.000%
End %V2O5 - 0.000% 0.000% 0.000% 0.000% 0.000% 0.000% 0.000% 0.000% 0.000% 0.000% 0.000% 0.000% 0.000%V2O5 Production
Begin klb 0 0 0 0 0 0 0 0 0 0 0 0 0V2O5 In klb 26,299 0 0 0 2,709 3,612 3,612 3,612 3,612 3,612 3,495 2,033 0 0
to Pad klb 26,299 0 0 0 2,709 3,612 3,612 3,612 3,612 3,612 3,495 2,033 0 0End klb 0 0 0 0 0 0 0 0 0 0 0 0 0
V2O5 Recovery 1.00 Note: 120 day Leach Cycle is estimated. Material Processed klb 26,299 0 0 0 2,709 3,612 3,612 3,612 3,612 3,612 3,495 2,033 0 0
Recovery Rate % 75.0% 75.0% 75.0% 75.0% 75.0% 75.0% 75.0% 75.0% 75.0% 75.0%V2O5 Produced klb 19,725 0 0 0 1,355 2,484 2,709 2,709 2,709 2,709 2,650 1,890 508 0
SRK ConsultingCONFIDENTIAL
2 of 4Economic Model - Trekkopje 100ktpd Heap Leach nm rev10.xls-prod

printed:4/26/2007-11:12 AM
Exhibit 9.1 - 100ktpd Heap LeachCOMPANY UraMin Inc.
BUSINESS UNIT Trekkopje ProjectOPERATION Operating Costs
Total 2006 2007 2008 2009 2010 2011 2012 2013 2014 2015 2016 2017 2018Units or Avg. -3 -2 -1 1 2 3 4 5 6 7 8 9 10
PRODUCTION SUMMARY
Total Material kt 397,907 0 0 500 40,500 54,000 54,000 54,000 54,000 54,000 54,000 32,907 0 0Ore Mined/Processed kt 264,938 0 0 0 27,000 36,000 36,000 36,000 36,000 36,000 36,000 21,938 0 0Uranium Produced klb 60,878 0 0 0 4,181 7,665 8,362 8,362 8,362 8,362 8,181 5,835 1,569 0Vanadium Produced klb 19,725 0 0 0 1,355 2,484 2,709 2,709 2,709 2,709 2,650 1,890 508 0
OPERATING COSTSMining Cost
Mining 1.00Drilling $0.098 38,995 0 0 49 3,969 5,292 5,292 5,292 5,292 5,292 5,292 3,225 0 0Blasting $0.190 75,602 0 0 95 7,695 10,260 10,260 10,260 10,260 10,260 10,260 6,252 0 0Loading $0.145 57,697 0 0 73 5,873 7,830 7,830 7,830 7,830 7,830 7,830 4,772 0 0Hauling $0.244 97,089 0 0 122 9,882 13,176 13,176 13,176 13,176 13,176 13,176 8,029 0 0
Other Mine Equip. $0.186 74,011 0 0 93 7,533 10,044 10,044 10,044 10,044 10,044 10,044 6,121 0 0Support Equip. $0.075 29,843 0 0 38 3,038 4,050 4,050 4,050 4,050 4,050 4,050 2,468 0 0
Progressive Rehab. $0.020 7,958 0 0 10 810 1,080 1,080 1,080 1,080 1,080 1,080 658 0 0Misc. Operations $0.005 1,990 0 0 3 203 270 270 270 270 270 270 165 0 0Mine Engineerng $0.037 14,723 0 0 19 1,499 1,998 1,998 1,998 1,998 1,998 1,998 1,218 0 0
Mine Admin. $0.042 16,712 0 0 21 1,701 2,268 2,268 2,268 2,268 2,268 2,268 1,382 0 0Freight $0.021 8,356 0 0 11 851 1,134 1,134 1,134 1,134 1,134 1,134 691 0 0
Duty $0.000 0 0 0 0 0 0 0 0 0 0 0 0 0 0Mining Total $000s 422,975 0 0 532 43,052 57,402 57,402 57,402 57,402 57,402 57,402 34,980 0 0
1.60 $/tot-ton $1.063 $1.063 $1.063 $1.063 $1.063 $1.063 $1.063 $1.063 $1.063 $1.063$/lb-U3O8 $6.95 $10.30 $7.49 $6.86 $6.86 $6.86 $6.86 $7.02 $6.00 $0.00
Process Cost 1.00
Na2CO3 $1.486 393,698 0 0 0 40,122 53,496 53,496 53,496 53,496 53,496 53,496 32,600 0 0HCO3 $0.275 72,858 0 0 0 7,425 9,900 9,900 9,900 9,900 9,900 9,900 6,033 0 0Water $0.214 56,697 0 0 0 5,778 7,704 7,704 7,704 7,704 7,704 7,704 4,695 0 0
Crusher Liners $0.060 15,896 0 0 0 1,620 2,160 2,160 2,160 2,160 2,160 2,160 1,316 0 0Labor $0.052 13,777 0 0 0 1,404 1,872 1,872 1,872 1,872 1,872 1,872 1,141 0 0
Maintenance Labor $0.057 15,101 0 0 0 1,539 2,052 2,052 2,052 2,052 2,052 2,052 1,250 0 0Power $0.026 6,888 0 0 0 702 936 936 936 936 936 936 570 0 0
Parts & Supplies $0.164 43,450 0 0 0 4,428 5,904 5,904 5,904 5,904 5,904 5,904 3,598 0 0Ammonia $0.005 1,325 0 0 0 135 180 180 180 180 180 180 110 0 0
Resin $0.092 24,374 0 0 0 2,484 3,312 3,312 3,312 3,312 3,312 3,312 2,018 0 0Caustic $0.002 530 0 0 0 54 72 72 72 72 72 72 44 0 0Diesel $0.146 38,681 0 0 0 3,942 5,256 5,256 5,256 5,256 5,256 5,256 3,203 0 0
SX $0.010 2,649 0 0 0 270 360 360 360 360 360 360 219 0 0Process Total $000s 685,924 0 0 0 69,903 93,204 93,204 93,204 93,204 93,204 93,204 56,797 0 0
$/t-ore $2.589 $2.589 $2.589 $2.589 $2.589 $2.589 $2.589 $2.589 $2.589$/lb-U3O8 $11.27 $16.72 $12.16 $11.15 $11.15 $11.15 $11.15 $11.39 $9.73 $0.00
G&A 1.00
Mktg & Logistics $3.33 92,047 0 0 0 6,322 11,590 12,643 12,643 12,643 12,643 12,369 8,822 2,372 0Labor $0.02 5,299 0 0 0 540 720 720 720 720 720 720 439 0 0O&M $0.04 9,273 0 0 0 945 1,260 1,260 1,260 1,260 1,260 1,260 768 0 0
Environmental $0.03 6,623 0 0 0 675 900 900 900 900 900 900 548 0 0$0.00 0 0 0 0 0 0 0 0 0 0 0 0 0 0
G&A Total $000s 113,242 0 0 0 8,482 14,470 15,523 15,523 15,523 15,523 15,249 10,577 2,372 0$/t $0.427 $0.314 $0.402 $0.431 $0.431 $0.431 $0.431 $0.424 $0.482$/lb $1.86 $2.03 $1.89 $1.86 $1.86 $1.86 $1.86 $1.86 $1.81 $1.51
SRK ConsultingCONFIDENTIAL
3 of 4Economic Model - Trekkopje 100ktpd Heap Leach nm rev10.xls-opex

printed:4/26/2007-11:12 AMExhibit 9.1 - 100ktpd Heap LeachCOMPANY UraMin Inc.
BUSINESS UNIT Trekkopje ProjectOPERATION Capital Costs
Total 2006 2007 2008 2009 2010 2011 2012 2013 2014 2015 2016 2017 2018Units or Avg. -3 -2 -1 1 2 3 4 5 6 7 8 9 10
MINE CAPITAL COSTSMine Equipment 1.00 Note: Mine capex frieght & duty included in cost estimate.
Drilling $000s 9,108 9,108Blasting $000s 821 646 175Loading $000s 30,897 30,897Hauling $000s 28,600 28,600
Other Mine Ops. $000s 22,728 22,409 319Support $000s 4,864 3,242 1,622
$000s 0subtotal $000s 97,018 0 0 94,902 0 0 0 0 0 1,797 319 0 0 0
Freight 0% 0 0 0 0 0 0 0 0 0 0 0 0 0 0Import Duties 0% 0 0 0 0 0 0 0 0 0 0 0 0 0 0VAT 0% 0 0 0 0 0 0 0 0 0 0 0 0 0 0
subtotal $000s 97,018 0 0 94,902 0 0 0 0 0 1,797 319 0 0 0Contingency 25% 24,255 0 0 23,726 0 0 0 0 0 449 80 0 0 0
Total Mining $000s 121,273 0 0 118,628 0 0 0 0 0 2,246 399 0 0 0
PROCESS CAPITAL COSTSProcess Equipment 1.00
Stacking Systems $000s 17,000 17,000Credit from Heap $000s 0 0
Overland Conveyor $000s 9,240 9,240Leach Pads & Ponds $000s 41,441 41,441
RoM Tips $000s 34,500 34,500Stockpile & Reclaim $000s 0 0
Process Plant $000s 40,000 40,000Sustaining $000s 38,000 7,600 7,600 7,600 7,600 7,600
subtotal $000s 180,181 0 0 142,181 0 7,600 7,600 7,600 7,600 7,600 0 0 0 0Freight 0% 0 0 0 0 0 0 0 0 0 0 0 0 0 0Import Duties 0% 0 0 0 0 0 0 0 0 0 0 0 0 0 0VAT 0% 0 0 0 0 0 0 0 0 0 0 0 0 0 0
subtotal $000s 180,181 0 0 142,181 0 7,600 7,600 7,600 7,600 7,600 0 0 0 0Contingency 25% 45,045 0 0 35,545 0 1,900 1,900 1,900 1,900 1,900 0 0 0 0
Total Process $000s 225,226 0 0 177,726 0 9,500 9,500 9,500 9,500 9,500 0 0 0 0
INFRASTRUCTURE & OWNER CAPITAL COSTSInfrastructure 1.00
GeneralOffices & Equip 000s 1,058 1,058Communications 000s 103 103
Accomodation 000s 2,400 2,400Roads 000s 400 400
Guard Gate 000s 10 10Fencing 000s 5 5
Water Reticulation 000s 2,000 2,000Lighting 000s 10 10
MineDispatch System 000s 850 850Mine Warehouse 000s 2,500 2,500
Ready Line 000s 750 750Equipment & Tools 000s 1,797 1,797
Mine Dry 000s 750 750AN/FO Storage Bin 000s 250 250
Process Note: Process related infrastructure also included above. Process Facility 000s 0 0
Leach Pad & Ponds 000s 0 0Workshops 000s 2,000 2,000
Stores 000s 800 800Reagent Stores 000s 800 800
Bulk Water Facility 000s 128,000 56,000 72,000Power Facility 000s 5,000 5,000
subtotal $000s 149,483 0 58,825 90,658 0 0 0 0 0 0 0 0 0 0Freight 0% 0 0 0 0 0 0 0 0 0 0 0 0 0 0Import Duties 0% 0 0 0 0 0 0 0 0 0 0 0 0 0 0VAT 0% 0 0 0 0 0 0 0 0 0 0 0 0 0 0
subtotal $000s 149,483 0 58,825 90,658 0 0 0 0 0 0 0 0 0 0Contingency 25% 37,371 0 14,706 22,665 0 0 0 0 0 0 0 0 0 0
Total Infrastructure $000s 186,854 0 73,531 113,323 0 0 0 0 0 0 0 0 0 0
Owners Costs 1.00
EPCM 12.5% 12,773 12,773Contractor Fees 000s 6,000 6,000
EIA & Permitting 000s 700 700Training 000s 3,500 3,500Security 000s 250 250
Community Relations 000s 150 150Misc Permits & fees 000s 150 150
Corporate Services 000s 3,000 3,000Initial Spares 5.0% 11,660 11,660
First Fills 000s 2,500 2,500Final Reclamation 000s 15,000
subtotal $000s 55,682 0 0 40,682 0 0 0 0 0 0 0 0 0 0Contingency 25% 13,921 0 0 10,171 0 0 0 0 0 0 0 0 0 0
Total Owner Cost $000s 69,603 0 0 50,853 0 0 0 0 0 0 0 0 0 0
TOTAL CAPITAL $000s 602,956 0 73,531 460,529 0 9,500 9,500 9,500 9,500 11,746 399 0 0 0
SRK ConsultingCONFIDENTIAL
4 of 4Economic Model - Trekkopje 100ktpd Heap Leach nm rev10.xls-capex
UraMin Inc. NI 43-101 Technical Report, Preliminary Assessment, Trekkopje Uranium Project, Swakopmund and Karibib Districts, Erongo Region, Namibia, dated April 26, 2007. Dated this 26th day of April, 2007.
Allan Moran R.G., C.P.G.
Frank Daviess R. SME, M. AusIMM