Upperclassmen Dormitory Design · PDF fileAbstract This MQP project ... campus apartments such...
95
Project Number: LDA-0701 Upperclassmen Dormitory Design A Major Qualifying Project Report: Submitted to the Faculty of the Worcester Polytechnic Institute In partial fulfillment for the requirement for the Degree of Bachelor of Science By Michael Hansen James Scully Chase Terrio Date: March 1, 2007 Approved: Professor L. D. Albano, Major Advisor
Transcript of Upperclassmen Dormitory Design · PDF fileAbstract This MQP project ... campus apartments such...

Project Number: LDA-0701
Upperclassmen Dormitory Design
A Major Qualifying Project Report:
Submitted to the Faculty of the
Worcester Polytechnic Institute
In partial fulfillment for the requirement for the
Degree of Bachelor of Science By
Michael Hansen
James Scully
Chase Terrio
Date: March 1, 2007
Approved:
Professor L. D. Albano, Major Advisor

2
Abstract This MQP project focused on the design of a four story apartment style residence
hall intended for upper-classman. Three building designs were developed using steel,
concrete, and a composite of steel and concrete. Based on cost, the team selected the
steel structural system to design the atypical areas and analyze lateral forces. A
construction cost estimate of the building was developed using 16 CSI divisions. An
additional cost estimate was developed to incorporate LEED certification.

3
Authorship Abstract Authorship 1. Introduction 2. Background 3. Methodology 3.1. Design of Concrete Systems Mike Hansen 3.2. Design of Structural Steel Systems James Scully 3.3. Design of Composite Steel and Concrete Systems Chase Terrio 3.4. Design of Lateral Load-resisting System James Scully 3.5. Design of Atypical Areas James Scully 3.6. Development of Building Cost Estimates Mike Hansen 3.7. Development of LEED Building Cost Estimate Chase Terrio 4. Analysis 4.1. Analysis of Concrete Systems Mike Hansen 4.2 Analysis of Structural Steel Systems James Scully 4.3 Analysis of Composite Steel and Concrete Systems Chase Terrio 4.4 Analysis of Lateral Load-resisting Systems James Scully 4.5 Analysis of Atypical Areas James Scully 4.6 Analysis of Building Cost Estimates Mike Hansen 4.7 Analysis of LEED Building Cost Estimate Chase Terrio 5 Conclusion I. Appendix A. Structural System Design B. Cost Estimates C. LEED Certification & Cost D. Lot Location E. References Abstract, Authorship, Introduction, Background, Methodology, Analysis, and Conclusion were developed through equal effort from all members.

4
Table of Contents Abstract ............................................................................................................................... 2 Authorship........................................................................................................................... 3 1. Introduction................................................................................................................. 7 2. Background............................................................................................................... 10 3. Methodology............................................................................................................. 16
3.1. Design of Concrete Systems ............................................................................. 20 3.2. Design of Structural Steel Systems................................................................... 23 3.3. Design of Composite Steel and Concrete Systems........................................... 25 3.4. Design of Lateral Load-resisting System..........................................................27 3.5. Design of Atypical Areas.................................................................................. 29 3.6. Development of Building Cost Estimates......................................................... 30 3.7. Development of LEED Building Cost Estimate ............................................... 32
4. Analysis..................................................................................................................... 33 4.1. Analysis of Concrete Systems .......................................................................... 34 4.2. Analysis of Structural Steel Systems ................................................................ 38 4.3 Analysis of Composite Steel and Concrete Systems ........................................ 43 4.4 Analysis of Lateral Load-resisting Systems ..................................................... 47 4.5 Analysis of Atypical Areas ............................................................................... 48 4.6 Analysis of Building Cost Estimates ................................................................ 49 4.7 Analysis of LEED Building Cost Estimate....................................................... 51
5 Conclusion ................................................................................................................ 54 I. Appendix................................................................................................................... 56
A. Proposal................................................................................................................. 56 B. Structural System Design...................................................................................... 58 C. Cost Estimates....................................................................................................... 79 D. LEED Certification & Cost................................................................................... 88 E. Lot Location.......................................................................................................... 92 References..................................................................................................................... 95

5
Table of Tables
Table 1: Common Dead Loads ......................................................................................... 18 Table 2: Common Live Loads .......................................................................................... 18 Table 3: Cost of Steel by Weight...................................................................................... 37 Table 4: Total Cost by Method ......................................................................................... 37 Table 5: Scheme 1 Results................................................................................................ 38 Table 6: Scheme 2 Results................................................................................................ 39 Table 7: Scheme 3 Results................................................................................................ 40 Table 8: Column Design Results ...................................................................................... 40 Table 9: Structural Layout Costs ...................................................................................... 41 Table 10: Scheme to Slab Relationship ............................................................................ 44 Table 11: Scheme Costs.................................................................................................... 45 Table 12: Atypical Design Results ................................................................................... 48 Table 13: LEED Silver Certification Options................................................................... 52 Table 14: Roof Columns................................................................................................... 58 Table 15: 3rd Floor Columns............................................................................................ 60 Table 16: 2nd Floor Columns ........................................................................................... 61 Table 17: 1st Floor Columns............................................................................................. 62 Table 18: Girder Loads ..................................................................................................... 63 Table 19: Beam Loads ...................................................................................................... 63 Table 20: Girder Design.................................................................................................... 64 Table 21: Beam Design..................................................................................................... 65 Table 22: Beam Design Volumes (Cu. Inch).................................................................... 66 Table 23: Girder Design Volumes (Cu. Inch)................................................................... 67 Table 24: Column Design Volumes (Cu. Inch) ................................................................ 68 Table 25: Steel Interior Beam Design............................................................................... 69 Table 26: Steel Roof Beam Design................................................................................... 70 Table 27: Atypical Roof Design ....................................................................................... 71 Table 28: Atypical Interior Level Design ......................................................................... 72 Table 29: Substructure Cost (Volume) ............................................................................ 79 Table 30: Cost Breakdown by CSI Division..................................................................... 80 Table 31: Final Cost Analysis........................................................................................... 87 Table 32: LEED Points ..................................................................................................... 90 Table 33: LEED Cost Analysis......................................................................................... 91

6
Table of Figures
Figure 1: Site Location...................................................................................................... 11 Figure 2: Property Line..................................................................................................... 12 Figure 3: Columns spaced 40'x20' .................................................................................... 17 Figure 4: Columns spaced 20'x20' .................................................................................... 17 Figure 5: Columns spaced 10'x20' .................................................................................... 17 Figure 6: Typical Frame.................................................................................................... 28 Figure 7: Atypical Floor Plan ........................................................................................... 29 Figure 8: Unit Design Layout 1 ........................................................................................ 34 Figure 9: Unit Layout Design 2 ........................................................................................ 35 Figure 10: Unit Layout Design 3 ...................................................................................... 36 Figure 11: Column Spacing Option .................................................................................. 39 Figure 12: 10 ft Beam Spacing ......................................................................................... 42 Figure 13: Cost Breakdown by Division .......................................................................... 50 Figure 14: Topographical Map ......................................................................................... 92 Figure 15: Floor Plan Layout............................................................................................ 93 Figure 16: Site Plan Layout .............................................................................................. 94

7
1. Introduction
Worcester Polytechnic Institute has a desire to increase the percentage of
upperclassmen living on campus, but do not have the necessary housing facilities.
Residential Services believes that seniors and juniors could provide valuable leadership
skills and be role models for the freshman and sophomore students, as well as contribute
to security. Currently, the opportunity for upperclassmen to live on campus is small, and
the majority of upper-class students live in off-campus apartments, in the nearby
neighborhoods of Worcester. Often students can find more desirable housing in the off-
campus apartments such as individual bedrooms and more affordable rates. The Greek
system also houses a significant number of upper-class students.
Worcester Polytechnic Institute is now making a serious effort to increase the
numbers of upperclassmen living on campus. For example, a project is currently being
planned for construction next to the existing Founders hall. It is scheduled for
completion in fall 2008. The focus of this Major Qualifying Project is to design an
independent interpretation of a potential residence hall on campus that will be appealing
to upper-class students.
After speaking with Naomi Letendre, the Director of Residential Services, it
became clear that Worcester Polytechnic Institute planned to use currently owned
property and not acquire new land in the development of new dormitories. One example
of this philosophy is the proposed development of the new residence hall between
Boynton St. and Dean St. Other options for the new dorm include a new piece of land on
23 Trowbridge Road, which was obtained by WPI at the end of 2003. This piece of land

8
was a grant given by Mr. Ersckin. The lot is between Trowbridge Road and Einhorn
Street and is about 50,000 square feet. The shape of the lot and its size will influence the
design of the building.
The goal of this project was to develop a new residence hall on 23 Trowbridge
Road. Before the design began, Worcester zoning bylaws and Massachusetts State
Building Codes were examined. The Worcester Zoning Codes provided building set back
restrictions and height limitations for the dormitory. The Massachusetts State Building
Codes provided loading conditions for live loads, snow loads, and wind loads. Then we
developed a preliminary design using three structural options including concrete, steel,
and a composite design of the two. Once a structural option was chosen, it was then used
to design the Atypical areas of the building. Along with the structural design, a cost
estimate for the project was calculated. The first cost was for the entire building, and a
second cost was developed to meet LEED certification requirements. The subsequent
chapters will discuss in more detail the development of the design, analysis, and cost of
this independent residence hall.
This MQP is designed to fulfill capstone requirements through the applied
manifestation of various previous course studies and assignments. The techniques utilized
in this project were developed through a host of WPI CEE courses. They include, but are
not limited to; the Design of Steel Structures, Design of Reinforced Concrete Structures,
Construction Project Management, and Cost Estimating. The skills acquired through
these courses were applied to develop a unique and individual project scope and design.

9
In an effort to fill Worcester Polytechnic Institute’s need for a new residence hall
and the availability of 23 Trowbridge, as the potential location for a future dormitory, this
Major Qualifying Project will design a building for this lot.

10
2. Background
The project team decided to develop a new dormitory located on campus. This
required discussions with John Miller, the Director of Plant Services, and Naomi
Letendre, the Director of Residential Services, to establish a building location and design
criteria. In addition to those meetings, research was done on the Worcester zoning bylaws
and certain provisions of the Massachusetts State Building Codes. Previous knowledge of
an empty lot on Trowbridge Rd. allowed for preliminary site investigations.
John Miller is the Director of Plant Services and is responsible for the
management of all WPI property. His office provided the topographic layout and plan
view of the lot which is located at 23 Trowbridge Rd. It was last surveyed in 2004.
From these plans, the team was able to establish the dimensions of the property. A
working knowledge of the property’s history, including the previous layout of the
property, was also developed primarily through Mr. Miller. The following figures show
the site location and the property lines of the site.
11
Figure 1: Site Location
`

12
Figure 2: Property Line

13
The property is a double frontage lot located between Einhorne and Trowbridge
Rd. The property was given to WPI through a grant in December, 2003 by Mr. Ersckin
after the death of his wife. A mansion stood on the property, but it was demolished just
prior to WPI’s acquisition. Due to the previous existence of the mansion a fair portion of
the lot is graded and mostly level. This portion of the lot is the portion closest to Institute
Road and the WPI campus. Beyond this relatively level portion of the lot, the remaining
area is rather steep with an elevation drop of nearly 40 feet over a distance of roughly 120
feet. The exact location can be seen in the map provided in Appendix section E.
Initial site investigation of 23 Trowbridge Rd. allowed the project team to gain a
sense of proportion for the size and shape of the property. For instance, the upper portion
of the site was discovered to be rather large. The two curb cuts for the lot were also
located in the upper portion of the lot, one on each fronting street. The site visit allowed
for a more accurate visualization of possible building options. The unique property
characteristics required creativity in terms of design and shape of the building. The
property’s shape, geographic constraints, and orientation would all be traits that were
identified as influences on the ultimate design.
Following the team’s site investigation, a meeting with Naomi Letendre, the
Director of Residential Services, was scheduled to develop a better understanding of
desirable features and living conditions that students typically look for in upperclassmen
housing. Mrs. Letendre spoke about WPI’s goal to develop more on-campus housing for
upper classmen and the type of housing in which students were typically interested.
Apartment style living was a more popular approach and common features include: single
bedrooms, full kitchens and a living room. These features were incorporated into the

14
conceptual layout and influenced the dimensions of a typical apartment unit. Mrs.
Letendre also indicated a desire to house between 100 and 200 students in a future
dormitory. This number also influenced our design.
One real life constraint on the Trowbridge property are the current zoning bylaws
governing the property. The team went to the Worcester Zoning Department office and
determined that the property was governed by residential requirements. This meant set
backs of 15 feet from both streets and a side yard set back of 10 feet, in addition to a
height limitation of 50 feet. Though the residential building envelope would be used in
the design of our dormitory, a variance for use would be needed to build a dormitory on
the lot. This would result in the property being governed by a different set of dimensional
restrictions and criteria most likely being Institutional, a designation for universities. The
project team assumed that the variance would be approved, allowing the property to be
governed by the neighboring zoning requirements for academic housing. The appeal
would have to be approved by the Worcester Zoning Board of Appeals through a public
hearing that is publicly advertised and scheduled on the appeals board agenda. The
team’s research of the Massachusetts State Building Code determined loading conditions
for the Worcester region. Dead loads, live loads, and snow loads were established based
on the Massachusetts State Building Code to be used for design calculations.
WPI has repeatedly communicated their plan for a large amount of construction to
take place over the next 5 to 10 years, including the new construction and renovation of
athletic fields and facilities, administrative buildings, and housing facilities. WPI has also
expressed a desire to go green as seen through their efforts to obtain LEED certification
for the new Bartlett Center. Also, a new on-campus upperclassmen housing facility is

15
being planned for completion in fall 2008, and it too will be LEED silver certified.
LEED stands for Leadership in Energy and Environmental Design. The U.S. Green
Building Council is the organization that awards certifications. They also establish the list
of criteria that a building must comply with in order to be certified. Depending on how
compliant with the LEED criteria a building is, a different level of certification will be
awarded ranging from certified through silver, gold, and platinum. Because of this desire
to “go green”, we too are planning to include design options in our building that would
allow for LEED certification.

16
3. Methodology
To develop a design for the proposed dormitory, the permissible building envelope
was first established. This was defined through obtaining the plot plan and examining the
Worcester zoning bylaws which dictate set backs and height limitations: 15 feet from the
street, 10 feet for each side yard, and 50 feet height limit. This determined the building
dimension constraints. Knowing the available envelope and constraints, a footprint and
height restriction for the structure were established. From there, a typical apartment unit
was established. A single unit is composed of two floors with four bedrooms and a
bathroom upstairs. The kitchen, common room, and living area is located on the first
floor with an internal staircase linking the two floors. Each floor also has a portion of
community space available to all residents. These spaces are used for various activities
ranging from laundry service, computer labs, entertainment room, and study areas. This is
also where the central stair well and elevator services are housed. The total number of
units that fit within the permissible building envelope was determined to be 24 with a
total occupancy of 96 students.
Several different structural layouts were established to explore the costs of the
designs for the building. Each of these standard layouts were analyzed for gravity loads
using three design methods: steel, concrete, and a composite of steel and concrete. The
figures below illustrate the three main structural layouts that were analyzed.

17
Figure 3: Columns spaced 40'x20'
Figure 4: Columns spaced 20'x20'
Figure 5: Columns spaced 10'x20'

18
The uniform loading conditions for each of the three design methods analyzed are
consistent with the minimum load requirements stated in Massachusetts State Building
Code. The Code outlines minimum criteria for dead loads, live loads, and snow loads for
the region in which we are constructing as well as the type of building being built. These
loading conditions are outlined below in Tables 1 and 2.
Table 1: Common Dead Loads
Common Dead Loads Intensity Concrete 150 pcf
Movable Steel partitions 4 psf
Suspended Ceiling 2psf Hardwood Flooring 4 psf
MEP 5 psf Waterproofing 5 psf
Table 2: Common Live Loads
Common Live Loads Intensity Dwelling units 40 psf Public rooms 100 psf
Corridors 80 psf Snow Load 35 psf
Structural design and analysis studies were performed on the possible layouts
under each design material for a single, typical interior unit. All unit costs were
developed based on these analyses and the design requirements. This single unit
included the roof level and subsequent levels in one 40’x20’ column of rooms (a
stack of two apartments).
Following the initial designs for gravity loads and cost analyses of the various
layouts using the three design methods, one design layout and method was selected
for continued study and development. The criteria for selecting the best design
19
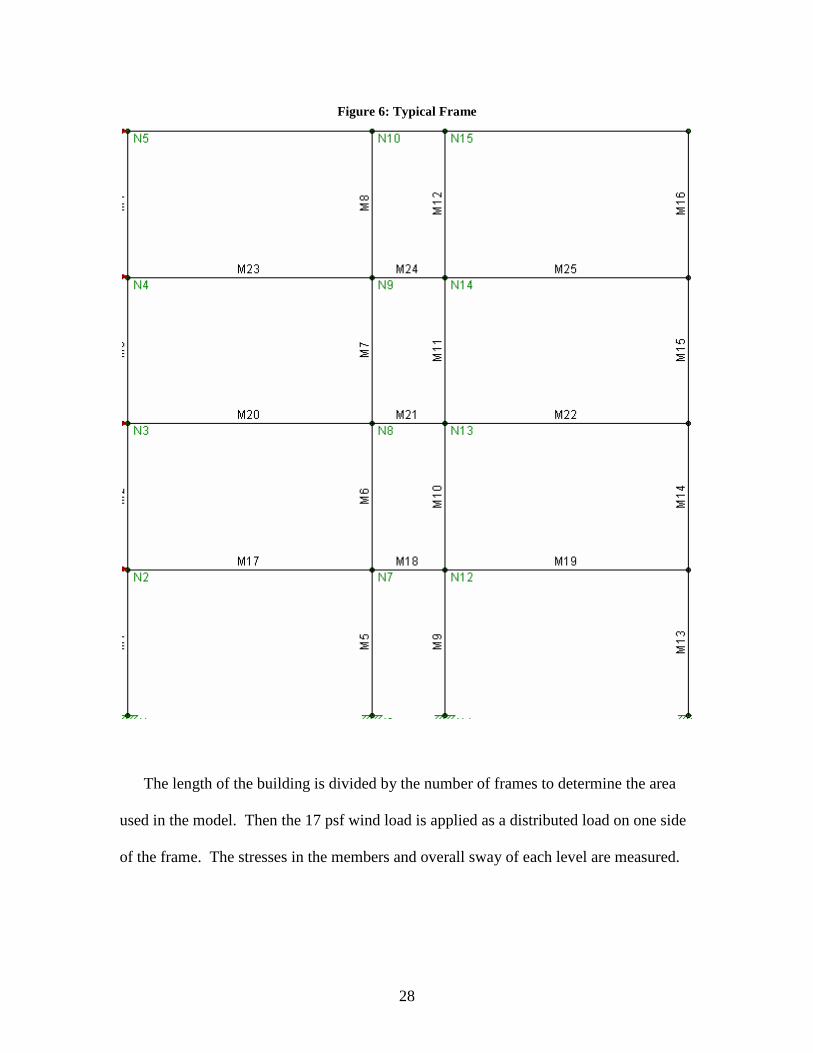
established: 36” or less between each floor of the building, the deflection of the floor
be less then the length of the span of the beam over 360 (L/360), and the method
selected would result in the lowest construction cost.
Using these three criteria, a method was selected to continue the analysis of lateral
loading and the atypical design areas. Risa 2D software was used to calculate the
effects of lateral loads on the building structure which were then compared to design
capacities of the structural frame. Following the lateral load analysis was the design
of the atypical areas within the floor plan for gravity loads. Sections 3.1 through 3.7
provide greater detail on the development and analysis of the building.

20
3.1. Design of Concrete Systems
The building was looked at with the consideration of being built using all reinforced
concrete for the structural beams, girders, and columns. The major factors that were used
as the guidelines for the design were the moments on each of the beams and girders and
the overall deflection of the members. The moments were calculated based on the live
loads and dead loads appropriate to the conditions of our building. The influence of the
spacing of the columns and the layout of the beams and girders was explored The
calculations for the size of the members were looked at for several different layouts and
the best design was selected based on criteria chosen by the group based on building
design codes. Our criteria were based on a floor height of no greater than 36”, a
deflection no greater than L/360, and the functional placement and sizes of both columns
and beams. However, there were certain assumptions that had to be made. For the sake
of this design, all members were assumed to be simply supported and the codes for
building were based on the ACI standards. Our textbook from Concrete follows
equations that are consistent with that of the ACI, and our concrete analysis was done
using these requirements.
The beams and girders were designed in a similar fashion. The positive and
negative moments in the beam were calculated so that the appropriate cross sectional
dimensions and reinforcing steel could be defined to support the loads. The positive
moment was determined in several steps. The flange width of the beams was found
based on the beam spacing. The next step was to determine the height of the T-Beam and
the appropriate location for the steel reinforcement in the web. The area of steel was

21
found and compared with the minimum area of steel required for our member. The
amount of steel in the design exceeded the minimum steel that was required. Next the
beam was checked to ensure that the flange was tension controlled. The flange was
tension controlled, and the moment was found based on the information in the previous
steps. The negative moment was found using the same steps, except that the sizes were
based on the web of the beam and not the flange in this case. The compression zone was
found in the base of the web and if the compression zone was able to withstand the forces
without demonstrating any failures based on the amount of steel selected for it, then the
final negative moment could be calculated.
The steps for computing the size and strength of the columns do not vary much
from the steps that were used in the beam process. The first step was to compute the
factored loads and moments (appendix A for example calculations) based on the dead and
live loads on each floor. A slightly different column size was used on each floor due to
the extra loads from the floors above. An alternative solution was to use the same size
column with varying amounts of rebar for each floor based on the design loads. This was
not used because the size of the columns did not affect the usable floor space. Next, the
column size was estimated and checked to see if the column was too slender for the given
loads. Slenderness is tested because some columns are often unable to withstand the
moments that are exerted on them and sometimes fail due to their length to thickness
ratio. This is why the column must be wider to resist this type of failure. If it was in fact
too slender, then the column would have failed. Next there was a check to determine if
the moments met the minimum moment requirements. From this step the EI was
calculated, where EI stands for the flexural stiffness of the column based on the steel

22
reinforcement in the column. Once this was found, the magnified moments on the
columns were determined. The ability of the columns to exceed the calculated moments
is what was ultimately important in ensuring safety in the system. They were designed to
be able to withstand the combined axial and bending loads without any structural failure.

23
3.2. Design of Structural Steel Systems
The steel design for the housing project was based on the LRFD method outlined in
the AISC Steel Construction Manual. The steel design was completed in three sections.
The first component was the design of the roof level. Second was the design of a typical
interior level. The third was the design of columns for the four levels in the structure.
The design loads for the roof were examined for different layout options. The layouts
in the roof level are similar to the layouts in the interior levels. Three different column
spacing scenarios were considered for the floor plan. Each of those scenarios were
further studied for various beam span and spacing options. Spreadsheets developed in
Excel assisted in repetitive calculations. Beams and girders were chosen from the list of
W-shape wide flange sections. For each scenario, the lightest shape that met both the
floor depth and deflection criteria was selected.
Column design followed similar steps to those taken during the beam and girder
design. The three column spacing alternatives were examined for one typical bay in the
structure. The tributary area carried by a column was the driving factor for the selection
of column sizes. Columns were selected on a level by level basis for a typical bay.
With the lightest girder, beam, and column selected for each respective scenario, the
different alternatives were compared to one another. The goal was to determine if using
multiple, smaller beams or if using fewer, larger beams provided the more cost effective
strategy. For all of the alternatives a cost estimate was generated for a typical bay
including the roof level, three interior levels, and all of the columns in the bay. A 5 inch
thick concrete slab was assumed to be in all scenarios and a differential cost estimate was

24
calculated. Although, each alternative was a viable option, the most economical solution
was preferred.

25
3.3. Design of Composite Steel and Concrete Systems The composite design was based on examples from McCormac and Nelson’s third edition
of Structural Steel Design using the LRFD method. Looking at the beam span and
spacing scenario’s outlined above, slab thickness was determined using the depth-span
ratio of L/24. If the ratio resulted in a slab larger than six inches that design scenario
would not work due to the limit of the available strength in flexure tables for composite
sections in the AISC design manual. This inadequacy of the table is due to the loading
conditions present in the building requiring relatively small beams in composite sections.
This also eliminated scenario’s that required beams spaced excessively far apart such as a
40 foot span spaced 20 feet apart.
When compatible scenarios were established based on the slab criteria, LRFD
analysis was done assuming unshored construction and assembly. Using this analysis, a
uniform beam and girder were designed for the roof and the roof loading conditions.
Additionally typical beams and girders are designed for the interior floors and their
respective loading conditions. As the spacing and span lengths of the beams and girders
were changed for each scenario, an effort was made to identify repeating loading
conditions throughout the structure as well as repeating requirements for certain W-shape
sections for those loads. In other words, as beam and girder spacing changed, scenario’s
would be repeated resulting in the same loading magnitudes on the same beam under
different placement options.
Following the completion of analysis and design for each design scenario, a cost
estimate was calculated based on tonnage of steel and cubic yards of concrete. The linear
footage of steel required by each scenario was determined, and the tonnage of steel

26
associated with that linear footage was calculated. In addition, the required cubic yards of
concrete was determined based on the required slab thickness for each scenario.
Ultimately the most effective scenario was determined by cost and the other criteria
outlined in the above sections.

27
3.4. Design of Lateral Load-resisting System
Once the economical structural system was determined, then lateral wind loads
were examined to determine the selected system is adequate. The intensity of the wind
load came from the Massachusetts State Building Codes for Zone 2 and Exposure B. For
a building less than 50 feet, the wind load is 17 pounds per square foot.
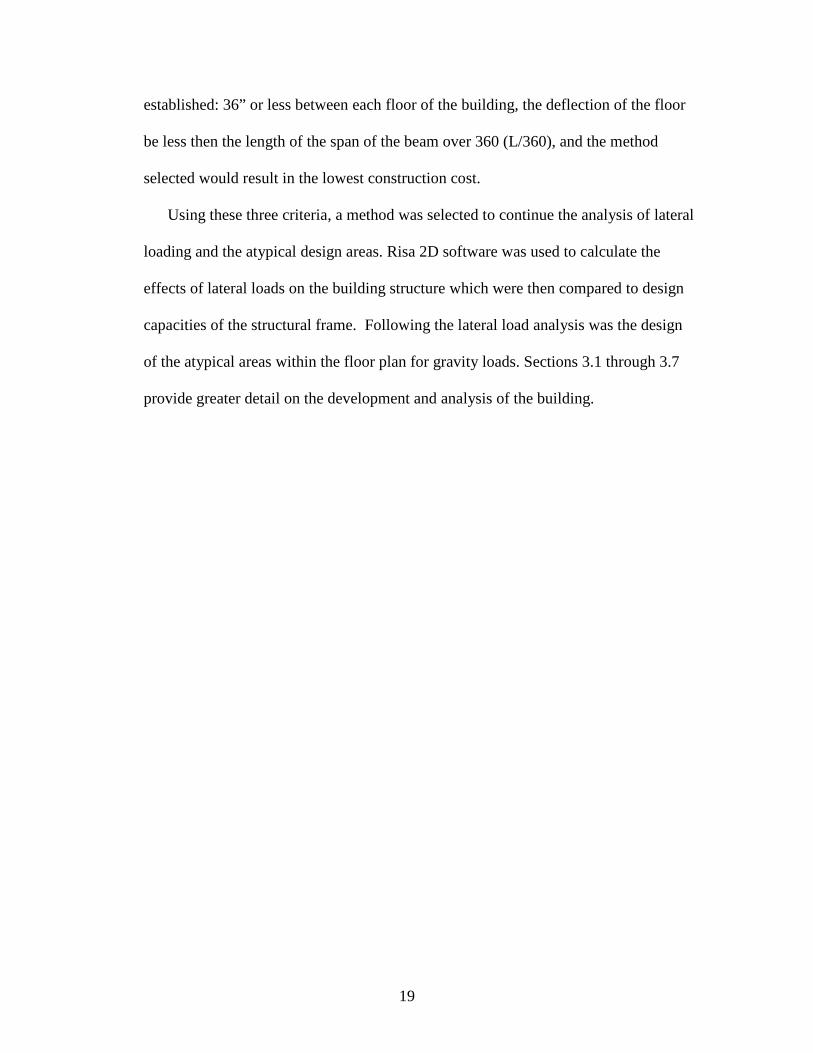
A common frame of the structure is modeled in RISA-2D Educational Version. A
typical frame includes 3 bays and 4 floors. Two of the bays are rooms and the center bay
is the hallway of the building. The room bays are 20 feet wide and the hallway is 6 feet
wide. Each column is 12 feet tall, with the total height of the building being 48 feet tall.
The figure below displays a side view of a typical frame.
28
Figure 6: Typical Frame
The length of the building is divided by the number of frames to determine the area
used in the model. Then the 17 psf wind load is applied as a distributed load on one side
of the frame. The stresses in the members and overall sway of each level are measured.

29
3.5. Design of Atypical Areas
With the designs of the typical units completed, a design for the lobby area and
corner of the residence hall was done. The method used to complete this design was
consistent with the design that proved to be the more economical option for the typical
unit. The design of the lobby and corner section of the building used a similar beam
spacing scheme used in the typical units. Below is a diagram showing the plan view of
the atypical corner of the residence hall.
Figure 7: Atypical Floor Plan

30
3.6. Development of Building Cost Estimates
The cost analysis of the building was structured around the 16 CSI building divisions,
so that the structural systems were broken down into their elements to help establish an
organized cost. The estimate was calculated, in some instances, on a square foot means
basis and others on a unit basis. The square foot estimates did not overlap with the unit
basis costs, because there were very few instances where the square foot cost approach
was used. The majority of the square foot cost was used to determine the electrical and
mechanical costs of systems within the building. The references used to create our cost
analysis were the RS MEANS publications from 2006 and 2007. In our estimate, the
costs for materials and labor were calculated based on predetermined figures in the RS
MEANS publications. Therefore the figures in our table reflect the overall cost of the
building with the labor cost factored in to the overall cost.
A table was constructed based on the 16 CSI divisions and cost estimates were
calculated for each individual division. General contracting fees and documents were all
included in their own division as well as the site work for the building. The other 14
divisions actually focused on the actual cost of the building. The information provided
by each division was useful in determining what amount of the total cost was subject to
each division. The major divisions such as electrical and mechanical had to be calculated
almost entirely from the Square Foot Costs book, due to the lack of working knowledge
of the typical items that are required for such complicated systems. In order for us to
create the most reasonable estimate we had to use the square foot approach. There were
several other items that required this type of analysis as well. Items such as the fire

31
proofing and water proofing were among a few of the other costs that were estimated on
the square foot basis.
The unit cost analysis of the building required more attention to detail. Using the
Interior Cost and the Building Construction Cost Data books we were able to breakdown
the costs for the remaining divisions. Most items such as furniture and basic accessories
could be added for the entire building so that there was a set number for each item.
Based on the price of one item we generated a cost for the total items in the building to a
fairly certain degree of accuracy. However, some of the quantities, such as drywall and
bricks, were over estimated to allow for a waste factor, making our assessment of the
building more accurate. Items such as nails and glue were not calculated directly because
the costs of these materials already assumed in all of the assemblies cost data.
The final step considered was the cost of the general requirements and fees for the
building. Contractor fees as well as architectural fees were an entire separate cost which,
according to 2006 Square Foot Cost Means book for a 4-7 story apartment building,
would reflect about 30-32% of the overall cost. Therefore, the cost for the building was
adjusted so that the cost for design and general requirements met this standard. Once this
was done, the overall cost was calculated.

32
3.7. Development of LEED Building Cost Estimate
Alternative costs for constructing a LEED certified and a LEED silver certified
building were generated. The United States Green Building Council recognizes
Leadership in Energy and Environmental Design (LEED) with various levels of building
certifications. There are a total of 69 available points in the new and on-campus
construction category, of those 25 to 32 points are needed for certification and 33 to 38
points are needed for silver certification.
A cost estimate for the building was calculated using the 16 CSI divisions as a
template. Using that template various costs were adjusted to recognize the cost of LEED
requirements. The points needed to achieve certification were met through either adding a
feature to the building, or changing a type of material, or modifying the way in which a
given material was used in construction. This adjustment in type of material being used in
the building or requirement of different features in the building altered the original
construction cost estimate of the dormitory.
The original cost estimate for the dormitory was based on conventional
construction methods. The cost for a LEED certified building and a LEED silver
building, included costs accrued through the replacement of some of the conventional
methods with more environmentally friendly or “green” construction methods.

33
4. Analysis
These sections include the results that were found when following the procedures set
out in the methodology sections. The concrete, steel, and composite designs were done
using three different column spacing layouts. For all of the options, a construction cost
estimate was calculated. The more economical option was then used to design the
atypical sections of the residence hall. With the structural system of the building
complete, a total construction cost estimate was determined. With the recent trend with
green engineering, a second cost was estimated to produce a LEED certified structure.
The following sections explain the results in more detail.

34
4.1. Analysis of Concrete Systems
The concrete design was based on several different column spacing options for each
of the typical 20’ x 40’ bay areas. Though there were many different beam and column
arrangements that could have been used, only three were chosen for investigation. One
of the major factors that influenced the design of the beams and columns was the desire
to place all of the columns only along the exterior walls of each dwelling unit to ensure
maximum usable floor space in the apartments. With this in mind, the final decision for
the best possible concrete design was based on the overall cost of the three structural
layouts.
The first of the three designs consisted of six columns that were spaced 20’ x 20’ over
the bay area. Each of the interior columns supported a tributary area of 400 sq ft. The
corner columns however were only subject to half of the tributary area that the interior
columns supported. The beams and girders were also 20’ long, and the beams were
spaced every 5’. This design consisted of nine beams and four girders for each unit in the
building.
Figure 8: Unit Design Layout 1
20’ x 40’ Area
20’ Beams (9)
20’ Girders (4)
6 Columns
The second design alternative investigated the effect of reducing the column spacing
to 10’ along the exterior walls of the unit. Each interior column in the layout also

35
supported a tributary area of 200 sq ft. The beams that connected the columns were 20’
long and also spaced at 10’ for this scenario. Finally, eight girders were designed to be
20’ long and connect all columns along the long sides of the bay. The addition of many
more columns was used to help reduce the overall size of the columns and beams.
Though there were many more pieces in this layout than in the first, we figured that there
would be considerably less material to limit the cost. The concrete used for the analysis
was a two way flat slab with a thickness of 5”.
Figure 9: Unit Layout Design 2
20’ x 40’ Area
10’ Girders (8)
20’ Beams (5)
10 Columns
The third layout was the most extreme. It consisted of only four columns placed in
each of the four corners of the 20’ x 40’ unit. Two girders were used to connect the
columns along the long side of the bay, making them 40’ in length. Finally, three beams
with a length of 20’ were spaced at 20’ to cover the area of the bay. The members that
were used in this scenario were very large in comparison to the two other alternatives.

36
Figure 10: Unit Layout Design 3
40’ x 20’ Area
20’ Beams (3)
40’ Girders (2)
4 Columns
2-Way Slabs supported by beams and girders
Once the designs of the slabs, beams, and columns for each of the three layouts were
determined, a cost assessment was made based on the total volume of material needed to
construct each of the designs. The cost estimate was made based one unit of the building
which was predetermined by the group as a measure for comparing alternatives. It was
decided that one unit was considered to be all four floors worth of material for the same
20’ x 40’ area of the building, or 3200 square feet of gross floor area. The size of the
columns changed for each floor, so a cost assessment was made by floor for each of the
three scenarios. The total cost was found based on the sum of the cost for each floor of
the unit. Figures for the cost of the materials were found in the R.S. Means Building
Construction Cost Data 64th Annual Edition 2007. The cost of steel reinforcement was
given in tons of steel and that for concrete was given in cubic yards of material. Once the
proper conversions were made to analyze each option, a final cost for each layout was
determined.
Table 1: Volume of Material (Cubic Inches)
Beam Girder Column TOTAL Scenario Concrete Steel Concrete Steel Concrete Steel Concrete Steel
1 8294400 69120 7188480 55680 500035 4542 15982915 129342 2 6220800 72000 7188480 23040 833392 7569 14242672 102609 3 5391360 100800 16404480 130560 434391 3946 22230231 235306

37
Table 2: Cost of Concrete by Volume
VOLUME COST in3 ft3 yard $150/yard
Layout Concrete Concrete Concrete Concrete 1 15982915 110992.5 4110.8 $616,625 2 14242672 98907.4 3663.2 $549,486 3 22230231 154376.6 5717.7 $857,648
Table 3: Cost of Steel by Weight
VOLUME WEIGHT COST in3 ft3 490lb/ft3 Tons $800/ton
Layout Steel Steel Steel Steel Steel 1 129342 898.2 440122.1 220.1 $176,049 2 102609 712.6 349155.6 174.6 $139,663 3 235306 1634.1 800694 400.3 $320,278
Table 4: Total Cost by Method
COST Concrete Steel Total TOTAL 1 411083.2 176048.8 587132 $587,000 2 366323.9 139662.3 505986.2 $506,000 3 571765.2 320277.6 892042.8 $892,000
Based on the cost of the material per unit volume, the second design proved to be the
best option for the concrete designs. Table 4 shows the overall cost for each situation.
The second layout requires the least amount of reinforcing steel and concrete. The lowest
cost for the typical areas of the building would be about $500,000 per unit or $156.00 per
square foot using this second approach.

38
4.2. Analysis of Structural Steel Systems
The steel designs were done following the LRFD method. Three different column
spacing options were investigated for a typical unit. The schemes were broken into three
column spacings, and those with multiple beam spacing alternatives were sub parts.
Earlier figures display the three different column spacings. These were examined to
determine if multiple, relatively lightweight beams would be a more cost efficient method
than a few, heavier beams.
The first column layout located a column only in the corners of one unit. This
spacing is 40 feet by 20 feet. For this scheme, the girders span 40 feet and the beams
span 20 feet. Design of the infill beams for this scheme involved the following spacings:
20 feet, 10 feet, and 5 feet. These options were designed for a typical roof level and a
typical interior floor level. Table 5 shows the results.
Table 5: Scheme 1 Results
Scheme Level Girder Spacing Beam
Roof W24x84 20 ft W14x53 1.1 Interior W24x84 20 ft W14x61
Roof W24x84 10 ft W12x40 1.2 Interior W24x84 10 ft W12x40
Roof W24x84 5 ft W10x26 1.3 Interior W24x84 5 ft W10x26
The second column layout investigated a column spacing of 20 feet, with a total
of 6 columns in a unit. Using this column spacing, girders and beams span 20 feet. The
beam spacings studied for this scheme are similar to those used in the previous scheme:
20 feet, 10 feet, and 5 feet. The following table summarizes the resulting beams and
girders for this scheme.

39
Table 6: Scheme 2 Results
Scheme Level Girder Spacing Beam
Roof W14x48 20 ft W14x53 2.1 Interior W14x48 20 ft W14x61
Roof W14x48 10 ft W12x40 2.2 Interior W14x48 10 ft W12x40
Roof W14x48 5 ft W10x26 2.3 Interior W14x48 5 ft W10x26
These results show that the beam sizes in this scheme are the same as those for the
first scheme. Since the loads, spans, and tributary areas are the same it would be
expected to find the same shape working for both schemes. As anticipated, the girders
are lighter in this scheme than the previous scheme because they span a shorter distance.
The third scheme has column spacing every 10 feet by 20 feet. This scheme has a
total of 10 columns in a typical unit. Girders span 20 feet and beams span 10 feet. The
following diagram displays the column spacings.
Figure 11: Column Spacing Option
10'
20'

40
With this configuration of columns, the two beam options are to have two beams
span 10 feet or to also include a beam in the center of the bay. The girders span the 20
foot distance between the columns. The following table has the results for these two
options.
Table 7: Scheme 3 Results
Scheme Level Girder Spacing Beam
Roof W10x26 20 ft W8x13 3.1 Interior W10x26 20 ft W8x15
Roof W10x26 10 ft W6x12 3.2 Interior W10x26 10 ft W6x12
With the beam and girder designs completed, the next step was to examine the
columns for those schemes. The given loads were in pounds per square foot; therefore,
the tributary area a column would carry determined its load. The first scheme resulted in
a tributary area of 400 square feet per column. Columns in the second scheme have a
tributary area of 100 square feet. The tributary area for columns in the third scheme is
100 square feet. Based on these areas, columns were designed for each level in the bay.
The columns are listed in the table below starting with the top level and proceeding
sequentially down towards the bottom.
Table 8: Column Design Results
400 ft2 200 ft2 100 ft2 W8x18 W6x12 W6x12 W6x20 W8x18 W6x12 W8x28 W5x19 W6x16 W10x33 W6x20 W8x18

41
In order to determine which of the several options has the lowest cost, the
marginal cost of each solution was estimated. In all of the schemes a 5-inch concrete
floor slab was assumed. Given the constant slab design, the marginal cost was simply the
cost of structural the steel. R.S. Means Building Construction Cost Data 64th Annual
Edition 2006 was used for estimating steel costs, and the cost data were given in dollars
per linear foot of member, which includes materials, labor, and equipment costs.
However, in some cases cost data for the specific members selected were not listed, and
so costs were interpolated between similar sizes of the same W-shape section. The total
cost of a scheme was broken into two parts, beams and columns. Tables showing the
calculations of girder, beam, and column costs can be found in the appendix A. The
following table summarizes the final costs by scheme.
Table 9: Structural Layout Costs
Structural Layout Scheme
Column Scheme Total Cost
1.1 1 $58,000 1.2 1 $61,000 1.3 1 $68,000
2.1 2 $46,000 2.2 2 $49,000 2.3 2 $56,000 3.1 3 $36,000 3.2 3 $39,000
Based on the cost results, Structural Layout Scheme 3.1 resulted in the most
economical solution at $36,000. It has columns spaced 10 feet by 20 feet and has beams
spaced 20 feet. This scheme has concrete on metal decking spanning the 10 feet between
girders. Its layout is in the figure below.

42
Figure 12: 10 ft Beam Spacing
20'
10'

43
4.3 Analysis of Composite Steel and Concrete Systems
Each beam and girder was sized based on LRFD and AISC design criteria, and
two loading conditions were considered, depending on the location of the particular
beam. One condition was used for the sizing of members in the roof, which were subject
to a dead load that was of different magnitude than that of the second condition which
was applied to a typical floor member. In addition the roof was not subject to any live
loads though it did have to be designed for snow load, which the members of the interior
floors would not be subject to. Thus the roof was designed to one condition of live loads
where the interior floors were designed to another condition of live loads. The same
design criteria and loading conditions were applied throughout each design scheme or
arrangement of beam and girder layouts.
Slab thickness was an important issue that became a limiting factor in the design
of the composite section. A span to thickness ratio of L/24, where L is equal to the largest
spacing between beams, was used to determine slab thickness for the different design
schemes. Three inches was added to each slab thickness to account for the corrugated
decking, which is three inches deep, used to form the concrete. Based on the slab
thickness criteria, the 40x20 spacing scheme was eliminated with a total slab thickness of
15 inches. The 20x20 spacing scheme resulted in an ultimate slab thickness of 9 inches.
These design schemes were eliminated based on their slab thickness requirements.
Generally, the largest slab that will allow use of the flexure strength tables in the
composite section of the AISC Steel Construction Manual is seven inches. This is based
on the calculated Y2 distance, which is the distance from the center of gravity of the

44
concrete flange force to the top flange of the beam. When this value exceeded seven
inches, as it did once the slab was greater then seven inches thick, the AISC Steel
Construction Manual no longer provided flexural strength values. Both of the schemes
mentioned above, exceed the slab thicknesses for which the table provides data.
The remaining schemes resulted in an ultimate slab thickness of 7 inches or less.
To maintain the rigidity of the floor, in addition to complying with reinforcement cover
requirements, a standard slab thickness of 6 inches was used for all remaining design
schemes calling for less than six inches of floor slab. This also helped ensure acceptable
floor deflections where a scheme called for a slab thickness less than six inches. The slab
thicknesses are outlined in table 10 below.
Table 10: Scheme to Slab Relationship
Scheme Layout Slab
Thickness 1 40x20 15 inches 2 20x20 9 inches
3 20x10 7 inches
4 20x5 6 inches
5 10x10 6 inches
6 10x5 6 inches
Schemes one and two were eliminated based on slab requirements and manual
limitations. Analysis continued on the remaining schemes, beginning with scheme three
and following through scheme six, staying consistent with the LRFD method. A typical
interior beam was analyzed followed by a floor girder in scheme three. As scheme three
has the largest span and also the largest spacing of the remaining schemes, resulting in
the largest tributary width, it carried the largest magnitude of dead and live loads. The
design moment for this scheme is 72.3 ft-kips. The moment capacity of a W10x12

45
composite beam is 140 ft-kips, almost twice as much as required. The W10x12 composite
beam is the smallest beam for which there are design values in the AISC Steel
Construction Manual.
Scheme three generates the largest magnitude of forces on a typical beam
and girder. As analysis continued on schemes four through six it became clear that the
magnitude of the forces on typical beams and girders decreased as the spans and spacing
were reduced. W10x12 composite beams were used for schemes three through six as the
design capacity of the composite beam was much higher than any of the calculated
capacities from gravity loads generated in the structure.
Each of the remaining design schemes all required use of the same size member
for both floor beams and girders. Determination of the most effective design was reduced
to identifying the scheme with the lowest cost. The design with the lowest amount of
linear footage of steel will be the most effective design within the composite section of
the design analysis. Based on Mean costs data, the price of steel for a W10x12 beam is
$22.50 per foot and the cost of concrete at $150/cy. Table 11 outlines the amount of steel
and concrete required for each scheme and a corresponding total cost for that scheme.
Table 11: Scheme Costs
Scheme Layout Slab Thickness Vol. of Concrete Cost of concrete Amount of Steel Cost of steel Total cost1 40x20 15 inches scheme not used scheme not used scheme not used scheme not used scheme not used
2 20x20 9 inches scheme not used scheme not used scheme not used scheme not used scheme not used
3 20x10 7 inches 70 c.y. $10,500.00 720 lf $16,200.00 $26,700.004 20x5 6 inches 60 c.y. $9,000.00 1040 lf $23,400.00 $32,400.005 10x10 6 inches 60 c.y. $9,000.00 880 lf $19,800.00 $28,800.006 10x5 6 inches 60 c.y. $9,000.00 1200 lf $27,000.00 $36,000.00
Based on the conditions outlined and cost of materials, the most effective
composite construction design would be the 20x10 design scheme. Although this scheme
has a slightly thicker floor slab resulting in a slightly higher cost of concrete the total cost

46
for a single unit under that scheme is still the lowest at a cost of $ 26,700.00. This value
does not take into account the cost of labor and equipment. In addition, the associated
costs of the columns are not reflected in the construction costs outlined in the above table.

47
4.4 Analysis of Lateral Load-resisting Systems
The selected structural system was the steel design. The member sizes and
column sizes were entered into RISA-2D Educational Version to determine sway and
member stresses. The allowable sway was less than H/500, where H is the height of the
level. For the 48 ft building the top floor maximum sway is 1.152 inches.
The first model did not meet the required sway, and revisions had to be made.
Originally a different column size was used on each floor. The revised model had the
same column size for the bottom two and another size for the top two columns. With
these changes, the resulting sway at the top floor was 1.15 inches. This is just below the
maximum allowed, but the serviceability of the building would not be constantly
subjected to such strong winds.

48
4.5 Analysis of Atypical Areas The designs for the lobby and corner section of the building were completed using
steel design. Since steel design was discovered to be the more cost efficient method and
the pattern of beams and girders was multiple, relatively light members, a similar style
was used to design the corner section of the building.
The design was broken down into four typical members by length and tributary
width. The longest girder spans 26 feet and has a tributary width of 13 feet. The longest
beam spans 26 feet and has a tributary width of 6 ½ feet. The design of these members
and the others was done using the same spreadsheets used in the typical unit design. The
following table displays the results found.
Table 12: Atypical Design Results
Roof Level Member Length Tributary
Width W-Shape A 26 6.5 W18x35 B 26 13 W21x44 C 20 5 W12x22 D 20 10 W16x26
Interior Floors Member Length
Tributary Width W-Shape
A 26 6.5 W18x40 B 26 13 W24x55 C 20 5 W14x26 D 20 10 W18x35
A cost was then determined for the atypical area. This followed the same method
used in the steel design section, costs per linear foot were found in RS Means Building
Construction Cost Data. The total construction cost estimate for the steel in the atypical
area was $106,000. This will be added to the total estimate of the building.

49
4.6 Analysis of Building Cost Estimates
The overall cost of the building was based on the sum of the prices obtained for
each of the 16 CSI divisions. The total cost was estimate to be just below $7,400,000 for
the entire project. This number represents the cost to build the project; it does not
represent the operating costs over time. Items such as electricity, heating, water, waste
disposal, and internet are not factored into the cost of the build. A breakdown of the
costs of each division as well as the percent of the cost for each division was made to
show where the money was being spent. Here is the breakdown for the cost of each
division.
Table 13: Overall Cost Analysis
DIVISION COST % Division 1 General Requirements 2326452 31.54
Division 2 Site Construction 66239.7 0.90
Division 3 Concrete 157713.1 2.14
Division 4 Masonry 220907.5 2.99
Division 5 Metals 860112 11.66
Division 6 Woods and Plastics 194432 2.64
Division 7 Thermal and Moisture Protection 640814.6 8.69
Division 8 Doors and Windows 159002.2 2.16
Division 9 Finishes 279738.6 3.79
Division 10 Specialties 23572 0.32
Division 11 Equipment 175778 2.38
Division 12 Furnishings 278356.8 3.77
Division 13 Special Construction 132795.4 1.80
Division 14 Conveying Systems 159900 2.17
Division 15 Mechanical 1262597 17.12
Division 16 Electrical 437752.7 5.93
TOTAL COST ($) $7,376,164 100.00

50
The following chart is a visual breakdown of how the money for the project
would be spent. The numbers for this chart are based on the percent of overall cost for
each division from Table 13. The overall cost of the building is $140 per square foot.
Our square foot cost is higher than the RS Means building cost of $125 per square foot.
Figure 13: Cost Breakdown by Division
Cost Analysis by Division
31%
1%
2%
3%12%3%9%2%
4%
0%
2%
4%
2%
2%
17%
6%
Division 1 General Requirements Division 2 Site Construction Division 3 Concrete
Division 4 Masonry Division 5 Metals Division 6 Woods and Plastics
Division 7 Thermal and Moisture Protection Division 8 Doors and Windows Division 9 Finishes
Division 10 Specialties Division 11 Equiptment Division 12 Furnishings
Division 13 Special Construction Division 14 Conveying Systems Division 15 Mechanical
Division 16 Electrical

51
4.7 Analysis of LEED Building Cost Estimate
LEED certification and LEED silver certification was achieved through minimal
adjustments to the current expected construction techniques and materials. As stated
in previous sections LEED certification requires a minimum of 25 points and silver
certification requires a minimum of 33 points. An original construction cost estimate
was developed using 16 CSI divisions and that estimate was adjusted to reflect LEED
construction requirements.
Very little investment was required in order to reach the minimum of 25 points
required for LEED certification. Although those 25 points may be considered “low
hanging fruit” they are an improvement in terms of environmental consideration.
Many of the available points that were obtained required no addition investment.
LEED certification can be reached simply by adding an additional $12,000 in
material cost to the original construction cost of the building. It is important to note
that the $12,000 additional construction cost does not include the cost of construction
and labor.
LEED silver certification can be achieved with a more considerable investment.
The 33 points required for silver certification would require an initial investment of
$225,634. This cost is in addition to the original construction cost outlined above.
Bringing the total additional original construction cost to $237.634. It is also
important to note that again, this cost does not include the cost of labor and
construction. The following table outlines the options used to obtain 33 points.

52
Table 13: LEED Silver Certification Options
LEED POINTS Bike Racks for 16 people 1
reducing heat island effect 1
reflective roof top 1
water use reduction by 30% 2
energy reduction 25% 3
10% renewable energy 2
ozone protection 1
CO2 detectors 1
low emmiting adhesives and sealants 1
paint and coatings 1
low emmiting carpet 1
motion detectors and operable windows 1
site selection 1
development density 1
alternative transportation 1
restoring open space 1 make sure that project manager is LEED accredited 1
recycling 75% of waste during construction 2
developing an indoor air quality flushing 1
5 carpool parking spaces 1
efficient angling of lights onto property 1
no irrigation system 2
reuse 5% building materials 1
using 10% recycled materials 2
certified wood 1
20% materials must come from within 500 miles 1
SILVER ACCREDITED TOTAL POINTS 33
Appendix C outlines in detail the options that were utilized to achieve the
minimum of 33 points required for silver certification and the costs associated with
those changes. The changes in building techniques and materials that were required to
reach the 33 point minimum for silver certification affected only five primary CSI
divisions. The divisions that were affected include: site construction, Equipment,
Special Construction, Mechanical, and Electrical.

53
Generally the additional investment required to achieve LEED certification, even
on a bare bones scale, is minimal considering the entire initial construction cost for
the building. However, achieving a higher certification standard would require some
innovative design techniques and a true dedication to “green” design from the ground
up. With some thoughtful and planned LEED construction practices put into place
from the outset of a project, LEED certification is an easy goal to obtain in almost
any project setting.

54
5 Conclusion
The goal of this project was to meet the needs expressed by WPI to encourage
more upperclassmen students to live on-campus. They would provide a much needed
leadership role that is currently lacking. A proposed solution was to design a new
apartment style residence hall. This residence hall can house 96 students in 24
apartments. Each student would receive their own bedroom and in each apartment there
is a kitchen, bathroom, and living room. Each apartment consists of two floors and the
residence hall stacks two apartments on top of each other for a total height of four floors.
The scope of the project was to design the building using the most economical structural
system, determine an estimated construction cost, and introduce a second option for a
LEED certified residence hall.
The design of the project began by comparing concrete, steel, and a composite of
the two materials. A typical stack of two apartments was designed and a cost was
associated with all of the different options. Based on those findings, the steel structural
system was selected and used to design the remainder of the building. Some key design
attributes include a building height of 48 feet and total livable area of 52,600 square feet.
Amenities in the building include a laundry room, study rooms, entertainment rooms, and
computer labs.
Using the steel structural system, a cost estimate of the project was determined.
The cost was estimated using RS Means in the 16 CSI divisions, and determined to be
$7.2 M. The square foot cost of the building was calculated to be $138. This is a
reasonable value considering RS Means overall building estimates for dorms are
55
$125/sqft. The expected cost increase for this project is because the RS Means value is
for a standard dormitory, which differs from the apartment style design.
LEED design options were also considered for the construction of the dormitory.
The effect of constructing the building to LEED Silver Certification increase the original
building cost by $250,000. This would result in only a marginal cost per square foot
increase.
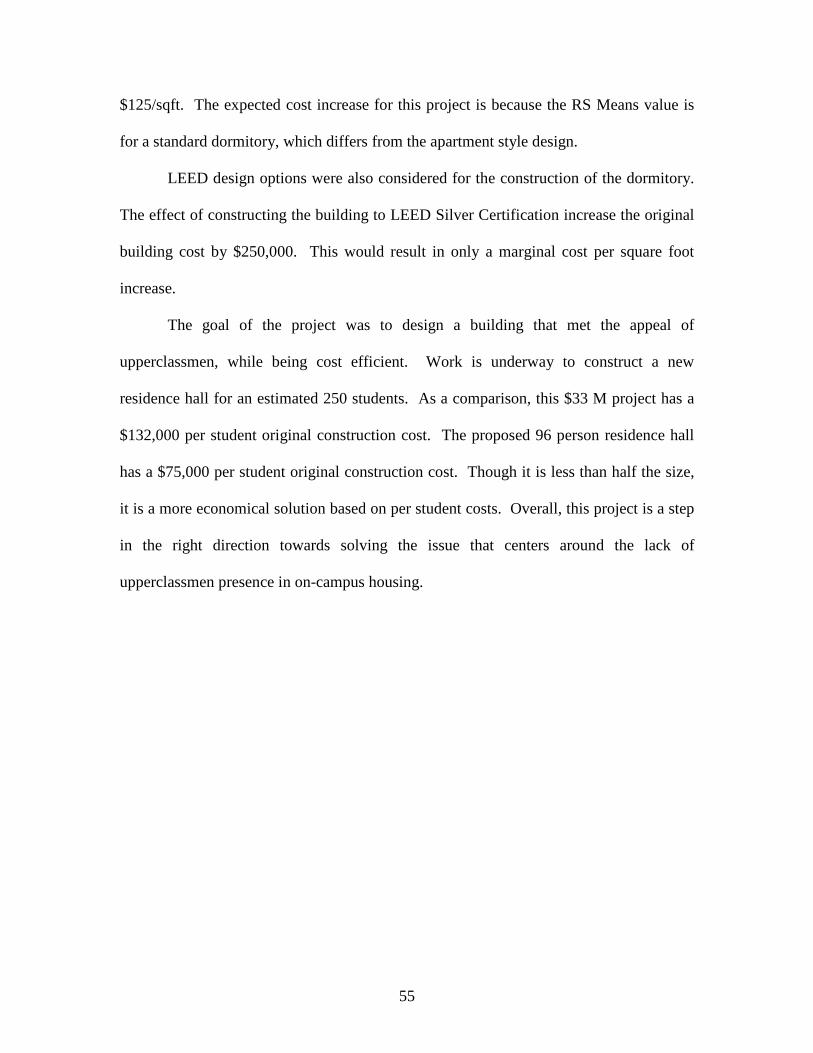
The goal of the project was to design a building that met the appeal of
upperclassmen, while being cost efficient. Work is underway to construct a new
residence hall for an estimated 250 students. As a comparison, this $33 M project has a
$132,000 per student original construction cost. The proposed 96 person residence hall
has a $75,000 per student original construction cost. Though it is less than half the size,
it is a more economical solution based on per student costs. Overall, this project is a step
in the right direction towards solving the issue that centers around the lack of
upperclassmen presence in on-campus housing.
56
I. Appendix
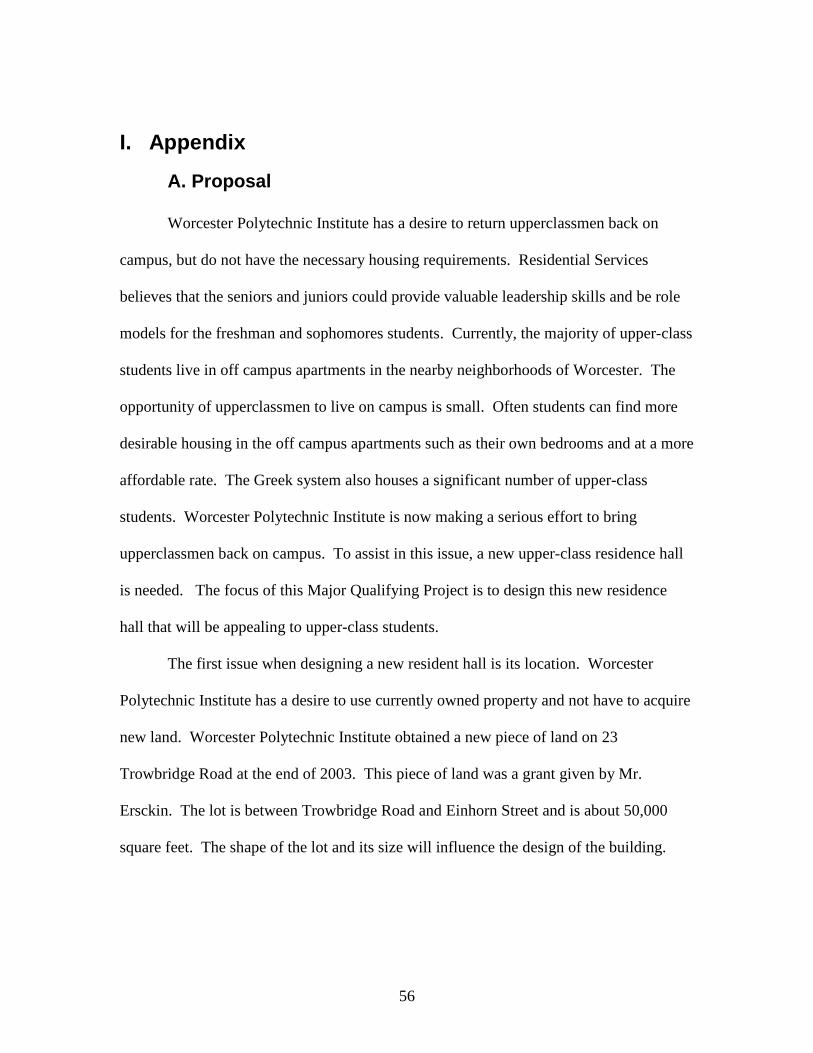
A. Proposal
Worcester Polytechnic Institute has a desire to return upperclassmen back on
campus, but do not have the necessary housing requirements. Residential Services
believes that the seniors and juniors could provide valuable leadership skills and be role
models for the freshman and sophomores students. Currently, the majority of upper-class
students live in off campus apartments in the nearby neighborhoods of Worcester. The
opportunity of upperclassmen to live on campus is small. Often students can find more
desirable housing in the off campus apartments such as their own bedrooms and at a more
affordable rate. The Greek system also houses a significant number of upper-class
students. Worcester Polytechnic Institute is now making a serious effort to bring
upperclassmen back on campus. To assist in this issue, a new upper-class residence hall
is needed. The focus of this Major Qualifying Project is to design this new residence
hall that will be appealing to upper-class students.
The first issue when designing a new resident hall is its location. Worcester
Polytechnic Institute has a desire to use currently owned property and not have to acquire
new land. Worcester Polytechnic Institute obtained a new piece of land on 23
Trowbridge Road at the end of 2003. This piece of land was a grant given by Mr.
Ersckin. The lot is between Trowbridge Road and Einhorn Street and is about 50,000
square feet. The shape of the lot and its size will influence the design of the building.

57
In an effort to fill Worcester Polytechnic Institute’s need for a new residence hall
and the availability of 23 Trowbridge, as the potential location for a future dormitory, this
Major Qualifying Project will design a building for this lot.

58
B. Structural System Design
Table 14: Roof Columns
Roof Column Loads 1 & 2 3 Snow Load 35 psf 35 psf DL waterproofing 5 psf 10 psf concrete 150 pcf 150 pcf 5 in 5 in 62.5 psf 62.5 psf suspended ceiling 2 psf 2 psf Total DL 69.5 psf 74.5 psf Column Trib. Area 200 sf 400 sf
Pu 139.4 psf 145.4 psf
Pu 27.88 kips 58.16 kips e 3 in 3 in
Mtop 6.97 ft-kips 14.54 ft-kips
e 2 in 2 in
Mbot 4.65 ft-kips 9.69 ft-kips
f'c 3000 psi 3000 psi Fy 50000 psi 50000 psi Pt 0.02 0.02 Ag(trial) 16.52 in2 34.47 in2
A assumed 100 in2 144 in2 k 1 1 Lu 12 feet 12 feet h 10 in 12 in r 3 in 3.6 in Slenderness Test Slender Slender min e 0.9 in 0.96 in Ec 3122018.58 psi 3122018.58 psi h 10 in 12 in b 10 in 12 in Ig 833.33 in4 1728 in4 Bd 0.60 0.61 EI 651121170 in2/lb 1336304794 in2/lb Cm 0.87 0.87 Pc 309.91 636.03
dns 0.98 0.99

59
check OK OK
Mc 6.86 ft-kips 14.35 ft-kips

60
Table 15: 3rd Floor Columns
LL 75 psf 75 psf DL 16 psf 16 psf MEP 10 psf 10 psf concrete 150 pcf 150 pcf 10 in 10 in 125 psf 125 psf suspended ceiling 4 psf 4 psf Total DL 155 psf 155 psf Column Trib. Area 200 sf 400 sf
Pu 306 psf 306 psf
Pu 61.2 kips 122.4 kips e 3 in 3 in
Mtop 15.3 ft-kips 30.6 ft-kips
e 2 in 2 in
Mbot 10.2 ft-kips 20.4 ft-kips
f'c 3000 psi 3000 psi Fy 50000 psi 50000 psi Pt 0.02 0.02 Ag(trial) 36.27 in2 72.53 in2
A assumed 144 in2 196 in2 k 1 1 Lu 12 feet 12 feet h 12 in 14 in r 3.6 in 4.2 in Slenderness Test Slender Slender min e 0.96 in 1.02 in Ec 3122018.58 psi 3122018.578 psi h 12 in 15 in b 12 in 14 in Ig 1728 in4 3201.33 in4 Bd 0.61 0.61 EI 1342132943 in2/lb 2486466971 in2/lb Cm 0.87 0.87 Pc 638.81 1183.47
dns 0.99 1.01 check OK OK
Mc 15.20 ft-kips 30.76 ft-kips

61
Table 16: 2nd Floor Columns
LL 115 psf 115 psf DL 24 psf 24 psf MEP 15 psf 15 psf concrete 150 pcf 150 pcf 15 in 15 in 187.5 psf 187.5 psf suspended ceiling 6 psf 6 psf Total DL 232.5 psf 232.5 psf Column Trib. Area 200 sf 400 sf
Pu 463 psf 463 psf
Pu 92.6 kips 185.2 kips e 3 in 3 in
Mtop 23.15 ft-kips 46.3 ft-kips e 2 in 2 in
Mbot 15.43 ft-kips 30.87 ft-kips f'c 3000 psi 3000 psi Fy 50000 psi 50000 psi Pt 0.015 0.015 Ag(trial) 54.87 in2 109.75 in2
A assumed 144 in2 196 in2 k 1 1 Lu 12 feet 12 feet h 12 in 14 in r 3.6 in 4.2 in Slenderness Test Slender Slender min e 0.96 in 1.02 in Ec 3122019 psi 3122019 psi h 14 in 16 in b 14 in 16 in Ig 3201.333 in4 5461.333 in4 Bd 0.60 0.60 EI 2.49E+09 in2/lb 4.26E+09 in2/lb Cm 0.87 0.87 Pc 1187.35 2025.56
dns 0.97 0.99 check OK OK Mc 22.39 ft-kips 45.70 ft-kips

62
Table 17: 1st Floor Columns
LL 155 psf 155 psf DL 32 psf 32 psf MEP 20 psf 20 psf concrete 150 pcf 150 pcf 20 in 20 in 250 psf 250 psf suspended ceiling 8 psf 8 psf Total DL 310 psf 310 psf Column Trib. Area 200 sf 400 sf
Pu 620 psf 620 psf
Pu 124 kips 248 kips e 3 in 3 in
Mtop 31 ft-kips 62 ft-kips e 2 in 2 in
Mbot 20.67 ft-kips 41.33 ft-kips f'c 3000 psi 3000 psi Fy 50000 psi 50000 psi Pt 0.02 0.02 Ag(trial) 73.48 in2 146.96 in2
A assumed 196 in2 196 in2 k 1 1 Lu 12 feet 12 feet h 14 in 14 in r 4.2 in 4.2 in Slenderness Test Slender Slender min e 1.02 in 1.02 in Ec 3122018.58 psi 3122018.6 psi h 16 in 17 in b 16 in 17 in Ig 5461.33 in4 6960.0833 in4 Bd 0.6 0.6 EI 4262596032 in2/lb 5.432E+09 in2/lb Cm 0.87 0.87 Pc 2028.85 2585.62
dns 0.94 0.99 check OK OK Mc 29.25 ft-kips 61.61 ft-kips

63
Table 18: Girder Loads
Girder Loading Roof Girder Loading Interior LL 35 psf LL 40 psf DL 69.5 DL 77.5 waterproofing 5 psf MEP 5 psf concrete 150 lb/cuft concrete 150 lb/cuft
concrete thickness 5 in
concrete thickness 5 in
suspended ceiling 2 psf
suspended ceiling 2 psf
steel partitions 4 psf Total Load 139.4 psf Flooring 4 psf
tributary width 10 ft Total Load 157 psf
length 40 ft tributary width 10 ft Moment 278.8 ft kips length 40 ft
Moment 314 ft kips
Table 19: Beam Loads
Beam Loading Roof Beam Loading Interior LL 35 psf LL 40 psf DL 69.5 DL 77.5 waterproofing 5 psf MEP 5 psf concrete 150 lb/cuft concrete 150 lb/cuft
concrete thickness 5 in
concrete thickness 5 in
suspended ceiling 2 psf
suspended ceiling 2 psf
steel partitions 4 psf Total Load 139.4 psf Flooring 4 psf
tributary width 20 ft Total Load 157 psf
length 20 ft tributary width 20 ft Moment 139.4 ft kips length 20 ft
Moment 157 ft kips

64
Table 20: Girder Design
Girders Girders Girders
Positive 1 Positive 2 Positive 3 Span Width 20 ft
Span Width 20 ft
Span Width 20 ft
b 5 ft b 5 ft b 5 ft h 18 in h 18 in h 36 in
As 1.5 in2 As 0.75 in2 As 2.75 in2 Fy 50000 psi Fy 50000 psi Fy 50000 psi f'c 3000 psi f'c 3000 psi f'c 3000 psi d 14.5 in d 14.5 in d 32.50 in dt 15.75 in dt 15.75 in dt 33.75 in a 0.49 in a 0.25 in a 0.90 in
As min 0.57 in2 As min 0.57 in2 As min 1.92 in2 As min 0.70 in2 As min 0.70 in2 As min 2.34 in2
bw 12 in bw 12 in bw 18.00 in s 0.9 s 0.9 s 0.90
sMn 80.18 kips sMn 40.44 kips sMn 330.52 kips Negative 1 Negative 2 Negative 3
b 12 in b 12 in b 18 in d 15.5 in d 15.5 in d 33.5 in dt 15.75 in dt 15.75 in dt 33.75 in a 3.47 in a 1.23 in a 6.26 in
As 2.125 in2 As 0.75 in2 As 5.75 in2 As min 0.61 in2 As min 0.61 in2 As min 1.98 in2 As min 0.74 in2 As min 0.74 in2 As min 2.41 in2
a/dt 0.22 a/dt 0.08 a/dt 0.19 .375b 0.32 .375b 0.32 .375b 0.32 s 0.9 s 0.90 s 0.90
sMn 81.79 kips sMn 32.03 kips sMn 320.60 kips

65
Table 21: Beam Design
Beams Beams Beams
Positive 1 Positive 2 Positive 3 Span Width 5 ft
Span Width 10 ft
Span Width 20 ft
b 1.25 ft b 2.5 ft b 5 ft h 18 in h 18 in h 18 in
As 1 in2 As 1.5 in2 As 3 in2 Fy 50000 psi Fy 50000 psi Fy 50000 psi f'c 3000 psi f'c 3000 psi f'c 3000 psi d 14.5 in d 14.5 in d 14.5 in dt 15.75 in dt 15.75 in dt 15.75 in a 1.31 in a 0.98 in a 0.98 in
As min 0.57 in2 As min 0.57 in2 As min 0.57 in2 As min 0.70 in2 As min 0.70 in2 As min 0.70 in2
bw 12 in bw 12.00 in bw 12.00 in s 0.9 s 0.90 s 0.90
sMn 51.92 kips sMn 78.81 kips sMn 157.61 kips
Negative 1 Negative 2 Negative 3 b 12 ft b 12 ft b 12 ft d 15.5 in d 15.5 in d 15.5 in dt 15.75 in dt 15.75 in dt 15.75 in a 1.63 in a 3.68 in a 9.40 in
As 1 in2 As 2.25 in2 As 5.75 in2 As min 0.61 in2 As min 0.61 in2 As min 0.61 in2 As min 0.74 in2 As min 0.74 in2 As min 0.74 in2
a/dt 0.10 a/dt 0.23 a/dt 0.60 .375b 0.32 .375b 0.32 .375b 0.32 s 0.9 s 0.90 s 0.90
sMn 41.94 kips sMn 85.74 kips sMn 157.46 kips

66
Table 22: Beam Design Volumes (Cu. Inch)
1 BEAMS
Floor # Length
(in) X Area (in2) Volume
As (in2) Vol As
Top 9 240 240 57600 2.00 480 3rd 9 240 240 57600 2.00 480 2nd 9 240 240 57600 2.00 480 1st 9 240 240 57600 2.00 480
TOTAL 36 230400 1920 8294400 69120 2 BEAMS
Floor # Length
(in) X Area (in2) Volume
As (in2) Vol As
Top 5 240 324 77760 3.75 900 3rd 5 240 324 77760 3.75 900 2nd 5 240 324 77760 3.75 900 1st 5 240 324 77760 3.75 900
TOTAL 20 311040 3600 6220800 72000 3 BEAMS
Floor # Length
(in) X Area (in2) Volume
As (in2) Vol As
Top 3 240 468 112320 8.75 2100 3rd 3 240 468 112320 8.75 2100 2nd 3 240 468 112320 8.75 2100 1st 3 240 468 112320 8.75 2100
TOTAL 12 449280 8400 5391360 100800

67
Table 23: Girder Design Volumes (Cu. Inch)
1 GIRDERS
Floor # Length X
Area Volume As Vol As Top 4 240 468 112320 3.63 870 3rd 4 240 468 112320 3.63 870 2nd 4 240 468 112320 3.63 870 1st 4 240 468 112320 3.63 870
TOTAL 16 449280 3480 7188480 55680
2 GIRDERS
Floor # Length X
Area Volume As Vol As Top 8 120 468 56160 1.50 180 3rd 8 120 468 56160 1.50 180 2nd 8 120 468 56160 1.50 180 1st 8 120 468 56160 1.50 180
TOTAL 32 224640 720 7188480 23040
3 GIRDERS
Floor # Length X
Area Volume As Vol As Top 2 480 1068 512640 8.50 4080 3rd 2 480 1068 512640 8.50 4080 2nd 2 480 1068 512640 8.50 4080 1st 2 480 1068 512640 8.50 4080
TOTAL 8 2050560 16320 16404480 130560

68
Table 24: Column Design Volumes (Cu. Inch)
1 Columns Concrete SteelFLOORS # Length (in) X Area (in2) Volume As (in2) Vol As Area Vol Total Vol Vol Total Vol
Top 6 144 100 14400 0.9 129.60 99.10 14270 85622 130 7783rd 6 144 144 20736 1.30 186.62 142.70 20549 123296 187 11202nd 6 144 144 20736 1.30 186.62 142.70 20549 123296 187 11201st 6 144 196 28224 1.76 254.02 194.24 27970 167820 254 1524
TOTAL 500035 4541
2 Columns Concrete SteelFLOORS # Length (in) X Area (in2) Volume As (in2) Vol As Area Vol Total Vol Vol Total Vol
Top 10 144 100 14400 0.90 129.60 99.10 14270 142704 130 12963rd 10 144 144 20736 1.30 186.62 142.70 20549 205494 187 18662nd 10 144 144 20736 1.30 186.62 142.70 20549 205494 187 18661st 10 144 196 28224 1.76 254.02 194.24 27970 279700 254 2540
TOTAL 833391 7569
3 Columns Concrete SteelFLOORS # Length (in) X Area (in2) Volume As (in2) Vol As Area Vol Total Vol Vol Total Vol
Top 4 144 144 20736 1.30 186.62 143 20549 82198 187 7463rd 4 144 196 28224 1.76 254.02 194 27970 111880 254 10162nd 4 144 196 28224 1.76 254.02 194 27970 111880 254 10161st 4 144 225 32400 2.03 291.60 223 32108 128434 292 1166
TOTAL 434391 3945

69
Table 25: Steel Interior Beam Design
Live Loads 40 psf 40 psf 40 psf 40 psf 40 psf 40 psfDLHardwood flooring 4 psf 4 psf 4 psf 4 psf 4 psf 4 psfMovable steel partitions 4 psf 4 psf 4 psf 4 psf 4 psf 4 psfMEP 5 psf 5 psf 5 psf 5 psf 5 psf 5 psfsuspended ceiling 2 psf 2 psf 2 psf 2 psf 2 psf 2 psfconcrete 150 pcf 150 pcf 150 pcf 150 pcf 150 pcf 150 pcf
5 in 5 in 5 in 5 in 5 in 5 in62.5 psf 62.5 psf 62.5 psf 62.5 psf 62.5 psf 62.5 psf
Total DL 68.5 psf 68.5 psf 68.5 psf 68.5 psf 68.5 psf 68.5 psfTributary Width 5 ft 5 ft 10 ft 20 ft 5 ft 10 ftBeam Length 20 ft 20 ft 20 ft 20 ft 10 ft 10 ftFy 50 ksi 50 ksi 50 ksi 50 ksi 50 ksi 50 ksiC1 161 161 161 161 161 161
wu 731 plf 731 plf 1462 plf 2924 plf 731 plf 1462 plf
Mu 36.55 ft-kips 36.55 ft-kips 73.1 ft-kips 146.2 ft-kips 9.1375 ft-kips 18.275 ft-kips
Zreqd 9.75 in39.75 in3
19.49 in338.99 in3
2.44 in34.87 in3
W10x19 W10x26 W12x40 W14x61 W6x12 W8x15depth 10 in 10 in 12 in 14 in 6 in 8 inweight 19 plf 26 plf 40 plf 61 plf 12 plf 15 plfZx 21.6 in3
31.3 in357 in3
102 in38.3 in3
13.6 in3
Ix 96.3 in4144 in4
307 in4640 in4
22.1 in448 in4
Wu 753.8 plf 762.2 plf 1510 plf 2997.2 plf 745.4 plf 1480 plf
Mu 37.69 ft-kips 38.11 ft-kips 75.5 ft-kips 149.86 ft-kips 9.3175 ft-kips 18.5 ft-kips
Zreqd 10.05 in310.16 in3
20.13 in339.96 in3
2.48 in34.93 in3
Zreqd < Zactual OK OK OK OK OK OK
∆ 0.97 in 0.66 in 0.61 in 0.58 in 0.26 in 0.24 in∆max 0.67 in 0.67 in 0.67 in 0.67 in 0.33 in 0.33 in
∆ < ∆max NO OK OK OK OK OK
Floor Depth 15.00 in 15.00 in 17.00 in 19.00 in 11.00 in 13.00 inDepth < 3ft OK OK OK OK OK OK
Checks FALSE OK OK OK OK OK
5 ft beam spacing 10 ft beam spacing10 ft beam
5 ft beam spacing 10 ft beam spacing 20 ft beam spacing20 ft beam

70
Table 26: Steel Roof Beam Design
Snow 35 psf 35 psf 35 psf 35 psf 35 psf 35 psf 35 psf 35 psfDLwaterproofing 5 psf 5 psf 5 psf 5 psf 5 psf 5 psf 5 psf 5 psfconcrete 150 pcf 150 pcf 150 pcf 150 pcf 150 pcf 150 pcf 150 pcf 150 pcf
5 in 5 in 5 in 5 in 5 in 5 in 5 in 5 in62.5 psf 62.5 psf 62.5 psf 62.5 psf 62.5 psf 62.5 psf 62.5 psf 62.5 psf
suspended ceiling 2 psf 2 psf 2 psf 2 psf 2 psf 2 psf 2 psf 2 psf
Total DL 69.5 psf 69.5 psf 69.5 psf 69.5 psf 69.5 psf 69.5 psf 69.5 psf 69.5 psfTributary Width 5 ft 5 ft 10 ft 10 ft 20 ft 5 ft 5 ft 10 ftBeam Length 20 ft 20 ft 20 ft 20 ft 20 ft 10 ft 10 ft 10 ftFy 50 ksi 50 ksi 50 ksi 50 ksi 50 ksi 50 ksi 50 ksi 50 ksiC1 161 161 161 161 161 161 161 161
wu 697 plf 697 plf 1394 plf 1394 plf 2788 plf 697 plf 697 plf 1394 plf
Mu 34.85 ft-kips 34.85 ft-kips 69.7 ft-kips 69.7 ft-kips 139.4 ft-kips 8.7125 ft-kips 8.7125 ft-kips 17.425 ft-kips
Zreqd 9.29 in39.29 in3
18.59 in318.59 in3
37.17 in32.32 in3
2.32 in34.65 in3
W10x26 W14x48 W12x40 W14x48 W14x53 W8x13 W6x12 W8x13depth 10 in 14 in 12 in 14 in 14 in 8 in 6 in 8 inweight 26 plf 48 plf 40 plf 48 plf 53 plf 13 plf 12 plf 13 plfZx 31.3 in3
78.4 in357 in3
78.4 in387.1 in3
11.4 in39.3 in3
11.4 in3
Ix 144 in4484 in4
307 in4484 in4
541 in439.6 in4
22.1 in439.6 in4
Wu 728.2 plf 754.6 plf 1442 plf 1452 plf 2852 plf 712.6 plf 711.4 plf 1409.6 plf
Mu 36.41 ft-kips 37.73 ft-kips 72.1 ft-kips 72.58 ft-kips 142.6 ft-kips 8.9075 ft-kips 8.8925 ft-kips 17.62 ft-kips
Zreqd 9.71 in310.06 in3
19.23 in319.35 in3
38.02 in32.38 in3
2.37 in34.70 in3
Zreqd < Zactual OK OK OK OK OK OK OK OK
∆ 0.63 in 0.19 in 0.58 in 0.37 in 0.65 in 0.14 in 0.25 in 0.28 in∆max 0.67 in 0.67 in 0.67 in 0.67 in 0.67 in 0.33 in 0.33 in 0.33 in
∆ < ∆max OK OK OK OK OK OK OK OK
Floor Depth 15.00 in 19.00 in 17.00 in 19.00 in 19.00 in 13.00 in 11.00 in 13.00 inDepth < 3ft OK OK OK OK OK OK OK OK
Checks OK OK OK OK OK OK OK OK
5 ft beam spacing10 ft beam
5 ft beam spacing20 ft beam

71
Table 27: Atypical Roof Design
Snow 35 psf 35 psf 35 psf 35 psfDL
Waterproofing 5 psf 5 psf 5 psf 5 psfsuspended ceiling 2 psf 2 psf 2 psf 2 psfconcrete 150 pcf 150 pcf 150 pcf 150 pcf
5 in 5 in 5 in 5 in62.5 psf 62.5 psf 62.5 psf 62.5 psf
Total DL 69.5 psf 69.5 psf 69.5 psf 69.5 psfTributary Width 6.5 ft 13 ft 5 ft 10 ftBeam Length 26 ft 26 ft 20 ft 20 ftFy 50 ksi 50 ksi 50 ksi 50 ksiC1 161 161 161 161
wu 906.1 plf 1812.2 plf 697 plf 1394 plf
Mu 76.56545 ft-kips 153.1309 ft-kips 34.85 ft-kips 69.7 ft-kips
Zreqd 20.42 in340.83 in3
9.29 in318.59 in3
W18x35 W21x44 W12x22 W16x26depth 18 in 21 in 12 in 16 inweight 35 plf 44 plf 22 plf 26 plfZx 66.5 in3
95.8 in329.3 in3
44.2 in3
Ix 510 in4847 in4
156 in4301 in4
Wu 948.1 plf 1865 plf 723.4 plf 1425.2 plf
Mu 80.11445 ft-kips 157.5925 ft-kips 36.17 ft-kips 71.26 ft-kips
Zreqd 21.36 in342.02 in3
9.65 in319.00 in3
Zreqd < Zactual OK OK OK OK
∆ 0.66 in 0.78 in 0.58 in 0.59 in∆max 0.87 in 0.87 in 0.67 in 0.67 in
∆ < ∆max OK OK OK OK
Floor Depth 23.00 in 26.00 in 17.00 in 21.00 inDepth < 3ft OK OK OK OK
Checks OK OK OK OK
Beam A Beam B Beam C Beam D

72
Table 28: Atypical Interior Level Design
Live Loads 80 psf 80 psf 80 psf 80 psfDLHardwood flooring 4 psf 4 psf 4 psf 4 psfMovable steel partitions 4 psf 4 psf 4 psf 4 psfMEP 5 psf 5 psf 5 psf 5 psfsuspended ceiling 2 psf 2 psf 2 psf 2 psfconcrete 150 pcf 150 pcf 150 pcf 150 pcf
5 in 5 in 5 in 5 in62.5 psf 62.5 psf 62.5 psf 62.5 psf
Total DL 77.5 psf 77.5 psf 77.5 psf 77.5 psfTributary Width 6.5 ft 13 ft 5 ft 10 ftBeam Length 26 ft 26 ft 20 ft 20 ftFy 50 ksi 50 ksi 50 ksi 50 ksiC1 161 161 161 161
wu 1436.5 plf 2873 plf 1105 plf 2210 plf
Mu 121.3843 ft-kips 242.7685 ft-kips 55.25 ft-kips 110.5 ft-kips
Zreqd 32.37 in364.74 in3
14.73 in329.47 in3
W18x40 W24x55 W14x26 W18x35depth 18 in 24 in 14 in 18 inweight 40 plf 55 plf 26 plf 35 plfZx 78.4 in3
135 in339.9 in3
66.5 in3
Ix 612 in41360 in4
243 in4510 in4
Wu 1484.5 plf 2939 plf 1136.2 plf 2252 plf
Mu 125.4403 ft-kips 248.3455 ft-kips 56.81 ft-kips 112.6 ft-kips
Zreqd 33.45 in366.23 in3
15.15 in330.03 in3
Zreqd < Zactual OK OK OK OK
∆ 0.86 in 0.77 in 0.58 in 0.55 in∆max 0.87 in 0.87 in 0.67 in 0.67 in
∆ < ∆max OK OK OK OK
Floor Depth 23.00 in 29.00 in 19.00 in 23.00 inDepth < 3ft OK OK OK OK
Checks OK OK OK OK
Beam A Beam B Beam C Beam D

73
MQP Concrete Beam Analysis a = shear span (in) As = area of nonprestressed tension reinforcement (in sq.) As min = b = effective compression flange width of T beam (in) bw = web width d = effective depth (in) dt = distance from extreme compression fiber to extreme tension steel (in) f’c = specified compressive strength of concrete (psi) fs = calculated stress in concrete at service loads (ksi) fy = specified yield strength of nonprestressed reinforcement (psi) @Mn = nominal factored moment strength
Positive Moment Capacity of Beam
1) Compute effective flange width, b. b cannot be greater than ¼ of the span width. So, 20’/4 = 5’ = 60” b = 60” 2) Compute d and dt. Assume h of beam = 20 in and *two layers of steel in the T beam d = h - 3.5 = 16.5 in d = 16.5 in dt calculation for 6 #6 bars dt = h – (1.5 + .375 +.75/2) = 17.75 in dt = 17.75 in

74
3) Compute a. a = As(fy) / .85(f’c)b = As based on 6 #6 bars and #3 stirrup and 2 #3 stirrup support bars a = 2.64 (50,000) / .85 (3,000) 60 = .8627 in a = .8627 in 4) Check As > or = As min As min = (3 sqrt (f’c)/ fy)(bw d) Assume 12” for the web width bw As min = (3 sqrt (3,000)/ 50,000) (12” x 16.5) = .65 in sq and As min = 200 bw (d) / fy As min = 200 (12)(16.5) / 50,000 = .79 in sq Since As = 2.64 it is greater than .79 in sq 5) Check whether fs = fy a / d = .8627 / 16.5 = .0523 a / dt = .8627 / 17.75 = .0486 tension controlled limit = .375(beta) = .319 pg 174 must check to see if .75Pb is OK ab/d = beta(87,000 / 87,000 + fy) = .85(87,000 / 137,000) = .5398
.75(.5398) = .4048 Since .0532 < .4048, P < Pb and OK
6) Compute @Mn @Mn = @(Asfy(d – a / 2)) = .90 ( 2.64 (50,000) ( 16.5 - .8627 / 2))) = 1,908,955 1,908,955 / 12,000 = 159.08 kips = @Mn

75
Negative Moment Capacity of Beam
1) Compute b. Since the compression zone is at the bottom of the t beam, the width of b = 12 in. b will be arbitrarily picked to be 12 in. b = 12 in 2) Compute d and dt Since there is only one layer of steel in the flange we can assume: d = h - 2.5 = 20 – 2.5 = 17.5 in 17.5 in = d dt = h – 2.25 = 20 – 2.25 = 17.75 in 17.75 in = dt 3) Compute a a = AsFy / .85 (f’c)b = As = 2 #3 stirrup support bars = pg 1054 = .73 in sq a = .73 (50,000) / .85 (3,000) 12 in = 1.19 in a = 1.19 in 4) Check As > or = As min As min = 3 sqrt(3,000) / 50,000 x 12(17.5) = .69 in sq
or 200b(d) / fy = 200 (12)(17.5) / 50,000 = .84 in sq because As = .73 in sq and is less than .84 in sq it is not OK As needs to be changed so that there is more steel with different bar combinations
3) Compute a again a = AsFy / .85 (f’c)b = As = 8 # 6 bars = 3.52 in sq a = 3.52 (50,000) / .85 (3,000) 12 in = 4.60 in a = 4.60 in

76
4) Check As > or = As min again As min = 3 sqrt(3,000) / 50,000 x 12(17.5) = .69 in sq
or 200b(d) / fy = 200 (12)(17.5) / 50,000 = .84 in sq because As = 3.52 in sq and is > .84 in sq it is OK
5) Check if Fs = Fy a / dt = 4.60 / 17.5 = .263 .375 beta = .319 Since .263 < .319 the section is tension controlled and the @ value = .90 6) Compute @ Mn @ Mn = @ [AsFy(d-a/2)] / 12,000 = .90 [3.52(50,000)(17.5 – 4.6 / 2)] / 12,000 = 200.64 ft – kips @ Mn = 200.64 ft - kips

77
Design of Slender Concrete Column
1) Compute the factored loads and moments and M1/M2.
Pu = 1.2DL + 1.6LL Pu = 1.2( ) + 1.6( ) = Moment @ top = M= Pu(e) M= Pu (3in/12in) = Moment @ bottom= M= Pu(e) M= Pu (2in/12in) =
2) Estimate the column size. Ag(trial) = Pu/.45(f’c + fy(Pt) Pt = assumed to be .015 due to 11-18a of reinforced concrete book

78
Ag(trial) = Pu/.45(3,000 + 50,000(.015) = By determining the cross sectional area here we can pick a size column that would be satisfactory for this situation.
3) Is the column slender? Klu / r < 34 – 12 (M1 / M2) We selected a column that is 12 x 12 so, K= 1.0 and r = .3h = .3 (12)= 3.6 in lu=column height Klu / r = 1.0 x 132 / 3.6 = 36.66 34 – 12 (M1 / M2) = ? if 36.66 exceeds the other number than the column is slender, but if there is a large difference, then the column may be too slender and inadequate 4) Check if the moments are minimum. ACI section 10.12.3.2 shows that the column be designed with a minimum eccentricity of .6 + .3h = 1.05 where h = 1.5 for some reason Check is good so use step 1 moments in design 5) Compute EI EI = .4 (Ec)Ig / 1 + Bd Ec = M@ top (sqrt(f’c)) = Ig = bh^3 / 12 = 15 (15)^3 / 12 = 4220 in ^4 Bd = factored dead load to total factored load Bd = 1.2 (DL) / total load EI = (Ec)Ig / 2.5(1 + Bd) = 6) Compute the Magnified Moment. Pg 554
Mc = dns(M2) dns = Cm / 1 – Pu / .75(Pc) and is greater than or = to 1.0 Cm= .6 + .4 (M1/M2) = Pc = Pi ^2 (EI) / Klu^2 = dns = between 1.75 and 2 then a large cross section should be selected

79
C. Cost Estimates
Table 29: Substructure Cost (Volume)
VOLUME (cu.
inches) Beam Girder Column TOTAL
Scenario Concrete Steel Concrete Steel Concrete Steel Concrete Steel 1 8294400 69120 7188480 55680 500035 4542 15982915 129342 2 6220800 72000 7188480 23040 833392 7569 14242672 102609 3 5391360 100800 16404480 130560 434391 3946 22230231 235306 VOLUME COST in3 ft3 yard $100/yard Layout Concrete Concrete Concrete Concrete 1 15982915 110992 4111 411083 2 14242672 98907 3663 366324 3 22230231 154377 5718 571765 VOLUME WEIGHT COST in3 ft3 490lb/ft3 Tons $800/ton Layout Steel Steel Steel Steel Steel 1 129342 898 440122 220 176049 2 102609 713 349156 175 139662 3 235306 1634 800694 400 320278 COST Concrete Steel Total TOTAL $ 1 411083 176049 587132 $587,000 2 366324 139662 505986 $506,000 3 571765 320278 892043 $892,000

80
Table 30: Cost Breakdown by CSI Division
Division 1 General Requirements SQ FT # Unit Cost Cost
1% Contractor Fees Requirements 10% 66878 668780
Overhead 5% 66878 334390 Profit 10% 66878 668780
Architect Fees Design Fees 7% 66878 468146
TOTAL 2140096
Division 2 Site Construction SQ FT # Unit Cost Cost
TOTAL Site Preparation 15000 0.22 3300
Basic Site Materials and Methods Site Remediation Site Preparation
Earthwork Utility Services
Drainage and Containment Bases, Ballasts, Pavements
Parking Lot- 6" Base, 2" Binder, 1" Topping 13560 2.04 27662.4 Side Walk- 4" Thick Concrete Broomed Finish 5696 3.85 21929.6
Curbs- Asphaltic 8" wide and 6" Tall 584 LF 2.55 1489.2 Planting
Site Restoration Loam and Top Soil 37 CY 53.5 1979.5
Grass- Sod 22200 445 9879 Landscaped Area *
TOTAL 66239.7
Division 3 Concrete SQ FT # Unit Cost Cost
Floor Slabs 869 CY 150 130350
Partial Basement Walls 4" Thick 248 61 15128 Standard Foundation w/ Footings 13156 0.93 12235.08
TOTAL 157713.1
Division 4 Masonry SQ FT # Unit Cost Cost

81
Brick and Mortar Exterior Walls 29376 7.52 220907.5
TOTAL 220907.5
Division 5 Metals SQ FT # Unit Cost Cost
Sub Structure *See Steel Section 538000
Metal Decking 52624 2 105248 Non Supporting Wall Studs 24' OC 144576 1.5 216864
TOTAL 860112
Division 6 Woods and Plastics SQ FT # Unit Cost Cost
Basic Woods and Plastics Materials and Methods
6052 Wall Cabinets 2 Bay 36" Wide 48 222 10656
Base Kitchen Cabinets 30" 24 256.5 6156 Trim Boards 16064 LF 0.57 9156.48
6090 Flooring Nails N/A
Sheet Metal Screws N/A Wood Screws N/A
Finish Carpentry 6220
Base Moldings Stock Pine LF 5176 2.67 13819.92 Ceiling Moldings Stock Pine LF 5176 1.66 8592.16
Door Moldings Pine Trim 72 60.95 4388.4 6270
Shelving - Book Cases 24 39.24 941.76 Architectural Woodwork
6410 4 drawer 27" wide 1/apt 24 286 6864
6415 Counter Tops Kitchen 7.25 LF 24 17.9 3114.6
Bathroom Counter Tops 2.5 LF 24 17.9 1074 Public Restroom Counter Tops 6 LF 2 17.9 214.8
6430 Railings 14.42 LF 24 59.29 20519.08
Brackets and Balusters * Stairs Prefabricated 13 24 9.15 2854.8
Stair Risers @ 8' (13) 13 24 340 106080
TOTAL 194432
Division 7 Thermal and Moisture Protection SQ FT # Unit Cost Cost

82
Basic Materials and Methods 7110
Water Proofed Portland Cement 52624 5.5 289432 7160
Cementitious Spray On Proofing 52624 2.97 156293.3 Thermal Protection
7210 Masonry Loose Fill Insulation 27456 0.82 22513.92
7220 Shingles, Roof Tiles, Roof Coverings
roof w/ metal joists and decking 13156 1 1.14 14997.84 roof coverings- tar and gravel w/ flashing 13156 1 0.72 9472.32
decking insulation 13156 1 0.64 8419.84 Roof Specialties and Accessories
7710 Downspouts 44 11 1.02 493.68 Drip Edge N/A
Elbows 22 5.86 128.92 Gutters 664 LF 0.7 464.8 7720
Snow Guards N/A Smoke Vent 2 1675 3350
Fire and Smoke Protection 7812
Spray On Fire Proofing 7840
Metallic Piping, Beams and Joists 30000 Beams Joists
Decking 52624 0.8 42099.2 Floor Slabs 52624 1.2 63148.8
Joint Sealers 7920
Caulking and Sealants N/A
TOTAL 640814.6
Division 8 Doors and Windows SQ FT # Unit Cost Cost
Metal Doors and Frames
8110 Steel Flush Full Panel Door Apt Exit 32 203 6496
Steel Insulated 4' x 8' Full Panel Doors Exits 9 233 2097 Wood and Plastic Doors
8210 Pre-Hung Wood Interior Doors Oak Face Interior 72 321 23112
Specialty Doors 8340
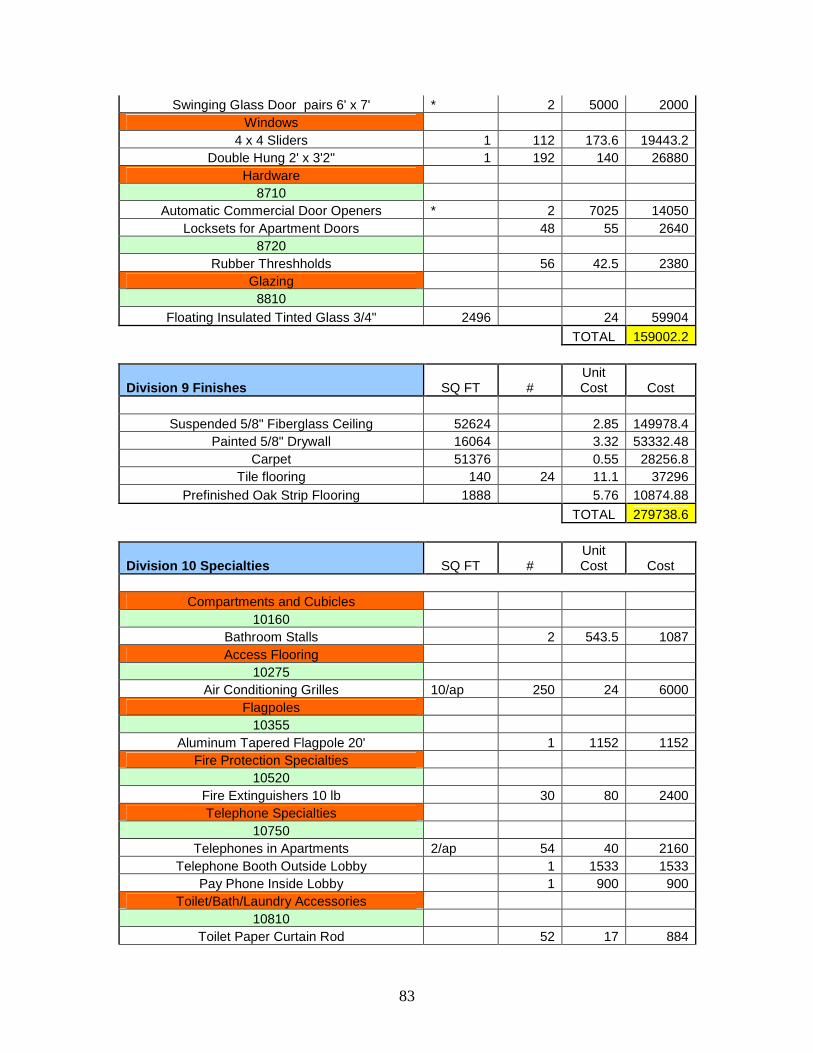
83
Swinging Glass Door pairs 6' x 7' * 2 5000 2000 Windows
4 x 4 Sliders 1 112 173.6 19443.2 Double Hung 2' x 3'2" 1 192 140 26880
Hardware 8710
Automatic Commercial Door Openers * 2 7025 14050 Locksets for Apartment Doors 48 55 2640
8720 Rubber Threshholds 56 42.5 2380
Glazing 8810
Floating Insulated Tinted Glass 3/4" 2496 24 59904
TOTAL 159002.2
Division 9 Finishes SQ FT # Unit Cost Cost
Suspended 5/8" Fiberglass Ceiling 52624 2.85 149978.4
Painted 5/8" Drywall 16064 3.32 53332.48 Carpet 51376 0.55 28256.8
Tile flooring 140 24 11.1 37296 Prefinished Oak Strip Flooring 1888 5.76 10874.88
TOTAL 279738.6
Division 10 Specialties SQ FT # Unit Cost Cost
Compartments and Cubicles
10160 Bathroom Stalls 2 543.5 1087 Access Flooring
10275 Air Conditioning Grilles 10/ap 250 24 6000
Flagpoles 10355
Aluminum Tapered Flagpole 20' 1 1152 1152 Fire Protection Specialties
10520 Fire Extinguishers 10 lb 30 80 2400 Telephone Specialties
10750 Telephones in Apartments 2/ap 54 40 2160
Telephone Booth Outside Lobby 1 1533 1533 Pay Phone Inside Lobby 1 900 900
Toilet/Bath/Laundry Accessories 10810
Toilet Paper Curtain Rod 52 17 884

84
Soap Dispenser Unit 4 54 216 Waste Receptacle Aug-72 80 50$/14$ 1408
Towel Holder 48 24 1152 Mirrors 28 60 1680 10820
Medicine Cabinet 24 89 2136 Wardrobe and Closet Specialties
10905 Wall Mounted Coat Rack 48 18 864
TOTAL 23572
Division 11 Equipment SQ FT # Unit Cost Cost
Commercial Laundry
11119 Commercial Washers 16 1325 21200
Commercial Double Stacked Dryers 8 6325 50600 Audio - Visual
11136 Projection Screen 25SF 1 840 840
Dolby Small Sound System 1 3185 3185 Solid Waste Handling
111790 Waste Compactor 3 CY 1 14225 14225
Fluid Waste and Disposal 11310
GRAVITY Food Service
11405 Freezer and Refrigerator 15.9 CF 24 860 20640
11420 GE JKP20 Electric Single Oven Bake 24 800 19200
Counter Top Stove 24 440 10560 11440
Dishwasher 2 Cycle 24 500 12000 Garbage Disposal 24 148 3552
Residential 11460
Unit Shower 24 824 19776
TOTAL 175778
Division 12 Furnishings SQ FT # Unit Cost Cost
Furnishings and Accessories
12460 Trash Recepticle 24 15 360

85
12483 Floor Mats 48 15 720
12492 Blinds 304 81 24624
Furniture 12510
Office Chairs 20 160 3200 Conference Chairs 2 172 344
12560 Oak Six Drawer Dresser 96 239 22944
Bed Side Tables 96 98 9408 Other
Kitchen Table 24 380 9120 4 Chairs 96 90 8640
3 Seater Sleeper Couches 48 150 7200 Futon 24 380 9120
Personal Oak Desks 96 679 65184 Leatherette Mid-Back Chair Desk Chairs 96 98 9408
Bathroom Vanities 30" 48 176.6 8476.8 Full Size Beds 96 400 38400 Bed Frames 96 89 8544
TV Stand 24 71 1704 Computer Lab Tables 6 360 2160
Computers 12 1500 18000 Printers 2 2400 4800
Vending Machines 10 2600 26000
TOTAL 278356.8
Division 13 Special Construction SQ FT # Unit Cost Cost
Security Access and Surveillance
13710 Card Access Control 9 350 3150 Detection and Alarm
13720 Master Box Fire Alarm 9 91 819
Smoke Detectors 147 127 18669 Fire Suppresion
13930 Sprinkler System Components 52624 1.73 91039.52
Stand Pipes 52624 0.33 17365.92 Other
Parking Signs 24 73 1752
TOTAL 132795.4
Division 14 Conveying Systems SQ FT # Unit Cost Cost

86
Elevators
Elevator System up to 50' 1 147900 147900 Interior Stairs- Concrete 36' 1 4000 4000
Exterior Stairs- Concrete 36', 10' wide 2 4000 8000
TOTAL 159900
Division 15 Mechanical SQ FT # Unit Cost Cost
Plumbing 52624 7.64 402047.4
Kitchen/Bathroom Service Fixture and Supplies Toilets 50 1110 55500 Urinals 2 1030 2060
Bathroom Sinks 52 1190 61880 Kitchen Sinks 24 970 23280 Water Coolers 5 244.5 1222.5
Domestic Water Distribution 52624 2.34 123140.2 Rain Water Drainage 13156 0.15 1973.4
Heating 52624 4.72 248385.3 Hot Water and Baseboard Radiation
Boilers Cooling
Chilled Water and Air Cooled System 52624 6.52 343108.5
TOTAL 1262597
Division 16 Electrical SQ FT # Unit Cost Cost
Service and Distribution
1600 Amp Service with Panel Boards and Feeders 52624 1.78 93670.72
Lighting and Power Light Fixture, Branch Wiring, Switches 52624 5.76 303114.2
Exterior Building Lights- Quartz 500 Watt 8 154 1232 Light Poles- 20' High 9 1550 13950
Special Electrical Alarm Systems and Emergency Lighting 52624 0.35 18418.4
Emergency Generator 52624 0.14 7367.36
TOTAL 437752.7

87
Table 31: Final Cost Analysis
DIVISION COST % Division 1 General Requirements 2326452 31.54
Division 2 Site Construction 66239.7 0.90
Division 3 Concrete 157713.1 2.14
Division 4 Masonry 220907.5 2.99
Division 5 Metals 860112 11.66
Division 6 Woods and Plastics 194432 2.64
Division 7 Thermal and Moisture Protection 640814.6 8.69
Division 8 Doors and Windows 159002.2 2.16
Division 9 Finishes 279738.6 3.79
Division 10 Specialties 23572 0.32
Division 11 Equipment 175778 2.38
Division 12 Furnishings 278356.8 3.77
Division 13 Special Construction 132795.4 1.80
Division 14 Conveying Systems 159900 2.17
Division 15 Mechanical 1262597 17.12
Division 16 Electrical 437752.7 5.93
TOTAL COST ($) $7,376,164 100.00

88
D. LEED Certification & Cost

89
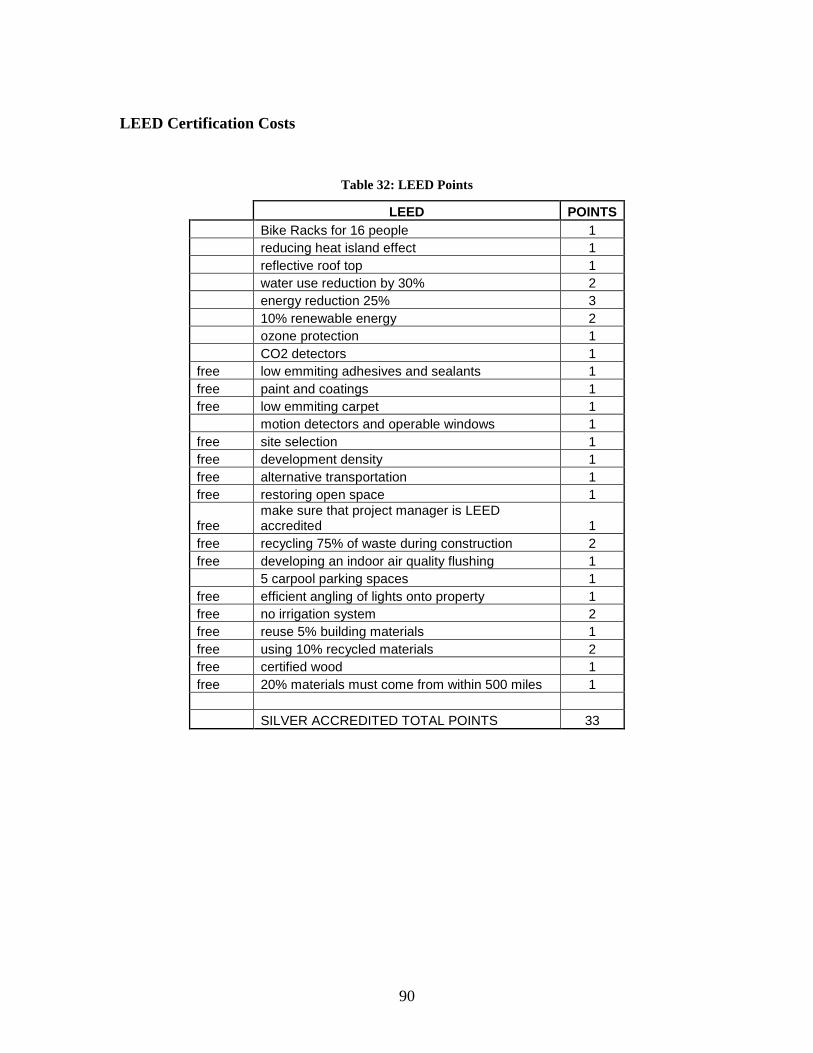
90
LEED Certification Costs
Table 32: LEED Points
LEED POINTS Bike Racks for 16 people 1 reducing heat island effect 1 reflective roof top 1 water use reduction by 30% 2 energy reduction 25% 3 10% renewable energy 2 ozone protection 1 CO2 detectors 1 free low emmiting adhesives and sealants 1 free paint and coatings 1 free low emmiting carpet 1 motion detectors and operable windows 1 free site selection 1 free development density 1 free alternative transportation 1 free restoring open space 1
free make sure that project manager is LEED accredited 1
free recycling 75% of waste during construction 2 free developing an indoor air quality flushing 1 5 carpool parking spaces 1 free efficient angling of lights onto property 1 free no irrigation system 2 free reuse 5% building materials 1 free using 10% recycled materials 2 free certified wood 1 free 20% materials must come from within 500 miles 1 SILVER ACCREDITED TOTAL POINTS 33

91
Table 33: LEED Cost Analysis
Cost # New $ Original $
TOTAL $ DIVISION
16 Person Bike Rack - 10' Rack 561 2 1122 0 1122 2 Reduce Heat Island Effect Roof- Light Colored Gravel
Pavement- Portland Cement Concrete 10" thick 4.94
13560 sf 66986.4 27662 39324 2
Water Use Reduction Kitchen Faucets 600 24 14400 4800 9600 15
Bathroom Faucets 250 52 13000 7280 5720 15 Toilets
Dishwasher 270 24 6480 12000 5520 11 Washer (clothes) NO COINS 760 16 12160 21200 9040 11
Shower Head 75 24 1800 960 840 15 10% Renewable Energy
Solar Panels 1000 20 20000 0 20000 13 Energy System Collector- Storage Tank 1125 1 1125 0 1125 13
Ozone Protection HVAC 14.12 52624 743220 591494 151726 15
Refrigerators- 18.4 cu ft 739 24 17736 20640 2904 11 Co2 Detectors 59.7 147 8776 0 8776 13
Low Emitting Adhesives and Sealants Low Emitting Paints and Coatings
Low Emitting Carpet Motion Detectors and Operating Windows 19.95 263 5249 0 5249 13
Energy Saving Light Bulbs 100 watt (12X) 8 500 4000 185 3815 16
Refrigerators- 18.4 cu ft Dish Washer
Washer (clothes) NO COINS Dryer (clothes) NO COINS 860 16 13760 6325 7435 11 5 Carpool Parking Spaces 73 5 365 0 365 13
COST 255098 SAVINGS 17464 TOTAL $ 237634

92
E. Lot Location Figure 14: Topographical Map

93
Figure 15: Floor Plan Layout

94
Figure 16: Site Plan Layout

95
References Fornier, D & Maves, M & Chapman, M & Chlarson, J & Eichel, A & Epsten D (2005, October) LEED-NC Application Guide for Multiple Buildings and On-Campus Building Projects. Retrieved February 4, 2007, from https://www.usgbc.org/ShowFile.aspx?DocumentID=1097 MacGregor, J. G., Wight J. K., (2005) Reinforced Concrete Mechanics and Design ( 4th ed.) New Jersey: Pearson Education, Inc., Upper Saddle River McCormac, J.C., & Nelson, Jr. J.K. (2003) Structural Steel Design, LRFD Method.
New Jersey: Upper Saddle River.
Oberlender, G.D. (2000) Project Management for Engineering and Construction. Second Edition. United States of America. Reed Construction Data Inc. (2007) RS Means Interior Cost Data.
24th Annual Edition. Massachusetts, Kingston Reed Construction Data Inc. (2007) RS Means Building Construction Cost Data.
65th Annual Edition. Massachusetts, Kingston Thornton, W. A, Holland, M. V., Barger, B. L., Carter, C. J., Cole, H. A., & Davis, B.
(December 2005) AISC Steel Construction Manual (13th ed.) Printed in the United States of America


