UPGRADING FROM SEAP TO SECAP FOR INTEGRATED CLIMATE ACTION ... · Comprehensive planning and...
32
1 UPGRADING FROM SEAP TO SECAP FOR INTEGRATED CLIMATE ACTION: A Quick Access Guide
Transcript of UPGRADING FROM SEAP TO SECAP FOR INTEGRATED CLIMATE ACTION ... · Comprehensive planning and...

1
UPGRADING FROM SEAP TO SECAP FOR INTEGRATED CLIMATE ACTION:
A Quick Access Guide

2
Deliverable number Compete4SECAP D5.4
Author Eleanor Chapman, George Stiff (ICLEI Europe)
Dissemination Level Public (PU)
Date 05.09.2019
Review Marika Rošā (Ekodoma)
José Pablo Delgado, Pilar Meseguer (EuroVértice)
Carsten Rothballer, Giorgia Rambelli, Alis-Daniela Torres (ICLEI Europe)
Design
Layout
Rebekka Dold (www.rebekkadold.de)
Valeria Eirin (ICLEI Europe)
Status Final
3
Contents
Key definitions 4
Abbreviations 6
1. Introduction 7
Together towards integrated climate action 7
Why use this guide? 8
Who is this guide for? 8
How do I use this guide? 8
2. From SEAP to SECAP: at a glance 9
What’s new? 9
What goes into a SECAP? 12
3. Comprehensive planning and implementation for climate action 14
Challenges for integrating adaptation and mitigation action 14
Setting up (or adapting) an organisational structure for your SECAP 18
Prioritising actions 22
Financing 24
4. Monitoring and Reporting on your SECAP 26
Why report? 26
5. What’s next? 29
Tools and resources 29
Further reading 30
Endnotes 31

4
Key definitions The majority of the definitions below derive from a glossary developed for the project RESIN – Climate Resilient Cities and Infrastructures, funded by the European Union’s Horizon 2020 research and innovation programme under grant agreement no. 653522. The original version can be found on the project website: www.resin-cities.eu/resources/deliverables.
Adaptive capacity
The ability of systems, institutions, humans, and other organisms to adjust to potential damage, to take advantage of opportunities, or to respond to consequences1.
Baseline Emission Inventory
The Baseline Emission Inventory (BEI) quantifies the amount of CO2 (and equivalents) emitted due to energy consumption in the territory of the Covenant signatory. It allows identifying the principal sources of emissions and their respective reduction potential2. To monitor progress towards reducing energy consumption and emissions, the BEI should be supplemented with regular Monitoring Emission Inventories (MEI). Covenant Signatories are required to do so at least every 4 years, though annual MEIs are recommended.
Climate projection
The simulated response of the climate system to a scenario of future emission or concentration of greenhouse gases and aerosols, generally derived using climate models3.
Co-benefits The positive effects that a policy or measure aimed at one objective might have on other objectives, irrespective of the net effect on overall social welfare. Co-benefits are often subject to uncertainty and depend on local circumstances and implementation practices, among other factors. Co-benefits are also referred to as ancillary benefits4.
Energy poverty
A household’s inability to run heating, cooling, lighting and other energy services that are safe, adequate to household needs and at an affordable cost. The EU Energy Poverty Observatory has defined four primary indicators of energy poverty: self-reported inability to pay utility bills on time, self-reported inability to keep home warm, a very low share of household expenditure on energy (below half the national median, also known as ‘hidden energy poverty’ as it may indicate under-consumption of energy), and a very high share of household expenditure on energy (more than twice the national median share, though some commentators advocate an alternative 10% indicator5)6. Energy poverty may be caused by low household income, high energy prices, inefficient energy performance in buildings, or a combination of all three.
Exposure The presence of people, livelihoods, species or ecosystems, environmental services and resources, infrastructure, or economic, social, or cultural assets in places that could be adversely affected7.
Hazard The potential occurrence of a natural or human-induced physical event or trend, or physical impact, that may cause loss of life, injury, or other health impacts, as well as damage and loss to property, infrastructure, livelihoods, service provision, and environmental resources (…) the term hazard usually refers to climate-related physical events or trends or their physical impacts8.
Impact The term impact is used primarily to refer to the effects on natural and human systems of extreme weather and events and of climate change. Impacts generally refer to effects on lives, livelihoods, health, ecosystems, economies, societies, cultures, services and infrastructure due to the interaction of climate changes of hazardous climate events occurring within a specific time period and the vulnerability of an exposed society or system. Note: Impacts are also sometimes referred to as consequences or outcomes9.

5
Impact chain Impact chains permit the structuring of cause - effect relationships between drivers and/or inhibitors affecting the vulnerability of a system. Impact chains allow for visualisation of interrelations and feedback, help to identify the key impacts, on which level they occur and which climate signals may lead to them. They further help to clarify and/or validate the objectives and the scope of a vulnerability assessment and are a useful tool to involve stakeholders10.
Mal-adaptation
Actions that may lead to increased risk of adverse climate-related outcomes, increased vulnerability to climate change, or diminished welfare, now or in the future11.
Resilience The capacity of a social-ecological system to cope with a hazardous event or disturbance, responding or reorganising in ways that maintain its essential function, identity, and structure, while also maintaining the capacity for adaptation, learning, and transformation12. While resilience is often closely associated with climate adaptation, it has important consequences for mitigation, too: reducing reliance on fossil fuels and making energy systems better able to withstand future shocks (such as from a critical depletion of natural resources) are important elements of a resilient society.
Risk The potential for consequences where something of value is at stake and where the outcome is uncertain, recognising the diversity of values. As part of a Risk and Vulnerability Assessment (for a SECAP), risk is often represented as the probability of occurrence of hazardous events or trends multiplied by the impacts if these events or trends occur. Risk results from the interaction of vulnerability, exposure, and hazard13..
Scenario A plausible description of how the future may develop based on a coherent and internally consistent set of assumptions about key driving forces (e.g. rate of technological change, prices) and relationships14.
Sensitivity The degree to which a system or species is affected, either adversely or beneficially, by climate variability or change. The effect may be direct … or indirect15.
Stressor Events and trends, often not climate-related, that have an important effect on the system exposed and can increase … climate related risk16.
Vulnerability The propensity or predisposition to be adversely affected. Vulnerability encompasses a variety of concepts including sensitivity or susceptibility to harm and lack of capacity to cope and adapt17.
Vulnerability index
A metric characterising the vulnerability of a system. A climate vulnerability index is typically derived by combining, with or without weighting, several indicators assumed to represent vulnerability18.

6
Abbreviations BEI: Baseline Emission Inventory
EnM(S): Energy Management (System)
(G)CoM: (Global) Covenant of Mayors for Climate and Energy
GHG: Greenhouse Gas
IPCC: Intergovernmental Panel on Climate Change
JRC: Joint Research Centre
MEI: Monitoring Emissions Inventory
RVA: Risk and Vulnerability Assessment
SEAP: Sustainable Energy Action Plan
SECAP: Sustainable Energy and Climate Action Plan

7
1. Introduction Together towards integrated climate action It is widely known that tackling climate change requires concerted efforts from the global community on two main fronts. While reducing and mitigating carbon emissions is essential to slow global warming, the effects of climate change are already with us in the form of an increasing incidence of extreme weather events and other worrisome trends, and suitable measures are needed to adapt. There are many intersections between mitigation and adaptation actions, however the two streams of climate action have so far evolved largely independently of each other, and the interactions between them remain under-explored. With this in mind, one goal of this guide is to inspire you to explore their overlaps yourself for integrated action in your own community.
In a related development, the Global Covenant of Mayors for Climate and Energy (GCoM), including all its global regions, has developed a new global Common Reporting Framework that brings together mitigation and adaptation planning, monitoring and reporting into a united format, and introduces a third focal point (or ‘pillar’) addressing energy poverty. These changes have the potential to support cities that have signed up to the CoM in moving to a more integrated approach to developing and implementing Climate Action Plans. European Signatories are now facing the challenge to upgrade their Sustainable Energy Action Plans (SEAPs) which targeted emissions-reduction, and turn them into Sustainable Energy and Climate Action Plans (SECAPs), by aligning with new emissions-reduction targets and timeframes, and integrating adaptation measuresi.
Earlier EU-CoM Signatories addressing only energy and climate change mitigation had committed to prepare and implement their SEAPs before 2020. However, since 2015, Signatories now pledge to prepare, implement, monitor and report on SECAPs, incorporating the following major components:
A framework to reduce CO2 and other greenhouse gas (GHG) emissions by at least 40% by 2030ii.
A strategy to adapt to the impacts of climate change affecting the area.
A comprehensive local action plan bringing together the above streams by outlining integrated measures, clear responsibilities, financing, etc. to achieve them.
Clear monitoring and reporting plans to ensure effective implementation.
Note: Earlier Signatories who committed to the previous 2020 CoM targets should still continue to monitor and report on their own progress to 2020, while nonetheless starting to report on 2030 targets, using the same baseline year as established for their own 2020 targets.
i So far adaptation action has lagged behind mitigation in Europe. As of 2018, the 8,800 Signatories of the EU-CoM had already developed 5,900 action plans – containing over 232,000 mitigation actions, but only 1340 adaptation actions. ii It is worth noting that cities are free to set more ambitious and/or longer term targets depending on their local realities. Crucial to setting appropriate targets are measurability, reliable local data and a sound scientific basis.

8
Why use this guide? This guide seeks to fill a gap in resources available for cities and regions seeking to upgrade a SEAP to a SECAP. It does so by providing a short-form, accessible overview of what goes into a SECAP, in the broader context of integrating adaptation and mitigation actions into sustainable energy and climate action planning processes.
Who is this guide for? This guide was developed primarily for local government practitioners working for EU-CoM Signatory cities, and consultants supporting them. It addresses in particular issues faced by cities that already have a SEAP in place, and need to make the leap to a SECAP. Nonetheless, any Signatory cities starting from scratch, as well as non-Signatory cities – not to mention experts working with them – may also find this guidance on integrated climate action useful, especially parts 3 and 5.
How do I use this guide? This guide is divided between advice to EU-CoM Signatories (parts 2 and 4) and broader advice on planning and implementing integrated climate action (parts 3 and 5). It purposefully aligns with the most recent GCoM global Common Reporting Framework and the forthcoming EU-CoM reporting template currently under development (yet to be released at the time of writing).
We adopt a particular focus on adaptation actions, given that this is a newer addition to the older CoM mitigation-oriented perspective, and has therefore received less attention. SECAP development is a complex undertaking, and one of the key takeaway messages here is that cross-departmental communication and collaboration is essential, especially given that the mitigation and adaptation streams in many cities have to date often been addressed in ‘silos’ (meaning separately in different departments working largely independently despite common goals). Aligning mitigation and adaptation planning makes sense, but in order to put it into practice, it becomes useful to look at the way interventions for each stream interact with and impact on the other. For this reason, examples of synergies between mitigation and adaptation actions from European cities have been collected and are distributed throughout the guide, along with the original source where you can find out more.
It’s quite likely that this guide won’t answer all your questions. Rather than being a one-stop shop, it should be seen as an entry point to get started on upgrading to a SECAP within a municipality, or as the basis for external consultants to support a municipal team. We’ve included references to Europe-wide resources – such as online tools, methods, further guidance documents and supporting case studies – so that you can explore the topic areas introduced here further.

9
2. From SEAP to SECAP: at a glance What’s new? The new Common Reporting Framework for the CoM on a global and regional level is based on three pillars for more comprehensive and inclusive climate action:
Mitigation: minimising GHG emissions from natural and human-caused processes (mandatory)
Adaptation: preparing for and overcoming the consequences of climate change (mandatory)
Energy poverty: ensuring reliable access to secure, affordable and sustainable energy (voluntary at the time of writing)
Below we look at what’s new in each of these areas.
Mitigation Reducing GHG emissions, whether through energy measures, renewables or other mitigation initiatives, was already at the core of SEAPs, and this focus still remains central for SECAPs. What’s new is that cities which have signed up to the EU-CoM since 2015 commit to a reduction of at least 40% GHG emissions target by 2030 (compared to the former target of 20% by 2020). Requirements for the mitigation section of a SECAP remain otherwise almost the same compared to a SEAP – therefore familiar concepts like baseline/monitoring emission inventories (BEI/MEI) remain, and the reporting template is still similar to before. Key differences include the addition of sub-sectors, the introduction of national and regional emissions factors, and a distinction between the purchase and sale of green electricity. Nonetheless, due to the higher GHG reduction target, it is still highly recommended that cities revise/replace existing mitigation measures, or even add new ones, in order to:
contribute effectively to these higher goals by delivering greater GHG savings,
align with the current EU and national energy and climate policy frameworks,
ensure their own eligibility for established and new funding mechanisms and support schemes,
take advantage of the best available technologies and investment instruments (e.g. Green Bonds) and
avoid the need for upgrades soon after projects are implemented.
In particular, EU legislation adopted in 2018 defines additional (voluntary) targets: improvement of energy efficiency by 32.5% and an increase of the renewable energy share to 32% by 2030, compared to business as usual19. At the same time, the EU’s strategy to achieve carbon neutrality by 2050, gives additional momentum for cities to adopt even more ambitious measures20.

10
TIP: Ambitious emissions reduction measures to be considered include:
deep renovation of buildings, including to positive energy levels,
optimisation and/or automation of control systems,
integration of city districts into smart grids,
ensuring that heating and cooling is supplied sustainably from nearby renewable and/or excess-heat sources (e.g. factories, data centres, wastewater treatment, metro stations etc.),
systematically extending pedestrian zones and introducing cycling superhighways,
widespread charging infrastructure for electric vehicles (EV) to complement public transport infrastructure,
innovative, mitigation-oriented land-use planning of carbon sinks, forests and agriculture,
and biogas capture from waste and wastewater treatment plants.
Adaptation Whereas SEAPs were not required to address climate change adaptation at all, SECAPs must do so. Unlike mitigation, adaptation has neither a unified ambition nor a quantitative threshold target, since appropriate actions will depend highly on local conditions. Similar to mitigation, however, an essential precursor to action is to establish a baseline, specifically through a Risk and Vulnerability Assessment (RVA).
As part of an RVA, Signatory cities shall identify relevant climate hazards, along with the level of risk and expected changes in intensity and frequency. Suggested indicators related to vulnerability and impact are already provided within the current reporting template, which also includes a scoreboard to self-assess progress towards your goalsiii.
Following the RVA, process requirements for a SECAP are similar to mitigation, with goals needing to be defined for adaptation, along with corresponding measures (e.g. a city greening programme) and timelines (whether short, medium or long term), and progress regularly assessed. Unlike for mitigation, where a timeline for actions is defined up to 2030, timelines for adaptation actions are not so explicitly prescribed and should be defined based on local circumstances and each measure concerned. Appropriate timelines for your context may depend on higher level goals, e.g. for Nationally Determined Contributions (NDCs), existing plans and strategies, and the time period necessary over which a particular measure can demonstrably effect a desired outcome iv.
TIP: The Urban Adaptation Support Tool provides extensive guidance on all phases of adaptation planning, aligned with the EU-CoM. The tool is a joint initiative of the EU-CoM and the European Environment Agency, part of the Climate-ADAPT platform.
iii Note that the reporting tool is currently under revision and a new version is expected in early 2020. iv Timelines for actions should not be confused with timelines for reporting (outlined in Part 4 of this guide).

11
Energy poverty In the near future, all CoM Signatories will also be required to define actions addressing the provision of equitable access to secure, affordable and sustainable energy, i.e. the avoidance of energy poverty (sometimes known as “fuel poverty”). Energy poverty can be defined as a household’s lack of access to energy services which are safe to use, adequate for their needs and reasonably affordable21. Affordability may be assessed using different indicators, e.g. spending more than 10% of household income on energy bills or spending more than twice the national median share22 (see also Definitions). In 2016, it was estimated that over 44 million people in Europe were unable to adequately heat their homes; equivalent to 8.7% of all households23. While most investigation of European energy poverty has so far focused on lighting, heating, cooling and running household appliances, more recently there have been calls to consider mobility also, such as proximity to public transport24.
Addressing energy poverty is essential to achieving a ‘just transition’25 as enshrined in the Paris Agreement and Sustainable Development Goal 7: Ensure access to affordable, reliable, sustainable and modern energy for all The shift from an extractive economy to one that is climate-resilient and low-carbon must avoid entrenching disadvantage among already-disadvantaged or vulnerable groups (such as the poor, elderly or single-parent households, predominantly led by women), or creating new hardships, and should be taken as an opportunity to redress existing inequalities. To this end, the European Commission launched its ‘Platform on coal regions in transition’26 in 2017, promoting dialogue on the future of over 40 regions across Europe actively engaged in coal mining to ensure these communities do not become stuck in energy-poor cycles. Similarly, ICLEI has established the Urban Transitions Alliance27 and European Sustainable Cities Platform to actively support transitions at the city and regional levels, including relevant linkages between energy, poverty and other societal issues.
In the context of SECAP development, cities and regions are called to determine whether energy poverty exists, and where relevant, to design a strategy to address the problem, by identifying who is affected and which actions will be taken to assist them. In order to facilitate Signatories’ work towards the integration of energy poverty actions in their SECAPs, the European Commission's science and knowledge service, the Joint Research Centre (JRC), poses three questions for authorities to consider:
Assessing energy poverty - Is my municipality affected by energy poverty?
Identifying vulnerable groups - Who are the most vulnerable groups in my municipality?
Designing actions - How can I design effective energy poverty actions?
TIP: At the time of writing, the EU-CoM approach to operationalising the GCoM’s energy poverty pillar remains under development. Further step-by step guidance will be made available by the EU-CoM Office in future as an annex to the guidebook ‘How to develop a SECAP’.
In the meantime, you can find some general information on the subject on the EU-CoM website or consult the European Commission’s EU Energy Poverty Observatory (EPOV) for more in-depth resources to guide you on the measurement and monitoring of energy poverty, and strategies to address it, including a guidance document.

12
What goes into a SECAP? Although there is no fixed format for precisely how a SECAP should look, if you are (or wish to become) a CoM Signatory it’s definitely worth aligning your SECAP with the EU-CoM reporting template, in order to make your later reporting obligations easier. The template includes the following sections:
Section Content
Strategy Covers the overall strategy, figures on the attribution of staff and financial capacities, and the identification of barriers to the implementation of (previous) actions.
GHG Emissions Inventory
Covers the amount of final energy consumption and associated GHG emissions by energy carrier and by sector in the monitoring year, including the results of the GHG emissions accounting processes, based on existing methodologiesv.
GHG emissions shall be reported from at least three main sectors, namely stationary energy, transportation, and waste. GHG emissions from Industrial Processes and Product Use (IPPU) and Agriculture, Forestry and Other Land Use (AFOLU) sectors (where these are significant) should also be reported. Finally, GHG emissions from upstream activities, such as material extraction, or other out-of-boundary sources, may be reported28.
Target Setting Includes the city-wide emissions reduction targets defined, considering eight parameters: 1) Boundary (geographic coverage, sectors, and GHGs); 2) Target type, 3) Target year, 4) Base year, 5) Ambition; 6) Units; 7) Use of transferable emissions and 8) Conditionality29.
Risk and Vulnerability Assessment
Captures the information that has been gathered to date on the climate vulnerabilities, hazards, and impacts, which are each broken down by sector.
Reporting on progress: mitigation and adaptation actions
Reports on the implementation status of key mitigation and adaptation actions. For adaptation, the EU-CoM requires at least three implemented or ongoing actions to be submitted as “Benchmarks of Excellence”vi. Reporting also includes an optional scoreboard for self-assessment against the steps of a planning and implementation cycle for adaptation.
Energy Poverty Plan
Covers the energy poverty or energy access plan (note: optional at the time of writing).
Table 1: Content of a SECAP – Monitoring and Reporting.
Source: Adapted from Table 1 - Content of the SECAP and monitoring templates (p. 5), in CoM Reporting Guidelines (July 2016). Available at: www.covenantofmayors.eu/IMG/pdf/Covenant_ReportingGuidelines.pdf
v For example, the Emission Inventory Guidance, used by the EU-CoM and/or the Global Protocol for Community-Scale Greenhouse Gas Emission Inventories (GPC), used previously by the Compact of Mayors. Both refer to the 2006 Intergovernmental Panel on Climate Change (IPCC) Guidelines for National Greenhouse Gas Inventories. See more detail in the 2018 GCoM Common Reporting Framework, available at www.globalcovenantofmayors.org/our-initiatives/data4cities/common-global-reporting-framework vi Benchmarks of Excellence are examples of completed or ongoing initiatives which Covenant signatories, Coordinators and Supporters would endorse as useful to be replicated by other local or regional authorities.

13
The JRC has created a suggested outline for the content of an effective SECAP. We’ve adapted it and highlighted new elements not required previously in SEAPs (coloured text) for the benefit of those cities familiar with SEAPs and upgrading to a SECAP (see Table 2). NOTE: Table 2 is provided for guidance only. It is not endorsed by the CoM or JRC, and may not align directly with the future CoM reporting template (under development at the time of writing).
Section title Content
(a) SECAP Executive Summary
(b) Strategy 1. Vision 2. Commitments both for mitigation and adaptation:
a. For mitigation, the SECAP document should clearly indicate the emission reduction target by 2030 (and possibly beyond) and clearly state the BEI year and the target type of reduction (i.e. absolute reduction or per capita reduction)7 b. For adaptation, the SECAP should include a certain number of adaptation goals coherent with the identified vulnerabilities, risks and hazards.
3. Coordination and organisational structures created/assigned 4. Staff capacity allocated 5. Involvement of stakeholders and citizens 6. Overall budget for implementation and financing sources 7. Implementation and Monitoring/Reporting process 8. Assessment of the Adaptation Options 9. Strategy in case of extreme climate events
(c) Baseline Emission Inventory (BEI) 1. Inventory year 2. Number of inhabitants in the inventory year 3. Emission factors approach (standard or LCA) 4. Emission reporting unit (CO2 or CO2-equivalent) 5. Responsible body/department (and main contact persons) 6. Detailed BEI results in terms of final energy consumption and GHG emissions If relevant, please also specify: 7. Inclusion of optional sectors and sources 8. Assumptions made, as well as references or tools used 9. Reference to the BEI report
(d) Climate Change Risk and Vulnerability Assessment (RVA)
1. Expected weather and climate hazards particularly relevant for the local area and/or wider region 2. Vulnerabilities of the local area and/or wider region 3. Expected climate impacts within the local area and/or wider region 4. Assets, processes and people at risk from climate change impacts
(e) Mitigation and adaptation actions and measures for the full duration of the plan (2030). Mitigation actions should be coherent with outcomes of the city’s BEI and cover a minimum of two of the four key sectors: Municipal, Tertiary, Residential and Transport. (Industry, Agricultural and Fisheries remain optional sectors). Adaptation actions should be coherent with outcomes of the city’s RVA.
For each measure/action, please specify (whenever possible): 1. Sector 2. Title 3. Description 4. Responsible department, (external) organisation and/or specific person as contact point 5. Timing (start/end dates and major milestones) 6. Stakeholders involved and/or advisory group 7. Cost estimation (upfront investment and longer-term running costs) 8. Indicators for monitoring/reporting purposes (will be different for mitigation or adaptation) 9. Action affecting adaptation, mitigation, or both? What type(s) of effect? For mitigation: Estimated energy savings and/or increased renewable energy production, by target year Estimated GHG reduction, by target year For adaptation: Expected impacts, vulnerabilities and risks tackled
(f) Energy poverty Include qualitative and quantitative information on: 1. Assessing energy poverty - Is my municipality affected by energy poverty situations? 2. Identifying vulnerable groups - Who are the groups in my municipality most vulnerable to energy poverty? 3. Designing actions - How can I design effective energy poverty actions?
Table 2: Suggested SECAP structure and content
Source: Adapted from Guidebook ‘How to develop a Sustainable Energy and Climate Action Plan (SECAP)’ – Part 1 (JRC, 2018). Available at: http://publications.jrc.ec.europa.eu/repository/bitstream/JRC112986/jrc112986_kj-na-29412-en-n.pdf.
7 An absolute reduction target based on emissions in the baseline year is a simple way to start. However, if reliable population projections are available, and if they indicate a substantial change in population by 2030, then a per capita reduction target should be defined to improve accuracy.
See more in section 2.4.5 of Guidebook 'How to develop a Sustainable Energy and Climate Action Plan (SECAP)' – Part 2 (JRC, 2018). Available at: http://publications.jrc.ec.europa.eu/repository/bitstream/JRC112986/jrc112986_kj-nb-29412-en-n.pdf
What’s new? NEW: SEAPs only required mitigation
commitments. Adaptation goals, proposed measures (‘options’) and an extreme weather
strategy are now required for SECAPs
NEW: The previous target was a 20% GHG reduction by 2020, now 40% is expected by 2030
What’s new? NEW: An RVA is an essential precursor to developing an adaptation strategy and a key new element not found in
SEAPs
What’s new? NEW: At least 3 actions must be defined for
adaptation, and their interactions with mitigation actions should be adequately
explored to discover synergies, co-benefits and/or trade-offs
What’s new?
Coming soon!

14
TIP: Both for mitigation and for adaptation, the level of detail in the description of each measure/action is to be decided by the local authority according to expected results and the availability/quality of data.However, bear in mind that the SECAP is at the same time a:
working instrument to be used during implementation (at least for the next few years),
communication tool towards stakeholders announcing the city’s intentions, and
document that is agreed at the political level by the various parties in charge within the local authority – therefore the details should be sufficient to avoid further discussion in the City Council over the precise meaning and scope of the various measures.30
3. Comprehensive planning and implementation for climate action
Challenges for integrating adaptation and mitigation action While there are many good reasons to integrate planning for adaptation and mitigation action with each other, several barriers continue to exist for doing so. One barrier is the different levels at which impacts and benefits are felt. For mitigation, emissions-reduction requires collective action at all levels of government, with reduced emissions in one country potentially benefiting others, while the benefits of adaptation action tend to accumulate at the local level in response to local interventions. Another is the different entry points and policy frameworks involved – mitigation actions can be more readily contained in plans dedicated to energy management, while adaptation is better understood as a cross-cutting area to be ‘mainstreamed’ or integrated into plans across a range of sectors31.
Climate mitigation has been already established for some time as an area of action and its scope is relatively established and well-definedviii, with an inherent sectoral focus (on energy production and consumption). Since GHG emissions are quantifiable, progress towards their reduction is also reasonably straightforward to monitor. Climate adaptation, by contrast, is a newer field of action (formally established in Europe in 2013 with the adoption of the EU Adaptation Strategy) that inherently cuts across sectors. At a city level, this means it offers great potential for integration, because effective adaptation action requires the involvement of many different departments and disciplines. However, adaptation also entails a large degree of uncertainty, given that it deals with projected risks and avoidance of negative consequences. This makes impacts difficult to measure.
Finally, within a city administration, responsibilities for mitigation and adaptation are likely to belong to staff in different departments. This means that disciplinary silos need to be bridged in order to bring the two streams together, which may demand changes to inter-departmental dynamics and working processes. Understanding both streams of action as part of a shared, iterative planning cycle can support a more collaborative approach, where planning and implementation are not undertaken independently, but instead efforts made to actively align them. This makes it more likely that interactions between strategies for adaptation and those for mitigation will be picked up and jointly addressed during planning – whether in the form of trade-offs, conflicts, co-benefits or synergies – thereby increasing the effectiveness of the resulting integrated climate plan, and demonstrating opportunities to achieve multiple political wins.
viii For example, the Global Protocol for Community-Scale Greenhouse Gas Emission Inventories (GPC) has been established
since 2011, as a global reporting standard to help cities and communities consistently measure and report GHG
emissions. See more at http://old.iclei.org/activities/agendas/low-carbon-city/gpc.html

15
EXAMPLE 1: ADAPTING OVERHEAD LINES TO COPE WITH INCREASING TEMPERATURES, UK
Region: 55,500 km2 service area in the UK Policy Instruments: Public procurement; Design standards Sectors: Disaster/Risk reduction; Energy
Background: Rising temperatures pose a threat to energy transmission and distribution operators, impacting power lines by reducing their thermal rating (i.e. the maximum current allowed at a given temperature) and causing lines to expand and sag. This may result in power shortages, revenue losses and increased probability of contact with adjacent elements (which increases risks of electrocution and fire). Thanks to a study conducted by the UK Met Office (which identified climate change impacts in the energy generation, transmission and distribution of energy), key power distribution and energy network actors have started to address this issue by increasing the rated design temperature standard of overhead lines. Image: Stephan Köhler
Response:
Increase height of poles supporting power lines (by 0.5 meters to maximise the cost-effectiveness of the measure).
Installation of conductors with higher-temperature operating limits.
Implementation of the use of ‘low-sag’ conductors.
Results:
Rated design temperature of wood used in newly installed pole overhead lines has increased from 50°C to 55°C.
Measures undertaken without necessitating any increases in user fees.
Expectations that this investment will improve overall network resilience at a minimum cost.
Implementation of new design standards is an ongoing, proactive process.
Costs and Funding:
The costs of procuring wooden overhead poles 0.5 metres taller depend on the height of the original pole, but they can be as little as around £10 (ca €11) per pole.
Interactions between mitigation and adaptation:
Adaptation measures directly applied to energy infrastructure may lead to decreased hazards, such as electrocution and fire, as well as a reduction of power shortages and lower economic losses.
Sources: https://climate-adapt.eea.europa.eu/metadata/case-studies/adapting-overhead-lines-in-response-to-increasing-temperatures-in-uk/#challenges_anchor www.ouranos.ca/publication-scientifique/Case-Study-9-AN-final.pdf

16
Planning and implementation cycle
At the time of writing, the reporting template and guidance provided by the EU-CoM does not include an integrated planning cycle covering both mitigation and adaptation, although it does follow a broad cycle of three phases applicable to both streams (see Figure 1).
Figure 1: The EU-CoM SECAP implementation, monitoring and reporting cycle
Source: Covenant of Mayors for Climate and Energy – Europe Office.
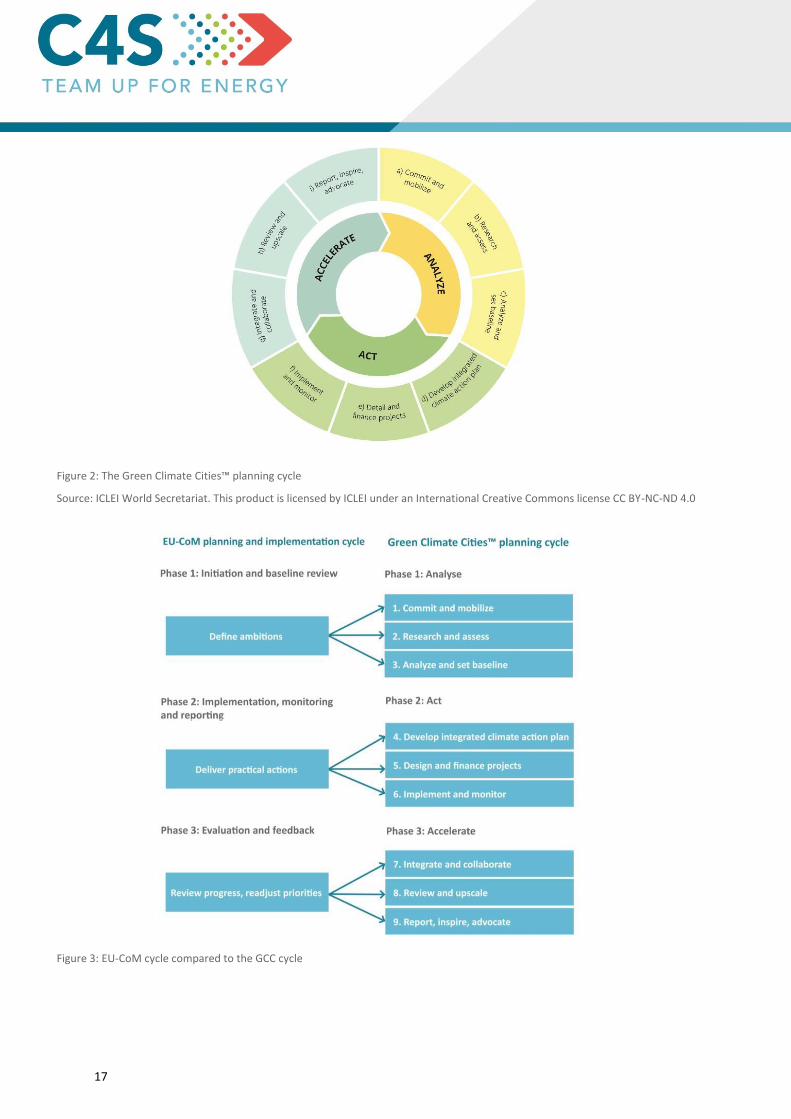
Also worth noting is ICLEI’s Green Climate Cities™ (GCC) framework, which promotes the development of integrated climate action plans (including SECAPs) through a cycle broken down into nine steps (see Figure 2). While the GCC cycle includes more steps than the CoM’s, they are broadly compatible with one another and plenty of overlap can be found, as indicated below in Figure 3.
17
Figure 2: The Green Climate Cities™ planning cycle
Source: ICLEI World Secretariat. This product is licensed by ICLEI under an International Creative Commons license CC BY-NC-ND 4.0
Figure 3: EU-CoM cycle compared to the GCC cycle
18
Regardless of which methodology used, coordinated action remains crucial to ensure that efforts in one department or sector do not inadvertently undermine those in another. In reality though, it’s not realistic for everyone in all departments to work together all the time, but may make more sense to bring all parties together just at key moments of the plan’s development. For this reason, we look below at two defining moments for effective collaboration, each of which can clearly find their bearing within both the CoM and GCC cycles above: 1) setting up an organisational structure for your SECAP and 2) how to prioritise actions (part of GCC’s Step 4, and CoM’s Phase 1).
Setting up (or adapting) an organisational structure for your SECAP The starting point for a successful and sustainable SECAP is to identify clear organisational roles and responsibilities. Although of course you can establish a new structure, you may find it useful to adapt an already-existing organisational structure created for a related purpose (e.g. an energy management team, environmental management unit, or local Agenda 21 coordination group) to ensure effective SECAP development and implementation. If your organisation has a SEAP already, likely you already have relevant steering and working groups in place which could be re-activated. However, their composition, scope of work and leadership may need updating to improve the integration of mitigation and adaptation processes. Therefore, it might be useful to consider the following32:
1. Has an internal SECAP Manager been appointed to support the process? The SECAP Manager should be a person with some climate action expertise, skilled in moderation, communication and making connections across disciplines, as they will be responsible for maintaining communication with relevant departments. While an energy manager or similar may have led the development and implementation of your SEAP, a SECAP’s broader scope demands that they expand their overview and outreach, or that they be supported by another person (e.g. co-leads, with adaptation and mitigation expertise respectively - though this may not be feasible for smaller municipalities with very limited resources). They must have support from local political leaders (e.g. a Council decision to approve/endorse the appointment), as well as the necessary skills, time and resources to carry out their duties, including staff for delegated tasks.
2. Is there a climate policy Steering Committee already in place? The Steering Committee would likely be made up of politicians and senior managers. Its mission should be to provide strategic direction and the necessary political support to the process, as well as to mainstream climate change policy across different departments, or even with relevant external organisations.
3. Does a Working Group already exist? If there is already a Working Group (permanent or ad hoc) coordinating activities and stakeholder input around energy management and emissions-reduction monitoring, it would make sense for its mandate to continue. However, its focus must expand to include the adaptation dimension. In addition to monitoring emissions, this group would also work to understand the city’s vulnerabilities to climate change from multiple sectoral perspectives and to provide corresponding data. Ideally it would also seek to ‘mainstream’ (or integrate) adaptation action into other existing policies, plans and municipal targets.
This means previous SEAP Working Group members need to expand their knowledge to include those adaptation drivers, impacts and risks related to their own fields of expertise on energy and mitigation, as well as to make room for colleagues from other departments (such as urban planning, parks and recreation, public services or emergency management) to join the group and contribute insights.

19
Figure 4: Organigram of a possible organisational structure for integrated climate action.
4. Do internal working processes need to change to build cooperation? Both the political Steering Committee and the cross-departmental Working Group need distinct leaders, but it’s essential that they communicate regularly and work together at key points. Each group needs clearly-defined objectives and responsibilities, as well as a regular, coordinated meeting schedule and reporting system. The same applies if more than one Working Group is needed to manage parts of the plan according to specific areas of expertise.
5. What groundwork is necessary to involve the right mix of staff and skills?
There is no one ‘right’ formula for your Working Group composition, but it should ideally reflect the diversity of skills and experience that exists in the city as a whole, including representatives from different departments. It may even include external representatives if these work in partnership with the city or have a direct influence on policy (see Table 3 for suggested departments and external groups). The more people in your group, the more comprehensive your resulting SECAP is likely to be, but keep in mind this also increases the challenges of scheduling and managing meetings.
Departments External Group Agriculture Academic institutions Coastal zone management Business sector Communications Neighbouring communities Economic development, culture and tourism Networks Energy Non-profit organisations Engineering Regional and/or national government Emergency management Residents and community Environment Scientific advisors Finance and administration Fire services Housing Legal services Parks and recreation Planning and zoning Police Public health Water Waste
Table 3: Potential participants in your SECAP team.
Source: Changing Communities: Changing Climate - Guide and Workbook for Municipal Climate Adaptation. (ICLEI Canada, n.d.) Available at: www.icleicanada.org/resources/item/3-changing-climate-changing-communities

20
Defining the core team should form part of a broader stakeholder mapping process, for example using the ‘Spheres of influence’ approach (see Figure 5). Consider the following questions:
What information do you need? Who has this information?
Which are the areas that you have influence over?
Who is directly responsible for decisions in relevant areas?
Who can obstruct a decision if not involved?
As much as possible, key municipal players should be assigned specific responsibilities/roles to ensure strong ownership of the SECAP process. Preparing a flow chart, indicating the various interactions between departments and actors, may be useful to identify any adjustments that might improve cooperation.
Figure 5: Spheres of influenceix.
Source: RAMSES Transition Handbook and Training Package (itself adapted from ICLEI Canada’s Changing Climate, Changing Communities : Guide and Workbook for Municipal Climate Adaptation).
A communication and engagement strategy may be needed to reach key staff whose input could benefit the plan. Skills or resource gaps might be identified where external support could prove beneficial, such as from a local/regional energy agency, partnership with a nearby university department or from a designated CoM Territorial Coordinator.
TIP: The RAMSES Transition Handbook and Training Package provides a series of seven worksheets designed to support the development of an adaptation plan. Worksheet 1 involves ‘stakeholder mapping and engagement’, which in fact applies to the broader SECAP context, including the mitigation stream, and not just to adaptation planning.
ix Along with a few colleagues, you can use this approach to brainstorm potential stakeholders. Place yourselves in the centre of the
diagram and start working your way outwards. The people and groups that you would place in the inner circle, i.e. where a direct
influence/impact relationship exists with you and your department, are likely needed on your team – others you might need to
engage in different ways and/or less frequently.

21
EXAMPLE 2: RETROFITTING HYDROPOWER DAM FOR FLOOD RISK MANAGEMENT, FRANCE Region: Alpine Space; Mediterranean Policy Instruments: Awareness Raising; Public Procurement Sectors: Energy; Water; Civil Protection and Emergency
Background: Hydropower is an essential part of the energy mix in France, accounting for around 20% of installed capacity. At the same time, increasing intensity of precipitations and consecutive (extreme) flooding can cause damage to the infrastructure of hydropower plants and threaten downstream communities. A Piano Key (PK) weir (so named because of its resemblance to piano keys) was implemented at the Malarce Dam in order to increase maximum discharge capacity, thereby protecting both the energy source from damage and nearby communities from flooding.
Image: Pexels.com / Frans Van Heerden
Response: • From 2003 to 2005 the large French utility EDF collaboratively developed with the wider hydropower
community a new system (the PK weir) as a series of inlet and outlet tanks to increase water flow surface area, and thereby reduce the consequences of frequent/extreme flooding.
• In 2012, Malarce was the sixth dam in France to install this unpatented technology (so other dams worldwide can utilise it).
• PK weir systems represent only a small component of the overall dam design, with no explicit negative impact. Stakeholder participation is not pivotal for implementation.
Results: • Increase in maximum discharge capacity by around 600 m3/s to a total of 4600 m3/s. • 10 dams in France now with PK weirs installed, 30 more globally with such systems, and more being built to
take advantage of its potential for infrastructural and community protection. • Low-maintenance and largely independent from a need for much additional human operation, making it an
ideal solution for reducing the risk of emergency situations.
Costs and Funding: • Costs depend on a variety of factors (e.g. existing dam structure, location, extent of water flow, and
accessibility), though installation costs might range between 200,000 and a few million Euros. Regardless, it is considered as a relatively inexpensive adaptation measure with few major maintenance needs. Even so, the approval, implementation, and construction phases can all be lengthy processes, partially because there is no current legislation/funding support for the PK weir technology, and it therefore remains dependent on dam owners to implement.
Interactions between mitigation and adaptation: • The Malarce Dam is a vital renewable energy source for the region’s electricity grid, which is now better able
to cope with flooding arising from intense precipitation and climate change, also lessening risks faced by downstream communities.
Sources: https://climate-adapt.eea.europa.eu/metadata/case-studies/fd www.hydropower.org/blog/climate-resilience-case-study-piano-key-weirs

22
Prioritising actions There are various methodologies available to assess and prioritise possible mitigation and adaptation actions. Importantly, whichever method is used (and as already emphasised), an integrated approach is essential, taking into account the effect that an action benefiting one stream has on the other.
One possibility is to use the results of the RVA to determine priorities – not only for adaptation, but mitigation too. In particular, a quantitative RVA, resulting in maps of risk and vulnerability distribution, is an extremely valuable resource to spatially locate risk hotspots and target them for action in either stream. In regard to mitigation measures, such an adaptation-oriented mapping exercise can also be effectively paired with a similar mitigation-oriented tool (e.g. the Peta heating and cooling platformx) and serve to identify key energy infrastructure or (potential) supply sources at risk, and in need of safeguarding.
Local authorities which have developed an Energy Management System (EnMS), such as those involved in the Compete4SECAP project, will already have identified key energy assets (e.g. public lighting network, municipal-owned vehicles, public buildings and even city-owned energy plants)33. With an effective EnMS in place, it may be possible to readily identify those municipal assets which are most in need of energy interventions and/or are most critical to operations, and therefore should be considered as a priority to avoid any climate risks.
TIP: The Compete4SECAP project has developed the Energy Management System (EnMS) Guidebook for Local Authorities, which you can find online as part of the project’s resource library. This handy guidebook outlines step-by-step how a city can apply the international standard for EnMS (ISO 50001), originally designed for industry and commercial use, and adapt it for a municipal context. Within the SECAP context, an EnMS can support planning and prioritisation of SECAP measures, help with monitoring later on as a tool for evaluating energy performance, and should continue to be updated once in place, to ensure long-term energy savings and identify intersections with adaptation.
The guidebook is available online (in English and eight other languages).
While spatially identifying the distribution of risks is important to determine where to act, decisions also need to be made about which actions to prioritise. Many contextual factors will influence these decisions, and locally-appropriate criteria should be determined to take these into account. Criteria should be as simple, measurable, available and relevant as possible, to achieve the desired aims. Allocating criteria could be a basic checklist exercise or a more elaborate multi-criteria decision analysisxi exploring various ‘pathways’ for climate action. Whatever method used, the impact of a given action on mitigation and/or adaptation outcomes should be among the criteria, since it likely makes sense to prioritise actions yielding synergies and co-benefits in both streams, e.g. improving the ability of renewable energy and transport infrastructure to withstand adverse weather events, or investing in urban forests which act as carbon sinks and reduce urban heat gain at the same time.
TIP: The C40 network’s AMIA tool enables cities to identify different kinds of potential interactions between climate adaptation and mitigation measures, highlighting opportunities for synergies and ‘piggybacking’, as well as warning against trade-offs and potential poor investments. The tool is of most use once you have already developed a preliminary list of possible actions you wish to investigate further.
x Heat Roadmap Europe’s Peta (Pan-European Thermal Atlas) is a free, online mapping platform with useful demand and supply information across Europe. Available here: www.heatroadmap.eu/peta4 xi Multi-criteria decision analysis involves evaluating a problem according to multiple (potentially conflicting) criteria in order to arrive at a preferred solution.

23
EXAMPLE 3: TREE MASTER PLAN TO BUILD RESILIENCE AND SINK CARBON: BARCELONA, SPAIN Population: 1.615 Million (2016) Regions: South-western Europe; Mediterranean Policy Instruments: Awareness Raising/Training; Public procurement; Building standards; Land-use planning regulation Sectors: Biodiversity; Public health; Land-use planning
Background: Climate change is bringing increasing temperatures, drought, and more severe heatwaves to Barcelona, whose high population, dense urban structure and geographical location each magnify the heat island effect and make it difficult to create new green spaces. While Barcelona has relatively few parks and gardens, the city is home to 311,000 trees managed by the Council. In coordination with its Green Infrastructure and Biodiversity Plan 2020, Barcelona is currently implementing its “Trees for living. Barcelona Tree Master Plan 2017-37”.
Response: Barcelona City Council has drafted a 20 year plan for planning, managing and conserving its urban forest. Key aims are:
Evaluation of the entire tree population for services and beneficial effects, but also disadvantages like allergies and littering;
Using an urban forest-effects computer model to statistically quantify urban forest structures and their benefits;
Evaluation of trees from cultural, ecological, climatic and economic perspectives;
Education and support for the collaboration of private/public organisations and citizens, especially children, in regards to tree heritage and services; and
New regulations to protect trees. Image: Dreamstime.com / Assignments
Planned results:
Increase city‘s tree cover from 5% to 30%.
Plant more climate-resistant trees, increased from 30% to 40% of the urban forest stock.
Improve tree biodiversity so that no single species accounts for more than 15% of the urban forest.
Costs and Funding:
Estimated plan budgets 9.6 million Euros/year from which 8.3 million Euros/year are reserved for tree management.
The budget does not invoke major changes, but instead highlights areas needing further investment.
Interactions between mitigation and adaptation:
Tree populations act as a carbon sink and sequester GHG emissions from the atmosphere.
The trees also provide direct benefits to the city by moderating temperatures, reducing energy costs, improving air quality and protecting citizens from adverse climate effects.
Sources: https://climate-adapt.eea.europa.eu/metadata/case-studies/barcelona-trees-tempering-the-mediterranean-city-climate https://ajuntament.barcelona.cat/ecologiaurbana/sites/default/files/Pla-director-arbrat-barcelona-ENG.pdf
24
Financing Available funding mechanisms for both mitigation and adaptation Once priority actions have been identified, it’s critical to look at financing – not only in terms of upfront costs, but also running costs in the longer term.
SECAP actions can of course be funded through a municipal budget, whether via budget-lines devoted to a specific action or as part of broader work programmes, but it is not the only option available. In fact, certain measures may be more effectively implemented by other (local) stakeholders and/or funded through their own budgets (e.g. expansion of district heating company networks). Other options range from the somewhat traditional (e.g. preferential bank loans), to the more innovative (e.g. energy saving measures funded through consumers’ utility bills). A good starting point for cities wishing to investigate (new) financing opportunities is the EU-CoM’s Interactive Funding Guide.
It’s also worthwhile exploring opportunities beyond financing at the local level. Many countries have relevant regional and/or national funding mechanisms which support climate/energy action either in general, or aimed at specific measures.
TIP: The Compete4SECAP project is also developing a section of its resource library devoted to supporting local authorities to explore and understand financing opportunities. This will not only consolidate useful materials and links originating from other initiatives, but also include a series of Fact Sheets on Funding Opportunities highlighting specific (municipal) cases which have successfully applied some of the most relevant, replicable and innovative financing mechanisms, for example: • on-bill financing, • soft loans, • synergies with corporate social responsibility, • community energy, • crowd-funding, • energy performance contracts, • EU grant schemes and special funds, • international banks. Project factsheets and other relevant resources are available in the Compete4SECAP website’s Financing and Funding Opportunities section.
25
EXAMPLE 4: GREEN ROOFS: BASEL, SWITZERLAND Population: 171,017 (2017) Region: Alpine spaces Policy Instruments: Grants/Subsidies; Building standards; Awareness Raising/Training Sectors: Buildings; Public health; Energy
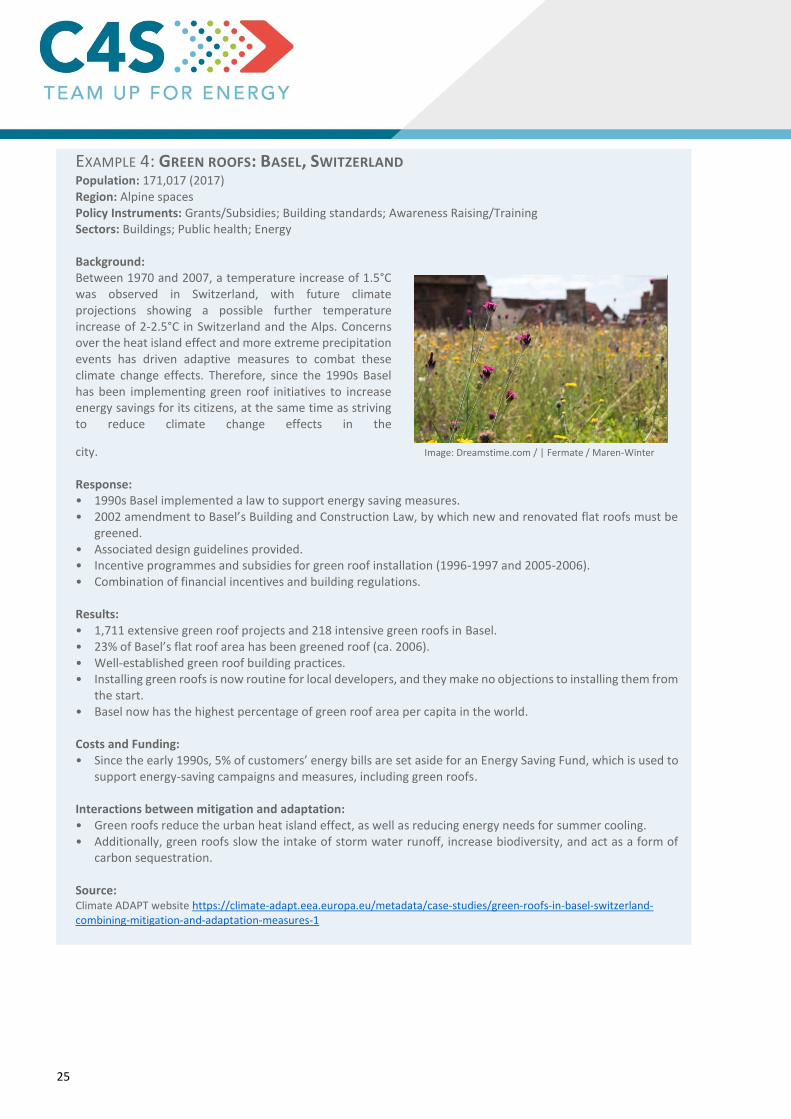
Background: Between 1970 and 2007, a temperature increase of 1.5°C was observed in Switzerland, with future climate projections showing a possible further temperature increase of 2-2.5°C in Switzerland and the Alps. Concerns over the heat island effect and more extreme precipitation events has driven adaptive measures to combat these climate change effects. Therefore, since the 1990s Basel has been implementing green roof initiatives to increase energy savings for its citizens, at the same time as striving to reduce climate change effects in the
city. Image: Dreamstime.com / | Fermate / Maren-Winter
Response: • 1990s Basel implemented a law to support energy saving measures. • 2002 amendment to Basel’s Building and Construction Law, by which new and renovated flat roofs must be
greened. • Associated design guidelines provided. • Incentive programmes and subsidies for green roof installation (1996-1997 and 2005-2006). • Combination of financial incentives and building regulations.
Results: • 1,711 extensive green roof projects and 218 intensive green roofs in Basel. • 23% of Basel’s flat roof area has been greened roof (ca. 2006). • Well-established green roof building practices. • Installing green roofs is now routine for local developers, and they make no objections to installing them from
the start. • Basel now has the highest percentage of green roof area per capita in the world.
Costs and Funding: • Since the early 1990s, 5% of customers’ energy bills are set aside for an Energy Saving Fund, which is used to
support energy-saving campaigns and measures, including green roofs.
Interactions between mitigation and adaptation: • Green roofs reduce the urban heat island effect, as well as reducing energy needs for summer cooling. • Additionally, green roofs slow the intake of storm water runoff, increase biodiversity, and act as a form of
carbon sequestration.
Source: Climate ADAPT website https://climate-adapt.eea.europa.eu/metadata/case-studies/green-roofs-in-basel-switzerland-combining-mitigation-and-adaptation-measures-1

26
4. Monitoring and Reporting on your SECAP Why report? A SECAP is meant to be a living document – not to gather dust on a shelf! – which means it needs to evolve over time as progress is made, as well as to integrate new knowledge, technological possibilities and financing opportunities as they become available34. Though monitoring and reporting on progress towards your CoM commitments can seem like a burdensome task, it nonetheless remains an essential component of any successful plan to ensure its longevity and to help future-proof its relevance.
In fact, there is no need for this phase to be perceived as a significant burden on cities, but rather as a crucial phase in an integrated management cycle which is necessary for a city to effectively evolve in a climate/energy context. Furthermore, it may be worth reminding that the establishment of a robust EnMS can provide cities with an invaluable tool to significantly streamline effective monitoring and reporting of SECAP achievements (see again the earlier section “Prioritising actions”). Even if you decide to not take advantage of an EnMS, you can still remember that monitoring and reporting are beneficial to your work in their own right, because they enable you to35:
Compare predicted impacts from the planning stage to what is actually achieved, in terms of energy savings, renewable energy production, GHG emissions-reduction, and efforts to adapt to climate change, as well as other co-benefits to air quality, noise, health, risk reduction, environmental protection, economic/social added-value etc.;
Recognise the need for, and facilitate the identification of, any corrective measures to be implemented, in case certain actions are not delivering their expected impacts;
Help determine the cause(s) of failure to implement specific measures, and hence understand and overcome barriers preventing their achievement;
Identify new opportunities for action, whether follow-up or innovative measures;
Discover and document (replicable) success stories, including co-benefits arising from your actions, to be shared with your local community and other cities to encourage their adoption in other contexts.
There is space in the current CoM reporting template to (optionally) report adaptation actions that also have a positive impact on climate mitigation. In line with the Global Common Reporting Framework, future reporting will require synergies, trade-offs, and co-benefits of mitigation and adaptation actions to be identified36.

27
The new Global Common Reporting Framework outlines the following time frames for SECAP reporting:
Reporting Element Commit to join GCoM (Year 0)
Year 1 Year 2 Year 3 Year 4 Year 5
GHG Emissions Inventory Submit by year 2 at the latest *
Risk and vulnerability assessment
Submit by year 2 at the latest
Targets and goals (mitigation and adaptation)
Submit by year 2 at the latest
Climate action plan(s) (mitigation and adaptation plan, or integrated plan)
Submit by year 3 at the latest
Energy access plan To be defined
Progress report *
*Every two years after submitting the climate action plan
Table 4: SECAP reporting timeline, according to the Global Common Reporting Framework.
Source: GCoM Office. (2018). GCoM Common Reporting Framework: Version 6.1.
TIP: Consider the following good practices to support your own monitoring and reporting process37:
Assign a dedicated person to specifically coordinate the monitoring and reporting process, and if deemed necessary, establish a team or committee to meet periodically.
Pinpoint the precise data to be collected and consistent methods for data collection.
Identify data sources, including precise departments/individuals and external stakeholders, that will be able to provide the data you need.
Determine an appropriate frequency of monitoring (ideally minimum yearly) to support reporting.
Ensure that the data collected is reliable and remains comparable over time.
Define monitoring indicators and set up specific benchmarks to compare their performance.
Outline a communication and engagement plan to collaborate with and communicate to policy makers and other stakeholders, and tailor information to address each audience.
Establish strong links between the results of the monitoring report and municipal budget planning cycles, so that any adjustments to your action plan can be incorporated as necessary in the most streamlined manner possible.
Implement an Energy Management System (see Part 3 and find out more on the Compete4SECAP website).

28
EXAMPLE 5: ENERGY FROM WASTEWATER TREATMENT: ALMADA, PORTUGAL Population: 174,030 (2011) Region: Mediterranean Policy Instruments: Strategic plan (long-term local strategy and action plan for water/wastewater); Public procurement (design tender’s selection criteria require energy capture from biogas is needed) Sectors: Energy; Water and wastewater management
Background: The coastal city of Almada has an extensive wastewater treatment service, handling nearly all wastewater produced in the city, as part of a commitment to a ‘closed loop’ water cycle. The Portinho da Costa Wastewater Treatment Plant plays a key role in this overall system, also serving the broader aims of Almada’s Local Strategy for Climate Change.
Response:
An anaerobic treatment system was built to generate biogas from sludge (a by-product of the primary and secondary stages of wastewater treatment)
The biogas is useful for conversion into thermal and electrical energy powering of a co-generation system on-site.
Two kinds of treatment – physical-chemical and biological – allow for flexibility and redundancy, increasing the system’s resilience.
Image: Pixabay.com / 后园 卓
Results:
The co-generation system provides about 40% of the facility’s own energy needs (about 550MWh/year), equivalent to a decrease of 40% GHG emissions (180 tonnes of CO2).
Due to the high methane component of biogas, its release to the atmosphere would otherwise have been extremely harmful, with a global warming potential about 21 times higher than CO2. Therefore its use as energy is not only efficient, but also significantly reduces harmful emissions.
The closed water loop cycle also protects the nearby Tagus estuary, which serves as an important habitat and provides other ecosystem services.
Costs and Funding:
The system was financed through grants secured from the European Investment Bank and the European Environment Agency.
The 10 million EUR invested to acquire and install the equipment is expected to be recovered within the equipment’s lifespan.
Operational cost savings due to reduced use of energy from natural gas and grid electricity (in 2011 a total saving of 55,322 EUR) further support the case for such an investment.
Interactions between mitigation and adaptation:
The careful management of water resources and preservation of biodiversity in the nearby Tagus estuary improves the area’s ability to cope with climate impacts such as floods, drought and storm surges, while the treatment of wastewater reduces the likelihood of future water shortages.
The associated energy production from biogas reduces both GHG emissions directly and lowers the consumption of non-renewable sources.
Source: http://old.iclei.org/fileadmin/PUBLICATIONS/Case_Studies/ICLEI_cs_189_Almada_UrbanLEDS_2016.pdf

29
5. What’s next? This guide has provided a first look at developing a SECAP, with a particular focus on upgrading from a SEAP. The tools and resources below offer further information and inspiration, and can also be found within Compete4SECAP’s resource library.
Tools and resources Title Focus Summary
Guidebook ‘How to develop a Sustainable Energy and Climate Action Plan (SECAP)’ – Parts 1,2 and 3
SECAP development
The JRC’s How to develop a Sustainable Energy and Climate Action Plan (SECAP) is an in-depth 3-part guide to creating a SECAP. Part 1 covers the overall process, Part 2 covers municipal assessments (e.g. emissions and risks), while Part 3 covers technical issues, measures, policies and financial mechanisms.
The Covenant of Mayors for Climate and Energy Reporting Guidelines
SECAP development
The EU-CoM has set up Reporting Guidelines which provide step-by-step guidance: Step I covers the filling of their templates; Step II addresses uploading documents; and Step III explains their checking system for the mitigation parts.
Toolbox of Methodologies - Climate and Energy
Adaptation & Mitigation
ICLEI’s Toolbox of Methodologies - Climate and Energy compiles, in a searchable format, numerous energy and climate resources (in many languages) from multiple projects, especially on mitigation.
Good Practices Adaptation & Mitigation
The CoM offers a database of Good Practices about climate actions implemented by Signatories, Coordinators and Supporters, as well as examples of approved action plans from across Europe.
AMIA (Adaptation and Mitigation Integration Analysis)
Adaptation & Mitigation
C40’s AMIA tool enables cities to methodically identify potential interactions between climate adaptation and mitigation measures, highlighting opportunities and conflicts, along with supporting case studies to guide decision-making.
Urban Adaptation Support Tool
Adaptation ClimateADAPT’s Urban Adaptation Support Tool outlines all the steps needed to develop and implement an adaptation-only strategy with reference to guidance materials and tools.
European Climate Risk Typology
Adaptation The European Climate Risk Typology is an interactive online map to describe, compare and analyse climate risks across Europe, particularly useful during the early stages of assessing vulnerability and risks.
IVAVIA (impact and vulnerability analysis for critical infrastructures and built-up areas)
Adaptation IVAVIA is a 7-module methodology to assess climate-related risks and their effects. It provides guidance on how to gather and structure data for your assessment; to quantify and combine vulnerability indicators; to assess risk; and to present outcomes.
Adaptation Options Library Adaptation The Adaptation Options Library is a searchable database of key adaptation measures to enable either a basic review of available options, or an even deeper dive via its complete database.
Resilience Maturity Model Adaptation The Resilience Maturity Model is a database of policies to help define a city’s stage of resilience ‘maturity’. It can be used during multiple phases of a resilience-building process, from a baseline review through to reporting, and is especially useful for engaging diverse stakeholders.
C40 Cities Climate Change Risk Assessment Guidance
Adaptation C40’s Cities Climate Change Risk Assessment Guidance helps cities conduct a climate risk assessment in line with the Global CoM and the C40 Climate Action Planning Framework. It provides the methodology and components of their assessment approach.

30
Further reading Adaptation Sub-Committee. (2011). Chapter 3: Land use planning, and Chapter 5: Designing and renovating buildings. In Adapting to Climate Change in the UK. Available at: https://www.theccc.org.uk/publication/adapting-to-climate-change-in-the-uk-measuring-progress-2nd-progress-report-2011/
Bertoldi, P. (Ed.). (2018a). Guidebook ‘How to develop a Sustainable Energy and Climate Action Plan (SECAP) – Part 1 - The SECAP process, step-by-step towards low carbon and climate resilient cities by 2030. Luxembourg: Publication Office of the European Union. Available at: https://doi.org/10.2760/68327
Bertoldi, P. (Ed.). (2018b). Guidebook ‘How to develop a Sustainable Energy and Climate Action Plan (SECAP) – Part 2 - Baseline Emission Inventory (BEI) and Risk and Vulnerability Assessment (RVA). Luxembourg: Publication Office of the European Union. Available at: https://doi.org/10.2760/118857
Bertoldi, P. (Ed.). (2018c). Guidebook ‘How to develop a Sustainable Energy and Climate Action Plan (SECAP) – Part 3 – Policies, key actions, good practices for mitigation and adaptation to climate change and Financing SECAP(s). Luxembourg: Publication Office of the European Union. Available at: https://doi.org/10.2760/58898
C40 Cities, & Arup. (2015). City climate hazard taxonomy. Available at: http://www.c40.org/researches/city-climate-hazard-taxonomy
Carter, J., & Connelly, A. (2016). RESIN Glossary. Available at: http://www.resin-cities.eu/fileadmin/user_upload/D1_2_Glossary_UNIMAN_2016_01_29.pdf
Covenant of Mayors & Mayors Adapt Offices. (2016). The Covenant of Mayors for Climate and Energy Reporting Guidelines. Available at: https://www.covenantofmayors.eu/IMG/pdf/Reporting_Guidelines_Final_EN.pdf
Global Covenant of Mayors for Climate and Energy. (2018). Global Covenant of Mayors Common Reporting Framework. Available at: https://www.globalcovenantofmayors.org/wp-content/uploads/2019/04/FINAL_Data-TWG_Reporting-Framework_website_FINAL-13-Sept-2018_for-translation.pdf
ICLEI Canada. (n.d.). Changing Climate, Changing Communities: Guide and Workbook for Municipal Climate Adaptation. Available at: http://www.icleicanada.org/resources/item/3-changing-climate-changing-communities
ICLEI European Secretariat; SOGESCA. (n.d.). Fifty thousand and one energy solutions: Final Report of the most important results achieved through the 50000&1 SEAPs project. Available at: http://www.50001seaps.eu/resources/publications/
IPCC. (2018). Annex 1: Glossary. In Matthews, R. (Ed.), Global warming of 1.5°C. An IPCC Special Report on the impacts of global warming of 1.5°C above pre-industrial levels and related global greenhouse gas emission pathways, in the context of strengthening the global response to the threat of climate change. Available at: https://www.ipcc.ch/site/assets/uploads/sites/2/2019/06/SR15_AnnexI_Glossary.pdf
Laukkonen, J.et al. (2009). Combining climate change adaptation and mitigation measures at the local level. Habitat International, 33(3), 287–292. https://doi.org/10.1016/j.habitatint.2008.10.003
Patzer, B., & Lee, J. (2017). C40 Infrastructure Interdependencies and Cascading Climate Impacts Study. Available at: https://resourcecentre.c40.org/resources/assessing-risks-in-cities
Thomson, H. & Bouzarovski, S. (2019). Addressing Energy Poverty in the European Union: State of Play and Action. Retrieved from https://www.energypoverty.eu/sites/default/files/downloads/publications/18-08/paneureport2018_final_v3.pdf
Watkiss, P. & Klein, R. (2018). Linking Mitigation and Adaptation in Long-Term Strategies. Deutsche Gesellschaft für Internationale Zusammenarbeit (GIZ) GmbH: Bonn. Available at: https://www.weadapt.org/knowledge-base/synergies-between-adaptation-and-mitigation/linking-mitigation-and-adaptation

31
Endnotes
1 IPCC (2014). Annex II: Glossary [Mach, K.J., S. Planton and C. von Stechow (eds.)]. In: Climate Change 2014: Synthesis Report. Contribution of Working Groups I, II and III to the Fifth Assessment Report of the Intergovernmental Panel on Climate Change [Core Writing Team, R.K. Pachauri and L.A. Meyer (eds.)]. IPCC, Geneva, Switzerland, pp. 117-130.
2 See https://www.covenantofmayors.eu/support/faq.html#answer-21
3 IPCC (2013). Annex III: Glossary [Planton, S. (ed.)]. In: Climate Change 2013: The Physical Science Basis. Contribution of Working Group I to the Fifth Assessment Report of the Intergovernmental Panel on Climate Change [Stocker, T.F., D. Qin, G.-K. Plattner, M. Tignor, S.K. Allen, J. Boschung, A. Nauels, Y. Xia, V. Bex and P.M. Midgley (eds.)]. Cambridge University Press, Cambridge, United Kingdom and New York, NY, USA.
4 Allaby, M. (2004). A Dictionary of Ecology. OUP Oxford.
5 Schuessler, R. (2014). Energy Poverty Indicators: Conceptual Issues Part I: The Ten-Percent-Rule and Double Median/Mean Indicators. Available at http://ftp.zew.de/pub/zew-docs/dp/dp14037.pdf
6 EU Energy Poverty Observatory (2019). Indicators and Data. Available at: https://www.energypoverty.eu/indicators-data
7 IPCC (2014).
8 IPCC (2014).
9 Adapted from IPCC (2014).
10 BMZ (Federal Ministry for Economic Cooperation and Development) (2014). The Vulnerability Sourcebook. Concept and guidelines for standardised vulnerability assessments. Deutsche Gesellschaft für Internationale Zusammenarbeit (GIZ) GmbH, Bonn and Eschborn. Available at: https://gc21.giz.de/ibt/var/app/wp342deP/1443/wp-content/uploads/filebase/va/vulnerability-guides-manuals-reports/Vulnerability_Sourcebook_-_Guidelines_for_Assessments_-_GIZ_2014.pdf
11 IPCC (2014).
12 IPCC (2014).
13 IPCC (2014).
14 IPCC (2013).
15 Adapted from IPCC (2014).
16 Adapted from Oppenheimer, M. et al. (2014). Emergent risks and key vulnerabilities. In: Climate Change 2014: Impacts, Adaptation, and Vulnerability. Part A: Global and Sectoral Aspects. Contribution of Working Group II to the Fifth Assessment Report of the Intergovernmental Panel on Climate Change [Field, C.B., V.R. Barros, D.J. Dokken, K.J. Mach, M.D. Mastrandrea, T.E. Bilir, M. Chatterjee, K.L. Ebi, Y.O. Estrada, R.C. Genova, B. Girma, E.S. Kissel, A.N. Levy, S. MacCracken, P.R. Mastrandrea, and L.L. White (eds.)]. Cambridge University Press, Cambridge, United Kingdom and New York, NY, USA, pp. 1039-1099.
17 IPCC (2014).
18 IPCC (2014).
19 See https://ec.europa.eu/energy/en/topics/energy-strategy-and-energy-union/clean-energy-all-europeans
20 See https://ec.europa.eu/clima/policies/strategies/2050_en
21 See https://www.energypoverty.eu/about/what-energy-poverty
22 Schuessler, R. (2014).
23 See https://www.energypoverty.eu/sites/default/files/downloads/publications/18-08/paneureport2018_final_v3.pdf

32
24 See https://www.eumayors.eu/support/energy-poverty.html
25 See http://www.ilo.org/global/topics/green-jobs/publications/WCMS_432859/lang--en/index.htm
26 See https://ec.europa.eu/energy/en/topics/oil-gas-and-coal/coal-regions-in-transition
27 See https://urbantransitions.org/
28 See https://www.globalcovenantofmayors.org/our-initiatives/data4cities/common-global-reporting-framework/
29 See https://www.globalcovenantofmayors.org/our-initiatives/data4cities/common-global-reporting-framework/
30 Text adapted from Guidebook 'How to develop a Sustainable Energy and Climate Action Plan (SECAP)' – Part 1 (JRC, 2018, p25).
31 Watkiss, P. & Klein, R. (2018). Linking Mitigation and Adaptation in Long-Term Strategies. Deutsche Gesellschaft für Internationale Zusammenarbeit (GIZ) GmbH: Bonn.
32 Text adapted from Guidebook 'How to develop a Sustainable Energy and Climate Action Plan (SECAP)' – Part 1 (JRC, 2018, p31).
33 Cosenza et al. (2018). Energy Management System (EnMS) Guidebook for Local Authorities: Compete4SECAP D2.4. Available at: http://compete4secap.eu/resources/energy-management-systems/
34 See Guidebook 'How to develop a Sustainable Energy and Climate Action Plan (SECAP)' – Part 1 (JRC, 2018, p59).
35 List adapted from Covenant of Mayors for Climate and Energy Office. (2014). Quick Reference Guide - Monitoring SEAP implementation.
36 See https://www.globalcovenantofmayors.org/our-initiatives/data4cities/common-global-reporting-framework/
37 List reproduced from Covenant of Mayors for Climate and Energy Office. (2014). Quick Reference Guide - Monitoring SEAP implementation.


![Climate [in] Action!](https://static.fdocuments.in/doc/165x107/61c79edfffc1823567586334/climate-in-action.jpg)