Update on Virginia’s Growth Measure Deborah L. Jonas, Ph.D. Executive Director for Research and...
35
Update on Virginia’s Growth Measure Deborah L. Jonas, Ph.D. Executive Director for Research and Strategic Planning Virginia Department of Education July-August 2011
-
Upload
millicent-stephens -
Category
Documents
-
view
214 -
download
0
Transcript of Update on Virginia’s Growth Measure Deborah L. Jonas, Ph.D. Executive Director for Research and...
Update on Virginia’s Growth MeasureDeborah L. Jonas, Ph.D.Executive Director for Research and Strategic PlanningVirginia Department of Education
July-August 2011

2
Federal Requirements• The State Fiscal Stabilization Act (SFSF) of the
American Recovery and Reinvestment Act of 2009 (ARRA) requires Virginia to:▫ Develop a student growth measure.▫ Provide student growth data to reading and
mathematics teachers in tested grades.▫ Provide data to both previous and current teachers.
• The Virginia Department of Education (VDOE) established the Master Schedule Data Collection to meet this and other federal data collection and reporting requirements.

3
Federal Requirement: Student-level Growth Data(b)(2)
• Data must be provided to two groups of teachers:▫ Teachers who taught students previously
Example: growth data from tests administered in spring 2011 must be provided to teachers who taught students in the 2010-2011 school year.
▫ Teachers who are currently teaching students Growth data from tests administered in spring 2011
must be provided to teachers working with these students in the fall of 2011.
• The state must be capable of providing student-level data to teachers no later than September 30, 2011.

4
Federal Requirement: Teacher Impact Data, Indicator (b)(3)
• As part of SFSF requirements, Virginia is required to:▫ Provide teachers of reading/language arts and mathematics
… with reports of individual teacher impact on student achievement on state assessments.
• Virginia’s approach to comply with indicator (b)(3)▫ Use the student-level growth data to provide teachers with
context for understanding their impact on student achievement as measured by statewide assessments.
▫ As multiple years of data become available, VDOE will create reports that enable teachers to consider trends in student growth data.
▫ When tests measuring the same SOL are available over multiple years, trend data can be used in aggregate.

5
Student Growth Percentiles (SPGs)• SOL scores measure whether students met a
particular standard.
• SGPs describe how much progress students made relative to students with similar achievement histories on SOL tests.
• SGPs provide an understanding of how much progress students made recognizing that students start at different levels of achievement.

6
•At least two years of data are necessary to report a student growth percentile.
•Student growth percentiles will be calculated for most students participating in the following SOL tests:▫Mathematics, grades 4-8 & Algebra I through
grade 9▫Reading, grades 4-8
Student Growth Percentiles

7
• SGPs range from 1 to 99, and represent the percent of students who had similar prior academic achievement (based on SOL tests) and who earned lower scores on the SOL test.
• Example: a student who earns an SGP of 65 scored better than 65 percent of students who had the same prior achievement as measured by SOL tests.
• Example: a student who earns an SGP of 15 scored better than 15 percent of students who had the same prior achievement as measured by SOL tests.
Student Growth Percentiles (SGPs)
8
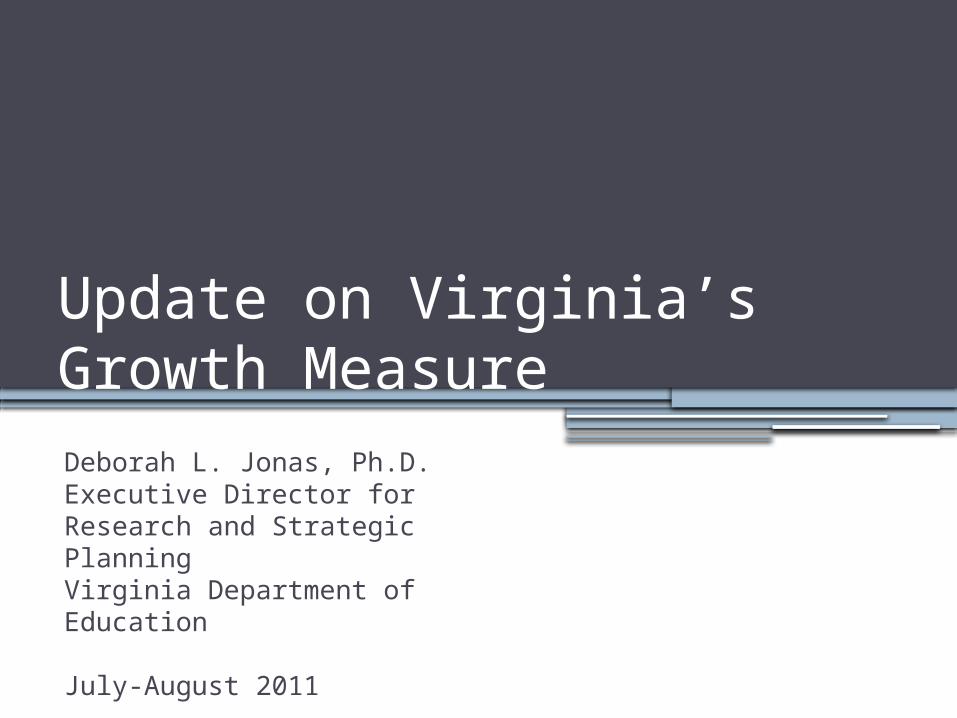
Grade 3 reading scores
Student D
Student C
Student B
Student A
0 200 400 600
Grade 3 reading

9
Grade 3 and 4 reading scores
Student D
Student C
Student B
Student A
0 200 400 600
Grade 3 readingGrade 4 reading
15
48
66
91
10
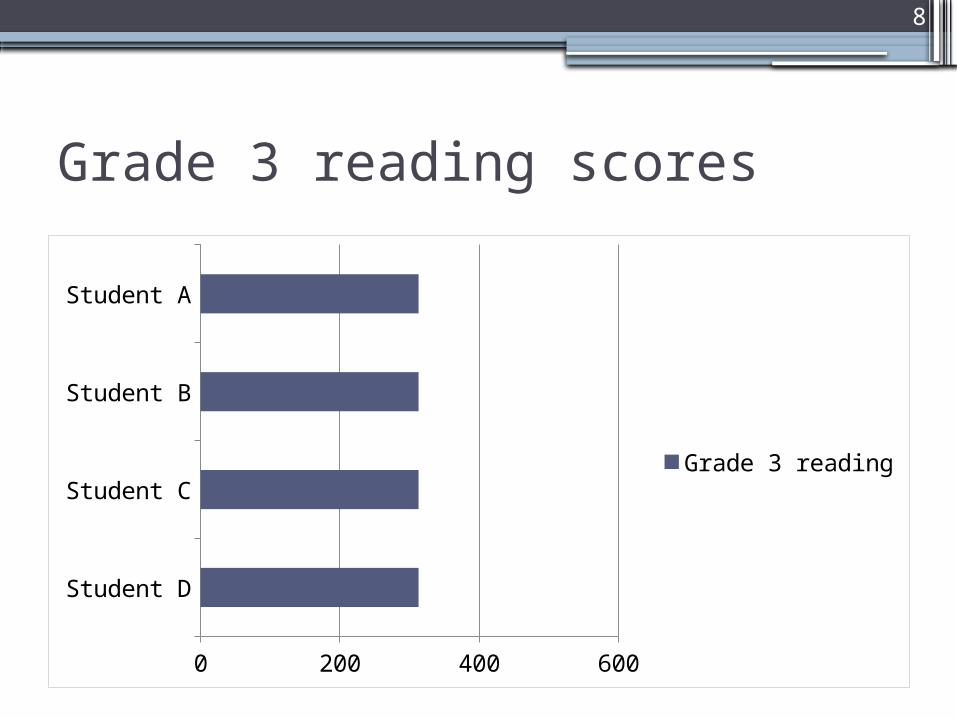
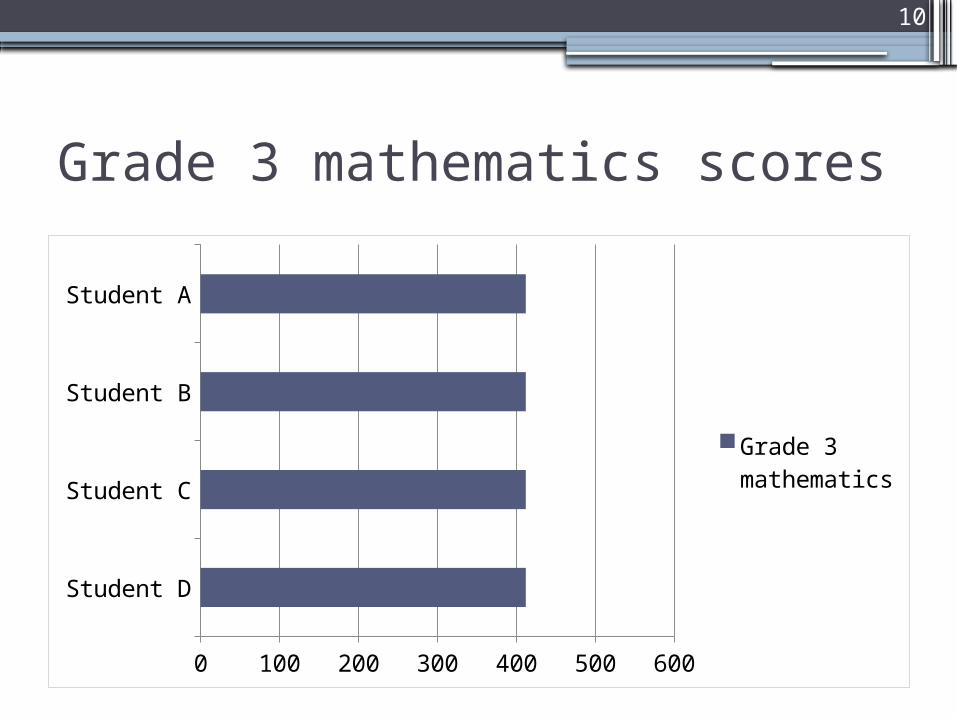
Grade 3 mathematics scores
Student D
Student C
Student B
Student A
0 100 200 300 400 500 600
Grade 3 mathemat-ics

11
Grade 3 and 4 mathematics scores
Student D
Student C
Student B
Student A
0 200 400 600
Grade 3 mathemat-icsGrade 4 mathemat-ics
13
33
58
92

12
Conceptual view of student cohorts
3rd grade
4th grade
5th grade
6th grade
300320340360380400420440460480500520540560580600

13
Conceptual view of student cohorts
3rd grade
4th grade
5th grade
6th grade
300320340360380400420440460480500520540560580600 99th
percentile80th percentile75th percentile60th percentile50th percentile40th percentile25th percentile20th percentile1st percentile

14
Student Growth Percentiles and SOL Scaled Scores
15
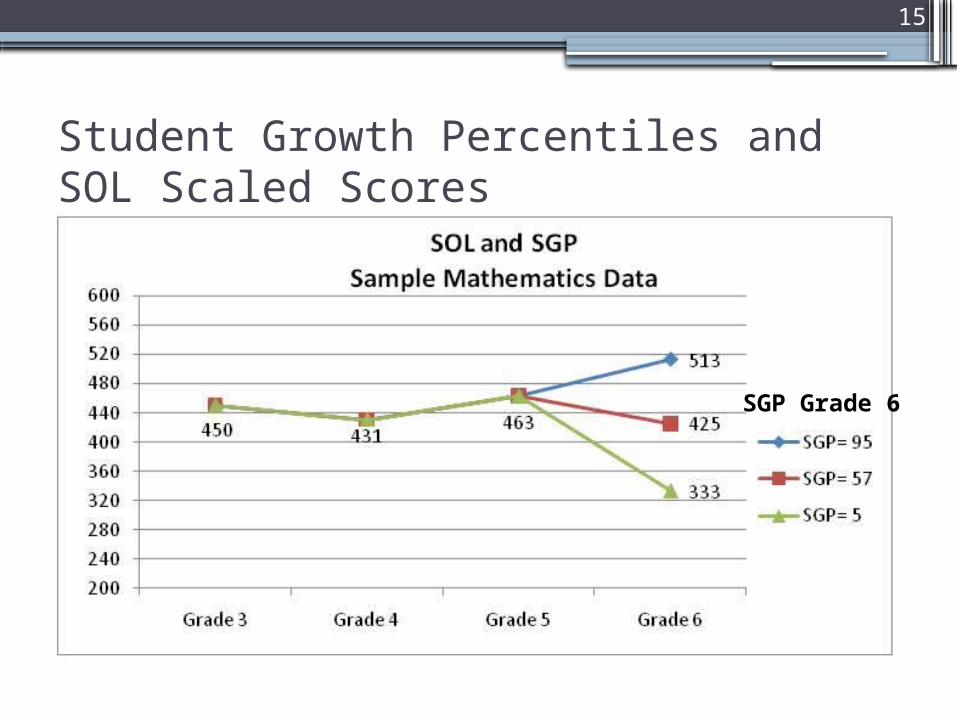
Student Growth Percentiles and SOL Scaled Scores
SGP Grade 6
16
Reports
• VDOE will provide reports with student-level data in the fall of 2011.
• VDOE is developing reports that will summarize student-level data.
• Reports will provide information on the percent of students achieving low, moderate, and high growth.
• Summary reports are anticipated no earlier than spring 2012.

17
Growth Levels
•To support interpretation of growth data, VDOE will define categories/levels of student growth.Growth Level Student Growth
Percentile Range
Low 1-34
Moderate 35-65
High 66-99
Growth levels defined as of April 2011.
18
Growth Data Limitations• Growth percentile data will not be available for some
students who have taken the grades 4-8 reading tests and/or the mathematics tests for grades 4-8 or Algebra I.
• Three primary student groups will not have student growth percentiles available from the state:▫ Students with only one year of assessment data available.▫ Students who participated in Virginia’s alternative assessment
programs (VGLA, VSEP, VAAP) in the year of, or year prior to, the reporting year.
▫ Students who have two consecutive years of advanced proficient achievement (to be reevaluated after new tests are in place).
• As Virginia’s assessments change, VDOE anticipates that more students will have student growth percentiles available in reading and mathematics.
19
Data availability• VDOE will provide data to school divisions’ central
offices, via the SSWS system (Fall 2011 only; changes may take place in future years).
• School divisions are responsible for providing student-level data to teachers consistent with requirements of indicator (b)(2):▫ Teachers who previously taught students▫ Teachers who currently teach students
• Teacher impact data (b)(3) will be comprised of student-level data and, when available and appropriate, aggregate and trend data.

20
Training on Growth Percentile Data and its Uses
• VDOE has established an agreement with The Center for Educational Partnerships (TCEP) at Old Dominion University to develop and deliver professional development (PD) on the growth measure.
• Workshops are being designed to increase division leadership teams’ knowledge of the student growth measure and how it can be used as a tool to inform decision making.
• Four regional one-day trainings for central office administrators will be held in October 2011 (see Superintendent’s memo, June 24, 2011).

21
Potential Uses for Student Growth Percentiles
• School improvement and program evaluation
• Intervention and remediation
• Planning professional development
• One component of comprehensive performance evaluation ▫ Consistent with the Code of Virginia requirement to incorporate
measures of student academic progress in evaluations (§ 22.1-295).
▫ Growth percentiles may form the basis of one of multiple measures of student progress, when available and appropriate.
• Communications with students and parents
22
Implications for Teacher Performance Evaluation
For more information, see http://www.doe.virginia.gov/teaching/performance_evaluation/index.shtml.

23
Background: Code of Virginia
• § 22.1-253.13:5. Standard 5. Quality of classroom instruction and educational leadership.
…B. Consistent with the finding that leadership is essential for the advancement of public education in the Commonwealth, teacher, administrator, and superintendent evaluations shall be consistent with the performance objectives included in the Guidelines for Uniform Performance Standards and Evaluation Criteria for Teachers, Administrators, and Superintendents….

24
Background: Code of Virginia
•§ 22.1-295. Employment of teachers.
…C. School boards shall develop a procedure for use by division superintendents and principals in evaluating instructional personnel that is appropriate to the tasks performed and addresses, among other things, student academic progress and the skills and knowledge of instructional personnel, including, but not limited to, instructional methodology, classroom management, and subject matter knowledge….

25
SGPs as One Measure of Progress in Teacher Performance Evaluation
• The Board of Education’s Guidelines for Uniform Performance Standards and Evaluation Criteria for Teachers recommend the inclusion of SGPs as one of multiple measures of student academic progress, when available and appropriate.
• Use of student growth percentiles in teacher performance evaluation is a local decision. Use of growth percentiles in evaluation is not required by law or regulation.

26
Recommended Minimum Conditions for Using SGPs in Performance Evaluation
• Growth percentiles may form the basis of one of multiple measures of student progress when:▫ Data from at least 40 students are available; and▫ Students with growth data are representative of students
taught; and
▫ Growth data for at least two years are available for each teacher; three years should be reviewed whenever possible.
• At least one other measure of academic progress is included in the evaluation.
• Individuals being evaluated understand the measures being used.

27
Examples of aggregated data
Percent of Students by Growth Category SOL Proficiency Data
High growth
Moderate growth
Low growth
No growth
data available Pass rate
Advanced proficient
Group AEnglish 43% 26% 24% 7% 99% 72%
Mathematics 71% 19% 6% 4% 99% 83%
Examples only

28
Examples of aggregated dataPercent of Students by Growth Category SOL Proficiency Data
High growth
Moderate growth
Low growth
No growth
data available Pass rate
Advanced proficient
Group AEnglish 43% 26% 24% 7% 99% 72%
Mathematics 71% 19% 6% 4% 99% 83%
Group BEnglish 30% 29% 40% 1% 82% 34%
Mathematics 34% 27% 33% 6% 89% 47%
Examples only
29
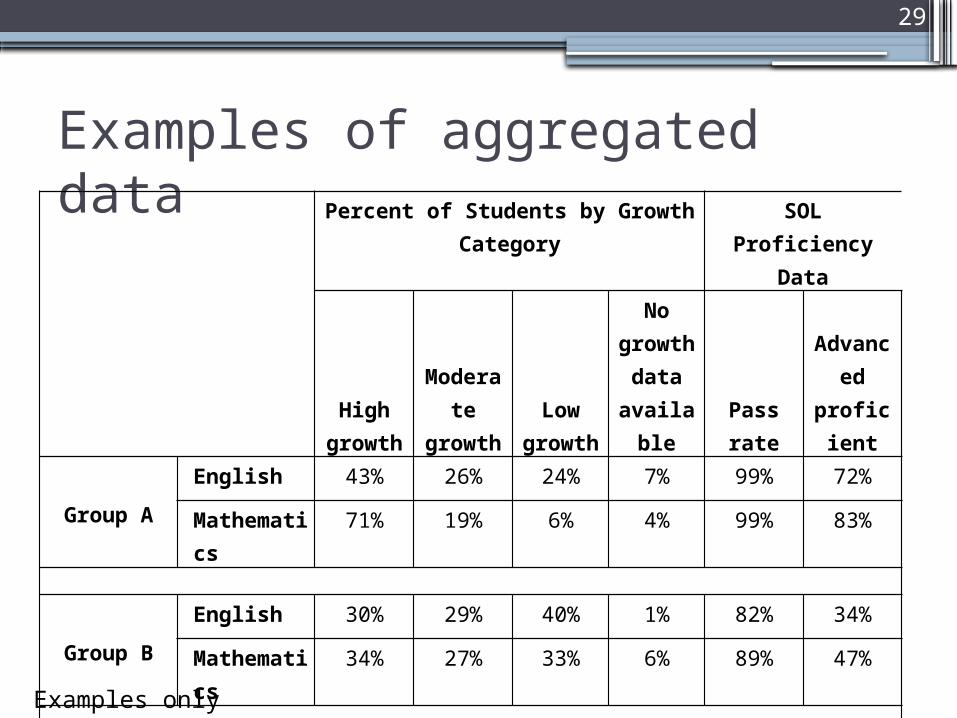
Examples of aggregated dataPercent of Students by Growth Category SOL Proficiency Data
High growth
Moderate growth
Low growth
No growth
data available Pass rate
Advanced proficient
Group AEnglish 43% 26% 24% 7% 99% 72%
Mathematics 71% 19% 6% 4% 99% 83%
Group BEnglish 30% 29% 40% 1% 82% 34%
Mathematics 34% 27% 33% 6% 89% 47%
Group CEnglish 17% 19% 62% 3% 65% 21%
Mathematics 18% 20% 55% 7% 75% 32%
Examples only

30
Growth, achievement, and economically disadvantaged status in Colorado
0 25 50 75 100
ForR_Pct
0
25
50
75
100
MedSGP
School achievement is correlated with economic status (R=-.759)
Median growth percentile is not correlated with economic status
(R=-.124)
Adapted from: Schmitz, D. (2010). Utility of Growth Percentiles. Presented November 2010, Virginia stakeholders. Full presentation is available at: http://www.cit.org/programs/cit-connect/vdoe-gm.
0 25 50 75 100
ForR_Pct
500
550
600
650
MeanScaleScore
Percent economically disadvantaged
Mean
Sca
le S
core
Percent economically disadvantaged
Med
an
Gro
wth
Perc
en
tile

31
Downloaded from: https://edx.cde.state.co.us/growth_model/public/index.htm#/year-2010/district-1420/schools. July 2010.
Math

32
Key Points (data)
• Student growth percentiles will be available in the fall for teachers of reading and mathematics, grades 4-8 and Algebra I though grade 9.
• Data linking teachers to tests will be based on data provided via Master Schedule Collection.
• Not all students (or teachers) will have SGPs available.

33
Key Points (evaluation)
• Divisions are required to include measures of student academic progress in performance evaluations.
• The Board recommends that all teachers be evaluated with multiple measures of student academic progress.
• SGPs are recommended as one measure of student academic progress when sufficient data are available and data are representative of students taught.

34
Common questions: SGP and performance evaluation
• Are divisions required to include SGPs in teacher performance evaluation?
• How should I summarize my growth percentile data?
• Can I meet the “multiple measures of student academic progress” recommendation by using growth percentiles in mathematics and reading in teachers’ evaluations?
• What other measures are available from the state?

35
Contact information
Assessment and questions about growth calculations: [email protected]
Teacher performance evaluations: [email protected]
Data/master schedule collection: [email protected]