Update on the New England Economy and Housing Markets Alicia Sasser, Senior Economist New England...
30
Update on the New England Economy and Housing Markets Alicia Sasser, Senior Economist New England Public Policy Center Federal Reserve Bank of Boston New England Realtor’s Conference March 3, 2008 The presenter would like to thank Yolanda Kodrzycki and Ana Patricia Muñoz for providing data. The views expressed in the presentation are not necessarily those of either the Federal Reserve Bank of Boston or the Federal Reserve System.
-
date post
18-Dec-2015 -
Category
Documents
-
view
216 -
download
1
Transcript of Update on the New England Economy and Housing Markets Alicia Sasser, Senior Economist New England...

Update on the New England Economy and Housing Markets
Alicia Sasser, Senior Economist
New England Public Policy Center
Federal Reserve Bank of Boston
New England Realtor’s Conference
March 3, 2008
The presenter would like to thank Yolanda Kodrzycki and Ana Patricia Muñoz for providing data. The views expressed in the presentation are not necessarily those of either the Federal Reserve Bank of
Boston or the Federal Reserve System.
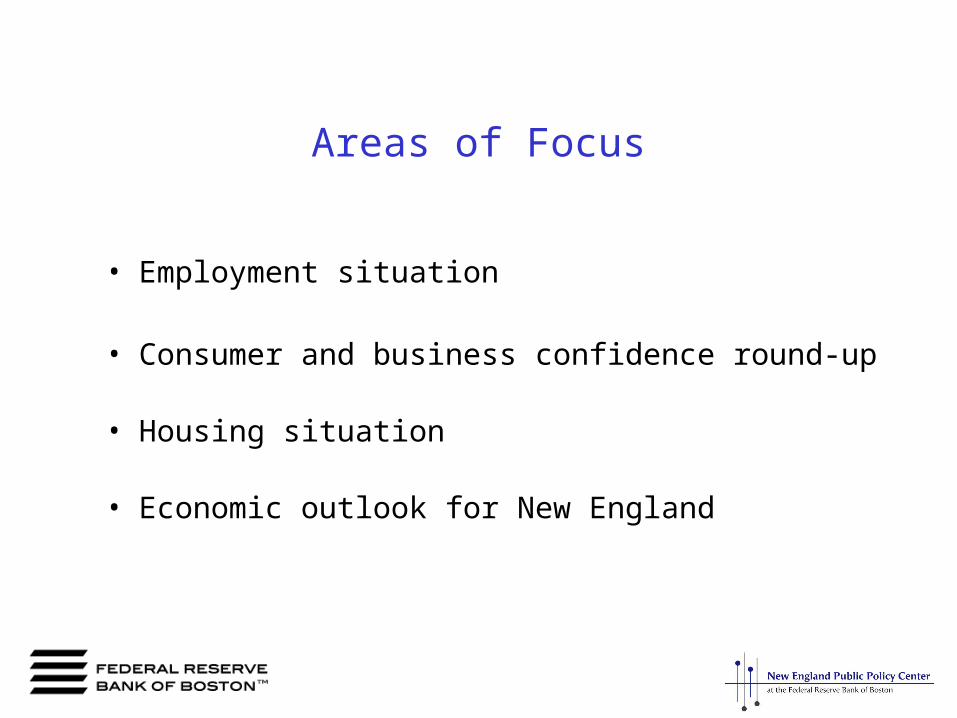
Areas of Focus
• Employment situation
• Consumer and business confidence round-up
• Housing situation
• Economic outlook for New England
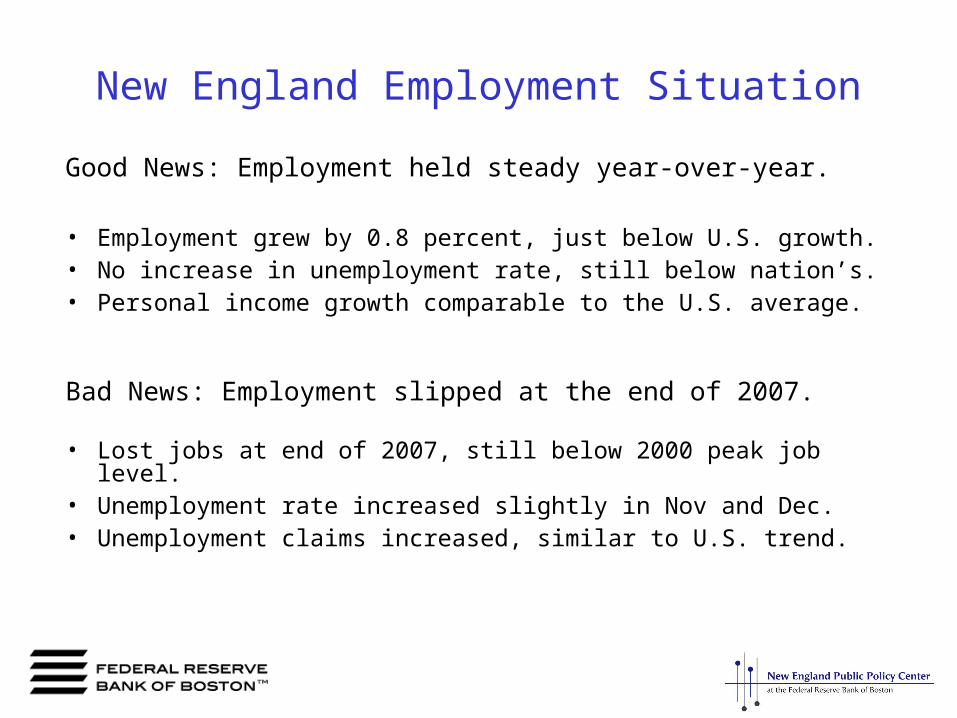
New England Employment Situation
Good News: Employment held steady year-over-year.
• Employment grew by 0.8 percent, just below U.S. growth.• No increase in unemployment rate, still below nation’s.• Personal income growth comparable to the U.S. average.
Bad News: Employment slipped at the end of 2007.
• Lost jobs at end of 2007, still below 2000 peak job level.• Unemployment rate increased slightly in Nov and Dec. • Unemployment claims increased, similar to U.S. trend.

4
IEmployment in New England slipped at the end of 2007.
- 30
- 20
- 10
0
10
20
30
Dec-00
J un-01
Dec-01
J un-02
Dec-02
J un-03
Dec-03
J un-04
Dec-04
J un-05
Dec-05
J un-06
Dec-06
J un-07
Dec-07
Monthly Employment Change in New EnglandThousands of Jobs
Source: U.S. Bureau of Labor Statistics.

5
As a result, year-over-year employment gains for New England were small.
-6
-5
-4
-3
-2
-1
0
1
2
3
4
Dec-89 Dec-91 Dec-93 Dec-95 Dec-97 Dec-99 Dec-01 Dec-03 Dec-05 Dec-07
Percent Change fromYear Earlier
United States
New England
Employment Growth
Source: U.S. Bureau of Labor Statistics.
6
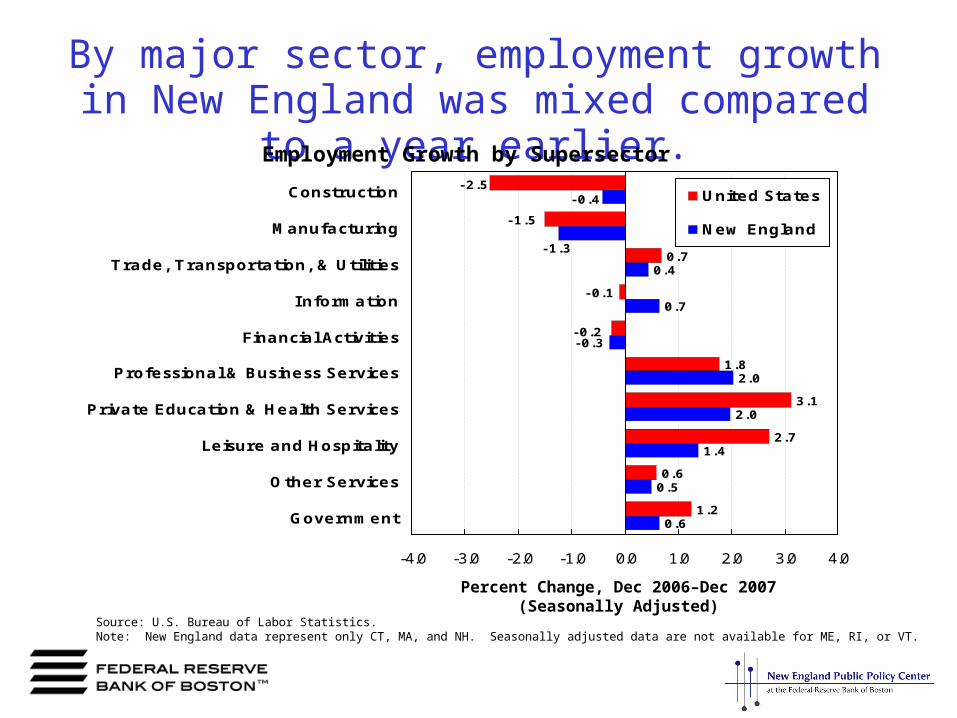
By major sector, employment growth in New England was mixed compared to a year earlier.
0.7
1.8
3.1
2.7
0.6
1.2
0.4
0.7
-0.3
2.0
2.0
1.4
0.5
0.6
-0.1
-2.5
-0.2
-1.5
-1.3
-0.4
-4.0 -3.0 -2.0 -1.0 0.0 1.0 2.0 3.0 4.0
Construction
Manufacturing
Trade, Transportation, & Utilities
Information
Financial Activities
Professional & Business Services
Private Education & Health Services
Leisure and Hospitality
Other Services
Government
United States
New England
Percent Change, Dec 2006–Dec 2007(Seasonally Adjusted)
Source: U.S. Bureau of Labor Statistics.Note: New England data represent only CT, MA, and NH. Seasonally adjusted data are not available for ME, RI, or VT.
Employment Growth by Supersector

7
New England’s unemployment rate edged up at the end of 2007, but was lower than the nation’s.
0
1
2
3
4
5
6
7
8
9
Dec-91
Dec-92
Dec-93
Dec-94
Dec-95
Dec-96
Dec-97
Dec-98
Dec-99
Dec-00
Dec-01
Dec-02
Dec-03
Dec-05
Dec-05
Dec-06
Dec-07
Percent
Source: U.S. Bureau of Labor Statistics.
United States
New England
Unemployment Rates

8
Year-over-year, the unemployment rate was unchanged for the region, but fluctuated widely
across New England states.4.4
4.6
4.1
4.6
5.2
3.5
5.1
3.8
5.0
4.6
5.0
5.1
4.5
5.5
4.0
3.6
0 1 2 3 4 5 6 7
United States
New England
Connecticut
Maine
Massachusetts
New Hampshire
Rhode Island
Vermont
Dec-06
Dec-07
Source: U.S. Bureau of Labor Statistics.
Percent
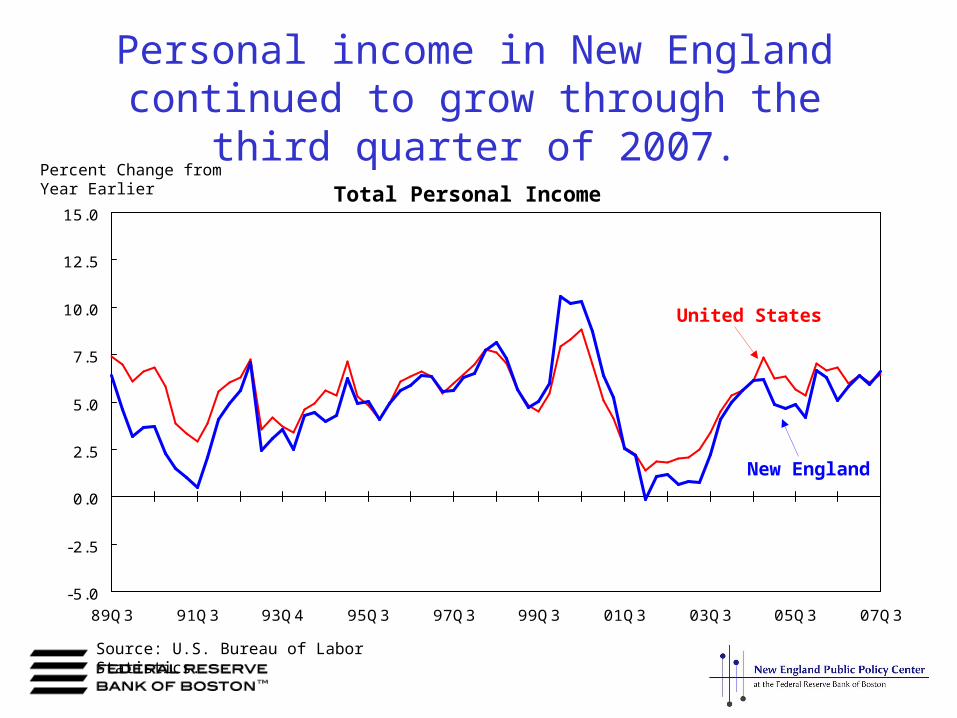
Personal income in New England continued to grow through the third quarter
of 2007.
-5.0
-2.5
0.0
2.5
5.0
7.5
10.0
12.5
15.0
89Q3 91Q3 93Q4 95Q3 97Q3 99Q3 01Q3 03Q3 05Q3 07Q3
Percent Change from Year Earlier
Source: U.S. Bureau of Labor Statistics.
United States
New England
Total Personal Income

New England Consumer and Business Confidence Round-up
The Good: Business confidence was unchanged in December and Massachusetts employers
showed some optimism about future conditions.
The Bad: Consumer confidence among New England residents held steady in December, but
remained below year-ago levels.
The Ugly: Compared to a year ago, the percentage of Boston area workers who see their personal
financial situation as improving has fallen.
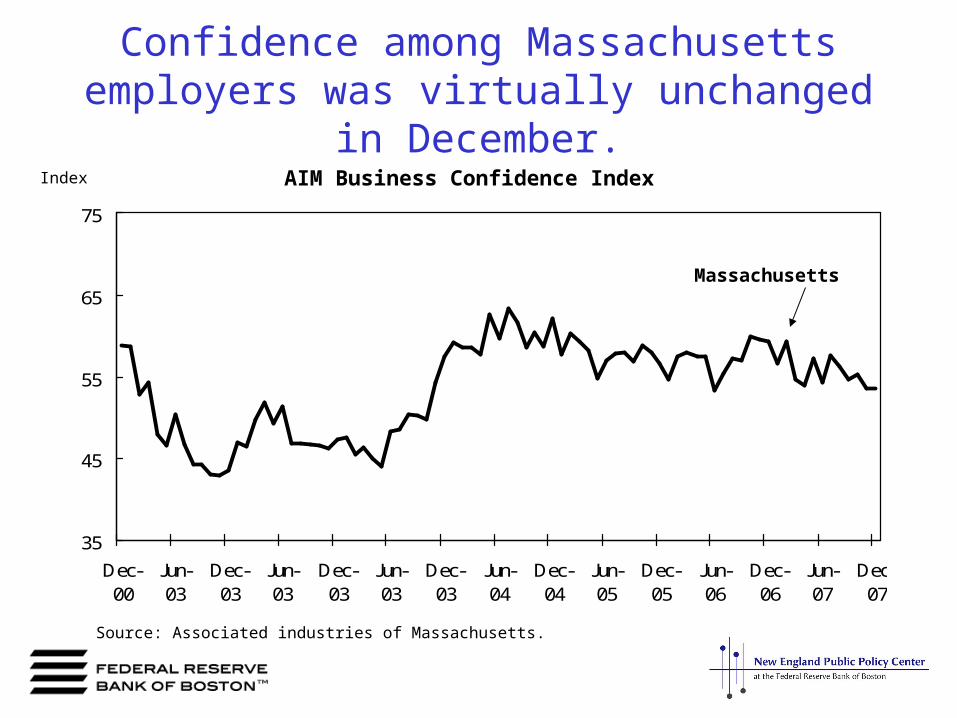
Confidence among Massachusetts employers was virtually unchanged in December.
Index
Source: Associated industries of Massachusetts.
AIM Business Confidence Index
35
45
55
65
75
Dec-00
Jun-03
Dec-03
Jun-03
Dec-03
Jun-03
Dec-03
Jun-04
Dec-04
Jun-05
Dec-05
Jun-06
Dec-06
Jun-07
Dec-07
Massachusetts

New England consumer confidence held steady at the end of 2007 but below year-ago peaks.
1985 U.S. Average=100
Source: The Conference Board.
Consumer Confidence
110
91
131
119
96
73
89
70
108
93
76
55
0
25
50
75
100
125
150
Dec-06
Dec-07
Consumer Confidence US NE
Present Situation US NE
Future Expectations US NE
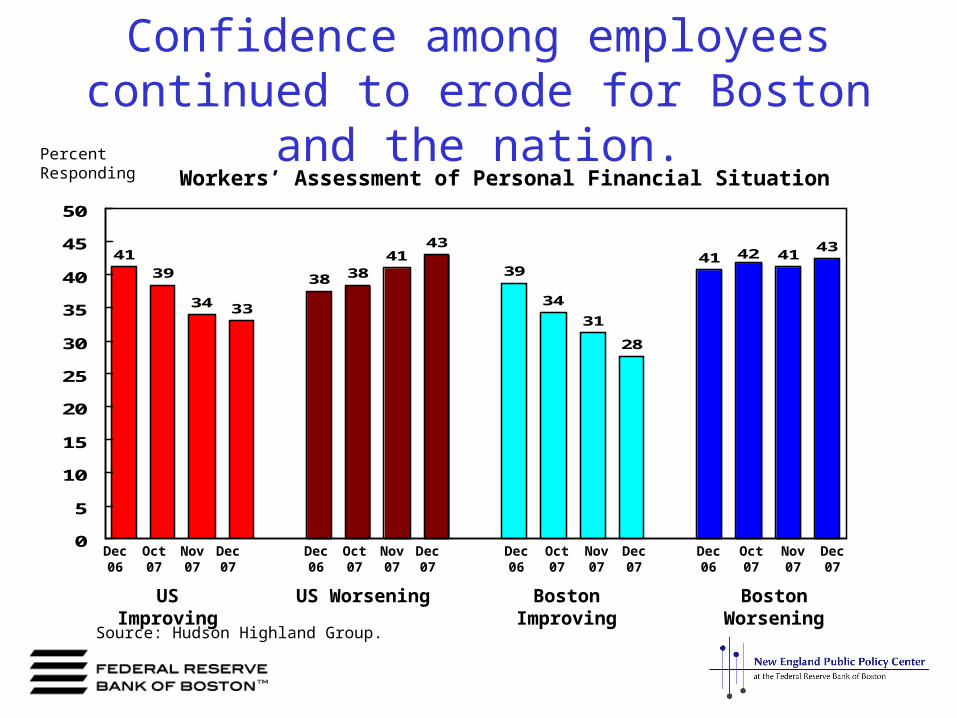
Confidence among employees continued to erode for Boston and the nation.
Percent Responding
Source: Hudson Highland Group.
Workers’ Assessment of Personal Financial Situation
4139
34 33
38 3841
43
39
34
31
28
41 414342
0
5
10
15
20
25
30
35
40
45
50
US Improving Boston ImprovingUS Worsening Boston Worsening
Dec06
Nov07
Dec07
Oct07
Dec06
Nov07
Dec07
Oct07
Dec06
Nov07
Dec07
Oct07
Dec06
Nov07
Dec07
Oct07

New England Housing Situation
Good News: Not as bad as some other regions.
• Prices fell but not as sharply as some other areas.• As prices continue to soften, affordability may improve.• About one-quarter of subprime borrowers could refinance.
Bad News: It’s not over yet.
• House prices continued to soften through the end of 2007.• Existing sales and new home construction are down. • Foreclosures are at record highs and still rising.

House prices continued to soften through the end of 2007 in both New England and the U.S.
-10
-5
0
5
10
15
20
25
30
1983 -Q1
1985 -Q2
1987 -Q3
1989 -Q4
1992 -Q1
1994 -Q2
1996 -Q3
1998 -Q4
2001 -Q1
2003 -Q2
2005 -Q3
2007 -Q4
Source: Office of Federal Housing Enterprise Oversight (OFHEO).
Percent Change from Year Earlier
United States
New England
All-use index
Purchase-only index
OFHEO House Prices Indices
16
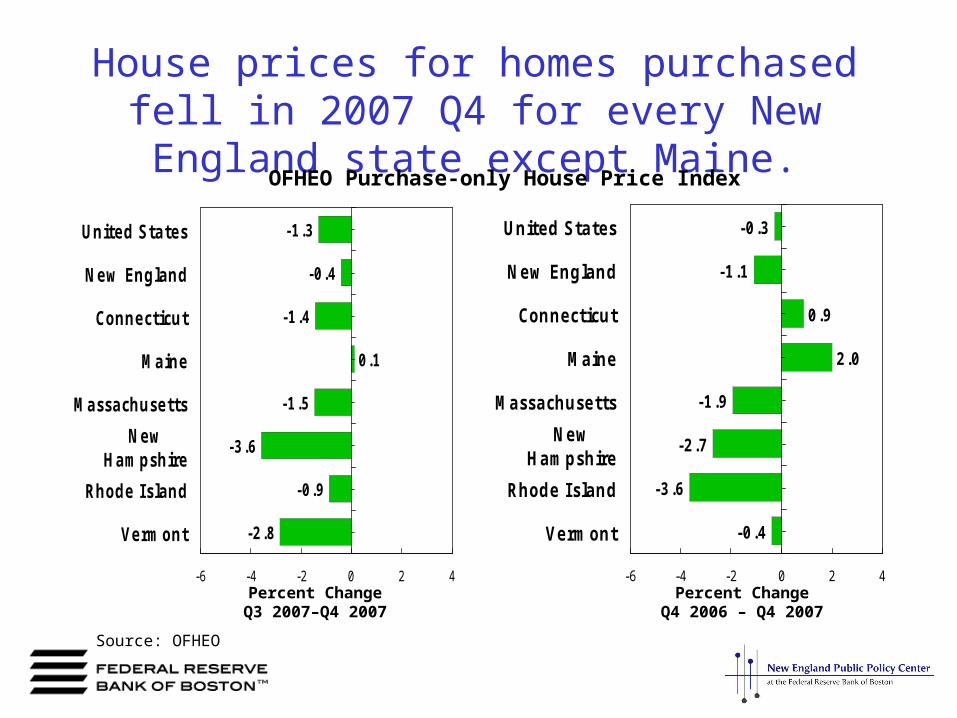
House prices for homes purchased fell in 2007 Q4 for every New England state except Maine.
-1.3
-0.4
-1.4
0.1
-3.6
-0.9
-1.5
-2.8
-6 -4 -2 0 2 4
United States
New England
Connecticut
Maine
Massachusetts
NewHampshire
Rhode Island
Vermont
Percent ChangeQ3 2007–Q4 2007
Source: OFHEO
-0.3
-1.1
0.9
2.0
-1.9
-2.7
-0.4
-3.6
-6 -4 -2 0 2 4
United States
New England
Connecticut
Maine
Massachusetts
NewHampshire
Rhode Island
Vermont
Percent ChangeQ4 2006 – Q4 2007
OFHEO Purchase-only House Price Index
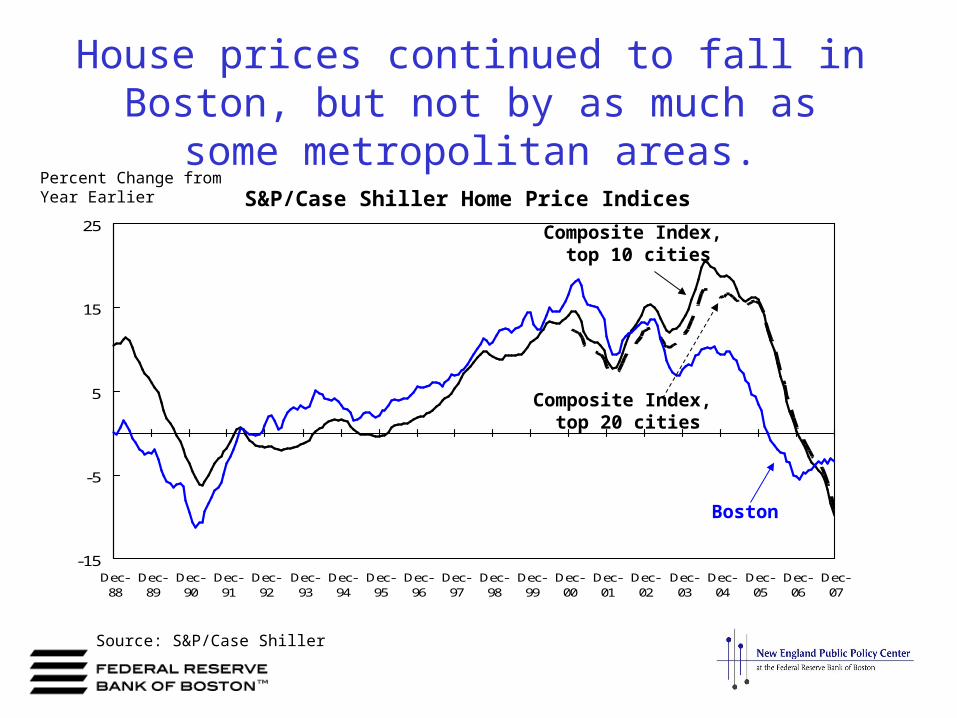
House prices continued to fall in Boston, but not by as much as some metropolitan areas.
Source: S&P/Case Shiller
Percent Change from Year Earlier
-15
-5
5
15
25
Dec-88
Dec-89
Dec-90
Dec-91
Dec-92
Dec-93
Dec-94
Dec-95
Dec-96
Dec-97
Dec-98
Dec-99
Dec-00
Dec-01
Dec-02
Dec-03
Dec-04
Dec-05
Dec-06
Dec-07
Composite Index, top 10 cities
Boston
S&P/Case Shiller Home Price Indices
Composite Index, top 20 cities

Boston had the smallest decline in house prices among the Composite 10 metro areas for 2007.
-9.8
-9.1
-3.4
-4.6
-4.5
-15.3
-5.6
-15.0
-10.8
-9.4
-17.5
-13.7
-18 -16 -14 -12 -10 -8 -6 -4 -2 0
Composite index for top 10 cities
Composite index for top 20 cities
Boston
Chicago
Denver
Las Vegas
Los Angeles
Miami
New York
San Diego
San Francisco
Washington
Source: S&P/ Case-Shiller Percent Change, Dec 2006 – Dec 2007
S&P/Case Shiller Home Price Indices

Growth in Real Single-Family House Prices, 1995-2007
90
100
110
120
130
140
150
160
170
180
190
200
1995 1996 1997 1998 1999 2000 2001 2002 2003 2004 2005 2006 2007
CT
MA
ME
NH
RI
VT
NE
US
Source: Authors’ calculations based on the house price index calculated by the Office of Federal Housing Enterprise Oversight (OFHEO).Notes: Adjusted for inflation using the Consumer Price Index, excluding shelter.
Yet despite the decline in prices, house price levels are still relatively high in New England.
Index

Ratio of Real Annual Median Household Income to Real Annual Income Needed to Purchase the Median Priced
House
0.6
0.7
0.8
0.9
1.0
1.1
1.2
1.3
1995 1996 1997 1998 1999 2000 2001 2002 2003 2004 2005 2006
Connecticut
Maine
Massachusetts
New Hampshire
Rhode Island
Vermont
United States
Notes:Annual median household income are three-year moving averages as calculated from the Current Population Survey for householdswhere the head is age 25+ and is not enrolled in school, adjusted to $2006 using the CPI-U.Annual median income needed to purchase the median priced house are based on annual house prices as reported by the Federal Home Finance Bureau, adjusted by the OFHEO index and deflated by the CPI-U less shelter .“Middle-income” households are those that fall into the 3rd quintile of the income distribution.
Threshold of Affordability
As of 2006, the affordability picture had not changed much for New England residents.
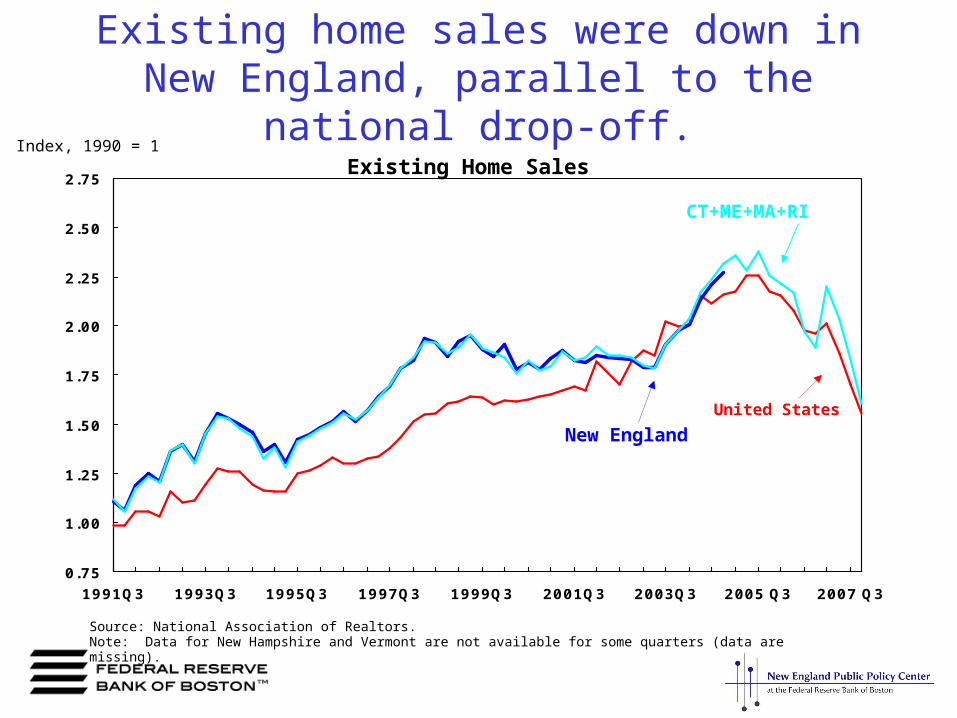
Existing home sales were down in New England, parallel to the national drop-off.
0.75
1.00
1.25
1.50
1.75
2.00
2.25
2.50
2.75
1991Q3 1993Q3 1995Q3 1997Q3 1999Q3 2001Q3 2003Q3 2005 Q3 2007 Q3
Index, 1990 = 1
CT+ME+MA+RI
Source: National Association of Realtors.Note: Data for New Hampshire and Vermont are not available for some quarters (data are missing).
United States New England
Existing Home Sales
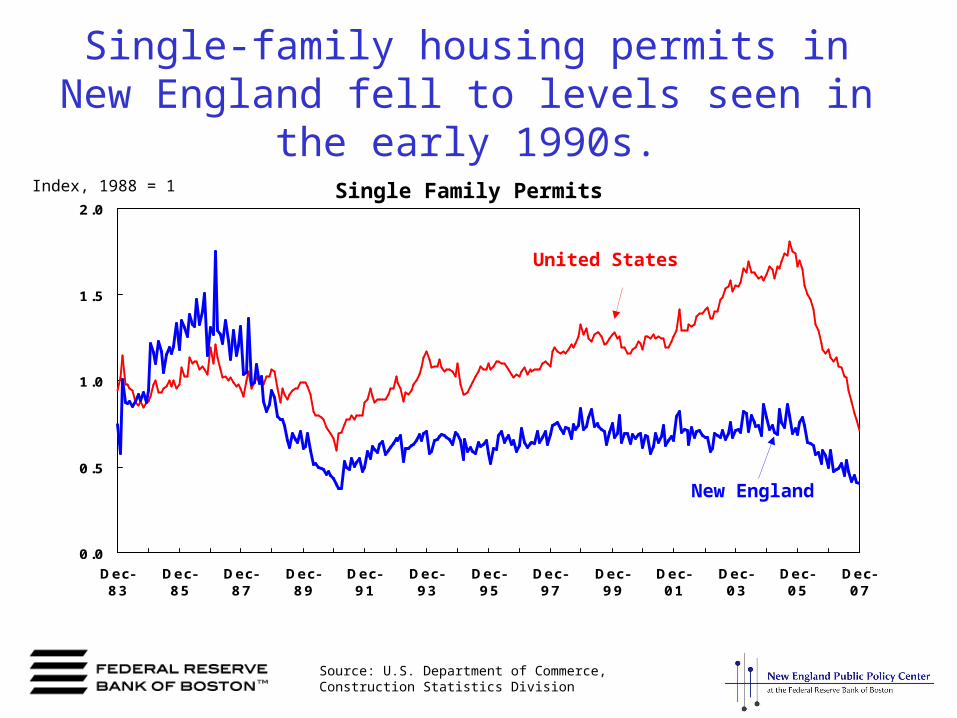
Single-family housing permits in New England fell to levels seen in the early 1990s.
0.0
0.5
1.0
1.5
2.0
Dec-83
Dec-85
Dec-87
Dec-89
Dec-91
Dec-93
Dec-95
Dec-97
Dec-99
Dec-01
Dec-03
Dec-05
Dec-07
Index, 1988 = 1
Source: U.S. Department of Commerce,Construction Statistics Division
United States
New England
Single Family Permits

Multi-family housing permits have fallen even further in New England.
0.0
0.5
1.0
1.5
2.0
2.5
Dec-83
Dec-85
Dec-87
Dec-89
Dec-91
Dec-93
Dec-95
Dec-97
Dec-99
Dec-01
Dec-03
Dec-05
Dec-07
Source: U.S. Department of Commerce, Construction Statistics Division
Index, 1988 = 1
United States
New England
Multi Family Permits

0
0.2
0.4
0.6
0.8
1
1.2
Q1-03 Q3-03 Q1-04 Q3-04 Q1-05 Q3-05 Q1-06 Q3-06 Q1-07 Q3-07
US
NE
CT
ME
MA
NH
RI
VT
Foreclosures Started, All Loans
Source: Mortgage Bankers Association / Haver Analytics
Foreclosures initiated in quarter, as a percent of loans in pool.
Foreclosures reached record highs both in New England and nationally.

0
1
2
3
4
5
6
7
Q3-03 Q1-04 Q3-04 Q1-05 Q3-05 Q1-06 Q3-06 Q1-07 Q3-07
Subprime ARM
Subprime FRM
Prime ARM
Prime FRM
Foreclosures Started by Type of Loan
Source: Mortgage Bankers Association / Haver Analytics
Foreclosures initiated in quarter, as a percent of loans in pool.
Foreclosures rates in New England are highest for subprime ARM mortgages.

New England Economic Partnership’s Economic Outlook
Employment• Employment forecast to grow slowly at 0.8 percent per year over
the next three years, slightly below the national forecast.
Housing
• House prices expected to decrease through the 2nd half of 2008 with slow recovery going forward, lagging the nation.
Overall Economic Growth• Real gross product for the region is expected to grow 2.2 percent
per year for 2008 through 2011, slower than the nation.• Credit crisis and the housing market downturn are expected to
slow growth through 2008.

Employment in New England is expected to grow slowly over the next 5 years.
Source: New England Economic Partnership.

House prices are expected to fall through the second half of 2008 then slowly recover.
Source: New England Economic Partnership.

New England is expected to grow slower than the nation on average through 2011.
Source: New England Economic Partnership.

Boston Sports IndexIndex 1920=1 (Babe Ruth traded to the Yankees, the curse begins)
Celtics Reign of Terror (57-69)
Multiple Bruins and Celtics Championships
Buckner!
Patriots Super Bowl Wins
Yankees win Game 7 ALCS with walk-off homerun
Red Sox come back to beat Yankees in ALCS and win WS
Red Sox 2007 WS Champs
Pats 16-0 and no Super Bowl
Notes: Red Sox given favorable weights. Yankees suck.
0
0.5
1
1.5
2
2.5
1950 1957 1964 1971 1978 1985 1992 1999 2006
Celtics?
But New England has been through tough times before...