Update on ROK Energy Sector and Energy...
26
Update on ROK Energy Sector and Energy policies May, 2013 Chung, Woojin ([email protected]) Nautilus Institute – East Asia Working Group Meeting
Transcript of Update on ROK Energy Sector and Energy...

Update on ROK Energy Sector and Energy policies
May, 2013
Chung, Woojin([email protected])
Nautilus Institute – East Asia Working Group Meeting
Korea Energy Economics Institute
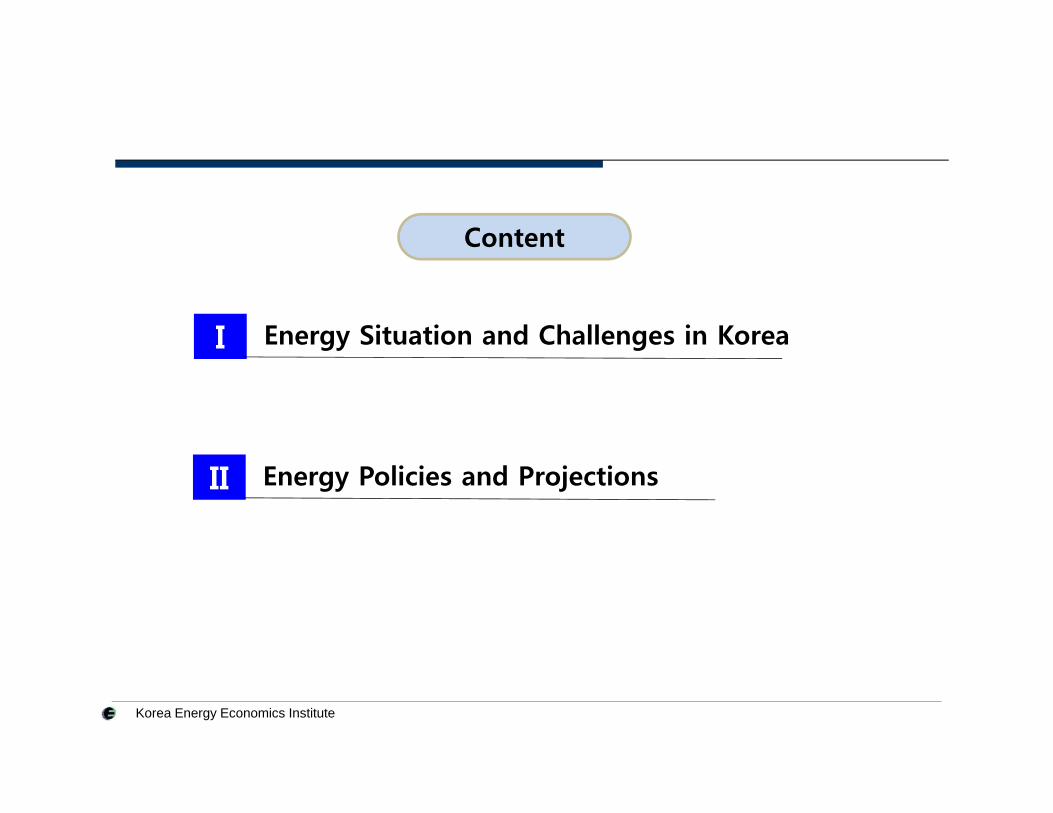
Content
I Energy Situation and Challenges in Korea
II Energy Policies and Projections

Korea Energy Economics Institute3
I Energy Situation and Challenges in Korea

Korea Energy Economics Institute4
Economic and energy growth
2.00
2.20
2.40
2.60
2.80
3.00
3.20
3.40
100
300
500
700
900
1100
1300
1500
1700
1900
GDP Energy Consumption
Energy/GDP(RHS)
275.7 Mtoe(2011)
toe/th. wonIndex : 1970=100
AAGR(`70~`11)Economy : 7.2%Energy : 6.7%

Korea Energy Economics Institute5
Primary energy shares by sources
0%
10%
20%
30%
40%
50%
60%
70%
80%
90%
100%
1970
1971
1972
1973
1974
1975
1976
1977
1978
1979
1980
1981
1982
1983
1984
1985
1986
1987
1988
1989
1990
1991
1992
1993
1994
1995
1996
1997
1998
1999
2000
2001
2002
2003
2004
2005
2006
2007
2008
2009
2010
2011
38.1%
27.8%
2.5%
16.8%
11.7%
0.6%2.4%
Firewood
Oil
Coal(Bituminous)
Coal(Anthracite) Natural gas
Nuclear powerRenewablesHydro

Korea Energy Economics Institute6
0%
10%
20%
30%
40%
50%
60%
70%
80%
90%
100%
1981
1982
1983
1984
1985
1986
1987
1988
1989
1990
1991
1992
1993
1994
1995
1996
1997
1998
1999
2000
2001
2002
2003
2004
2005
2006
2007
2008
2009
2010
2011
50.2%
16.5%
10.3%
19.3%
0.8%2.9%
Final energy shares by sources
Oil
Coal
Town gas
Electricity
RenewablesHeat
(2011)

Korea Energy Economics Institute7
0
20,000
40,000
60,000
80,000
100,000
120,000
140,000
1990
1991
1992
1993
1994
1995
1996
1997
1998
1999
2000
2001
2002
2003
2004
2005
2006
2007
2008
2009
2010
2011
Industry Transport R&C Public
Industry
51.3%Transport
19.2%
R&C
26.2%
Public
3.4%
Industry
62.6%Transport
17.5%
R&C
17.7%
Public
2.3%
(1990)
(2011)
Final energy shares by sectors
(Mtoe)
* R&C: Residential & Commerce

Korea Energy Economics Institute8
Generation by energy sources
0
100,000
200,000
300,000
400,000
500,000
1970
1971
1972
1973
1974
1975
1976
1977
1978
1979
1980
1981
1982
1983
1984
1985
1986
1987
1988
1989
1990
1991
1992
1993
1994
1995
1996
1997
1998
1999
2000
2001
2002
2003
2004
2005
2006
2007
2008
2009
2010
2011
Nuclear Power
Coal
GasCoal
30.2%
Nuclear
24.8%
Gas
27.8%
Oil6.3%
Hydro7.5%
Reneaw
bles
3.3%
Power capacity shares by energy souces
Mar., 2013
Oil(2.5)
Hydro(1.6%)
Renewables(2.5%)Heat(1.5%)
31.1%
40.2%
20.4%
MWh

Korea Energy Economics Institute9
Energy imports
3833 32
3849
67
8695
141
91
122
172
184
9 8 6 7 1015
2124
3823
32
52 56
200
300
400
500
600
700
0
20
40
60
80
100
120
140
160
180
200
2000 2001 2002 2003 2004 2005 2006 2007 2008 2009 2010 2011 2012
Energy importcost
Energy import volume(RHS)
Petroleum export revenue
Overseas dependency : 96.3%, Middle Eastern oil dependency : 87%
MtoeBillion US$
Energy import : $184 billion, Energy import/Total import : 32.8%

Korea Energy Economics Institute10
Energy efficiency
0
0.05
0.1
0.15
0.2
0.25
0.3
* The higher share of manufacturing industry in GDP- Share of service industry : ROK 40.1%, Japan 68.2%, USA 76.5%
* The higher share of heavy energy consuming industries in manufacturing- Share of Cement and Steel, Petrochemical in total energy : ROK 45%, OECD 22%
Toe/1,000GDP, 2005 USD
Source : IEA, 2013
Energy efficiencies of selected OECD countries

Korea Energy Economics Institute11
Greenhouse Gas Emission
Energy
85.2%
Industry process9.4%
Agriculture
3.3%
Waste
2.1%
0
100
200
300
400
500
600
700
2000 2001 2002 2003 2004 2005 2006 2007 2008 2009 2010
Million ton CO2eq
* Korea is the World 9th largest GHG emission country
* In 2008, the Korean Government announced a GHG reduction goal of 30% below the BAU level by 2020
GHG shares by sectors(2010)
GHG Emission

Korea Energy Economics Institute12
II Energy Policies and Projections

Korea Energy Economics Institute13
Energy policy direction
Expansion in supply of renewable energy
Increase in capacity of nuclear power
Green technology development both in domestic and towards global markets
Strengthening overseas resources development
Stable energy supply
Energy efficiency improvement
Market-based price system
Low Carbon & Low Energy Consumption Low Fossil Fuel
Development of Green Energy Industry
Promotion of Energy Security
Active involvement in global initiatives for climate change
Basic Policy 1 Basic Policy 2 Basic Policy 3 Basic Policy 4
Energy Vision: Low Carbon Green Growth
The 1st National Energy Basic plan(2009-2030)(established in 2008)
* The national energy basic plan should be revised every 5 year over a period of 20 years by law

Korea Energy Economics Institute 14
Energy demand projection and policy targets
• BAU Scenario : Business as usual(improving energy efficiency at a same speed as in the past
• Target Scenario : Aggressive policies for improving energy efficiency - National plan
0.17
0.22
0.27
0.32
0.37
230
250
270
290
310
330
350
2006 2010 2015 2020 2025 2030
Plan for energy demand & efficiency
12.4% (42Mtoe)Reduction
Demand(BAU)
Demand(Target)
Efficiency-RHS(BAU)
Efficiency(Target)
Mtoe Toe/M.Won
Korea Energy Economics Institute 15
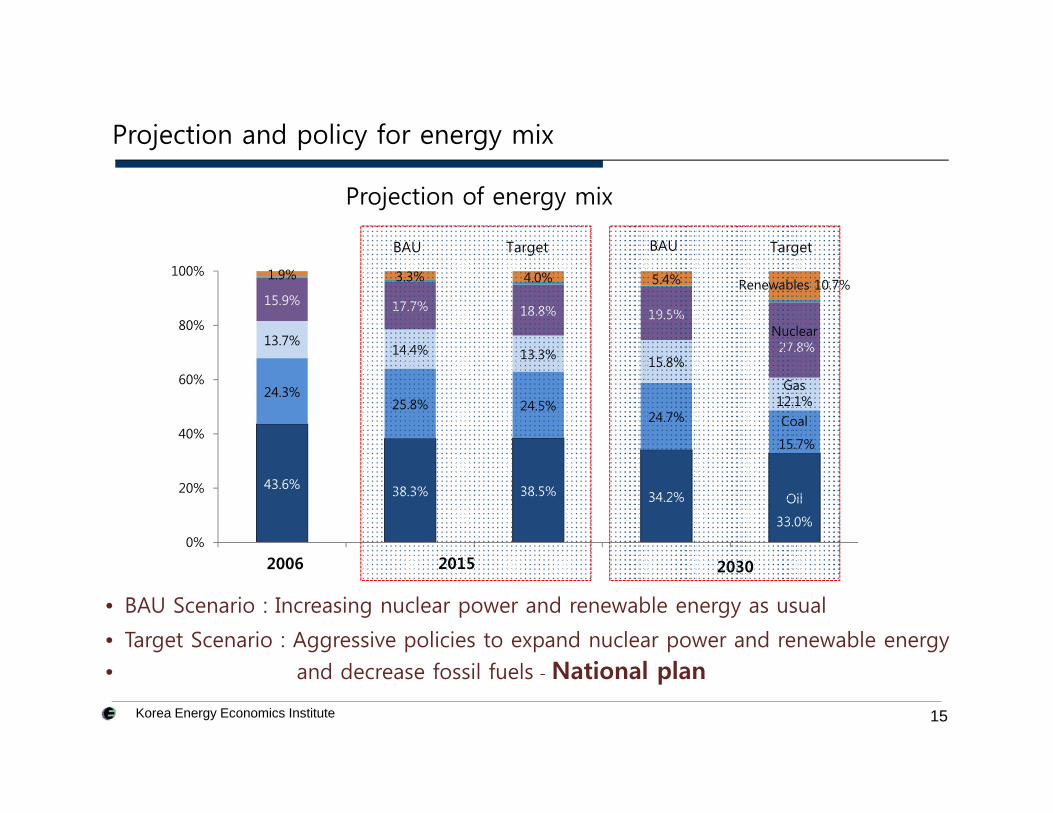
Projection and policy for energy mix
43.6% 38.3% 38.5% 34.2% Oil
33.0%
24.3%25.8% 24.5%
24.7% Coal
15.7%
13.7%14.4% 13.3% 15.8%
Gas12.1%
15.9% 17.7% 18.8% 19.5%Nuclear27.8%
1.9% 3.3% 4.0% 5.4% Renewables 10.7%
0%
20%
40%
60%
80%
100%
2006 2015 20302015 2030
BAU BAUTarget Target
2006
Projection of energy mix
• BAU Scenario : Increasing nuclear power and renewable energy as usual
• Target Scenario : Aggressive policies to expand nuclear power and renewable energy
• and decrease fossil fuels - National plan

Korea Energy Economics Institute16
Fukushima nuclear power accident in 2011
Anti-nuclear movements spread across the nation
Shale gas revolution and decreasing gas price
Change(?) the economics of coal and renewable, nuclear power over gas
Policy failure for market value electricity price
Electricity consumption encouraged and energy efficiency deteriorated
New government and policy review
Less emphasis(?) on “Low Carbon Green Growth”
Factors Impacts
Key factors to affect energy situation after the 1st planning

Korea Energy Economics Institute17
Energy Prices Policy and Its impacts
100
150
200
250
300
350
400
2000200120022003200420052006200720082009201020112012100
120
140
160
180
200
220
2000200120022003200420052006200720082009201020112012
2000=100 2000=100
Electricity
Town gas
Heavy fuel oil
Town gasElectricity
Final energy
Petroleum
Price Consumption
Energy demand in 2012 : (Plan ) 268.Mtoe, (Actual) 277.6Mtoe
Energy efficiency(Toe/GDP) in 2012 : (Plan ) 0.222, (Actual) 0.251
3.4% ↑
13.6% ↓
GDP in 2012 : (Plan ) 1,209 t.won, (Actual) 1,104 t.won 8.7% ↓
Actual/National plan
Korea Energy Economics Institute18
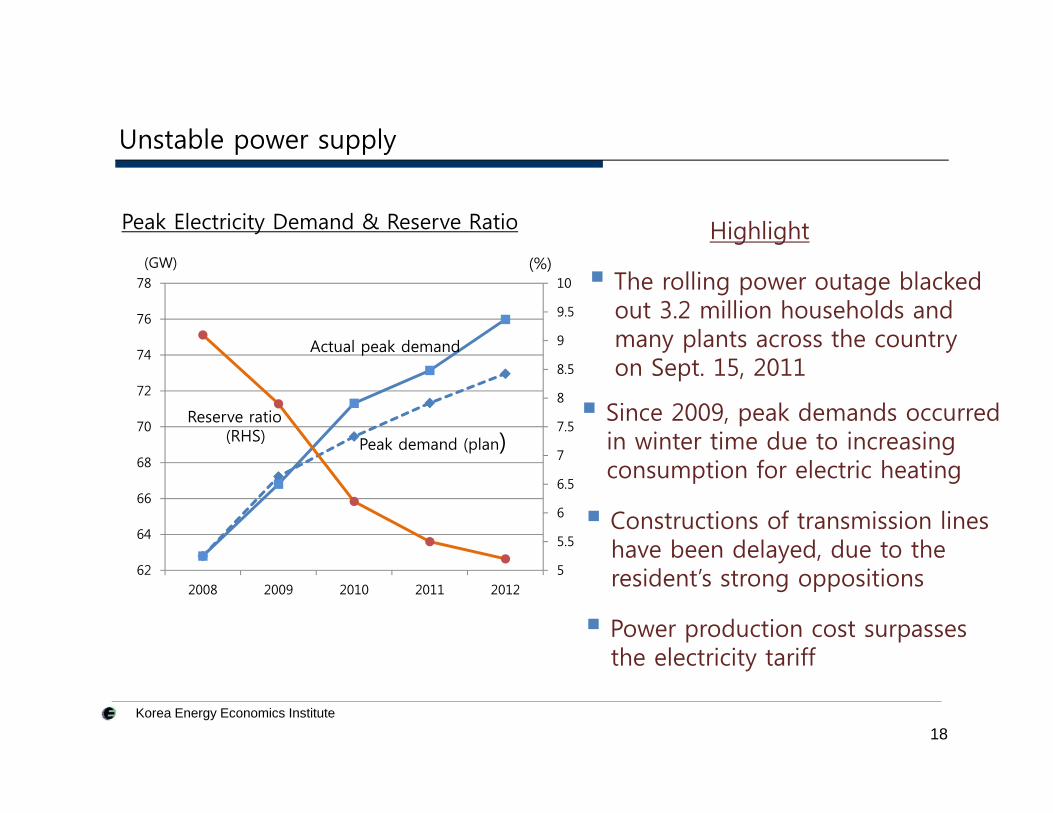
Unstable power supply
5
5.5
6
6.5
7
7.5
8
8.5
9
9.5
10
62
64
66
68
70
72
74
76
78
2008 2009 2010 2011 2012
Reserve ratio(RHS)
Actual peak demand
Peak demand (plan)
The rolling power outage blackedout 3.2 million households andmany plants across the country on Sept. 15, 2011
Since 2009, peak demands occurredin winter time due to increasing consumption for electric heating
(GW) (%)
Peak Electricity Demand & Reserve Ratio
Power production cost surpasses the electricity tariff
Highlight
Constructions of transmission lineshave been delayed, due to theresident’s strong oppositions

Korea Energy Economics Institute19
Measures for unstable power supply
• Completing new power plants early, delaying the abolishment of existingpower plants, and arranging repair work schedules
Measures for tight supply of electricity
• Reducing peak demand with focus on big consumers (more than 1,000kW, 4,000consumers) through incentives
• Strengthening demand management, shifting from regulatory measures toincentives
Challenge
• Introducing an electricity tariff system which induces energy conservation
“ The Korean government announced in June, 2009 to introduce an electricity pricing system that changes in line with international energy, but it has been suspended until now “

Korea Energy Economics Institute
Pressure to reduce nuclear share in energy mix
Challenges in nuclear power
Japan’s nuclear power accident
Loss of the public trusts of nuclear power
Other challenges in nuclear power
Fukushima challenge
• Setting the policy direction for high level radioactive waste
- Full capacity of temporary storage facilities in 2016, but no securing of interim storage- Negotiations on enriching uranium and recycling of spent fuel with US Gov. who
is reluctant to accept Korea’s demand
• Deciding whether to expand the life of nuclear powers- Delaying a decision to expand the life of two aging reactors due to resident and
NGO’s strong protests, though IAEA confirmed safety on them
• Securing the sites for new nuclear power plants- Two places are candidates, but the final decision is uncertain due to anti-nuclear
movements
20

Korea Energy Economics Institute21
Challenges in renewable energy industry
2.4
2.6
2.8
3
3.2
3.4
2008 2009 2010 2011
Failure in reaching a target, though rapidgrowth of renewable industries
Too aggressive target(?)Target
Actual shares
• The number of company : 2.2 times• The number of employees : 4.0 times• Company revenues : 8.2 times• Export of materials and appliances : 8 times
The growth of renewable industry (2007-2011)
↑↑
↑↑
Shrinking renewable markets from domestic and global recession
Introducing RPS system in 2012, replacingFIT scheme
success in inducing investments on renewable energy (?)
*RPS(Renewable Portfolio Standard) is the scheme toforce power producers to supply a certain amount of their power generation portfolio from NRS
*FIT(Feed-In Tariff) is the scheme of the government to compensate producers for the differences between the cost of electricity generated from NRS and thermal generation
<Renewable energy shares for primary energy> Highlight(%)
Korea Energy Economics Institute22
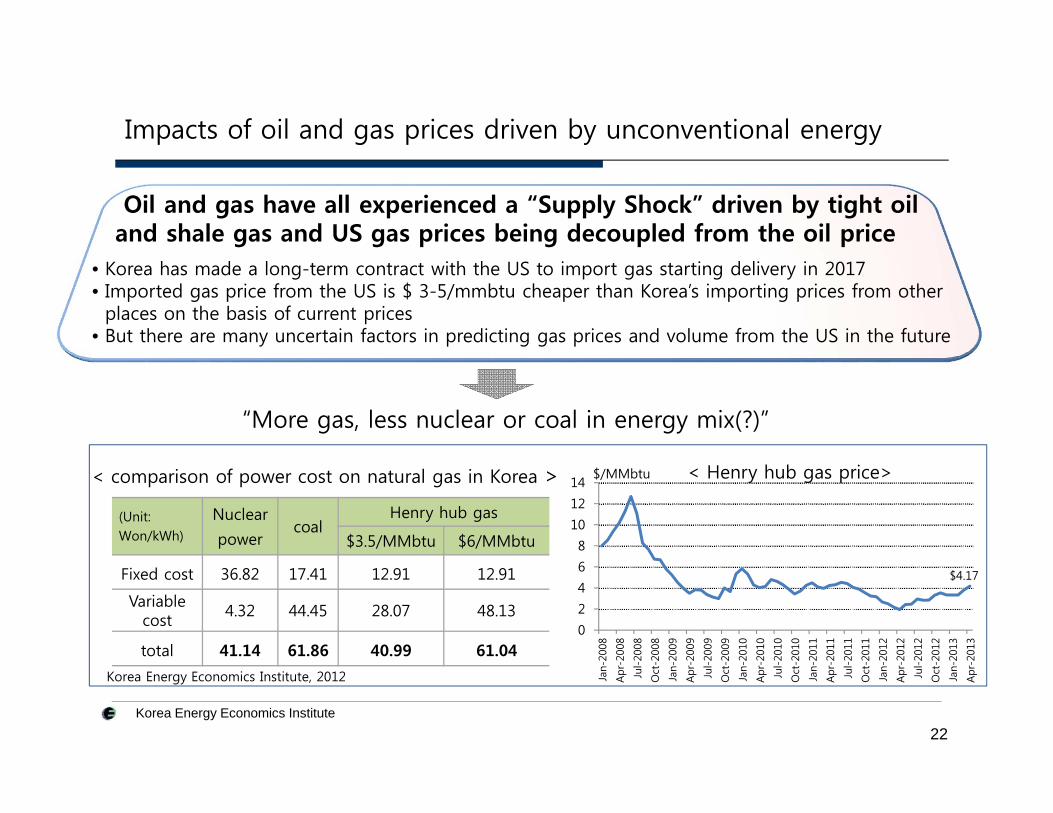
Impacts of oil and gas prices driven by unconventional energy
Oil and gas have all experienced a “Supply Shock” driven by tight oil and shale gas and US gas prices being decoupled from the oil price
• Korea has made a long-term contract with the US to import gas starting delivery in 2017 • Imported gas price from the US is $ 3-5/mmbtu cheaper than Korea’s importing prices from other places on the basis of current prices
• But there are many uncertain factors in predicting gas prices and volume from the US in the future
(Unit: Won/kWh)
Nuclear
powercoal
Henry hub gas
$3.5/MMbtu $6/MMbtu
Fixed cost 36.82 17.41 12.91 12.91
Variable cost
4.32 44.45 28.07 48.13
total 41.14 61.86 40.99 61.04
“More gas, less nuclear or coal in energy mix(?)”
< comparison of power cost on natural gas in Korea >
Korea Energy Economics Institute, 2012
0
2
4
6
8
10
12
14
Jan-
2008
Apr-
2008
Jul-20
08
Oct
-200
8
Jan-
2009
Apr-
2009
Jul-20
09
Oct
-200
9
Jan-
2010
Apr-
2010
Jul-20
10
Oct
-201
0
Jan-
2011
Apr-
2011
Jul-20
11
Oct
-201
1
Jan-
2012
Apr-
2012
Jul-20
12
Oct
-201
2
Jan-
2013
Apr-
2013
< Henry hub gas price>
$4.17
$/MMbtu

Korea Energy Economics Institute23
Energy policy of new government
The new government in Korea will follow the previous government’senergy policies, but with different weights on policies
The details of the policies have not been set yet
Energy policies of new government
• Strengthening the safety management and supervision of energy facilities including nuclear power
• Encouraging more competitive markets and market value prices in energy industries
• Establishing a society system of resource circulation
• Prompting energy cooperation with Northeast Asian countries through grid networks and energy trading
• Enriching energy supports for low income-households
Korea Energy Economics Institute24
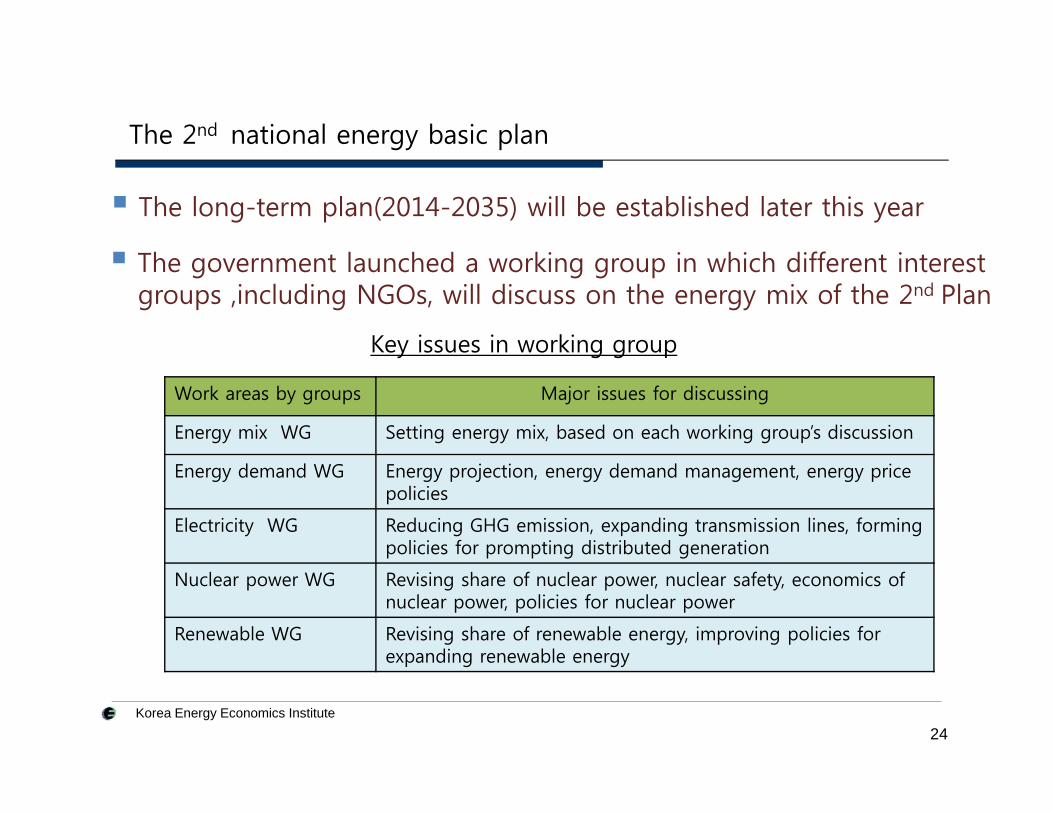
The 2nd national energy basic plan
The government launched a working group in which different interestgroups ,including NGOs, will discuss on the energy mix of the 2nd Plan
The long-term plan(2014-2035) will be established later this year
Work areas by groups Major issues for discussing
Energy mix WG Setting energy mix, based on each working group’s discussion
Energy demand WG Energy projection, energy demand management, energy price policies
Electricity WG Reducing GHG emission, expanding transmission lines, forming policies for prompting distributed generation
Nuclear power WG Revising share of nuclear power, nuclear safety, economics of nuclear power, policies for nuclear power
Renewable WG Revising share of renewable energy, improving policies for expanding renewable energy
Key issues in working group

Korea Energy Economics Institute25
• There is a likelihood that the share of nuclear energy down in energymix of the 2nd national plan
• Then, the shares of fossil fuels like coal or gas would rise, which create conflicts with low carbon policies
The projection of energy mix in the 2nd national plan
• It isn’t expected that the share of renewable energy rises in the 2nd
plan. The share could rather down

Korea Energy Economics Institute26
Thank you for your attention !