UPDATE ON ENERGY ACCESS SITUATION IN ASIA...
14
UPDATE ON ENERGY ACCESS SITUATION IN ASIA-PACIFIC LDCs How countries are tracking to meet the sustainable energy for all goals by 2030 ABDUL ALIM SENIOR ECONOMIC AFFAIRS OFFICER, UN-OHRLLS
Transcript of UPDATE ON ENERGY ACCESS SITUATION IN ASIA...

UPDATE ON ENERGY ACCESS SITUATION IN ASIA-PACIFIC LDCs
How countries are tracking to meet the sustainable energy for all goals by 2030
ABDUL ALIM
SENIOR ECONOMIC AFFAIRS OFFICER, UN -OHRLLS

Data Overview
Data for this analysis is sourced from the World Development Indicators, UNSD and the SEforALL Knowledge Hub drawing from the following reports: Global Tracking Framework (2012 data)
Access to Electricity
Primary Energy Intensity
Global Tracking Framework (forthcoming 2014 data)
Share of Renewables and Modern Renewables in Total Final Energy Consumption
Regulatory Indicators for Sustainable Energy (2015-2016 data)
Overall indicator
Energy Access Pillar
Renewable Energy Pillar
Energy Efficiency Pillar
IFC’s Ease of Doing Business (2016 data)
Overall rank
Getting Electricity indicator

Proportion of population with access to electricity
In 2012, around 34 per cent of the population in LDCs had access to electricity.
Huge gap between LDCs and the rest of the world
Urgent need to intensify efforts in making energy available for all and addressing the huge gaps .
Source: International Energy Agency (IEA) and the World Bank, 2015. ‘Sustainable Energy for All 2015—Progress Toward Sustainable Energy’. http://trackingenergy4all.worldbank.org/~/media/GIAWB/GTF/Documents/GTF-2105-Full-Report.pdf
Source: UNSD SDG Indicators Global Database

Proportion of population with access to electricity
Compared to African LDCs, The Asia-Pacific LDCs have greater access to electricity.
90 per cent of the urban population and 44.0 per cent of the rural population have access to electricity.
In African LDCs, 60 per cent of the urban and 13 per cent of the rural population has access to electricity
Access to electricity among the Asia-Pacific rural population is growing at 5.2 per cent annually, compared to 1.4 per cent annual growth in the urban areas
18.3
5.7 5.2
1.4
-
10.0
20.0
30.0
40.0
50.0
60.0
70.0
80.0
90.0
100.0
Rural Urban Rural Urban
1990 2000 2010 2012 2010-2012 (annual growth %)
Asian LDCs
African
LDCs
Source: OHRLLS calculations based on World Development Indicators, World Bank, 2017

Access to Electricity
The average for LDCs (34.1%) lagged far behind the global average (78.9%), and three Asian LDC’s fell below the average for the broader LDC grouping.
The rate of access to electricity for each of the LDCs in Asia fell below the global average, with 7 out of 13 Asian LDC countries included in the rankings having an access rate below 50%
Much progress is needed if we are to meet the goal of universal access by 2030
Source: International Energy Agency (IEA) and the World Bank, 2015. ‘Sustainable Energy for All 2015—Progress Toward Sustainable Energy’. http://trackingenergy4all.worldbank.org/~/media/GIAWB/GTF/Documents/GTF-2105-Full-Report.pdf
43.0
59.6
75.6
59.3
70.0
52.4
22.8
41.6
44.6
27.1
48.4
0 10 20 30 40 50 60 70 80 90 100
Afghanistan
Bangladesh
Bhutan
Cambodia
Kiribati
Lao PDR
Myanmar
Nepal
Solomon Islands
Timor-Leste
Tuvalu
Vanuatu
Yemen, Rep.
Percent of Total Population
Access to Electricity (2012)
LDCs Global Avg LDC Avg SDG Target 2030

Annual growth rate in energy access in per cent, Asian LDC’s, 2000-2012
The pace of development has especially been remarkable in Cambodia and Bangladesh, where energy access grew on average 5.4 and 5.3 per cent annually, respectively, from 2000 to 2012.
0.4
0.8 0.9 1.0 1.2 1.3 1.5 1.6
3.0 3.2
3.5
5.3 5.4
-
1.0
2.0
3.0
4.0
5.0
6.0
Source: OHRLLS calculations based on World Development Indicators, World Bank, 2017.

Share of Renewables in Total Final Energy Consumption (TFEC)
While the share of renewable energy in TFEC for LDCs in Asia is much higher than the Global average of 18.3%, this is almost entirely due to the use of traditional solid biomass.
Bhutan, Cambodia and
Lao PDR do however have a higher modern renewable share in TFEC than the global average of 11.1%
Source: Forthcoming IEA and World Bank Global Tracking Framework 2017
7.9%
0.2%
11.8%
19.0%
0.0%
17.5%
5.3%
6.2%
0.0%
0.0%
2.2%
1.1%
8.8%
37.3%
74.8%
49.0%
2.9%
72.9%
63.2%
78.2%
63.0%
19.0%
30.2%
0.0%
0% 10% 20% 30% 40% 50% 60% 70% 80% 90%
Afghanistan
Bangladesh
Bhutan
Cambodia
Kiribati
Lao PDR
Myanmar
Nepal
Solomon Islands
Timor-Leste
Vanuatu
Yemen
Total Share of Renewable Energy in TFEC (2014)
Modern Renewable Energy Traditional biomass

Energy intensity Asian LDCs, 2010-2012
There are opportunities to improve efficiency of energy use
2.6 3.2 3.2
3.8
4.6 5.3 5.4 5.5
5.9
7.3
11.8
0.0
2.0
4.0
6.0
8.0
10.0
12.0
14.0
Tuvalu and Timor-Leste data missing Source: UNSD SDG Indicators Global Database.

Rate of Change in Primary Energy Intensity
Source: International Energy Agency (IEA) and the World Bank, 2015. ‘Sustainable Energy for All 2015—Progress Toward Sustainable Energy’. http://trackingenergy4all.worldbank.org/~/media/GIAWB/GTF/Documents/GTF-2105-Full-Report.pdf

IFC’s Ease of Doing Business (EoDB) Ten out of the 12 LDC’s with EoDB rankings in Asia are in the bottom half of the rankings, indicating that these countries likely need support in improving their regulatory environment, which would make it more attractive for energy companies to invest in these economies.
High rank Low rank

Ease of Doing Business – “Getting Electricity” Indicator More than half of LDCs in Asia that are ranked in EoDB have scores in the bottom half of the rankings for the “getting electricity” indicator. This result signals that reliable electricity is difficult to come by for businesses in these countries and reinforces the need for initiatives to assist governments and utilities to incorporate renewable energy sources in the energy mix, in conjunction with energy storage options to ensure reliability of supply.
High rank Low rank

Regulatory Indicators for Sustainable Energy (RISE) | Overall Scores Source: World Bank 2017. Regulatory Indicators for Sustainable Energy: A Global Scorecard for Policy Makers. http://RISE.worldbank.org
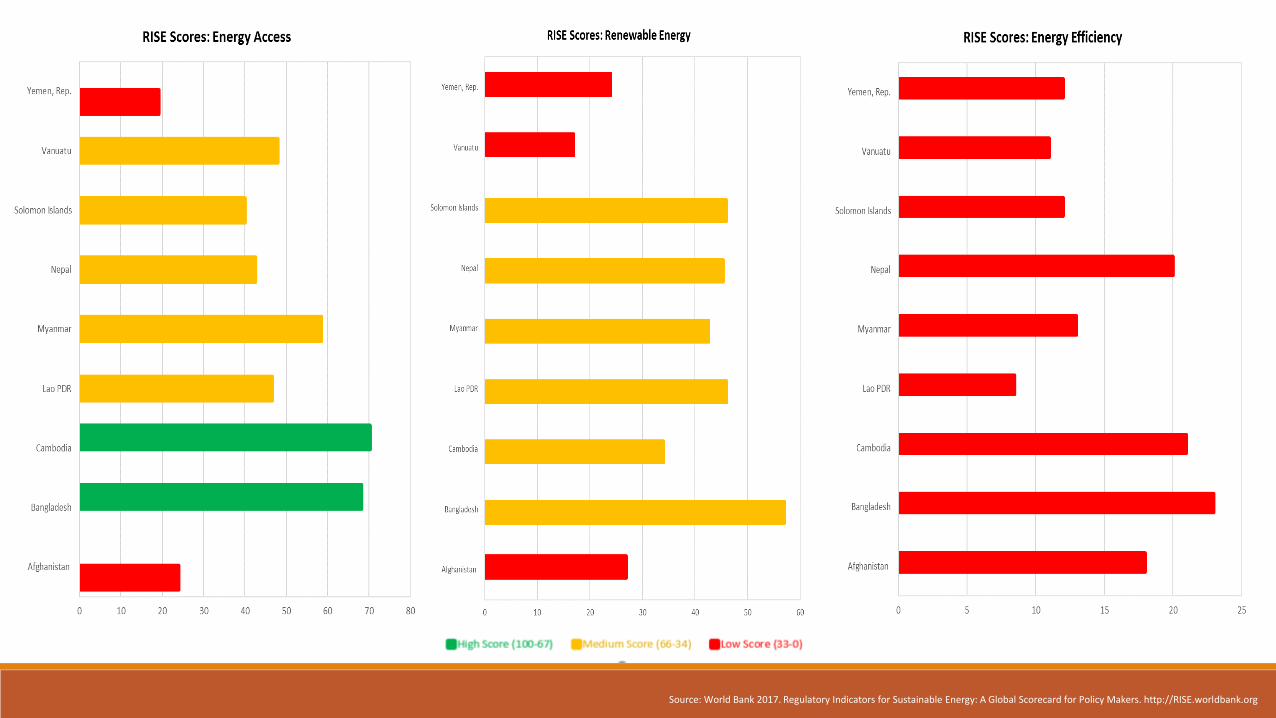
Source: World Bank 2017. Regulatory Indicators for Sustainable Energy: A Global Scorecard for Policy Makers. http://RISE.worldbank.org

The Way Forward
Designing and implementing robust energy policy as part of the integrated national development strategies
Major transformations of current energy systems and creating effective business models
Regulatory reforms, institutional capacity building and creating attractive investment climates
Decarbonizing and increasing the efficiency of existing and new energy infrastructures
Uninterrupted access to sustainable energy through modern energy eco-system including extraction, generation, transmission, distribution and consumption
In-house capacity for bankable project preparations and complex contract negotiations [Investment Promotion regimes for LDCs]
Fetching the bounty of technological innovation [advanced low-emission and renewable energy technologies] [R & D and Tech. Transfer through Technology Bank for LDCs]
Regional cooperation to optimize economies of scale
Financing for investments from public, private, national and international sources.