Update of Occurrence Rates for Offshore Oil Spills - BOEM
87
_____________ OCS Report BOEM 2012-069 BSEE 2012-069 ______________________________ Update of Occurrence Rates for Offshore Oil Spills ______________________________ Cheryl McMahon Anderson, Melinda Mayes, and Robert LaBelle June, 2012 Department of the Interior Department of the Interior Bureau of Ocean Bureau of Safety and Energy Management Environmental Enforcement 381 Elden Street 381 Elden Street Herndon VA 20170 Herndon VA 20170
Transcript of Update of Occurrence Rates for Offshore Oil Spills - BOEM
_____________ OCS Report
BOEM 2012-069 BSEE 2012-069
______________________________ Update of Occurrence Rates for Offshore Oil Spills ______________________________
Cheryl McMahon Anderson, Melinda Mayes, and Robert LaBelle June, 2012
Department of the Interior Department of the Interior Bureau of Ocean Bureau of Safety and Energy Management Environmental Enforcement 381 Elden Street 381 Elden Street Herndon VA 20170 Herndon VA 20170

ii
[This page intentionally blank]
iii
Update of Occurrence Rates for Offshore Oil Spills Abstract Estimates of occurrence rates for offshore oil spills are useful for analyzing potential oil-spill impacts and for oil-spill response contingency planning. With the implementation of the Oil Pollution Act of 1990 (U.S. Public Law 101-380, August 18, 1990), estimates of oil-spill occurrence became even more important to natural resource trustees and to responsible parties involved in oil and gas activities. Oil-spill occurrence rate estimates have been updated based on U.S. Outer Continental Shelf (OCS) Platform and Pipeline Spill Data (1964 through 2010), Worldwide Tanker Spill Data (1974 through 2008), and Barge Spill Data for U.S. waters (1974 through 2008). These oil-spill occurrence rates (“spill rates”) are expressed and normalized in terms of the number of spills per volume of crude oil handled. All estimates of spill rates were restricted to spills ≥1,000 barrels (159 m3, 159 kiloliters, 136 metric tonnes, 42,000 U.S. gallons). Spill rates for spills ≥ 1,000 include spill rates for spills of ≥ 10,000 barrels and ≥ 100,000 barrels. Updated spill rates for spills ≥ 1,000 barrels (bbl) and ≥ 10,000 bbl, compared to the previously published rates calculated through 1999 (Anderson and LaBelle, 2000), indicate: Spill rates for OCS platforms were unchanged for spills ≥1,000 bbl at 0.32 spills
per billion barrels (Bbbl), but improved from 0.12 to 0.06 spills per Bbbl for spills ≥10,000 bbl when examined over the entire record (1964 through 2010) and adjusted for a trend.
When comparing the most recent 15-years data (1996 through 2010 data) to the
last 15-years data in the previous analysis (Anderson and LaBelle 2000: 1985 through 1999 data) spill rates increased from 0.13 to 0.25 spills per Bbbl for spills ≥1,000 bbl; and increased from 0.05 to 0.13 spills per Bbbl for spills ≥10,000 bbl. These rates are still relatively low and include a spill from Hurricane Rita (2005) and the Macondo well spill in 2010. Prior to these two spills, the last OCS Platform spill ≥1,000 bbl occurred in 1980, and the last OCS Platform spill ≥10,000 bbl occurred in 1970. The most recent 15-year period spans the move of oil production into deepwater with deepwater Gulf of Mexico OCS oil production increasing from 20% of the total U.S, crude oil production in 1996 to 81% of the total in 2010.
Spill rates for OCS pipelines declined from 1.33 to 0 .94 spills per Bbbl over the
entire record (1964 through 2010) for spills ≥1,000 bbl when adjusted for a trend, and from 0.33 to 0.19 spills per Bbbl for spills ≥ 10,000 bbl. When examining the record over the last 15 years (1996 through 2010), the rates dropped from
iv
1.38 to 0.88 for spills ≥ 1,000 bbl and from 0.34 to 0.18 spills per Bbbl for spills ≥ 10,000 bbl.
All tanker spill rates continued the substantial declines noted in the last review
(Anderson and LaBelle, 2000). Most likely, tanker spills have declined due to major regulatory changes in the early 1990’s that substantially eliminated the use of single-hull tankers by requiring double hulls or their equivalent.
Spill volumes for spills from OCS platforms were also updated to include the average and median spill sizes for (a) the entire record from 1964 through 2009 and 2010, (b) the period 1995 through 2009 and (c) the period from 1996 to 2010. Two ending dates are shown to demonstrate the influence of the extreme volume of the 2010 Macondo well spill.
v
Update of Occurrence Rates for Offshore Oil Spills
TABLE OF CONTENTS
1.0 INTRODUCTION....................................................................................................1 1.1 Overview of Report ...................................................................................................1 1.2 Background ...............................................................................................................1
1.2.1 Bureau of Ocean Energy Management Responsibilities ...........................2 1.2.2 BOEM Oil Spill Modeling Program ..........................................................2 1.2.3 Applications of OSRA ...............................................................................2 1.2.4 Need for Oil-Spill Occurrence Rate Estimation Methodology ...................3
2.0 METHODS AND ASSUMPTIONS .......................................................................3 2.1 Data on Historical Spill Occurrences .......................................................................4
2.1.1 Sources of Oil Spill Occurrence Data ........................................................4 2.1.2 Historic Oil Spill Record ...........................................................................4 2.1.3 Spill Data Details .......................................................................................4
2.2 Selection of Exposure Variable ................................................................................5 2.3 Spill Rate Definition .................................................................................................6 2.4 Poisson Distribution Discussion ...............................................................................7
2.4.1 Requirements for Poisson Distribution for Estimating Oil-Spill Occurrence ...........................................................................................................7 2.4.2 Poisson Equation Used in Spill Rate Estimations ......................................8
3.0 ANALYSIS OF SPILL OCCURRENCE DATA AND OIL HANDLED ...........8 3.1 Petroleum Spills from OCS Platforms and Pipelines ...............................................8 3.2 Crude Oil Spills from Tankers in Worldwide Coastal and Offshore Waters ...........14 3.3 Crude Oil Spills from Tankers in U.S. Coastal and Offshore Waters .......................14 3.4 Crude Oil Spills from Alaska North Slope (ANS) Tankers ......................................16 3.5 Petroleum and Crude Oil Spills from Barges in U.S. Coastal, Offshore, and Inland Waters .............................................................................................................................16 4. SPILL RATES AND TREND ANALYSIS ..............................................................19 4.1 Tests to Determine if Spill Observations are Random and Independent ..................22 4.2 Production Interval Analysis .....................................................................................22 4.3 Fifteen-Year and Twenty-Year Rates .......................................................................25 4.4 Date Ranges for which Spill Rates were Calculated ...............................................25 5.0 RESULTS: ESTIMATED SPILL RATES ...........................................................25 5.1 Petroleum Spill Rates from OCS Platforms ..............................................................26
5.1.1 OCS Platforms: Entire Record (1964 through 2010) .................................27 5.1.2 OCS Platforms: Last 15 Years (1996 through 2010) .................................27
5.2 Petroleum Spill Rates from OCS Pipelines ..............................................................27 5.2.1 OCS Pipelines: Entire Record (1964 through 2010) ..................................27 5.2.2 OCS Pipelines: Last 15 Years (1996 through 2010) ..................................28

vi
5.3 Crude Oil Spill Rates from Tankers in Worldwide Coastal and Offshore Waters ....29 5.3.1 Worldwide Tankers: Entire Record, (1974 through 2008) ........................29
5.3.2 Worldwide Tankers: Last 15 Years (1994 through 2008) .........................30 5.4 Crude Oil Spill Rates from Tankers in U.S. Coastal and Offshore Waters .............31
5.4.1 U.S. Tankers: Entire Record (1974 through 2008) ....................................31 5.4.2 U.S. Tankers: Last 20 Years (1989 through 2008) ....................................32
5.5 Crude Oil Spill Rates from ANS Tankers “In Port” and “At Sea” ...........................33 5.5.1 ANS Tankers: Entire Record (1977 through 2008) ...................................33 5.5.2 ANS Tankers: Last 20 Years (1989 through 2008) ...................................33
5.6 Petroleum and Crude Oil Spill Rates from Barges in U.S. Coastal, Offshore, and Inland Waters ............................................................................................................34
5.6.1 U.S. Barges: Entire Record (1974 through 2008) .....................................34 5.6.2 U.S. Barges: Last 15 Years (1994 through 2008) ......................................35 6.0 DISCUSSION OF SPILL SIZES ...........................................................................36 6.1 Summary of Historic OCS Spill Sizes ≥ One Barrel ................................................37 6.2 Average and Median Spill Sizes ...............................................................................37 7.0 DISCUSSION AND CONCLUSIONS ..................................................................44 7.1 Spill Rates for Spills ≥1,000 Barrels .........................................................................44
7.1.1 OCS Platforms; Spill Rate ≥ 1,000 Barrels ..............................................44 7.1.2 OCS Pipelines: Spill Rate ≥ 1,000 Barrels ...............................................44 7.1.3 Worldwide Tankers: Spill Rate ≥ 1,000 Barrels ........................................45 7.1.4 U.S. Tankers: Spill Rate ≥ 1,000 Barrels ...................................................46 7.1.5 ANS Tankers: Spill Rate ≥ 1,000 Barrels ..................................................46 7.1.6 U.S. Barges: Petroleum Spill Rate ≥ 1,000 Barrels ....................................46 7.1.7 U.S. Barges: Crude Oil Spill Rate ≥ 1,000 Barrels ....................................47
7.2 Spill Rates for Spills ≥ 10,000 Barrels ......................................................................47 7.2.1 OCS Platforms: Spill Rate ≥ 10,000 Barrels .............................................47 7.2.2 OCS Pipelines: Spill Rate ≥ 10,000 Barrels ..............................................47 7.2.3 Worldwide Tankers: Spill Rate ≥ 10,000 Barrels ....................................... 47 7.2.4 U.S. Tankers: Spill Rate ≥ 10,000 Barrels .................................................47 7.2.5 ANS Tankers: Spill Rate ≥ 10,000 Barrels ................................................49 7.2.6 U.S. Barges: Petroleum Spill Rate ≥ 10,000 Barrels .................................49 7.2.7 U.S. Barges: Crude Oil Spill Rate ≥ 10,000 Barrels ..................................49
8.0 ACKNOWLEDGEMENTS ...................................................................................49 9.0 REFERENCES ........................................................................................................50 APPENDIX A. TREND ANALYSIS FOR OIL SPILL OCCURRENCE RATES 53 A.1 Spill Rates Trend Analyses ......................................................................................53 A.2 Statistical Tests ........................................................................................................56
A.2.1 Statistical Treatment of Variation in Data Sets .........................................57 A.2.2 Kendall’s Test for Correlation for OCS Platform Spills ...........................58 A.2.3 Runs Up, Runs Down Test for OCS Platform Spills ................................61

vii
A.2.4 Hotelling and Pabst’s Tests for OCS Platform Spills ...............................63 A.2.5 Kendall’s Test for Correlation for OCS Pipeline Spills ............................64 A.2.6 Runs Up, Runs Down Test for OCS Pipeline Spills ................................66 A.2.7 Hotelling and Pabst’s Test for OCS Pipeline Spills ..................................66
APPENDIX B. SAMPLE CALCULATION OF ESTIMATED SPILL OCCURRENCE PROBABILITY USING 1964 TO 2008 WORLDWIDE TANKER SPILL RATES ...............................................................................................................69 APPENDIX C. DATA ON OCS OIL SPILLS ...........................................................71 OK. C.1 OCS Petroleum Spills, 1964 through 2010 ......................................................71 C.2 OCS Petroleum Spills, Most Recent 15-Year Periods, 1995 through 2009 and 1996 through 2010, All Spill Sizes ..........................................................................................72 C.3 Hurricane-Related Petroleum Spills ≥ One Barrel ...................................................73

viii
TABLE OF TABLES
Table 1. OCS Crude Oil and Petroleum Spills ≥1 Barrel and OCS Production, 1964 through 2009 ...................................................................................................................10
Table 2. Number of OCS Petroleum Spills ≥ 1,000 Barrels, 1964 through 2010 ...........10
Table 3. Petroleum1 Spills ≥ 1,000 Barrels from OCS2 Platforms, 1964 through 2010 ..11
Table 4. Petroleum Spills ≥ 1,000 Barrels from OCS Pipelines, 1964 through 2010 .....13
Table 5. Crude Oil Spills, ≥ 1,000 Barrels from Tankers Worldwide At Sea and In Port Worldwide Crude Oil Transported, and Annual Spill Rates, 1974 through 2008 ...........15
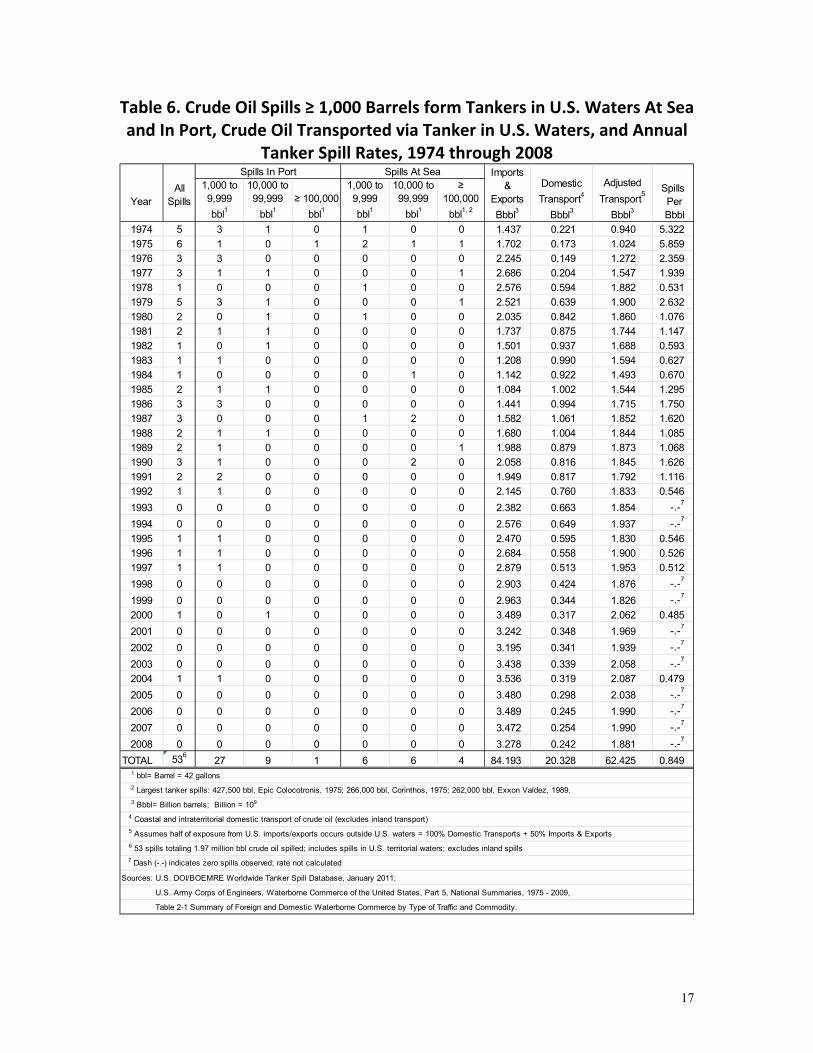
Table 6. Crude Oil Spills ≥ 10,000 Barrels from Tankers in U.S. Waters At Sea and In Port, Crude Oil Transported via Tanker in U.S. Waters, and Annual Spill Rates, 1974 through 2008 ....................................................................................................................17
Table 7. Petroleum Spills ≥ 1,000 Barrels from Barges in U.S. Waters, including Inland Waters, Petroleum Transported via Barge, and Annual Spill Rates, 1974 through 2008..................................................................................................................................20
Table 8. Duration of Available Spill Occurrence Records, and Subsets Identified to Reveal Trends .................................................................................................................26
Table 9. Spill Rates for Petroleum Spills ≥ 1,000 Barrels from OCS Platforms and Pipelines, 1964 through 2010 ..........................................................................................28
Table 10. Spill Rates for Crude Oil Spills ≥ 1,000 Barrels from Tankers Worldwide, 1974 through 2008 ....................................................................................................................30
Table 11. Spill Rates for Crude Oil Spills ≥ 1,000 Barrels from Tankers in U.S. Coastal and Offshore Waters, 1974 through 2008 ........................................................................32
Table 12. Spill Rates for Alaska North Slope Crude Oil Spills ≥ 1,000 Barrels from Tankers, U.S. Flag Ships, 1977 through 2008 .................................................................34
Table 13. Spill Rates for Petroleum and Crude Oil Spills ≥ 1,000 Barrels from Barges in U.S. Coastal, Offshore, and Inland Waters, 1974 through 2008 .....................................36
Table 14. Averaged and Median Spill Sizes by Spill Source for Spills ≥ 1,000 Barrels .39
Table 15. Average and Median Spill Sizes by Spill Source for Spills ≥ 10,000Barrels ..40
Table 16. OCS Petroleum Overall Spill Size Characterization by Spill Source, 1996 through 2010 ....................................................................................................................41
Table A-1. Cumulative Percent Production Volume vs. Cumulative Percent Platform Spills Included .................................................................................................................55
Table A-2. Cumulative Percent Production Volume vs. Cumulative Percent Pipeline Spills Included .................................................................................................................56
Table A-3. Runs Up, Runs Down Test for Randomness, OCS Platform Spills ≥1,000 Barrels ..............................................................................................................................62
Table A-4. Hotelling and Pabst’s Tests for Rank-Order Correlation of OCS Platform Spills ≥1,000 Barrels .......................................................................................................64
ix
Table A-5. Runs Up, Runs Down Test for Randomness, OCS Pipeline Spills ≥1,000 Barrels, Full Record (1964 through 2010) ......................................................................67
Table A-6. Hotelling and Pabst’s Test for OCS Pipeline Spills ≥1,000 Barrels, 1964 through 2009 ...................................................................................................................68
Table B-1 Estimated Probability of Spill Occurrence Using 1998 to 2008 Worldwide Tanker Spill Rates ...........................................................................................................70
x
TABLE OF FIGURES
Figure 1. OCS Oil Production vs. Petroleum Spills ≥ 1,000 Barrels, 1964 through
2010..................................................................................................................................12
Figure 2. Crude Oil Spills ≥ 1,000 Barrels from Tankers Worldwide vs. Crude Oil Transported Worldwide, 1974 through 2008 ..................................................................14
Figure 3. Crude Oil Spills ≥ 1,000 Barrels from Tankers in U.S. Waters vs. Crude Oil Transported in U.S. Waters, 1974 through 2008 ............................................................18
Figure 4. Alaska North Slope Crude Oil Tanker Spills≥ 1,000 Barrels vs. Total Crude Oil Loadings at Valdez, Alaska and Crude Oil Shipment Destinations, 1977 through 2008..19
Figure 5. Crude Oil and Petroleum Spills ≥ 1,000 Barrels from Barges in U.S. Waters vs. Petroleum Transported in U.S. Waters, 1974 through 2008 ...........................................21
Figure 6. Petroleum Spills ≥ 1,000 Barrels from OCS Activities from Platforms, by Size Category within One Billion Barrel Production Intervals, 1964 through 2010 ..............23
Figure 7. Crude Oil Spills ≥ 1,000 Barrels from OCS Pipelines by Size Category within 0.5 Billion Barrel Production Intervals, 1964 through 2010 ..........................................24
Figure 8. Spill Rates by Year for Crude Oil Spills ≥ 1,000 Barrels from Worldwide Tankers and Tankers in U.S. Waters .............................................................................31
Figure 9. Spill Rates by Year for Petroleum and Crude Oil Spills ≥ 1,000 Barrels from Barges in U.S. Waters .....................................................................................................35
Figure 10.Petroleum Spills from OCS Oil and Gas Activities: Spill Numbers and Sizes by Size Category, 1964 through 2009 .............................................................................38
Figure 11. Comparison of Historic Rates for Spills ≥ 1,000 Barrels ..............................42
Figure 12. Comparison of Historic Rates for Spills ≥ 10,000 Barrels ............................43
Figure 13. Comparison of Average and Median Spill Size by Spill Source for Spills ≥ 1,000 Barrels ...................................................................................................................45
Figure 14. Comparison of Average and Median Spill Size by Spill Source for Spills ≥ 10,000 Barrels .................................................................................................................48
Figure A-1. Kendall’s Test for Correlation for OCS Platform Spills ≥1,000 Barrels
Figure A-1(a). Kendall’s Test using Data from Nakassis (1982) ...........58
Figure A-1(b). Kendall’s Test Including One January 1973 Spill and Production Data as of May 2011 ............................................................59
Figure A-1(c). Kendall’s Test Including Both January 1973 Spills and Production Data as of May 2011 ............................................................60
Figure A-2. Kendall’s Test for Correlation for OCS Pipeline Spills ≥1,000 Barrels .....65
Figure C-1. Cumulative Frequency Distribution for All Petroleum Spills from OCS Oil and Gas Operations, 1995 through 2009 .........................................................................73
Figure C-2. Petroleum Spills from OCS Oil and Gas Activities by Spill Sizes and Volume, 1995 through 2009 ...........................................................................................74
Figure C-3. Petroleum Spills from OCS Oil and Gas Activities by Spill Sizes by Volume, 1996 through 2010 ..........................................................................................................75

xi
ABBREVIATIONS AND ACRONYMS LIST ANS Alaska North Slope
bbl Barrel or barrels; Barrel (42 U.S. gallons, 0.159 kiloliters, 0.159 m3, or 0.136 metric tonnes)
Bbbl Billion barrels, 109 bbl or 1,000,000,000 bbl.
Billion 109 as used in the U.S. and Canada; not 1012, as used in Europe
BOEMRE Bureau of Ocean Energy Management, Regulation and Enforcement
BOEM Bureau of Ocean Energy Management
BSEE Bureau of Safety and Environmental Enforcement
COE U.S. Army Corps of Engineers
DOC Department of Commerce
DOI Department of the Interior
EIS Environmental Impact Statement
IMO International Maritime Organization
MMbbl Millions of barrels
MMS Minerals Management Service
NEPA National Environmental Policy Act
OCS Outer Continental Shelf
ONRR Office of Natural Resource Revenue
OPA 90 Oil Spill Pollution Act of 1990
OSRA Oil Spill Risk Analysis
OSRP Oil Spill Response Plans
TAPS Trans-Alaska Pipeline System
USCG U.S. Coast Guard
VPBS volume (of oil) produced between spills
1
1.0 INTRODUCTION The purpose of this report is to document the updated oil-spill occurrence rate estimates used in reports generated by the Bureau of Ocean Energy Management (BOEM). This report describes the data used, the methodology applied, and the results achieved to prepare these estimates. 1.1 Overview of Report This report is organized as follows:
Section 1. Introduction Section 2. Methods and Assumptions Section 3. Analysis of Spill Occurrence Data and Oil Handled Section 4. Spill Rate Trend Analysis Section 5. Results: Estimated Spill Rates Section 6. Historic, Average, and Median Spill Sizes Section 7. Discussion and Conclusions
Also included are Sections 8 (Acknowledgments), 9 (References) and three appendices. Appendix A covers statistical tests conducted on the data. Appendix B presents sample calculations on estimated spill occurrence probabilities as calculated from spill rates. Appendix C details historic spill sizes and spill numbers and discusses spills associated with hurricane damage. These have been included to provide the reader with background information for those seeking further detail. 1.2 Background
BOEM is charged with management of oil and gas development on the Outer Continental Shelf in an environmentally and economically sound manner. The U.S. Outer Continental Shelf (OCS) as defined by the Federal government consists of the submerged lands, subsoil, and seabed, lying between the seaward extent of the States' jurisdiction and the seaward extent of Federal jurisdiction. Federal jurisdiction is defined under accepted principles of international law. Generally, the OCS begins 3-9 nautical miles from shore (depending on the state) and extends 200 nautical miles outward or farther if the continental shelf extends beyond 200 nautical miles (http://www.bsee.gov/Priority-Pages/Outer-Continental-Shelf-(OCS)-Jurisdiction.aspx). As part of the responsibility to manage the OCS, BOEM conducts modeling of oil-spill trajectories to identify areas that may be impacted by a spill, should a spill occur in a given area. The oil-spill modeling outputs are used in preparation of National Environmental Policy Act (NEPA) documents such as Environmental Impact Statements (EISs) and Environmental Assessments (EAs). The data from this current report are used by BOEM in both the oil-spill modeling and in the EIS preparation. This section provides additional detail on each of these points.
2
1.2.1 Bureau of Ocean Energy Management Responsibilities
On October 1, 2011, the Bureau of Ocean Energy Management, Regulation and Enforcement (BOEMRE), formerly the Minerals Management Service (MMS), was replaced by the Bureau of Ocean Energy Management (BOEM) and the Bureau of Safety and Environmental Enforcement (BSEE) as part of a major reorganization. BOEM is responsible for managing environmentally and economically responsible development of the nation’s offshore resources. Its functions include offshore leasing, resource evaluation, review and administration of plans for oil and gas exploration, development, and production, renewable energy development, NEPA analysis, and environmental studies (http://www.boem.gov/). BSEE is responsible for safety and environmental oversight of offshore oil and gas operations, including permitting and inspections of offshore oil and gas operations. Its functions include the development and enforcement of safety and environmental regulations, permitting offshore exploration, development and production, inspections, offshore regulatory programs, oil spill response, and training and environmental compliance programs (http://www.bsee.gov/).
1.2.2 BOEM Oil‐Spill Modeling Program BOEM assesses oil-spill risks associated with offshore energy activities off the U.S. continental coast and Alaska by calculating oil-spill trajectories and contact probabilities through the BOEM Oil Spill Modeling Program http://www.boem.gov/Environmental-Stewardship/Environmental-Assessment/Oil-Spill-Modeling/Oil-Spill.aspx. The BOEM Oil-Spill Risk Analysis (OSRA) model combines the probability of spill occurrence with a statistical description of hypothetical oil-spill movement on the ocean surface. The OSRA model was initially developed in 1975 by the Department of the Interior (DOI) as a tool to evaluate offshore oil-spill risks (Smith et al., 1982; LaBelle and Anderson, 1985; Ji et al., 2011). 1.2.3 Applications of OSRA The major use of OSRA estimates is in support of OCS Lease Sale NEPA documents. BOEM is committed to the continuous improvement of OSRA estimates and NEPA analysis, and BOEM uses the results of new ocean, ice, and meteorology field and modeling studies to fulfill that commitment. As offshore activity expands into deeper waters and new geographic areas, BOEM oil-spill modeling will be used in pertinent NEPA assessments and validated with environmental observations. Modeling results are used by:
BOEM staff for preparation of environmental documents in accordance with NEPA (http://www.boem.gov/Environmental-Stewardship/Environmental-Assessment/NEPA/Index.aspx)
Other Federal and State agencies for review of EISs Environmental assessments Endangered species and essential fish habitat consultations

3
Oil industry specialists for preparation of oil spill response plans (OSRP) http://www.bsee.gov/About-BSEE/index.aspx.
BSEE in oil spill planning and preparedness It should be recognized that the OSRA was developed to address a need for a long-term, stochastic approach to estimate risk over decades for programmatic analyses. It is not a real-time spill response tool, although features and inputs to the model may be applicable for those uses as well. 1.2.4 Need for Oil‐Spill Occurrence Rate Estimation Methodology A realistic, objective methodology for estimating oil-spill occurrence rates is required for the OSRA model's application. The estimated mean number of spills is used in conjunction with the Poisson distribution (as described in Section 2.4) to estimate the probability of spill occurrence. BSEE developed and maintains oil-spill databases on all Outer Continental Shelf (OCS) spills, tanker spills in U.S. and worldwide waters, and barge spills in U.S. waters which are used to support these estimations (Lanfear and Amstutz, 1983; Anderson and LaBelle, 1990, 1994, 2000). This report updates the work of Anderson and LaBelle (2000).
2.0 METHODS AND ASSUMPTIONS Many factors can affect the likelihood of an oil spill occurring over the 15- to 40-year life typically associated with lease sale activities: timing of exploration, development, and production; volume of production; type and location of drilling rigs; mode of product transportation and loading; weather and other external factors. Such data limitations preclude using elaborate spill-prediction techniques. http://www.boem.gov/Environmental-Stewardship/Environmental-Assessment/Oil-Spill-Modeling/Oil-Spill-Occurence-Rate-for-Oil-Spill-Risk-Analysis-(OSRA).aspx This report presents a simple approach for estimating oil spill occurrence normalized as a function of the volume of oil handled, where “handled” is defined for OCS platforms and pipelines as petroleum produced from OCS platforms, and “handled” is defined for tankers and barges as petroleum transported. The method used in revising oil spill occurrence rates involved three basic steps:
1. Data on historical spill occurrences and on volume of oil handled were examined. 2. Volume was chosen as the exposure variable. 3. Spill occurrence rates were estimated and normalized based on number of spills
per volume handled. The estimated mean number of spill occurrence is used with the Poisson distribution to estimate the probability of spill occurrence. Oil spill occurrence rates (hereafter referred to simply as “spill rates”) were calculated for: OCS platforms, OCS pipelines, Worldwide, U.S., and Alaska North Slope tankers, and U.S. barges.

4
2.1 Data on Historical Spill Occurrences This section addresses the following aspects of the data on oil spill occurrence:
Sources of oil spill occurrence data Availability of historic oil spill records Spill data details
2.1.1 Sources of Oil‐Spill Occurrence Data BSEE maintains oil-spill databases on all U.S. Outer Continental Shelf spills, tanker spills worldwide, and barge spills in U.S. waters. BSEE collects information from many sources to maintain this database. Information on worldwide tanker spills comes from a number of international and foreign sources. Information on tanker spills and barge spills in U.S. waters is collected by the United States Coast Guard (USCG). Data on spills from pipelines and platforms on the OCS is collected under BSEE regulatory authority from the lessees. In the U.S., spills of oil and hazardous substances are also reported to the National Response Center. 2.1.2 Historic Spill Records BSEE requires that all OCS oil spills ≥ 1 bbl be reported to the Bureau. Oil spills of any size are required to be reported to the National Response Center. Preliminary information from ongoing OCS spill investigations can also be made available to BSEE for analyses. BSEE maintains a database on spills of all sizes of crude oil and “petroleum,” which includes crude oil and petroleum products. Spill data from 1964 through 2010 were utilized for the OCS pipeline and platform spill data presented in this update. Spill data from 1974 through 2008 was utilized for tanker spills, worldwide tankers, and barges in U.S. waters. Spills from tankers in U.S. waters are a subset of worldwide tanker spills, as are the Alaska North Slope (ANS) tanker fleet’s spills. The record on the ANS fleet does not begin until 1977, when this fleet began transporting oil from Valdez, AK. Prior to 1973, international oil spill occurrences were recorded on an irregular basis; more stringent reporting requirements were introduced in 1973 (Intergovernmental Maritime Consultative Organization International Convention for the Prevention of Pollution from Ships, 1973; Federal Water Pollution Control Act, U.S. Public Law 92-500, October 18, 1972; amended by U.S. Public Law 93-207, December 28, 1973). For tanker and barge spill data, there is generally a time lag in their availability. For spills ≥1,000 bbl, spill investigations frequently take a year or more to complete, especially since spill volumes are generally used to calculate monetary penalties. Responsible parties worldwide are reluctant to share spill data; they generally report the minimum information required to the relevant governing authorities (which may share some or none of the information with the outside world). The USCG, the reporting

5
authority for tanker and barge spills in US waters, typically withholds data on spills until their investigation is complete. Although there are reporting regulations for spills in international waters, public availability of this spill information is delayed and of inconsistent quality. It generally requires significant manpower and other costs to collect comprehensive worldwide tanker spill data. For the reasons cited above, data on barge and tanker spills analyzed in this report (through 2008) were the data available during the initial drafting of the report. 2.1.3 Spill Data Details The types of data that are reported about spills vary by source, but the data generally include information on the spill substance, size, source, and location. In this report the data are reported in categories, as listed below:
o Spilled substances: 1) The term petroleum is used for platform and pipeline spills and includes crude oil and condensate. For platform spills, the term petroleum also includes diesel fuel because in the past, a few spills of diesel fuel from platforms have occurred as a result of hurricane damage. These spills are counted in this study; 2) Spills from tankers (worldwide, U.S. and those carrying Alaska North slope production) involve the spillage of crude oil, and so term ‘crude oil’ is used for tanker spills in this study; 3) Barge spills (U.S. waters) involve spills of both crude oil and other petroleum products (gasoline, jet fuel, kerosene, distillate fuel oil, residual fuel oil, lubricating oils and greases, naphtha, petroleum solvents, asphalt, tar and pitches, and liquefied gases) and data on both types of spills are available. Therefore, both the terms crude oil and petroleum are used for barge spills in this study.
o Spill sizes: Three sizes of spills are analyzed: ≥1,000 bbl and ≥10,000 bbl (for all spill sources) and ≥100,000 bbl (for worldwide tankers). The focus of this report is on large spills that are ≥1,000 bbl, because spills smaller than that may not persist long enough to be simulated by trajectory modeling. Another consideration is that a large spill is more likely to be identified and reported; therefore, these historic large spill records are generally more comprehensive than those of smaller spills. Smaller spills are addressed in BOEM's environmental analyses without the use of trajectory modeling. Appendix C presents data on all OCS oil spills regardless of size. It should be noted that spills ≥ 10,000 bbl and ≥100,000 bbl are subsets of the spill rate for spills ≥ 1,000 bbl.
o Spill Sources: Six basic sources of spills are evaluated in this report - OCS platforms - OCS pipelines - Worldwide tankers, coastal and offshore waters

6
- Tankers in U.S. coastal and offshore waters - Tankers and/or U.S. flagships carrying Alaska North Slope crude - Barges in U.S. coastal, offshore, and inland waters
In this report, OCS platform spills include spills related to operations at both drilling rigs and production platforms. 2.2. Selection of the Exposure Variable Two basic criteria were used in selecting the exposure variable: the exposure variable should be simple to define, and it should be a quantity that can be estimated. The volume of oil handled was chosen as the exposure variable primarily for the following reasons: Historic data on the volume of OCS oil handled, and associated oil spills, is
recorded and maintained by DOI, Office of Natural Resource Revenue (ONRR). Using these volumes makes the calculation of the estimated oil-spill occurrence rate simple—the ratio of the number of historic spills to the volume of oil handled. Oil volume exposures for tanker rates were also based on comprehensively maintained data series from: COE (Waterborne Commerce) for tankers in U.S. waters; DOC (ANS loadings) for ANS tankers; and British Petroleum (Statistical Review of World Energy - world crude oil imports) for tankers worldwide.
Estimates of future OCS oil production are scientifically estimated by the BOEM Resource Evaluation Program. The estimates of future oil production are multiplied by the oil-spill occurrence rates to estimate the mean number of spills likely to occur as the result of that volume of production.
For this report, volume is reported in bbl to assist policy and decision makers in government and industry. Based on average Arabian light crude oil (35.5o American Petroleum Institute (API) gravity), 1 bbl is equal to the following: 0.159 kiloliters, 0.159 m3, 0.136 metric tonnes, and 42 U.S. gallons. 2.3 Spill Rate Definition Estimated occurrence rates for oil spills (spill rates) are based on historic spill occurrences and the associated volume of oil produced and transported. Spill rates are expressed in terms of the estimated mean number of spills per billion barrels (Bbbl) of oil handled. Bbbl is defined as 109 bbl or 1,000,000,000 bbl. In other words, for this report, a ‘billion’ is 109, as commonly used in the United States and Canada (not 1012, which the term ‘billion’ represents in Europe). A spill rate is an estimate of the mean number of spills of a given size range that is likely to occur over a uniform volume of oil handled. Spill rates for spills ≥1,000 bbl include spills ≥10,000 bbl and ≥ 100,000 bbl.

7
For each spill source analyzed, spill occurrence rates are estimated for spills ≥1,000 bbl and spills ≥10,000 bbl; additionally, spill occurrence rates are estimated for worldwide tanker spills ≥100,000 bbl, because the average tanker spill size is 118,000 bbl. 2.4 Poisson Distribution Discussion This section considers whether oil-spill occurrence is a Poisson process, and presents equations used in BOEM’s estimation of spill rates. 2.4 .1 Requirements for Poisson Distribution for Estimating Oil‐Spill Occurrence Spill occurrence has been modeled previously as a Poisson process (Smith et al., 1982; Lanfear and Amstutz, 1983; Anderson and LaBelle, 1990, 1994, 2000). These references can be found at http://www.boem.gov/Environmental-Stewardship/Environmental-Assessment/Oil-Spill-Modeling/Oil-Spill-Occurence-Rate-for-Oil-Spill-Risk-Analysis-(OSRA).aspx. A stochastic process, N(t), is a counting process, if N(t) represents the total number of events that have occurred up to time t. To determine if the counting process of spill occurrence is a Poisson process, with t = the volume of oil handled as the exposure variable instead of time, and where λ is the true rate of spill occurrence per unit exposure, the occurrence of spills must meet the following three criteria (Ross, 1985): (a) N(0) must equal zero with a probability equal to 1. (b) The process must have independent increments (i.e., the number of spill
occurrences for any given interval does not depend on the previous or following intervals).
(c) The number of events in any interval of length t must be Poisson distributed with
a mean of λt (i.e., this process must have stationary increments where the number of spills that occur in any interval depends only on the length of the interval).
These criteria have been met since: (a) No spills can occur when no (0 bbl) oil is handled. (b) Analysis of the record indicates that individual spill events are independent of
previous spill events over time and are independent of volume of oil handled. (c) In the situation where the data indicated that there was a decrease in the frequency
of spill events over time and production, a sensitivity analysis was performed to identify where the increments became relatively stationary. The spill rate was then calculated from that point forward. For a more detailed discussion, see Appendix A.
8
2.4.2 Poisson Equation Used in Spill Rate Estimations Because spill occurrences meet the criteria for a Poisson process, the following equations were used in our estimation of spill rates. The estimated volume of oil handled is the exposure variable. Smith et al. (1982), using Bayesian inference techniques, presented a derivation of this process, assuming the probability of n spills over some future exposure t (the volume of oil handled) is expected to occur at random with a frequency specified by equation (1): P[n spills over future exposure t] = (λt)ne-λt (1) n! where λ is the true rate of spill occurrence per unit exposure. The predicted probability takes the form of a negative binomial distribution specified by equation (2):
P(n) = (n + v - 1)!tnτv (2) n!(v - 1)!(t + τ)n + v
where τ is past exposure and v is the number of spills observed in the past. The negative binomial is then shown to converge over time to the Poisson, with λ estimated using equation (3) (Smith et al., 1982): λ = v/τ (3) where λ is the spill occurrence rate, v is the number of spills (crude oil or refined) that occurred over the volume of crude oil (τ) handled (in our case, in units of Bbbl). Since spill occurrence probabilities are used in public policymaking, a sample calculation of spill occurrence probability is presented in Appendix B. 3.0 ANALYSIS OF SPILL OCCURRENCE DATA AND OIL HANDLED
Historic oil-spill occurrences ≥1,000 bbl and the volume in Bbbl (Bbbl = 109 bbl) of associated oil handled were analyzed for the following types of spills:
Petroleum spills from OCS platforms Petroleum spills from OCS pipelines Crude oil spills from tankers worldwide in coastal and offshore waters Crude oil spills from tankers in US coastal and offshore waters Alaska North Slope crude oil spills from U.S. tankers Crude oil and petroleum spills from barges in US coastal, inland, and offshore
waters. In this report, the term “handled” means produced from OCS platforms or OCS pipelines, or transported via tankers and barges.

9
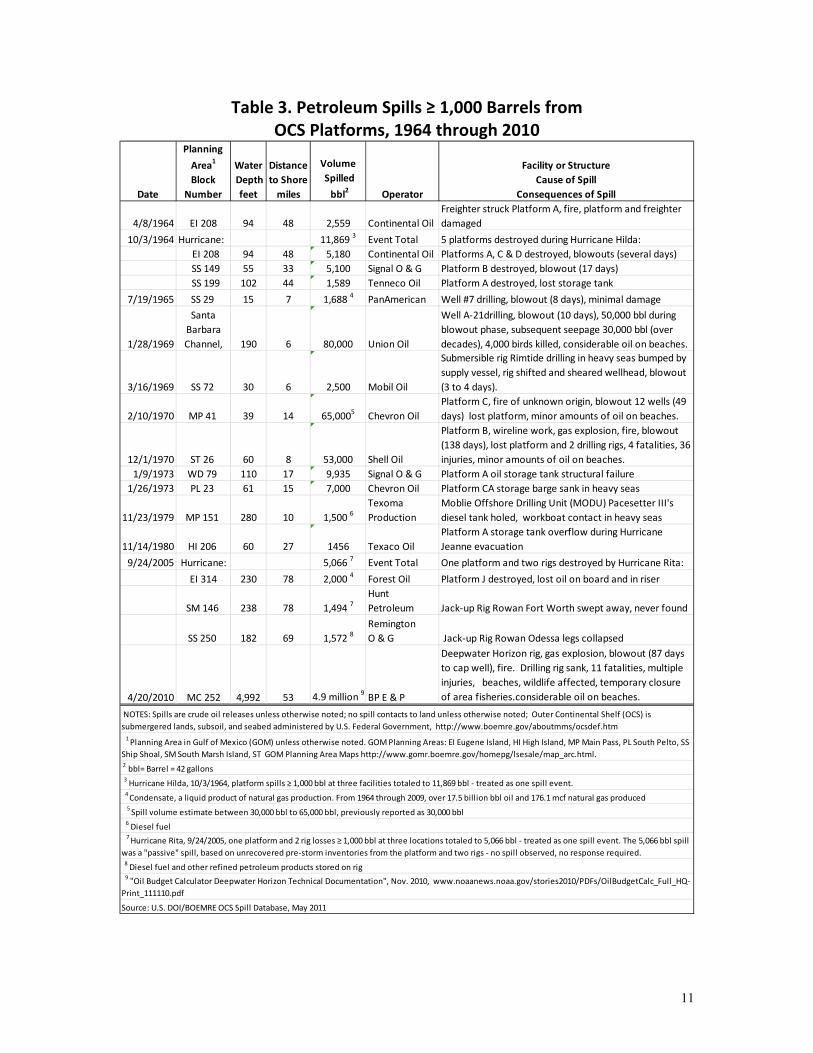
3.1 Petroleum Spills from OCS Platforms and Pipelines From1964 through 2009, 17.5 Bbbl of oil were produced and < 570,000 bbl spilled. The spill record improved over this time period. Barrels of oil spilled per Bbbl of crude oil produced declined from more than 255,000 bbl (1964 through 1970), to about 17,000 bbl (1971 through 1990), to approximately 6,400 (1991 through 2009) bbl spilled per Bbbl crude oil produced (Table 1). This improvement is also illustrated by the increase in the volume of production per bbl of oil spilled over the same time periods (Table 1). These improvements were largely due to the decreasing size of larger spills. From1964 through 2009, the maximum size of OCS spills≥ 1,000 bbl declined. Early in this time period (from1964 through 1970) there were 10 spills ≥ 1,000 bbl, the two largest of which were: a 160,000 bbl pipeline spill in the Gulf of Mexico in 1967 and an 80,000 bbl platform spill off Santa Barbara, CA in 1969. The largest spill that occurred from 1971 through 1990 was a pipeline spill of almost 20,000 bbl in 1974. From1991 through 2005, the largest spills were an 8,200 pipeline spill caused by Hurricane Georges in 1998 and a platform spill of almost 5,100 bbl in 2005 caused by Hurricane Rita. From 2006 through 2009, the largest spill was a 1,500 bbl pipeline spill in 2009 (Table 2). This pattern of the largest spills decreasing in size continued from 1964 through early 2010, a period of over 45 years. In 2010, the improvements seen in the spill record were broken by the Macondo well spill in the Gulf of Mexico, with an estimated volume of 4.9 million barrels.1 The Macondo well spill was a complete loss of well control. This was the first uncontrolled deepwater blowout to occur on the OCS and it continued for 87 days. From 1964 through 2010, there have been 33 spills ≥ 1,000 bbl from OCS platforms and pipelines. Thirteen of these spills were related to OCS platforms (Fig. 1; Table 3). Historically, most of the spills of this size have been crude oil or condensate but the two diesel spills ≥1,000 bbl associated with platforms are also included. Causes of the platform spills include: blowouts and other losses of well control; collisions; fuel transfer mishaps, damaged, lost or failed tanks including storage barges; and hurricane-related damage. This report evaluates the number of production intervals between spill events. From 1964 through 2010, there were three platform spills ≥1,000 bbl during Hurricane Hilda in 1964, and three platform spills ≥ 1,000 bbl during Hurricane Rita in 2005. Since there is no production between spills during a hurricane, the sum of the three platform spill volumes was treated as a single spill event (Table 3). Hurricane-related spills are detailed in Appendix C.
1 This analysis assumes the volume of oil released from this incident was 4.9 million bbl, the volume utilized in: “Oil Budget Calculator: Deepwater Horizon Technical Documentation”, November 2010, Report by The Federal Interagency Solutions Group, Oil Budget Calculator Science and Engineering Team http://www.noaanews.noaa.gov/stories2010/PDFs/OilBudgetCalc_Full_HQ-Print_111110.pdf This spill volume may be revised in the future based on additional studies.

10
Table 1. OCS Petroleum Spills ≥ 1 Barrel and OCS Production,
1964 through 2009
Total
1 ‐ 999
bbl
≥ 1,000
bbl Total
1 ‐ 999
bbl
≥ 1,000
bbl
1964-19701255,280 3,917 1.54 394,285 3,499 390,786 33 23 10
1971-1990116,682 59,945 6.79 113,307 21,415 91,892 1,921 1,909 12
1991-200916,427 155,601 9.20 59,142 28,144 30,998 853 843 10
Total2 32,329 30,932 17.53 566,734 53,058 513,676 2,807 2,775 32 1 Spill data for 1964-1970 is for spills ≥ 50 bbl. Spill data for spills ≥ 1 bbl begins in 1970 but is more robust starting in 1971.
2 Barrels of production or spillage may not add due to rounding of decimals not shown
Sources: U.S. DOI/BOEMRE OCS Spill Database, May 2011; U.S. DOI/ONRR OCS Production Data, May 2011
(http://www.boemre.gov/stats/OCSproduction.htm)
Year
Barrels
Produced
per Barrel
Spilled
Production
(Billion
barrels)
Barrels
Barrels Spilled by Spill Size Number of Spills by Spill SizeBarrels
Spilled per
Bbbl
Produced
Table 2. Number of OCS Petroleum Spills ≥ 1,000 Barrels, 1964 through 2010
1,000-1,999
2,000-4,999
5,000-9,999
10,000-19,999
20,000-49,999
50,000-149,999
150,000-199,000
200,000 or more
1964-1970 390,786 10 1 2 2 1 0 3 1 0
1971-1990 91,892 12 2 3 4 3 0 0 0 0
1991-2005 28,182 8 2 4 2 0 0 0 0 0
2006-2009 2,816 2 2 0 0 0 0 0 0 0
2010 4,900,000 1 0 0 0 0 0 0 0 1
Total 5,413,676 33 7 9 8 4 0 3 1 1
Number of Spills by Spill Size in Barrels1
Source: U.S. DOI/BOEMRE OCS Spill Database, May 2011
Year Barrels1
SpilledNumber
Spills
1 Barrel = 42 U.S. Gallons
Twenty of the 33 spills ≥1,000 bbl that occurred from 1964 through 2010 were related to leaking or damaged OCS pipelines (Fig. 1, Table 4). Causes of these pipeline spills include impact from external forces such as anchors, trawls, construction operations, or mudslides; loss of separation between pipelines; failures due to corrosion; and hurricane-related damage. Total OCS production from 1964 through 2010 was 18.1 Bbbl of crude oil and condensate. Historically, 95 percent or more of the total OCS production (on an annual basis) has been transported by pipeline. Of the remaining 5 percent or less, there have been no spills ≥ 1,000 bbl resulting from the transport of OCS petroleum by barge.
11
Table 3. Petroleum Spills ≥ 1,000 Barrels from OCS Platforms, 1964 through 2010
Date
Planning
Area1
Block
Number
Water
Depth
feet
Distance
to Shore
miles
Volume
Spilled
bbl2 Operator
Facility or Structure
Cause of Spill
Consequences of Spill
4/8/1964 EI 208 94 48 2,559 Continental Oil
Freighter struck Platform A, fire, platform and freighter
damaged
10/3/1964 Hurricane: 11,869 3 Event Total 5 platforms destroyed during Hurricane Hilda:
EI 208 94 48 5,180 Continental Oil Platforms A, C & D destroyed, blowouts (several days)
SS 149 55 33 5,100 Signal O & G Platform B destroyed, blowout (17 days)
SS 199 102 44 1,589 Tenneco Oil Platform A destroyed, lost storage tank
7/19/1965 SS 29 15 7 1,688 4 PanAmerican Well #7 drilling, blowout (8 days), minimal damage
1/28/1969
Santa
Barbara
Channel, 190 6 80,000 Union Oil
Well A‐21drilling, blowout (10 days), 50,000 bbl during
blowout phase, subsequent seepage 30,000 bbl (over
decades), 4,000 birds killed, considerable oil on beaches.
3/16/1969 SS 72 30 6 2,500 Mobil Oil
Submersible rig Rimtide drilling in heavy seas bumped by
supply vessel, rig shifted and sheared wellhead, blowout
(3 to 4 days).
2/10/1970 MP 41 39 14 65,0005 Chevron Oil
Platform C, fire of unknown origin, blowout 12 wells (49
days) lost platform, minor amounts of oil on beaches.
12/1/1970 ST 26 60 8 53,000 Shell Oil
Platform B, wireline work, gas explosion, fire, blowout
(138 days), lost platform and 2 drilling rigs, 4 fatalities, 36
injuries, minor amounts of oil on beaches.
1/9/1973 WD 79 110 17 9,935 Signal O & G Platform A oil storage tank structural failure
1/26/1973 PL 23 61 15 7,000 Chevron Oil Platform CA storage barge sank in heavy seas
11/23/1979 MP 151 280 10 1,500 6Texoma
Production
Moblie Offshore Drilling Unit (MODU) Pacesetter III's
diesel tank holed, workboat contact in heavy seas
11/14/1980 HI 206 60 27 1456 Texaco Oil
Platform A storage tank overflow during Hurricane
Jeanne evacuation
9/24/2005 Hurricane: 5,066 7 Event Total One platform and two rigs destroyed by Hurricane Rita:
EI 314 230 78 2,000 4 Forest Oil Platform J destroyed, lost oil on board and in riser
SM 146 238 78 1,494 7Hunt
Petroleum Jack‐up Rig Rowan Fort Worth swept away, never found
SS 250 182 69 1,572 8Remington
O & G Jack‐up Rig Rowan Odessa legs collapsed
4/20/2010 MC 252 4,992 53 4.9 million 9 BP E & P
Deepwater Horizon rig, gas explosion, blowout (87 days
to cap well), fire. Drilling rig sank, 11 fatalities, multiple
injuries, beaches, wildlife affected, temporary closure
of area fisheries.considerable oil on beaches.
Source: U.S. DOI/BOEMRE OCS Spill Database, May 2011
4 Condensate, a liquid product of natural gas production. From 1964 through 2009, over 17.5 billion bbl oil and 176.1 mcf natural gas produced
5 Spill volume estimate between 30,000 bbl to 65,000 bbl, previously reported as 30,000 bbl
6 Diesel fuel
7 Hurricane Rita, 9/24/2005, one platform and 2 rig losses ≥ 1,000 bbl at three locations totaled to 5,066 bbl ‐ treated as one spill event. The 5,066 bbl spill
was a "passive" spill, based on unrecovered pre‐storm inventories from the platform and two rigs ‐ no spill observed, no response required.
8 Diesel fuel and other refined petroleum products stored on rig
NOTES: Spills are crude oil releases unless otherwise noted; no spill contacts to land unless otherwise noted; Outer Continental Shelf (OCS) is
submergered lands, subsoil, and seabed administered by U.S. Federal Government, http://www.boemre.gov/aboutmms/ocsdef.htm
1 Planning Area in Gulf of Mexico (GOM) unless otherwise noted. GOM Planning Areas: EI Eugene Island, HI High Island, MP Main Pass, PL South Pelto, SS
Ship Shoal, SM South Marsh Island, ST GOM Planning Area Maps http://www.gomr.boemre.gov/homepg/lsesale/map_arc.html. 2 bbl= Barrel = 42 gallons
3 Hurricane Hilda, 10/3/1964, platform spills ≥ 1,000 bbl at three facilities totaled to 11,869 bbl ‐ treated as one spill event.
9 "Oil Budget Calculator Deepwater Horizon Technical Documentation", Nov. 2010, www.noaanews.noaa.gov/stories2010/PDFs/OilBudgetCalc_Full_HQ‐
Print_111110.pdf
12
0.0
0.1
0.2
0.3
0.4
0.5
0.6
0.7
0
1
2
3
4
5
6
7
64 66 68 70 72 74 76 78 80 82 84 86 88 90 92 94 96 98 00 02 04 06 08 10
OC
S P
rod
uct
ion
(B
bb
l)
Nu
mb
er o
f S
pill
s
Year
Platform Spills Pipeline Spills Production Bbbl
Bbbl= Billion (109) barrels.
Barrel = 42 U.S. gallons
Sources: Tables 3 and 4, and U.S. DOI/BOEMRE
OCS Spill Database, May 2011; U.S. DOI/ONRR
OCS Production Data, May 2011
(http://www.bsee.gov/BSEE‐
Newsroom/Offshore‐Stats‐and‐Facts/OCS‐Oil‐
and‐Gas‐Production.aspx)
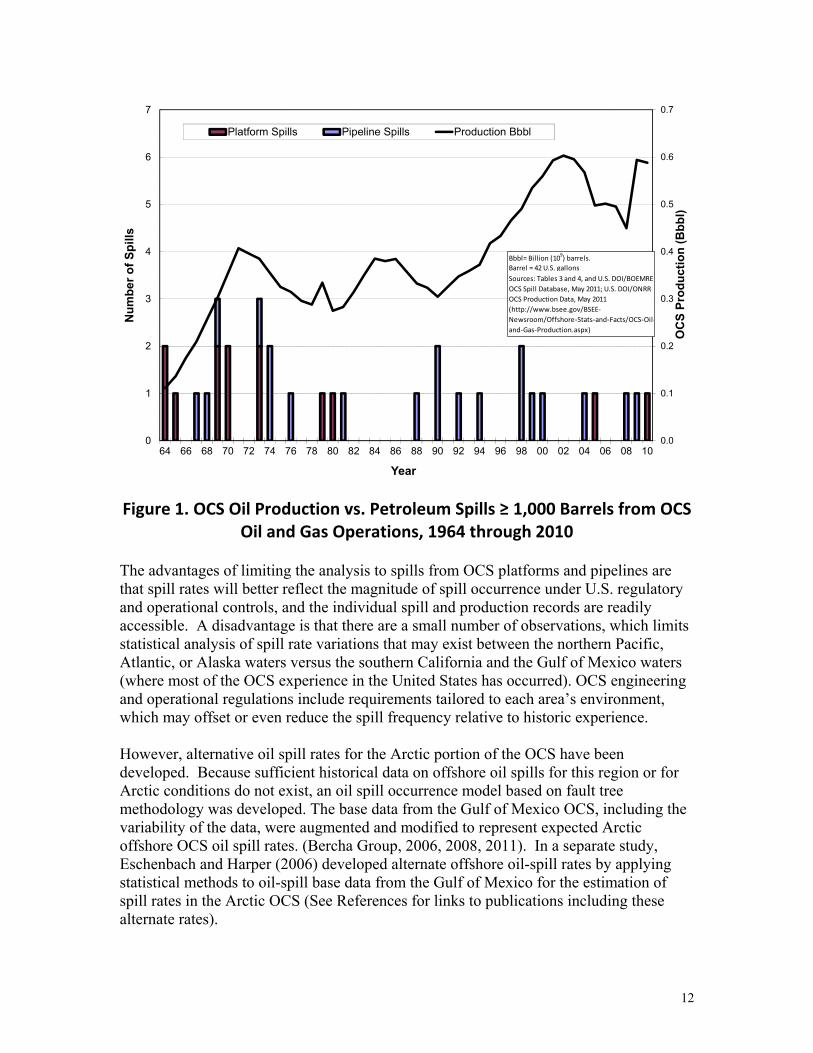
Figure 1. OCS Oil Production vs. Petroleum Spills ≥ 1,000 Barrels from OCS Oil and Gas Operations, 1964 through 2010
The advantages of limiting the analysis to spills from OCS platforms and pipelines are that spill rates will better reflect the magnitude of spill occurrence under U.S. regulatory and operational controls, and the individual spill and production records are readily accessible. A disadvantage is that there are a small number of observations, which limits statistical analysis of spill rate variations that may exist between the northern Pacific, Atlantic, or Alaska waters versus the southern California and the Gulf of Mexico waters (where most of the OCS experience in the United States has occurred). OCS engineering and operational regulations include requirements tailored to each area’s environment, which may offset or even reduce the spill frequency relative to historic experience. However, alternative oil spill rates for the Arctic portion of the OCS have been developed. Because sufficient historical data on offshore oil spills for this region or for Arctic conditions do not exist, an oil spill occurrence model based on fault tree methodology was developed. The base data from the Gulf of Mexico OCS, including the variability of the data, were augmented and modified to represent expected Arctic offshore OCS oil spill rates. (Bercha Group, 2006, 2008, 2011). In a separate study, Eschenbach and Harper (2006) developed alternate offshore oil-spill rates by applying statistical methods to oil-spill base data from the Gulf of Mexico for the estimation of spill rates in the Arctic OCS (See References for links to publications including these alternate rates).

13
Table 4. Petroleum Spills ≥ 1,000 Barrels from OCS Pipelines, 1964 through 2010
Date
Planning
Area1
Block Number
Water Depth (feet)
Distance to Shore (miles)
Volume Spilled( bbl2)
Operator
Pipeline Segment
(Pipeline Authority3)
Cause/Consequences of Spill
10/15/1967 WD 73 168 22 160,638Humble Pipe Line
12" oil pipeline Seg #7791 (DOT), anchor kinked, corrosion, leak
3/12/1968 ST 131 160 28 6,000 Gulf Oil 18" oil pipeline Seg #3573 (DOT), barge anchor damage
2/11/1969MP 299 210 17 7,532 Chevron Oil 4" gas pipeline Seg #3469 (DOT), anchor damage
5/12/1973 WD 73 168 22 5,000 Exxon Pipeline corrosion, leak
4/17/1974 EI 317 240 75 19,833 Pennzoil 14" oil Bonita pipeline Seg #1128 (DOI), anchor damage
9/11/1974 MP 73 141 9 3,500 Shell Oil
8" oil pipeline Seg #36 (DOI), Hurricane Carmen broke tie-in to 12" pipeline, minor contacts to shoreline, brief cleanup response in Chandeleur Area.
12/18/1976 EI 297 210 17 4,000 Placid Oil10" oil pipeline Seg #1184 (DOI), trawl damage to tie-in to 14" pipeline
12/11/1981 SP 60 190 4 5,100 Atlantic Richfield8" oil pipeline Seg #4715 (DOT), workboat anchor damage
2/7/1988GA A002 75 34 15,576 Amoco Pipeline
14" oil pipeline Seg #4879 (DOT), damage from illegally anchored vessel
1/24/1990SS 281 197 60 14,423
4Shell Offshore
4" condensate pipeline Seg #8324 (DOI), anchor damage to subsea tie-in
5/6/1990 EI 314 230 78 4,569 Exxon 8" oil pipeline Seg #4030 (DOI), trawl damage
8/31/1992 PL 8 30 6 2,000 Texaco
20" oil pipeline Seg #4006 (DOT), Hurricane Andrew, loose rig Treasure 75 anchor damage, minor contacts to shoreline, brief cleanup response.
11/16/1994SS 281 197 60 4,5334
Shell Offshore4" condensate pipeline Seg #8324 (DOI), trawl damage to subsea tie-in
1/26/1998EC 334 264 105 1,211
4Pennzoil E & P
16" gas & condensate pipeline Seg #11007 (DOT), anchor damage to tie-in to 30" pipeline, anchor dragged by vessel in man overboard response.
9/29/1998 SP 38 108 6 8,212Chevron Pipe Line
10" gas & oil pipelne Seg #5625 (DOT), Hurricane Georges, mudslide damage, small amount of oil contacted shoreline.
7/23/1999SS 241 133 50 3,200
Seashell Pipeline
12" oil pipeline Seg #6462 & Seg #6463 (DOT), "Loop Davis" jack-up rig barge crushed pipeline when sat down on it.
1/21/2000SS 332 435 75 2,240 Equilon Pipeline
24" oil pipeline Seg #10903 (DOT), anchor damage from MODU under tow
9/15/2004 MC 20 479 19 1,7205
Taylor Energy6" oil pipeline Seg #7296 (DOI), Hurricane Ivan, mudslide damage
9/13/2008HI A264 150 73 1,316
6HI Offshore System
42" gas pipeline Seg #7364 (DOT), Hurricane Ike, anchor damage parted pipeline
7/25/2009
SS 142 60 30 1,500 Shell Pipe Line
20" oil pipeline Seg #4006 (DOT), micro-fractures from chronic contacts at pipeline crossing caused failure (separators between pipelines missing).
1 Planning Area in Gulf of Mexico (GOM) unless otherwise noted. GOM Planning Areas: EC East Cameron, EI Eugene Island, GA Galveston, HI High Island, MC Mississippi Canyon, MP Main Pass, PL South Pelto, SS Ship Shoal, SP South Pass, ST South Timbalier, WD West Delta. GOM Planning Area Maps http://www.gomr.boemre.gov/homepg/lsesale/map_arc.html.
NOTES: Crude oil release unless otherwise noted; no spill contacts to land unless otherwise noted. Outer Continental Shelf (OCS) - submergered lands, subsoil, and seabed administered by U.S. Federal Government, http://www.boemre.gov/aboutmms/ocsdef.htm
Source: U.S. DOI/BOEMRE OCS Spill Database, May 2011
3 Pipeline Authority: (DOI) Department of Interior, BOEMRE; (DOT) Departmant of Transportation, PHMSA
6 The 1,316 bbl spill was a 'passive' spill, based on unrecovered pre-storm inventory in the segment parted by storm - no spill observed, no response required.
4 Condensate, a liquid product of natural gas production. Between 1964 - 2009, over 17.5 billion bbl oil and 176.1 mcf natural gas produced on OCS.
5 The 1,720 bbl spill was a 'passive' spill, based on unrecovered pre-storm inventory trapped in the segment by a mudslide - no spill observed, no response required.
2 bbl= Barrel= 42 U. S. Gallons

14
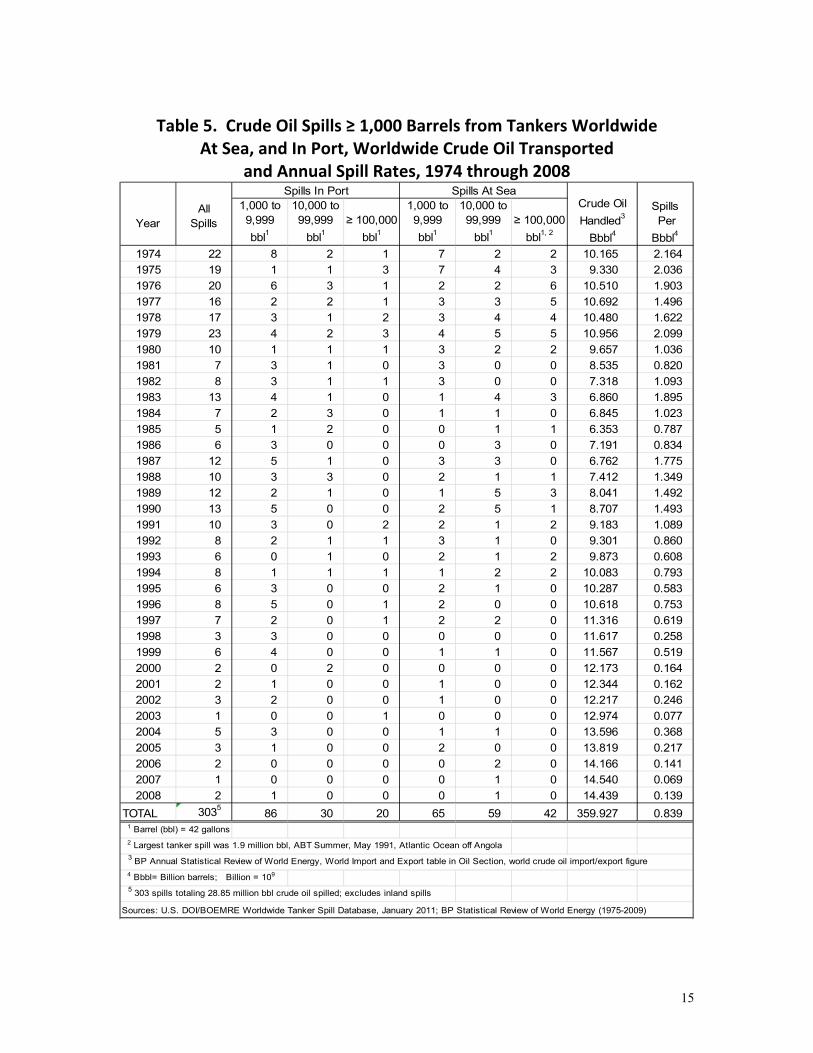
3.2. Crude Oil Spills from Tankers in Worldwide Coastal and Offshore Waters Tanker and barge spills can occur due to mishaps during loading, unloading, and taking on fuel oil, and from groundings, hull failures, and explosions. Spill data for tankers in worldwide coastal and offshore waters identify whether the spill occurred “At Sea” or “In Port”. From 1974 through 2008, there were 303 crude oil spills ≥1,000 bbl from self-propelled crude oil carriers (Fig. 2; Table 5). Prior to this time, international spill occurrences were recorded on an irregular basis; more stringent reporting requirements were introduced in 1973 (Intergovernmental Maritime Consultative Organization International Convention for the Prevention of Pollution from Ships, 1973; Federal Water Pollution Control Act, U.S. Public Law 92-500, October 18, 1972; amended by U.S. Public Law 93-207, December 28, 1973).
Inland spills (those in rivers, canals, etc.) and spills from barges were specifically excluded from the calculations under the assumption that international transportation of crude oil is performed by tanker to and from coastal ports. Worldwide transport of crude oil from 1974 through 2008 was estimated to total 359.9 Bbbl, based on world crude oil imports and exports (British Petroleum Company, 2009).
0
2
4
6
8
10
12
14
16
0
2
4
6
8
10
12
14
16
18
20
22
24
26
28
30
32
74 76 78 80 82 84 86 88 90 92 94 96 98 00 02 04 06 08
Cru
de
Oil
Mo
vem
ents
(B
bb
l)
Nu
mb
er o
f S
pill
s
Year
In-Port Spills At-Sea Spills Crude Oil Movements
Bbbl= Billion (109) barrels.
Barrel = 42 U.S. gallons
Source: Table 5
Figure 2. Crude Oil Spills ≥ 1,000 Barrels from Tankers Worldwide
vs. Crude Oil Transported Worldwide, 1974 through 2008
15
Table 5. Crude Oil Spills ≥ 1,000 Barrels from Tankers Worldwide
At Sea, and In Port, Worldwide Crude Oil Transported and Annual Spill Rates, 1974 through 2008
1,000 to 9,999
bbl1
10,000 to99,999
bbl1≥ 100,000
bbl1
1,000 to 9,999
bbl1
10,000 to99,999
bbl1≥ 100,000
bbl1, 2
1974 22 8 2 1 7 2 2 10.165 2.164
1975 19 1 1 3 7 4 3 9.330 2.036
1976 20 6 3 1 2 2 6 10.510 1.903
1977 16 2 2 1 3 3 5 10.692 1.496
1978 17 3 1 2 3 4 4 10.480 1.622
1979 23 4 2 3 4 5 5 10.956 2.099
1980 10 1 1 1 3 2 2 9.657 1.036
1981 7 3 1 0 3 0 0 8.535 0.820
1982 8 3 1 1 3 0 0 7.318 1.093
1983 13 4 1 0 1 4 3 6.860 1.895
1984 7 2 3 0 1 1 0 6.845 1.023
1985 5 1 2 0 0 1 1 6.353 0.787
1986 6 3 0 0 0 3 0 7.191 0.834
1987 12 5 1 0 3 3 0 6.762 1.775
1988 10 3 3 0 2 1 1 7.412 1.349
1989 12 2 1 0 1 5 3 8.041 1.492
1990 13 5 0 0 2 5 1 8.707 1.493
1991 10 3 0 2 2 1 2 9.183 1.089
1992 8 2 1 1 3 1 0 9.301 0.860
1993 6 0 1 0 2 1 2 9.873 0.608
1994 8 1 1 1 1 2 2 10.083 0.793
1995 6 3 0 0 2 1 0 10.287 0.583
1996 8 5 0 1 2 0 0 10.618 0.753
1997 7 2 0 1 2 2 0 11.316 0.619
1998 3 3 0 0 0 0 0 11.617 0.258
1999 6 4 0 0 1 1 0 11.567 0.519
2000 2 0 2 0 0 0 0 12.173 0.164
2001 2 1 0 0 1 0 0 12.344 0.162
2002 3 2 0 0 1 0 0 12.217 0.246
2003 1 0 0 1 0 0 0 12.974 0.077
2004 5 3 0 0 1 1 0 13.596 0.368
2005 3 1 0 0 2 0 0 13.819 0.217
2006 2 0 0 0 0 2 0 14.166 0.141
2007 1 0 0 0 0 1 0 14.540 0.069
2008 2 1 0 0 0 1 0 14.439 0.139
TOTAL 303586 30 20 65 59 42 359.927 0.839
1 Barrel (bbl) = 42 gallons
2 Largest tanker spill was 1.9 million bbl, ABT Summer, May 1991, Atlantic Ocean off Angola 3 BP Annual Statistical Review of World Energy, World Import and Export table in Oil Section, world crude oil import/export figure
4 Bbbl= Billion barrels; Billion = 109
5 303 spills totaling 28.85 million bbl crude oil spilled; excludes inland spills
Sources: U.S. DOI/BOEMRE Worldwide Tanker Spill Database, January 2011; BP Statistical Review of World Energy (1975-2009)
Spills In Port Spills At SeaCrude Oil
Handled3
Bbbl4
Spills Per
Bbbl4
All Spills Year

16
There have been changes in the BSEE tanker database since Anderson and LaBelle, 2000, because new information became available. i.e., the spill count for 1987 has been reduced from 15 to 13: one spill was dropped because it resulted from an act of war; the second spill was dropped because it was due to an intentional discharge (neither of these two spills was accidental); and the third spill was dropped because it was a duplicate spill. 3.3 Crude Oil Spills from Tankers in U.S. Coastal and Offshore Waters Fifty-three crude oil tanker spills ≥1,000 bbl occurred in U.S. coastal and offshore waters (including U.S. territorial waters) from 1974 through 2008 (Table 6; Fig. 3). These spills are a subset of the spills included in the worldwide tanker spill, and as such, are identified as occurring either “At Sea” or “In Port.” Estimations of crude oil transport by tankers in U.S. waters were based on foreign transport (imports + exports = 84.2 Bbbl) and domestic transport (coastal + interterritorial = 20.3 Bbbl) of crude oil for the years 1974 through 2008 (U.S. Army Corps of Engineers [COE], 2009). Comprehensive data on locations of all individual vessel routes, the volumes moved over each route, and the oil spills associated with each specific route are unavailable. Therefore, a simple assumption regarding spills associated with foreign transport (U.S. crude oil imports and exports) was made that half of the spills related to foreign movements occurred in U.S. waters, and the other half occurred in international or foreign waters at the other end of the trip. In the spill rate calculation, the volume of foreign transport was adjusted by 50 percent to account for these assumptions, which resulted in an estimated 62.4 Bbbl of transport associated with tanker spills in U.S. waters (50% foreign + 100% domestic transport). 3.4 Crude Oil Spills from Alaska North Slope (ANS) Tankers The Trans-Alaska Pipeline System (TAPS) is the main transportation artery carrying crude oil and some natural gas liquids from Alaska's Arctic to Valdez, an ice-free port on the southern coast of Alaska. The TAPS startup was in August 1977. Spill data for tankers carrying ANS crude oil from Valdez identify whether the spill occurred “At Sea” or “In Port.” From 1977 through 2008, approximately15.3 Bbbl of ANS crude oil were loaded onto tankers at Valdez, Alaska (U.S. Department of Commerce (DOC), 2009). Loadings peaked at 0.73 Bbbl in 1988 and have steadily declined since to 0.50 Bbbl in 1996 and 0.23 Bbbl in 2008. The bulk of these loadings (87-97%) have had destinations to either the U.S. west coast (Puget Sound, WA; San Francisco, CA; or Los Angeles, CA) or Panama. Panama destinations peaked at 43 percent of loadings in 1982, and have since tapered to zero in 1996. The destinations of the balance of the loadings were generally the Virgin Islands, Hawaii or Alaska.
17
Table 6. Crude Oil Spills ≥ 1,000 Barrels form Tankers in U.S. Waters At Sea and In Port, Crude Oil Transported via Tanker in U.S. Waters, and Annual
Tanker Spill Rates, 1974 through 2008
1,000 to 9,999
bbl1
10,000 to99,999
bbl1≥ 100,000
bbl1
1,000 to 9,999
bbl1
10,000 to99,999
bbl1
≥ 100,000
bbl1, 2
1974 5 3 1 0 1 0 0 1.437 0.221 0.940 5.322
1975 6 1 0 1 2 1 1 1.702 0.173 1.024 5.859
1976 3 3 0 0 0 0 0 2.245 0.149 1.272 2.359
1977 3 1 1 0 0 0 1 2.686 0.204 1.547 1.939
1978 1 0 0 0 1 0 0 2.576 0.594 1.882 0.531
1979 5 3 1 0 0 0 1 2.521 0.639 1.900 2.632
1980 2 0 1 0 1 0 0 2.035 0.842 1.860 1.076
1981 2 1 1 0 0 0 0 1.737 0.875 1.744 1.147
1982 1 0 1 0 0 0 0 1.501 0.937 1.688 0.593
1983 1 1 0 0 0 0 0 1.208 0.990 1.594 0.627
1984 1 0 0 0 0 1 0 1.142 0.922 1.493 0.670
1985 2 1 1 0 0 0 0 1.084 1.002 1.544 1.295
1986 3 3 0 0 0 0 0 1.441 0.994 1.715 1.750
1987 3 0 0 0 1 2 0 1.582 1.061 1.852 1.620
1988 2 1 1 0 0 0 0 1.680 1.004 1.844 1.085
1989 2 1 0 0 0 0 1 1.988 0.879 1.873 1.068
1990 3 1 0 0 0 2 0 2.058 0.816 1.845 1.626
1991 2 2 0 0 0 0 0 1.949 0.817 1.792 1.116
1992 1 1 0 0 0 0 0 2.145 0.760 1.833 0.546
1993 0 0 0 0 0 0 0 2.382 0.663 1.854 -.-7
1994 0 0 0 0 0 0 0 2.576 0.649 1.937 -.-7
1995 1 1 0 0 0 0 0 2.470 0.595 1.830 0.546
1996 1 1 0 0 0 0 0 2.684 0.558 1.900 0.526
1997 1 1 0 0 0 0 0 2.879 0.513 1.953 0.512
1998 0 0 0 0 0 0 0 2.903 0.424 1.876 -.-7
1999 0 0 0 0 0 0 0 2.963 0.344 1.826 -.-7
2000 1 0 1 0 0 0 0 3.489 0.317 2.062 0.485
2001 0 0 0 0 0 0 0 3.242 0.348 1.969 -.-7
2002 0 0 0 0 0 0 0 3.195 0.341 1.939 -.-7
2003 0 0 0 0 0 0 0 3.438 0.339 2.058 -.-7
2004 1 1 0 0 0 0 0 3.536 0.319 2.087 0.479
2005 0 0 0 0 0 0 0 3.480 0.298 2.038 -.-7
2006 0 0 0 0 0 0 0 3.489 0.245 1.990 -.-7
2007 0 0 0 0 0 0 0 3.472 0.254 1.990 -.-7
2008 0 0 0 0 0 0 0 3.278 0.242 1.881 -.-7
TOTAL 53627 9 1 6 6 4 84.193 20.328 62.425 0.849
6 53 spills totaling 1.97 million bbl crude oil spilled; includes spills in U.S. territorial waters; excludes inland spills
7 Dash (-.-) indicates zero spills observed; rate not calculated
Sources: U.S. DOI/BOEMRE Worldwide Tanker Spill Database, January 2011;
U.S. Army Corps of Engineers, Waterborne Commerce of the United States, Part 5, National Summaries, 1975 - 2009,
Table 2-1 Summary of Foreign and Domestic Waterborne Commerce by Type of Traffic and Commodity.
1 bbl= Barrel = 42 gallons
2 Largest tanker spills: 427,500 bbl, Epic Colocotronis, 1975; 266,000 bbl, Corinthos, 1975; 262,000 bbl, Exxon Valdez, 1989.
3 Bbbl= Billion barrels; Billion = 109
4 Coastal and intraterritorial domestic transport of crude oil (excludes inland transport)
5 Assumes half of exposure from U.S. imports/exports occurs outside U.S. waters = 100% Domestic Transports + 50% Imports & Exports
Spills In Port Spills At Sea Imports &
Exports
Bbbl3
Domestic
Transport4
Bbbl3
Adjusted
Transport5
Bbbl3
All Spills
Spills Per Bbbl
Year

18
0.0
0.5
1.0
1.5
2.0
2.5
3.0
3.5
4.0
0
1
2
3
4
5
6
7
8
74 76 78 80 82 84 86 88 90 92 94 96 98 00 02 04 06 08
Cru
de
Oil
Mo
vem
ents
(B
bb
l)
Nu
mb
er o
f S
pil
ls
Year
At Sea Spills In-Port Spills
Import/Export Domestic Movements
Adjusted Movements
Bbbl= Billion (109) barrels.
Barrel = 42 U.S. gallons
Source: Table 6
Figure 3. Crude Oil Spills ≥ 1,000 Barrels from Tankers in U.S. Waters
vs. Crude Oil Transported in U.S. Waters, 1974 through 2008
The earliest three spills of ANS crude oil transported via tanker occurred in 1978, 1980, and 1981 outside of U.S. waters. All subsequent spills occurred in U.S. waters. Eleven tanker spills ≥1,000 bbl associated with the transportation of ANS crude oil occurred in U.S. waters from1977 through 2008 (Fig. 4). These 11 spills were:
The Exxon Valdez spill (1989 – 262,000 bbl) which was the largest Three Stuyvesant spills:
o 1981 - 3,600 bbl o 1987 - 15,000 bbl o 1987 - 14,300 bbl
Seven other spills, less than 9,500 bbl each. o Exxon San Francisco (1991) was the last of the ANS spills
3.5 Petroleum and Crude Oil Spills from Barges in U.S. Coastal, Offshore, and Inland Waters From 1974 through 2008, 197 petroleum spills ≥1,000 bbl (28 of which were crude oil spills) occurred from barges in U.S. coastal, offshore, and inland waters (including U.S.

19
territorial waters) (Table 7, Fig. 5). Because the data available on barge transport in U.S. waters do not differentiate between inland and coastal/offshore transport, inland transport was included. Petroleum included crude oil and petroleum products such as gasoline, jet fuel, kerosene, distillate fuel oil, residual fuel oil, lubricating oils and greases, naphtha, petroleum solvents, asphalt, tar and pitches, and liquefied gases. Petroleum transported from 1974 through 2008 were estimated to be 58.5 Bbbl (9.1 Bbbl of which were crude oil), based on the portion of U.S. domestic petroleum transported by barge (COE, 2009).
0.00
0.25
0.50
0.75
1.00
0
1
2
3
4
77 79 81 83 85 87 89 91 93 95 97 99 01 03 05 07
Cru
de
Oil
Mo
vem
ents
(B
bb
l)
Nu
mb
er o
f S
pil
ls
Year
At-Sea Spills In-Port Spills
Crude Oil Loadings U.S. West Coast Destination
Panama Destination
Bbbl= billion (109) barrels
Barrel = 42 U.S. gallons
Sources: DOI/BOEMRE Tanker Spill Database, January 2011; U.S. Department of Commerce, Maritime Administration, Annual Loadings.
Figure 4. Alaska North Slope Crude Oil Tanker Spills
≥ 1,000 Barrels vs. Total Crude Oil Loadings at Valdez, Alaska, and Crude Oil Shipment Destinations, 1974 through 2008
4.0 SPILL RATE TREND ANALYSES Trend analysis was performed for the entire record (1964 through 2010) for spills ≥1,000 bbl from OCS platforms and pipelines. This was performed to determine if the observed decline in spill occurrence in the spill record represented a trend. In a situation where the data indicated that there was a trend, a sensitivity analysis was conducted to determine at what point the increments became relatively stationary. The spill rates were then calculated from that point forward. Appendix A provides the reader with further details of the trend analysis methodology.

20
Table 7. Petroleum Spills ≥1,000 Barrels from Barges in U.S. Waters including Inland Waters, Petroleum Transported via Barges, and Annual
Barge Spill Rates, 1974 through 2008
1,000 to
9,999
bbl 2
10,000 to
24,999 bbl
≥ 25,000
bbl 2
Petroleum
Transported1
Bbbl 3
Spills Per
Bbbl 3
All Spills
1,000 to
9,999
bbl 2
10,000 to
24,999
bbl 2
≥ 25,000
bbl 2
Crude Oil Transported
1 Bbbl 3
Spills Per
Bbbl 3
1974 14 10 2 2 1.616 8.663 6 4 2 0 0.321 18.692
1975 12 8 4 0 1.607 7.467 4 3 1 0 0.331 12.085
1976 9 9 0 0 1.746 5.155 3 3 0 0 0.339 8.850
1977 13 12 1 0 1.785 7.283 0 0 0 0 0.3274-.-
1978 15 12 3 0 1.850 8.108 2 2 0 0 0.359 5.571
1979 10 10 0 0 1.707 5.858 1 1 0 0 0.319 3.135
1980 10 10 0 0 1.716 5.828 2 2 0 0 0.270 7.407
1981 6 4 0 2 1.675 3.582 0 0 0 0 0.2194-.-
1982 5 4 0 1 1.569 3.187 0 0 0 0 0.2274-.-
1983 6 2 3 1 1.537 3.904 1 0 1 0 0.251 3.984
1984 8 5 2 1 1.640 4.878 1 0 1 0 0.275 3.636
1985 12 9 2 1 1.580 7.595 2 2 0 0 0.300 6.667
1986 6 5 1 0 1.642 3.654 1 1 0 0 0.296 3.378
1987 5 5 0 0 1.666 3.001 0 0 0 0 0.2704-.-
1988 9 8 0 1 1.738 5.178 1 1 0 0 0.305 3.279
1989 7 7 0 0 1.715 4.082 0 0 0 0 0.2834-.-
1990 12 10 2 0 1.744 6.881 2 2 0 0 0.311 6.431
1991 3 3 0 0 1.649 1.819 0 0 0 0 0.2824-.-
1992 3 3 0 0 1.601 1.874 0 0 0 0 0.279 4-.-
1993 2 2 0 0 1.638 1.221 0 0 0 0 0.2844-.-
1994 1 0 1 0 1.637 0.611 0 0 0 0 0.2694-.-
1995 5 4 1 0 1.600 3.125 0 0 0 0 0.2574-.-
1996 4 3 1 0 1.613 2.480 0 0 0 0 0.2624-.-
1997 3 3 0 0 1.734 1.730 0 0 0 0 0.2624-.-
1998 1 1 0 0 1.702 0.588 1 1 0 0 0.215 4.651
1999 3 3 0 0 1.649 1.819 0 0 0 0 0.2024-.-
2000 2 2 0 0 1.670 1.198 0 0 0 0 0.1954-.-
2001 2 2 0 0 1.684 1.188 0 0 0 0 0.1834-.-
2002 1 1 0 0 1.600 0.625 0 0 0 0 0.1914-.-
2003 1 1 0 0 1.634 0.612 0 0 0 0 0.2094-.-
2004 2 2 0 0 1.688 1.185 0 0 0 0 0.2104-.-
2005 2 1 0 1 1.709 1.170 1 1 0 0 0.205 4.878
2006 2 2 0 0 1.753 1.141 0 0 0 0 0.1914-.-
2007 0 0 0 0 1.7954-.- 0 0 0 0 0.187
4-.-
2008 1 1 0 0 1.636 0.611 0 0 0 0 0.1694-.-
Total 1975164 23 10 58.525 3.366 286
23 5 0 9.055 3.092
Table 2-3 Domestic Barge Traffic by type of Traffic and Commodity.
Year All
Spills
All Petroleum Spills (including Crude Oil) Crude Oil Spills Only
1 Petroleum includes crude oil, gasoline, jet fuel, kerosene, distillate fuel oil, residual fuel oil, lubricating oils and greases, asphalt, and liquified gases.
5 197 spills totaling 1.21 million bbl crude oil spilled; includes 28 crude oil spills totalling 0.18 million bbl.
Note: Largest barge spill was 48,600 bbl, UMTB 183, December 1988, south of Semedi Islands, AK
Sources: U.S. DOI/BOEMRE Worldwide Tanker Spill Database, January 2011;
U.S. Army Corps of Engineers, Waterborne Commerce of the United States, Part 5, National Summaries, 1975 - 2009,
2 Barrel (bbl) = 42 gallons
3 Billion = 109, Billion barrels = Bbbl
4 Dash (-.-) indicates zero spills observed, rate not calculated.
6 28 crude oil spills totalling 0.18 million bbl

21
0.0
0.4
0.8
1.2
1.6
2.0
2.4
2.8
3.2
3.6
4.0
0
2
4
6
8
10
12
14
16
18
20
74 76 78 80 82 84 86 88 90 92 94 96 98 00 02 04 06 08
Pet
role
um
Mo
vem
ents
(B
bb
l)
Nu
mb
er o
f S
pil
ls
Year
Product Spills Crude Oil Spills
Product Movements Crude Oil Movements
Total Movements
Bbbl= Billion (109) barrels
Barrel= 42 U.S. gallons
Source: Table 7
Figure 5. Crude Oil and Petroleum Spills ≥ 1,000 Barrels from Barges in
U.S. Waters vs. Petroleum Transported in U.S. Waters, 1974 through 2008 For OCS platforms, a decline in the spill rate, based on oil produced, was identified early in the record through trend analysis (Nakassis, 1982; Anderson and LaBelle, 1990) and this trend was also evident in the two subsequent analyses (Anderson and LaBelle, 1994 and 2000). Trend analysis, conducted for this report, identified the continuation of this trend. The rates for spills ≥1,000 bbl were calculated by excluding the earliest portion of the historic record (where the earlier spill rate differed from the current trend; Appendix A, Table A-1). For OCS pipelines, a decrease in the spill rate, based on volume produced, was also identified in Anderson and LaBelle 1990), but this trend was not evident in the previous two analyses (Anderson and LaBelle, 1994 and 2000). In this report, although the nonparametric tests did not clearly show evidence of a trend, a decrease was identified in the frequency of pipeline spills over the second half of the total volume produced. Pipeline spill rates were calculated by excluding the first half of the historic production volume record (where the spill rate differed from the current trend.) (See Appendix A, Table A-2.)
22
4.1 Tests to Determine if OCS Spill Observations are Random and Independent To determine whether the spill observations were random and independent, nonparametric tests that had been applied in previous analyses (Nakassis, 1982; Anderson and LaBelle, 1990) were again used in this study. These are detailed in Appendix A. A variable that was independent of the spill rate distribution was constructed – the amount of crude and condensate production observed between spills. A hypothesis that this new variable was random and independent was tested using Hotelling and Pabst’s Test (Bradley, 1968, Table I); Kendall’s Test for Correlation (Bradley, 1968, Table XI), and Runs Up, Runs Down Test (Bradley, 1968, Table X). If the variable (production observed between spills) is independent and random, then the observed decline in the spill rate represents a trend. The first two tests indicate the volume of oil produced between OCS platform spills still appears to be nonrandom and to increase over time. This trend was identified in previous analyses (Nakassis, 1982; Anderson and LaBelle, 1994, and 2000) and indicates that the spill rates, based on oil produced, have declined over time. Only the Hotelling and Pabst’s test hinted that volume of oil produced between OCS pipeline spills is nonrandom. 4.2 Production Interval Analysis Spill rate trends were identified using an analysis of the number of spills per production interval. OCS platform and pipeline spills were examined over uniform intervals of production, 1.0 Bbbl intervals for platforms (Fig. 6) and 0.5 Bbbl intervals for pipelines (Fig.7). Interval lengths were selected to maximize single spill occurrences per interval for the most recent spills; intervals with no spills are considered to be non-spill observations. (Note: an extra 0.1 Bbbl of production falls in the last interval, which is production interval 18 for platforms and interval 36 for pipelines) OCS Platform Data—The previously identified trend in OCS platform spills (Nakassis, 1982; Anderson and LaBelle, 1990, 1994, 2000) continued with 9 of the 13 spills occurring in production intervals 1 through 3, and 12 of the last 15 production intervals being non-spill observations (Fig. 6). This increase in the number of non-spill production intervals indicates an improvement trend in the spill rates from OCS platforms. The sensitivity analysis indicated that the same starting point for the trend utilized in the previous studies (Nakassis, 1982, Anderson and LaBelle, 1990, 1994, and 2000) was also appropriate for this report. Starting the trend at this point captures 87% of the most recent production record, yet it includes 38.5% (5 of 13) of the OCS platform spills. OCS Pipeline Data—Although the non-parametric testing of the pipeline data does not clearly identify the existence of a trend, an OCS pipeline spill trend can be identified in the second half of the record, with 11 of the 20 spills (and 9 non-spill intervals) occurring before the middle (18th) production interval and 9 spills (and 11 non-spill intervals) occurring between the 18th and 36th intervals (Fig. 7). The two spills in the last two half-Bbl production intervals (interval numbers 34 and 35) negate most findings of a trend in

23
0
1
2
3
4
5
6
1 2 3 4 5 6 7 8 9 10 11 12 13 14 15 16 17 18*
Num
ber
of S
pills
One Bbbl Production Intervals
1,000 - 9,999 bbl 10,000 - 49,999 bbl ≥ 50,000 bbl
Previously identified trend (Anderson & LaBelle, 1990)
Continued trend (Anderson & LaBelle, 1994)
Continued trend (Anderson & LaBelle, 2000)
Continued trend of lower spill rate as compared to entire recordContinued trend of lower spill rate as compared to entire record
Continued trend (Anderson & LaBelle, 2000)
Bbbl = billion (109) barrels.
Barrel = 42 U.S. gallons
*An extra 0.1 Bbbl of
production falls in the last
production interval (#18).
Figure 6. Petroleum Spills ≥ 1,000 Barrels from OCS Activities from Platforms, by Size Category within One Billion Barrel Production Intervals, 1964 through 2010

24
Bbbl= billion (109) barrels. Barrel= 42 U.S. gallons.
* An extra 0.1 Bbbl of production falls in the last production interval (#36).
Figure 7. Crude Oil Spills ≥ 1,000 Barrels from OCS Pipelines by Size Category within 0.5 Billion Barrel Production Intervals, 1964 through 2010
25
the nonparametric testing, but clearly there is a lower frequency of spills and an increase in the number of non-spill production intervals between spills in the second half of the record, which does indicate a positive trend. Although the sensitivity analysis did not clearly identify a point in the record where the cumulative percent of production becomes significantly greater than the cumulative percentage of the number of spills, the production interval analysis does identify the middle of the record as an appropriate starting point for the trend. 4.3 Fifteen –Year and Twenty‐Year Analysis Anderson and LaBelle (2000) calculated spill rates for the entire record and the last 15 years in order to compare the data sets. If spill occurrence rates have increased or decreased over time, eliminating the oldest records should make the rates more representative of current spill occurrence behavior. To identify and evaluate more recent trends, spill rates were calculated for the last 10, 15 and 20 years to compare the data sets. The 15-year record was selected by Anderson and LaBelle (2000) because it represented how the spill rates have changed while still maintaining a significant portion of the production and spill record. In this report, to compare spill rates among the data sets, the 15-year period was again selected. Thus, spill occurrence rates for OCS platform and pipeline spills, worldwide tanker spills, and barge spills in U.S. waters were calculated using the most recent 15 years of data. The 15-year records utilized were 1996 through 2010 for OCS platform and pipeline spills; and 1994-2008 for worldwide tanker spills and spills from barges in U.S. waters. However, in the case of tanker crude oil spills in U.S. waters and ANS crude oil spills, the 15-year interval was extended to 20 years (1989 through 2008) in order to capture at least one spill in the rate computations of “At Sea” and "In Port" spills of ≥ 1,000 bbl.
4.4 Date Ranges for which Spill Rates were Calculated Spill rates were calculated for the entire data record and the most recent 15 (or 20) years of available from each spill source as shown in Table 8 which lists the datasets used for each spill source category to calculate spill rates.
5.0 RESULTS: ESTIMATED SPILL RATES Spill rates expressed in terms of spills per Bbbl of oil handled, were calculated for each spill source examined for spills ≥1,000 bbl and for spills ≥10,000 bbl. Spill rates for spills ≥100,000 bbl were also calculated for crude oil spills from tankers in worldwide coastal and offshore waters, where the average spill size for spills at sea was over 100,000 bbl (118,100 bbl). Tanker and barge rates were calculated using the entire record of observed spills and oil transported.

26
Table 8. Date Ranges of Spill Occurrence Records Utilized in this Report
Spill Source/Location Date Range of Record
Used
Data Availability for Spill Occurrence Rate Calculations
Worldwide Tanker Spills 1974-2008* 1974 earliest reliable data 2008 most recent data available
Worldwide Tanker Spills 1994-2008* Last 15 years of data available U.S. Coastal and Offshore Waters Tanker Spills
1974-2008* 1974 earliest reliable data 2008 most recent data available
U.S. Coastal and Offshore Waters Tanker
1989-2008* Last 20 years of data used instead of 15 years in order to capture at least one spill in the rate computations of “At Sea” and “In Port” spills of ≥ 1,000 bbl.
Alaska North Slope Tanker Spills
1977-2008* ANS tanker fleet began transport from Valdez in August 1977 2008 most recent data available
Alaska North Slope Tanker Spills
1989-2008* Last 20 years of data used instead of 15 years in order to capture at least one spill in the rate computations of “At Sea” and “In Port” spills of ≥ 1,000 bbl.
U.S. Offshore, Coastal and Inland Waters Barge Spills
1974-2008* 1974 earliest reliable data 2008 most recent data available
U.S. Offshore, Coastal and Inland Waters Barge Spills
1994-2008* Last 15 years of data available
OCS Pipeline and Platform Spills
1964-2010, adjusted for a trend
1964 earliest recorded spill ≥ 1,000 bbl; 2010 data are the most recent OCS pipeline and platform data available during the initial drafting of the report
OCS Pipeline and Platform Spills
1996-2010 Last 15 years of data available during the initial drafting of the report
*Data on barge and tanker spills analyzed in this report are current through 2008 because that was the latest data available during the initial drafting of the report.
5.1 Petroleum Spill Rates from OCS Platforms This section discusses estimates of OCS platform spill rates for both the entire record, adjusted for a trend, and the last 15-years. There have been two additional OCS platform spills (Table 3, Fig. 1) since the spill rates were last calculated (Anderson and LaBelle, 2000).
27
5.1.1 OCS Platforms: Entire Record (1964 through 2010) Based on the last five spills that occurred over the most recent 15.6 Bbbl of production (i.e., based on production intervals 3 through 18, Fig 6), the updated spill rate was 0.32 spills per Bbbl handled for OCS platform spills ≥ to 1,000 bbl (Table 9). This 0.32 updated spill rate is identical to the previous rate (Anderson and LaBelle, 2000) which was calculated on the last 3 spills over the most recent 9.5 Bbbl of production at the time (through 1999). This calculation was based on the same trend from the same starting point of the data (as did previous OCS spill rates calculations (Anderson and LaBelle, 1990, 1994, 2000). The updated OCS platform spill rate estimate of 0.06 spills per Bbbl handled for spills ≥10,000 bbl (Table 9) was calculated based on the last spill ≥10,000 bbl that occurred over the most recent 15.6 Bbbl of production (i.e., based on production intervals 3-18, Fig. 6). This is a decline compared to the previous 0.12 spill rate (Anderson and LaBelle, 2000) which was based on a conservative approach for estimating a rate for OCS platform spills ≥10,000 bbl over an interval where no spills that large occurred. 5.1.2 OCS Platforms: Last 15 Years (1996 through 2010) Spill rates for OCS platform spills of ≥ 1,000 bbl increased from 0.13 from1985 through 1999 (Anderson and LaBelle, 2000) to 0.25 from1996 through 2010. This increase is due to two new spills (Hurricane Rita and Macondo) that occurred in the most recent 15 year period (1996 through 2010), prior to which the next most recent OCS platform spill (≥ 1,000 bbl) occurred in 1980. Spill rates for OCS platform spills ≥ 10,000 bbl increased from 0.05 from1985 through 1999 (Anderson and LaBelle, 2000) to 0.13 from1996 through 2010. This increase is due to the Macondo well spill, prior to which the next most recent OCS Platform spill ≥10,000 bbl was in 1970. 5.2 Petroleum Spill Rates from OCS Pipelines This section discusses OCS Pipeline spill rates for both the entire record and the last 15 years. There have been four additional OCS pipeline spills (Table 4; Fig. 1) since the spill rates were last calculated (Anderson and LaBelle, 2000). 5.2.1 OCS Pipelines: Entire Record (1964 through 2010) The updated spill rate of 0.94 spills per Bbbl handled for OCS pipeline spills ≥ 1,000 bbl (Table 9) was calculated based on the last nine spills that occurred over the most recent 9.6 Bbbl of production (i.e., based on production intervals 18-36, Fig 7). This calculation was based on the new trend of fewer spills per Bbbl in the second half of the production record. This 0.94 rate is lower than the 1.33 previous spill rate (Anderson and LaBelle, 2000) which was based on the entire record of 16 spills over 12.0 Bbbl of production at the time (through 1999). Over the entire record (1964 through 2010), 4 of 20 OCS pipeline spills (≥1,000 bbl) were ≥ 10,000 bbl, none of which occurred during the trend period of the second half of the production record. The updated OCS Pipeline spill rate estimate of 0.19 spills per Bbbl produced for spills ≥10,000 bbl (Table 9) was calculated

28
by applying the ratio four out of 20 (4/20, or 20%) to the new 0.94 rate for spills ≥ 1,000 bbl. This is a decline compared to the previous 0.33 spill rate (Anderson and LaBelle, 2000) which was based on the entire record of 4 spills ≥ 10,000 bbl over 12.0 Bbbl of production.
Table 9. Spill Rates for Petroleum Spills ≥ 1,000 Barrels from OCS Platforms and Pipelines, 1964 through 2010
Volume Handled
(Bbbl)2Number of Spills
Spill
Rate3
Volume Handled
(Bbbl)2Number of Spills
Spill
Rate3
Volume Handled
(Bbbl)2Number of Spills
Spill
Rate3
≥ 1,000 bbl4
Platforms 9.5 of 12.05 3 of 115 0.325 15.8 of 18.16 5 of 1360.32 8.0 2 0.25
Pipelines 12.0 16 1.33 9.6 of 18.17 9 of 2070.94 8.0 7 0.88
≥ 10,000 bbl4
Platforms 12.08 480.12 15.8 of 18.19 1 of 59
0.06 8.0 1 0.13
Pipelines 12.0 4 0.33 9.6 of 18.110 -100.19 8.011 -11
0.18
Previous Rate, 1964 - 19991 Updated Rate, 1964 - 2010,
1996 - 2010
7 New trend, 9 spills ≥ 1,000 bbl over most recent 9.6 Bbbl production 1964-2010; compare to 20 spills over entire 18.1 Bbbl production record (1.10 spills/Bbbl entire record).
Spill Size and Source
Note: Petroleum includes crude oil, condensate, and diesel.
1 Anderson and LaBelle (2000)
5 Based on continued trend initially identified in Anderson and LaBelle (1990). Most recent 9.5 Bbbl production over which 3 spills ≥ 1,000 bbl occurred, 1964-1999.
2 Billion = 109 . Billion barrels = Bbbl = 109 bbl
3 Spill rate = number spills ≥ 1,000 bbl (or 10,000 bbl or 100,000 bbl) in size per Bbbl produced.
Sources: U.S. DOI/BOEMRE OCS Spill Database, May 2011; U.S. DOI/ONRR OCS Production Data, May 2011 (http://www.boemre.gov/stats/OCSproduction.htm)
10 Four of 20 pipeline spills were ≥ 10,000 bbl, none of which were in the last 9.6 Bbbl production. Based ratio of on 4/20 of the pipeline rate for spills ≥ 1,000 bbl, in the last 9.6 Bbbl.
9 Based on continued trend initially identified in Anderson and LaBelle (1990). Most recent 15.6 Bbbl production over which one spill ≥ 10,000 bbl occurred, 1964-2010.
11 Four of 20 pipeline spills were ≥ 10,000 bbl, none of which were in last 15 years. Based on ratio of 4/20 of the pipeline rate for spills ≥ 1,000 bbl, 1996-2010.
4 Barrel (bbl) = 42 gallons
6 Based on continued trend initially identified in Anderson and LaBelle (1990). Most recent 15.6 Bbbl production over which 5 spills ≥ 1,000 bbl occurred, 1964-2010.
8 Four of 11 platform spills were ≥10,000 bbl, none of which were in trend period. Based on ratio of 4/11 of the rate for platform spills ≥1,000 bbl in trend period, 1964-1999.
5.2.2 OCS Pipelines: Last 15 Years (1996 through 2010) Spill rates for OCS pipelines ≥ 1,000 bbl declined from 1.38 from1985 through 1999 (Anderson and LaBelle, 2000) to 0.88 from1996 through 2010. Spill rates for OCS pipeline spills ≥ 10,000 bbl declined from 0.34 from1985 through1999 (Anderson and LaBelle, 2000) to 0.18 from1996 through 2010 (Table 9). Since there were no spills ≥ 10,000 bbl in the last 15 years, the revised rate of 0.18 spills per Bbbl produced was
29
estimated by pro-rating the 0.88 rate for spills ≥ 1,000 bbl by the relative weight of spills ≥ 10,000 in the entire data set (4 out of 20 spills ≥ 1,000 or 4/20th). It is worth noting that this most recent 15-year period (from 1996 through 2010) spans the move of OCS oil production into deepwater (> 1,000 ft. water depth). In 1996, deepwater oil production in the Gulf of Mexico was just under 20% of the total oil production in the region. In 2010, that percentage had increased to 81% (http://www.data.bsee.gov/homepg/data_center/production/production/summary.asp). 5.3 Crude Oil Spill Rates from Tankers in Worldwide Coastal and Offshore Waters 5.3.1 Worldwide Tankers: Entire Record, 1974 through 2008 Data on crude oil tanker spills ≥1,000 bbl occurring in worldwide waters from 1974 through 2008 (Fig. 2) provide a robust number of spill observations over time. The annual spill rate did not increase or decrease strictly monotonically over time. However, it clearly has declined over the decades (Table 10; Fig. 8). The annual rates varied between: 1.50 – 2.16 spills per Bbbl handled in the 1970’s; 0.78 – 1.90 spills per Bbbl handled in the 1980’s; 0.26 – 1.49 spills per Bbbl handled in the 1990’s; and 0.07 – 0.37 spills per Bbbl handled from 2000 through 2008. In the 1980’s and early 1990’s, the Nova (1985, Iran), the Khark 5 (1989, Morocco) and the Aegean Sea (1992, Spain) each spilled about half a million bbl; the Odyssey (1988, Canada) and the Haven (1991, Italy) each spilled about a million bbl; and the ABT Summer spilled almost 2 million bbl (1991, Angola); all were crude oil spills. Following the March 1989 Exxon Valdez spill of about a quarter million bbl in Prince William Sound, the U.S. Congress passed the Oil Pollution Act of 1990 (OPA 90) which included establishing the double-hull standard for U.S. flagged oil tankers; all single-hull oil U.S. flagged oil tankers have since been sold, scrapped, or converted to other uses. In 1992, changes in the international regulatory regime in the form of additions to MARPOL 73/78 (the International Convention for the Prevention of Pollution by Ships) mandated a phased worldwide transition to double-hull vessels or their equivalent. Although the double-hull requirement was adopted in 1992, following the Erika incident off the coast of France in December 1999 [about 150,000 bbl heavy fuel oil oiling 300 km shoreline, impacting oyster beds and killing over 60,000 birds], International Maritime Organization (IMO) Member States made further changes accelerating the phase-out of single-hull tankers (IMO website, June 2011). Consequently, the final phasing-out date for the last group of single-hull tankers was 2010. It is likely that these regulatory changes have greatly contributed to reductions in the frequency of large tanker spills identified in the tanker data in the last analysis (Anderson and LaBelle, 2000) with further reductions shown in this report.

30
Table 10. Spill Rates for Crude Oil Spills ≥ 1,000 Barrels from Worldwide Tankers, 1974 through 2008
Volume Transported
(Bbbl)3Number of Spills
Spill
Rate2
Volume Transported
(Bbbl)3Number of Spills
Spill
Rate2
Volume Transported
(Bbbl)3Number of Spills
Spill
Rate2
≥ 1,000 bbl4
All Spills 239.7 278 1.16 359.9 303 0.84 185.8 59 0.32
In Port 117 0.49 137 0.38 33 0.18
At Sea 161 0.67 166 0.46 26 0.14
≥10,000 bbl4
All Spills 239.7 143 0.59 359.9 151 0.42 185.8 20 0.11
In Port 44 0.18 50 0.14 7 0.04
At Sea 99 0.41 101 0.28 13 0.07
≥ 100,000 bbl4
All Spills 239.7 58 0.24 359.9 62 0.17 185.8 6 0.03
In Port 16 0.07 20 0.05 4 0.02
At Sea 42 0.17 42 0.12 2 0.01
Spill Size and Location
Previous1 Rate2
1974 - 19991Updated Rate2
1974 - 2008Last 15-Year Rate2
1994 - 2008
1 Anderson and LaBelle (2000)
2 Spill rate = number spills ≥ 1,000 bbl (or 10,000 bbl or 100,000 bbl) per Bbbl handled
3 Billion barrels = Bbbl = 109 bbl;
4 Barrel = bbl = 42 U.S. gallons;
Sources: DOI/BOEMRE Worldwide Tanker Spill Database, January 2011; BP Statistical Review of World
Energy, 1975-2009 The spill rates calculated on the entire record for “At Sea” and “In Port” spills combined (Table 10) show a decline from 1.16 to 0.84 spills per Bbbl ≥1,000 bbl from Tankers Worldwide (compared to Anderson and LaBelle, 2000). Rates for larger spill sizes also declined, from 0.59 to 0.42 spills per Bbbl (spills ≥10,000 bbl) and from 0.24 to 0.17 spills per Bbbl (spills ≥ 100,000 bbl) (compared to Anderson and LaBelle, 2000). Rates for spills that occurred offshore (“At Sea”) were analyzed separately from those occurring in harbors or at piers (“In Port”). Inland tanker spills were excluded from this analysis because they are beyond BOEM purview. Both the “At Sea” and the “In Port” rates declined for all three spill sizes calculated for 1974 through 2008 as compared to the last calculations for 1974 through1999 (Anderson and LaBelle, 2000). 5.3.2 Tankers Worldwide: Last 15 Years (1994 through 2008) The updated spill rates for crude oil spills from tankers worldwide in the last 15 years are significantly lower than rates based on the entire record for all three spill sizes, i.e. 0.32, 0.11 and 0.03 spills per Bbbl from1994 through 2008 versus 0.84, 0.42 and 0.17 spills per Bbbl from1974 through 2008 for spills ≥ 1,000 bbl, ≥ 10,000 bbl, and ≥ 100,000 bbl respectively.

31
0
1
2
3
4
5
6
74 76 78 80 82 84 86 88 90 92 94 96 98 00 02 04 06 08
Sp
ills
per
Bb
bl T
ran
spo
rted
Year
Tankers Worldwide
Tankers U.S. Waters
Bbbl= Billion (109) barrels
Barrel = 42 U.S. gallons
Sources: Tables 10 and 11
Figure 8. Spill Rates by Year for Crude Oil Spills ≥1,000 bbl from
Worldwide Tankers and Tankers in U.S. Waters The 15-year rates for 1994 through 2008 are also significantly lower than the 15-year rates for 1985 through1999 calculated in Anderson and LaBelle (2000) for all three spill sizes, i.e., 0.32, 0.11 and 0.03 spills per Bbbl from1994 through 2008 versus 0.82, 0.37 and 0.12 spills per Bbbl from1974 through1999 for spills ≥ 1,000 bbl, ≥ 10,000 bbl, and ≥ 100,000 bbl, respectively. In addition, both the “At Sea” and the “In Port” rates declined for all three spill sizes calculated for 1994 through 2008, as compared to the previous calculations for 1985 through 1999 (Anderson and LaBelle, 2000). 5.4 Crude Oil Spill Rates from Tankers in U.S. Coastal and Offshore Waters 5.4.1 U.S. Tankers: Entire Record (1974 through 2008) Tanker spills ≥1,000 bbl in U.S. coastal and offshore waters (Fig. 3) have one to six spill observations each year from1974 through1992, but then have five observations total in the 16 years from1993 through 2008. The annual spill rate did not strictly increase or decrease monotonically over time (Fig. 8, Table 6). The highest annual rate, 5.86 spills per Bbbl handled, was in 1975 near the beginning of the data series, and the rate exceeds 2.00 spills per Bbbl handled in 1974, 1975, 1976, and 1979. In general, however, the rates in the second half of the time period were lower than those in the first half. In Table 11, the spill rates calculated on the entire record showed a decline compared to when they
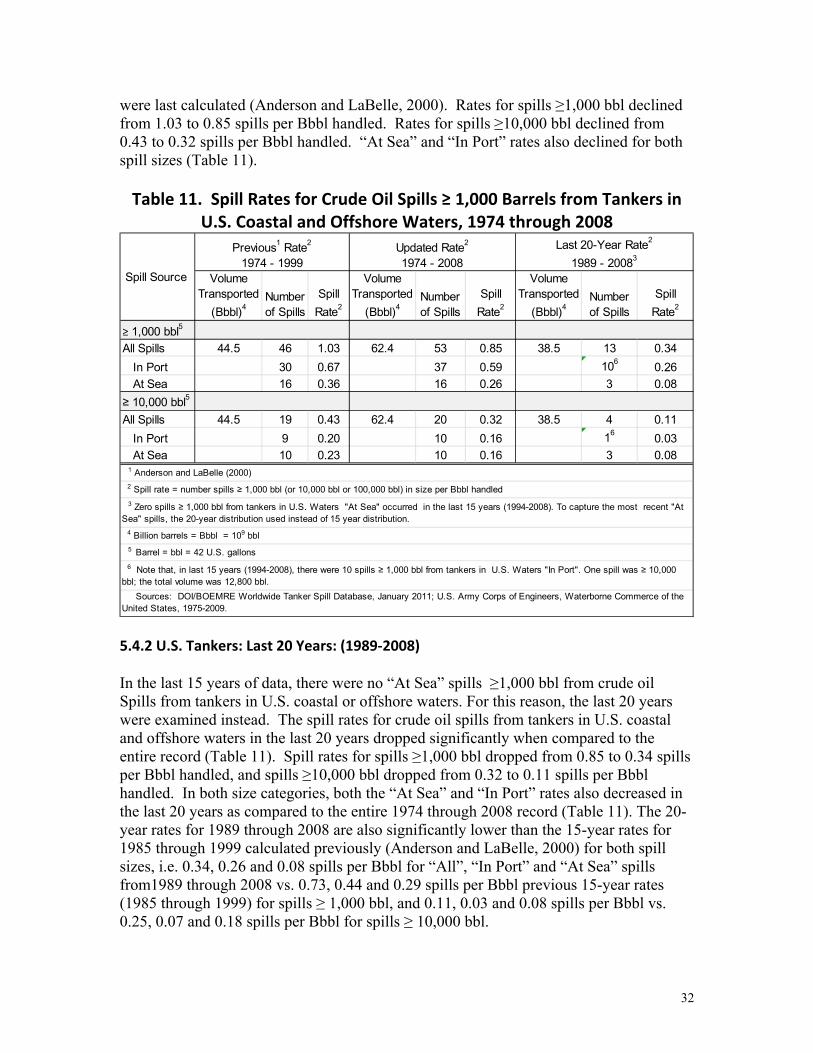
32
were last calculated (Anderson and LaBelle, 2000). Rates for spills ≥1,000 bbl declined from 1.03 to 0.85 spills per Bbbl handled. Rates for spills ≥10,000 bbl declined from 0.43 to 0.32 spills per Bbbl handled. “At Sea” and “In Port” rates also declined for both spill sizes (Table 11). Table 11. Spill Rates for Crude Oil Spills ≥ 1,000 Barrels from Tankers in
U.S. Coastal and Offshore Waters, 1974 through 2008
Volume Transported
(Bbbl)4Number of Spills
Spill
Rate2
Volume Transported
(Bbbl)4Number of Spills
Spill
Rate2
Volume Transported
(Bbbl)4Number of Spills
Spill
Rate2
≥ 1,000 bbl5
All Spills 44.5 46 1.03 62.4 53 0.85 38.5 13 0.34
In Port 30 0.67 37 0.59 1060.26
At Sea 16 0.36 16 0.26 3 0.08
≥ 10,000 bbl5
All Spills 44.5 19 0.43 62.4 20 0.32 38.5 4 0.11
In Port 9 0.20 10 0.16 160.03
At Sea 10 0.23 10 0.16 3 0.08
5 Barrel = bbl = 42 U.S. gallons
Sources: DOI/BOEMRE Worldwide Tanker Spill Database, January 2011; U.S. Army Corps of Engineers, Waterborne Commerce of the United States, 1975-2009.
Spill Source
6 Note that, in last 15 years (1994-2008), there were 10 spills ≥ 1,000 bbl from tankers in U.S. Waters "In Port". One spill was ≥ 10,000 bbl; the total volume was 12,800 bbl.
1 Anderson and LaBelle (2000)
3 Zero spills ≥ 1,000 bbl from tankers in U.S. Waters "At Sea" occurred in the last 15 years (1994-2008). To capture the most recent "At Sea" spills, the 20-year distribution used instead of 15 year distribution.
Previous1 Rate2
1974 - 1999Updated Rate2
1974 - 2008
Last 20-Year Rate2
1989 - 20083
2 Spill rate = number spills ≥ 1,000 bbl (or 10,000 bbl or 100,000 bbl) in size per Bbbl handled
4 Billion barrels = Bbbl = 109 bbl
5.4.2 U.S. Tankers: Last 20 Years: (1989‐2008) In the last 15 years of data, there were no “At Sea” spills ≥1,000 bbl from crude oil Spills from tankers in U.S. coastal or offshore waters. For this reason, the last 20 years were examined instead. The spill rates for crude oil spills from tankers in U.S. coastal and offshore waters in the last 20 years dropped significantly when compared to the entire record (Table 11). Spill rates for spills ≥1,000 bbl dropped from 0.85 to 0.34 spills per Bbbl handled, and spills ≥10,000 bbl dropped from 0.32 to 0.11 spills per Bbbl handled. In both size categories, both the “At Sea” and “In Port” rates also decreased in the last 20 years as compared to the entire 1974 through 2008 record (Table 11). The 20-year rates for 1989 through 2008 are also significantly lower than the 15-year rates for 1985 through 1999 calculated previously (Anderson and LaBelle, 2000) for both spill sizes, i.e. 0.34, 0.26 and 0.08 spills per Bbbl for “All”, “In Port” and “At Sea” spills from1989 through 2008 vs. 0.73, 0.44 and 0.29 spills per Bbbl previous 15-year rates (1985 through 1999) for spills ≥ 1,000 bbl, and 0.11, 0.03 and 0.08 spills per Bbbl vs. 0.25, 0.07 and 0.18 spills per Bbbl for spills ≥ 10,000 bbl.
33
5.5 Crude Oil Spill Rates from ANS Tankers “In Port” and “At Sea” 5.5.1 ANS Tankers: Entire Record (1977 through 2008) U.S. law requires that marine transportation of goods between U.S. ports be performed by U.S. flagships. These U.S. flagships must be owned by U.S. companies, built in the United States, and manned by U.S. crews. Table 12 presents the calculated spill rates for ANS crude oil transported by tanker from Valdez, Alaska to U.S. West Coast Destinations and to Panama. The table is based on the 11 spill observations that occurred from 1978 through1991, with no further observations from1992 through 2008 (Fig 4). The volume of ANS crude oil and associated tanker spill occurrences peaked from 1987 through1989, and has generally decreased in volume annually since then. No spill occurrences have been observed since 1991. The spill rates calculated on the entire record showed a decline compared to when they were last calculated (Anderson and LaBelle, 2000). Rates for spills ≥1,000 bbl declined from 0.88 to 0.72 spills per Bbbl handled. The decline occurred in both the “In Port” and the “At Sea” components. Rates for spills ≥10,000 bbl declined from 0.23 to 0.20. Due to the lack of any “In Port” spills ≥10,000 bbl, only an “At Sea” rate for spills ≥10,000 bbl was estimated (Table 12). 5.5.2 ANS Crude Oil from Tankers: Last 20 Years (1989 through 2008) There were no spills ≥1,000 bbl from ANS Crude Tankers in the last 15 years of data, so the last 20 years were examined instead (Table 12). The spill rate for “In Port” crude oil spills ≥1,000 bbl from ANS Crude Tankers increased from 0.26 to 0.35 spills per Bbbl from the entire record to the last 20 years record, while the “At Sea” rate declined from 0.46 to 0.11 spills per Bbbl handled, for a net decline for the “All Spills” rate from 0.72 to 0.46 spills per Bbbl over the last 20 year period as compared to the entire 1977 through 2008 record. The “At Sea” spill rate for spills ≥10,000 bbl in the last 20 years declined compared to the entire record decreased from 0.20 to 0.12 spills per Bbbl handled. Due to the lack of any “In Port” spills ≥10,000 bbl, only an “At Sea” rate for spills ≥10,000 bbl was estimated. The last 20-year rates for 1989 through 2008 declined as compared to the previously calculated 15-year rates (Anderson and LaBelle, 2000) for both spill size categories; spill rates of 0.92, 0.46 and 0.46 spills per Bbbl for “All”, “In Port” and “At Sea” spills of 1,000 bbl or greater (1985 through 1999) declined to 0.46, 0.35 and 0.11 spills per Bbbl (1989 through 2008). There was one “At Sea” spill of 10,000 bbl or greater in the last 20 years for an “At Sea” rate of 0.12 spills per Bbbl compared to 0.34 spills per Bbbl for the previously calculated (Anderson and LaBelle, 2000) 15-year (1985 through 1999) “At Sea” spill rate.

34
Table 12. Spill Rates for Alaska North Slope Crude Oil Spills ≥ 1,000 Barrels from Tankers, U.S. Flag Ships, 1977 through 2008
Volume5
Transported (Bbbl)6
Number of Spills
Spill
Rate3
Volume5
Transported (Bbbl)6
Number of Spills
Spill
Rate3
Volume5
Transported (Bbbl)6
Number of Spills
Spill
Rate3
≥ 1,000 bbl7
All Spills812.6 11 0.88 15.3 11 0.72 8.7 4 0.46
In Port 4 0.32 4 0.26 3 0.35
At Sea 7 0.56 7 0.46 1 0.11
≥10,000 bbl7
All Spills 12.6 3 0.23 15.3 3 0.20 8.7 1 0.12
In Port9 0 -.-100 -.-10
0 -.-10
At Sea 3 0.23 3 0.20 1 0.12
4 Zero spills ≥ 1,000 bbl for ANS crude oil tankers in last 15 years (1994-2008). Most recent 20-year distribution was used instead of 15-year data to capture at least one 'At Sea' and 'In Port' spill.
Previous2 Rate3
1977 - 19994Updated Rate3
1977 - 2008
Last 20-Year Rate3
1989 - 20084
1 The Jones Act, part of the Merchant Marine Act of 1920, requires that goods transported by water between U.S. ports,
Spill Source: U.S. Flag
Ships1
such as North Slope Crude Oil from Valdez, AK to to U.S. coastal ports in Alaska, Hawaii, California and the Gulf of
owned by U.S. citizens, crewed by U.S. citizens, and registered in the U.S..
5 Annual Alaskan North Slope Crude from Trans Alaska Pipeline System (TAPS) (http://www.alyeska-pipe.com/Default.asp) Loadings at Valdez Terminal in Alaska.
of Mexico be carried by U.S. Flag Ships. U.S. Flag Ships must be: constructed (or rebuilt) in the U.S.,
2 Anderson and LaBelle (2000)
10 Dash (-.-) indicates zero spills observed, rate not calculated.
Sources: DOI/BOEMRE Tanker Spill Database, January 2011; U.S. Department of Commerce, Maritime Administration, Annual Loadings.
3 Spill rate = number of spills ≥ 1,000 bbl (or ≥ 10,000 bbl or ≥ 100,000 bbl) in size per Bbbl handled
6 Bbbl =Billion barrels = 109 bbl
7 bbl= Barrel = 42 U.S. gallons
9 Zero 'In Port' spills of 10,000 bbl and greater observed over entire record; spill rate not calculated.
8 Over the entire record, there were 11 spills totaling 0.32 million bbl from TAPS tanker fleet (all U.S. Flag Ships). Eight were in U.S. waters, two were in the Panama Canal Zone Zone (1978 and 1980), one was in Mexican waters (1981). The largest spill was the Exxon Valdez, 262,000 bbl, in March 1989.
5.6 Petroleum Spill Rates from Barges in U.S. Coastal, Offshore, and Inland Waters 5.6.1 U.S. Barges: Entire Record (1974 through 2008)
Data on petroleum spills ≥1,000 bbl from petroleum barges in U.S. coastal, offshore, and inland waters provide a robust number of spill observations since 1974 (Fig. 5, Table 7). The annual spill rate did not increase or decrease monotonically over time (Fig. 9; Table 7). The annual rate exceeded 7 spills per Bbbl handled in 1974, 1975, 1977, 1978, and 1985. These rates have declined over the years. In the 18 years from 1991 through 2008, the spill rates were generally 50 percent or less than the rates in the first 17 years from 1974 through 1990. The lowest rate (3.00 spills per Bbbl handled) in the earlier period, is
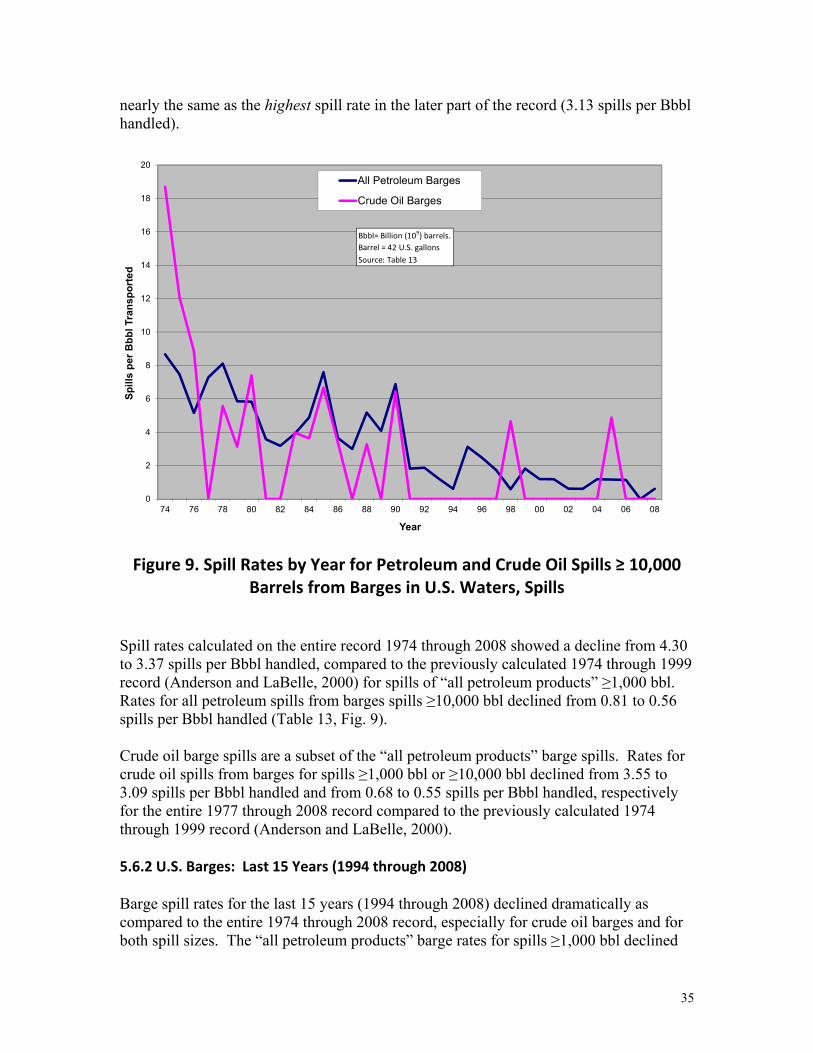
35
nearly the same as the highest spill rate in the later part of the record (3.13 spills per Bbbl handled).
0
2
4
6
8
10
12
14
16
18
20
74 76 78 80 82 84 86 88 90 92 94 96 98 00 02 04 06 08
Sp
ills
per
Bb
bl T
ran
spo
rte
d
Year
All Petroleum Barges
Crude Oil Barges
Bbbl= Billion (109) barrels.
Barrel = 42 U.S. gallons
Source: Table 13
Figure 9. Spill Rates by Year for Petroleum and Crude Oil Spills ≥ 10,000 Barrels from Barges in U.S. Waters, Spills
Spill rates calculated on the entire record 1974 through 2008 showed a decline from 4.30 to 3.37 spills per Bbbl handled, compared to the previously calculated 1974 through 1999 record (Anderson and LaBelle, 2000) for spills of “all petroleum products” ≥1,000 bbl. Rates for all petroleum spills from barges spills ≥10,000 bbl declined from 0.81 to 0.56 spills per Bbbl handled (Table 13, Fig. 9). Crude oil barge spills are a subset of the “all petroleum products” barge spills. Rates for crude oil spills from barges for spills ≥1,000 bbl or ≥10,000 bbl declined from 3.55 to 3.09 spills per Bbbl handled and from 0.68 to 0.55 spills per Bbbl handled, respectively for the entire 1977 through 2008 record compared to the previously calculated 1974 through 1999 record (Anderson and LaBelle, 2000). 5.6.2 U.S. Barges: Last 15 Years (1994 through 2008) Barge spill rates for the last 15 years (1994 through 2008) declined dramatically as compared to the entire 1974 through 2008 record, especially for crude oil barges and for both spill sizes. The “all petroleum products” barge rates for spills ≥1,000 bbl declined
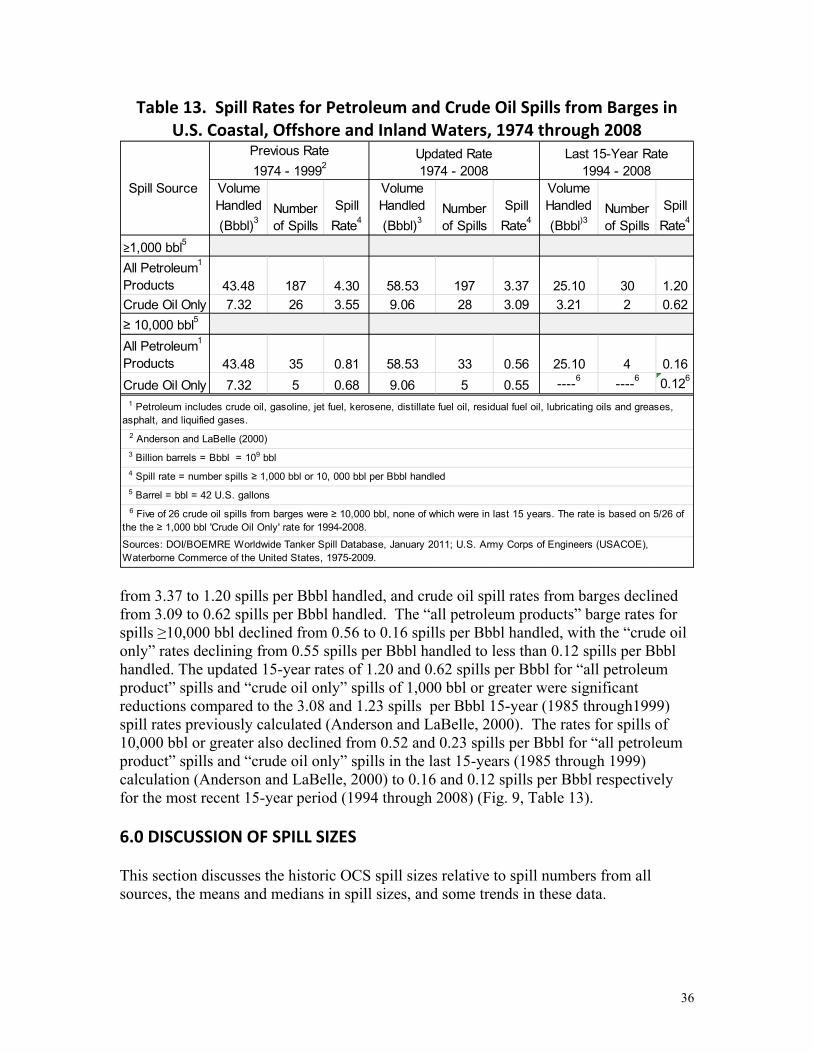
36
Table 13. Spill Rates for Petroleum and Crude Oil Spills from Barges in U.S. Coastal, Offshore and Inland Waters, 1974 through 2008
Volume Handled
(Bbbl)3Number of Spills
Spill
Rate4
Volume Handled
(Bbbl)3Number of Spills
Spill
Rate4
Volume Handled
(Bbbl)3Number of Spills
Spill
Rate4
≥1,000 bbl5
All Petroleum1
Products 43.48 187 4.30 58.53 197 3.37 25.10 30 1.20
Crude Oil Only 7.32 26 3.55 9.06 28 3.09 3.21 2 0.62
≥ 10,000 bbl5
All Petroleum1
Products 43.48 35 0.81 58.53 33 0.56 25.10 4 0.16
Crude Oil Only 7.32 5 0.68 9.06 5 0.55 ----6 ----6 0.126
Sources: DOI/BOEMRE Worldwide Tanker Spill Database, January 2011; U.S. Army Corps of Engineers (USACOE), Waterborne Commerce of the United States, 1975-2009.
6 Five of 26 crude oil spills from barges were ≥ 10,000 bbl, none of which were in last 15 years. The rate is based on 5/26 of the the ≥ 1,000 bbl 'Crude Oil Only' rate for 1994-2008.
3 Billion barrels = Bbbl = 109 bbl
4 Spill rate = number spills ≥ 1,000 bbl or 10, 000 bbl per Bbbl handled
5 Barrel = bbl = 42 U.S. gallons
Spill Source
Previous Rate
1974 - 19992Updated Rate 1974 - 2008
Last 15-Year Rate 1994 - 2008
2 Anderson and LaBelle (2000)
1 Petroleum includes crude oil, gasoline, jet fuel, kerosene, distillate fuel oil, residual fuel oil, lubricating oils and greases, asphalt, and liquified gases.
from 3.37 to 1.20 spills per Bbbl handled, and crude oil spill rates from barges declined from 3.09 to 0.62 spills per Bbbl handled. The “all petroleum products” barge rates for spills ≥10,000 bbl declined from 0.56 to 0.16 spills per Bbbl handled, with the “crude oil only” rates declining from 0.55 spills per Bbbl handled to less than 0.12 spills per Bbbl handled. The updated 15-year rates of 1.20 and 0.62 spills per Bbbl for “all petroleum product” spills and “crude oil only” spills of 1,000 bbl or greater were significant reductions compared to the 3.08 and 1.23 spills per Bbbl 15-year (1985 through1999) spill rates previously calculated (Anderson and LaBelle, 2000). The rates for spills of 10,000 bbl or greater also declined from 0.52 and 0.23 spills per Bbbl for “all petroleum product” spills and “crude oil only” spills in the last 15-years (1985 through 1999) calculation (Anderson and LaBelle, 2000) to 0.16 and 0.12 spills per Bbbl respectively for the most recent 15-year period (1994 through 2008) (Fig. 9, Table 13). 6.0 DISCUSSION OF SPILL SIZES This section discusses the historic OCS spill sizes relative to spill numbers from all sources, the means and medians in spill sizes, and some trends in these data.

37
6.1 Summary of Historic OCS Spills ≥ One Barrel
The vast majority of spills are ≥ 1,000 barrels. If you include all spills ≥ one barrel, for the 46-year time period from1964 through 2009, you find that 98.9 percent of all spills were <1,000 barrels in volume and 1.1 percent of spills were ≥1,000 barrels in volume. However, the spills ≥ 1,000 barrels in volume accounted for 90.6 percent by volume of the almost 570,000 bbl petroleum spilled in that time period (Fig. 10) (and more than 99.9 percent by volume from 1964 through 2010 due to the Macondo well spill; see Appendix C).
6.2 Average and Median Spill Sizes for All Spill Sources Averages and medians are statistical measures that are frequently used to characterize a typical event. The median (“middle number”) spill size is the number where half of the historic spills are of higher volume and half of the spills are of lower volume. The median is different from the average, which is just the sum of volume of all spills divided by the number of the spills. Both of these numbers help describe a set of values, such as spill volumes. Average and median spill sizes were calculated for each spill source for spills ≥ 1,000 bbl and for spills ≥10,000 bbl for entire record and for the most recent 15 (or 20) years of data. Tables 14 and 15 provide average and median spill sizes by spill size category and source. In the case of OCS Platform spills, average and median spill sizes were calculated both through 2009 and 2010 to show the influence of the Macondo well spill.
The Macondo well spill size overwhelms the rest of the record in any calculation using spill volume. The Macondo well spill volume was more than 8.5 times the cumulative 570,000 bbl of petroleum than had been spilled in the previous 46 years (including all spills ≥ one bbl) on the OCS from1964 through 2009 from all OCS oil and gas activities).
The Macondo well spill was a complete loss of well control. This was the first uncontrolled deepwater blowout to occur on the OCS and it continued for 87 days. In the interest of characterizing the size of a more typical or representative OCS spill one could exclude the Macondo well spill volume in the calculation of average or median spill size because the BOEM EISs include an analysis of a very large oil spill event (such as the Macondo well spill). It is appropriate, however, to count the Macondo well spill in the spill rates for spills ≥1,000 and 10,000 bbl, which are used in the EISs as spill rate estimates. Figures 11 and 12 compare the average and median spill sizes over the entire record for each data source and for the most recent 15 year period prior to Macondo well for OCS platforms and for the most recent 15 (or 20) years for pipelines, tankers, and barges for spills ≥ 1,000 and ≥10,000 bbl, respectively.

38
____________________________________
217578%
39014%210
7%321%
1 to 9 bbl
10 to 49 bbl
50 to 999 bbl
≥ 1,000 bbl
6,5401%
7,3731%39,145
7%
513,67691%
1 to 9 bbl
10 to 49 bbl
50 to 999 bbl
≥ 1,000 bbl
Number of Spills, All Spill Sizes
Total = 2807
1964 through 2009
Spill Volume, All Spill Sizes
Total = 566,734 Barrels
1964 through 2009
Spill Size in Barrels
Number of Spills
Barrels Spilled
Average Spill Size
% Spills
≥1 bbl1% Volume ≥
1bbl1
1 to 9 2175 6,540 3 77.48% 1.15%10 to 49 390 7,373 19 13.89% 1.30%
50 to 999 210 39,145 186 7.48% 6.91%≥ 1,000 32 513,676 16,052 1.14% 90.64%
Total ≥ 1 bbl 2,807 566,734 202 100.00% 100.00%1bbl = Barrel = 42 U.S. Gallons
Petroleum Spills from OCS Oil & Gas Activities by Spill Size, 1964 to 2009
Figure 10. Petroleum Spills from OCS Oil and Gas Activities: Spill Numbers and Sizes by Size Category, 1964 through 2009
Excluding the Macondo well spill in the average and median spill sizes, the size of spills from platforms and pipelines tend to be smaller than those from tankers (Figs. 11 and 12). Also, tanker spills in U.S. coastal and offshore waters tend to be smaller than tanker spills worldwide. Although the estimated rate for barge spills in U.S. waters is relatively high in comparison to the other estimated spill rates, the average and median spill sizes are comparatively small (Figs. 11 and 12).
Table 16 provides data for OCS pipeline and pipeline spill for all sizes for the time period from 1996 through 2010. Spill numbers, volumes, spill sizes (average and median) by spill source are listed. Spill rates for platforms and pipelines combined were also calculated and are listed by spill size category.
Percentage of Spills in Each Size Category Spill Size Categories vs. Spill Volume In Barrels
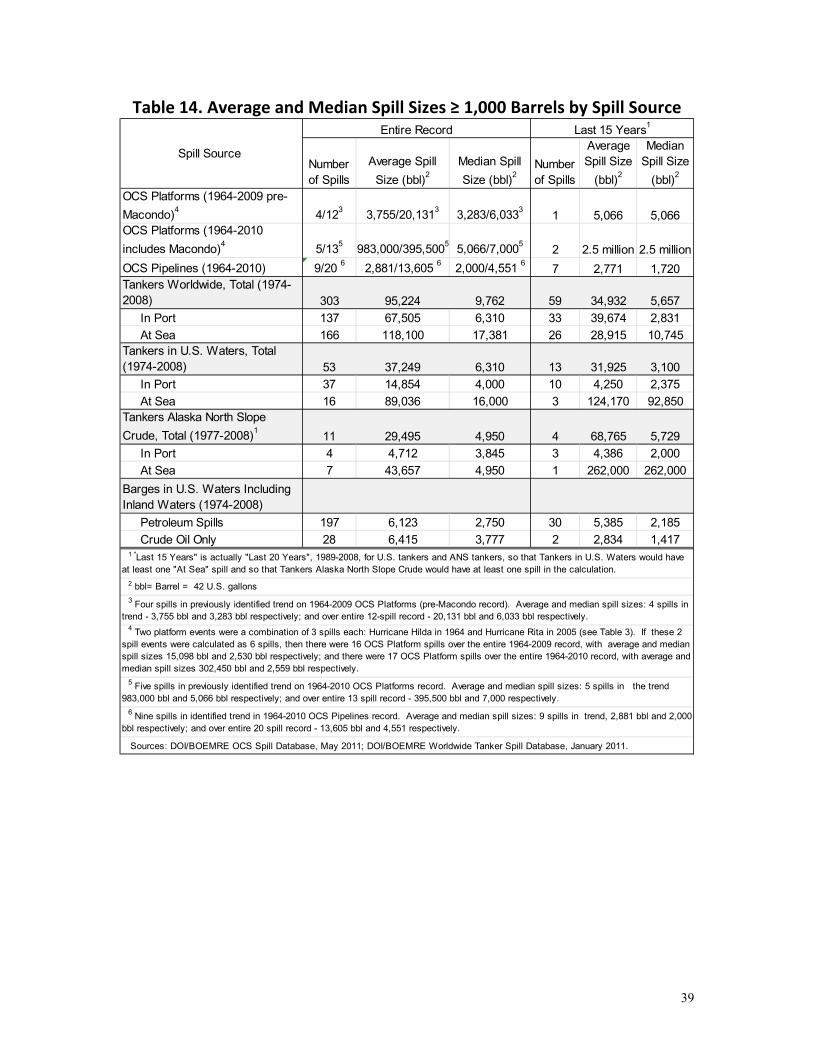
39
Table 14. Average and Median Spill Sizes ≥ 1,000 Barrels by Spill Source
Number of Spills
Average Spill
Size (bbl)2
Median Spill
Size (bbl)2
Number of Spills
Average Spill Size
(bbl)2
Median Spill Size
(bbl)2
OCS Platforms (1964-2009 pre-
Macondo)4
4/123
3,755/20,1313
3,283/6,0333
1 5,066 5,066OCS Platforms (1964-2010
includes Macondo)4
5/135
983,000/395,5005
5,066/7,0005
2 2.5 million 2.5 million
OCS Pipelines (1964-2010) 9/20 6
2,881/13,605 6
2,000/4,551 6
7 2,771 1,720Tankers Worldwide, Total (1974-2008) 303 95,224 9,762 59 34,932 5,657
In Port 137 67,505 6,310 33 39,674 2,831
At Sea 166 118,100 17,381 26 28,915 10,745Tankers in U.S. Waters, Total (1974-2008) 53 37,249 6,310 13 31,925 3,100
In Port 37 14,854 4,000 10 4,250 2,375
At Sea 16 89,036 16,000 3 124,170 92,850Tankers Alaska North Slope
Crude, Total (1977-2008)1
11 29,495 4,950 4 68,765 5,729
In Port 4 4,712 3,845 3 4,386 2,000
At Sea 7 43,657 4,950 1 262,000 262,000
Barges in U.S. Waters Including Inland Waters (1974-2008)
Petroleum Spills 197 6,123 2,750 30 5,385 2,185
Crude Oil Only 28 6,415 3,777 2 2,834 1,417
2 bbl= Barrel = 42 U.S. gallons
Sources: DOI/BOEMRE OCS Spill Database, May 2011; DOI/BOEMRE Worldwide Tanker Spill Database, January 2011.
6 Nine spills in identified trend in 1964-2010 OCS Pipelines record. Average and median spill sizes: 9 spills in trend, 2,881 bbl and 2,000 bbl respectively; and over entire 20 spill record - 13,605 bbl and 4,551 respectively.
Entire Record Last 15 Years1
3 Four spills in previously identified trend on 1964-2009 OCS Platforms (pre-Macondo record). Average and median spill sizes: 4 spills in trend - 3,755 bbl and 3,283 bbl respectively; and over entire 12-spill record - 20,131 bbl and 6,033 bbl respectively. 4 Two platform events were a combination of 3 spills each: Hurricane Hilda in 1964 and Hurricane Rita in 2005 (see Table 3). If these 2 spill events were calculated as 6 spills, then there were 16 OCS Platform spills over the entire 1964-2009 record, with average and median spill sizes 15,098 bbl and 2,530 bbl respectively; and there were 17 OCS Platform spills over the entire 1964-2010 record, with average and median spill sizes 302,450 bbl and 2,559 bbl respectively.
1 "Last 15 Years" is actually "Last 20 Years", 1989-2008, for U.S. tankers and ANS tankers, so that Tankers in U.S. Waters would have at least one "At Sea" spill and so that Tankers Alaska North Slope Crude would have at least one spill in the calculation.
Spill Source
5 Five spills in previously identified trend on 1964-2010 OCS Platforms record. Average and median spill sizes: 5 spills in the trend 983,000 bbl and 5,066 bbl respectively; and over entire 13 spill record - 395,500 bbl and 7,000 respectively.

40
Table 15. Average and Median Spill Sizes ≥ 10,000 Barrels by Spill Source
Number of Spills
Average Spill Size
(bbl)3
Median Spill Size
(bbl)3Number of Spills
Average Spill Size
(bbl)3
Median Spill Size
(bbl)3
U.S. OCS Platforms (1964‐2009
pre‐Macondo)
none/
43
none/
52,4673
none/
59,00030 none none
U.S. OCS Platforms (1964‐2010
includes Macondo)2 1/5 4
4.9 million/
1 million 4
4.9 million/
65,000 41 4.9 million 4.9 million
U..S. OCS Pipelines (1964‐2010)
none/
45
none/
52,6185
none/
17,70550 none none
Tankers Worldwide, Total 151 187,028 56,940 20 95,517 43,380
In Port 50 178,528 50,010 7 173,401 119,048 At Sea 101 191,236 62,899 13 53,580 35,000Tankers in U.S. Waters, Total 20 92,391 22,905 4 96,328 55,306
In Port 10 45,232 21,000 1 12,800 12,800 At Sea 10 139,550 79,651 3 124,170 92,850Tankers Alaska North Slope Crude, Total 3 97,062 15,000 1 262,000 262,000
In Port 0 none none 0 none none At Sea 3 97,062 15,000 1 262,000 262,000Barges in U.S. Waters Including Inland Waters
Petroleum Spills 33 21,682 17,857 4 23,857 18,785 Crude Oil Only 5 19,344 18,238 0 none none
Entire Record1 Last 15 Years2
4 One of five spills in previously identified trend on 1964‐2010 OCS Platforms record was ≥ 10,000 bbl. Average and median spil l
sizes: both 4.9 mill ion bbl for the one spil l in trend; and and for five spills ≥ 10,000 bbl over entire record ‐ 1.0 million bbl and
65,000 bbl respectively.
1 "Last 15 Years" actually "Last 20 Years", 1989‐2008, for Tankers in U.S. Waters to have at least one "At Sea" spill and for
Tankers Alaska North Slope Crude to have at least one spill in calculation.
2 bbl = Barrel = 42 U.S. gallons
5 None of the 9 spills in previously identified trend on 1964‐2010 OCS Pipelines record was ≥ 10,000 bbl. Average and median spill
sizes for 4 spil ls ≥ 10,000 over entire record were 52,618 and 17,705 bbl respectively.
Spill Source
3 Four spills in previously identified trend on 1964‐2009 OCS Platforms pre‐Macondo record of which none was ≥ 10,000 bbl. in
entire record ‐ 52,467 bbl and 59,000 bbl respectively. Average and median spil l sizes for the 4 spil ls ≥ 10,000 bbl
Sources: DOI/BOEMRE OCS Spill Database, October 2010; DOI/BOEMRE Worldwide Tanker Spill Database, January 2011.

41
Table 16. Overall OCS Petroleum Spills Size Characterization By Spill Source, 1996 through 2010
Total Platforms Pipelines Total Platforms Pipelines Total Platforms Pipelines Total Platforms Pipelines
< 1 Gallon (0.024 bbl)310,460 9,866 594 39.9 37.4 2.6 0.004 0.004 0.004
≥ 1 Gallon to < 1 bbl3 5,703 5,263 440 782.3 729.1 53.2 0.137 0.139 0.121
≥ 1 to < 5 bbl 380 276 104 827.6 592.7 234.9 2.2 2.1 2.3
≥ 5 to < 10 bbl 79 48 31 533.9 327.3 206.6 6.8 6.8 6.7
≥ 10 to < 20 bbl 79 52 27 1111.4 744.2 367.2 14.1 14.3 13.6
≥ 20 to < 50 bbl 60 47 13 1865.0 1494.7 370.3 31.1 31.8 28.5
≥ 50 to < 100 bbl 39 31 8 2,401.7 1,885.4 516.3 61.6 60.8 64.5
≥ 100 to < 500 bbl 51 39 12 9,655.2 7,584.3 2,070.9 189.3 194.5 172.6
≥ 500 to < 1,000 bbl 13 8 5 8,963.8 4,800.8 4,163.0 1.63 689.5 600.1 832.6
≥ 1,000 to < 2,000 bbl 4 0 4 5,747.0 0.0 5,747.0 1,436.8 None 1,436.8
≥ 2,000 to < 3,000 bbl 1 0 1 2,240.0 0.0 2,240.0 2,240.0 None 2,240.0
≥ 3,000 to < 10,000 bbl 3 1 2 16,478.0 5066.0411,412.0 5,492.7 5,066.0 5,706.0
≥ 10,000 Barrels 1 1 0 4,900,000 4,900,000 0 0.13 4,900,000 4,900,000 None 4,900,000 4,900,000 None
All Spills 16,873 15,632 1,241 4,950,646 4,923,262 27,384 2109.13 293.4 314.9 22.1
less than one gallon
3.0 2.0 3.6
126.0
Number of Petroleum1 Spills Barrels2 Spilled Average Spill Size Barrels2 Median Spill Size Barrels2Spill Rate5
Platforms & Pipelines Combined
Spill Size
1.00 1,980.0
126.0
2,020.38
57.38
17.38
3 Spills less than one bbl: 1999 to 2010 National Response Center (NRC) data; used average of 1999-2010 NRC data as proxy for 1996-1998 spills less than one bbl. 4 The three spills from Hurricane Rita in 2005 are counted as a single 5,066 bbl event.
11.25125.9
1 Petroleum includes crude oil, condensate and diesel.
Sources: DOI/BOEMRE OCS Spill Database, May 2011
5 Spill Rates based on 8.0 Bbbl production.
5,066.0 1,720.0
Less than one gallon
2 Barrel = bbl = 42 U.S. gallons

42
1.3
1.6
1
1.3
0.67
0.6
4.32
4.81
1.1
1.21
1.3
1.32
0.45
3.55
4.30
0.88
1.03
1.16
1.33
0.32
3.09
3.37
0.72
0.85
0.84
0.94
0.32
0.62
1.20
0.46
0.34
0.32
0.88
0.25
0 1 2 3 4 5 6
Barges U.S. Crude
Barges U.S. Petroleum
Tankers ANS Crude
Tankers U.S. Waters
Tankers Worldwide
U.S. OCS Pipelines
U.S. OCS Platforms
Mean Number Spills ≥ 1,000 bbl per Bbbl Handled
Spi
ll S
ourc
e
Last 15 Years *
Full Record **
Anderson & LaBelle (2000)
Anderson & LaBelle (1994)
Anderson & LaBelle (1990)
Lanfear & Amstutz (1983)
OCS Data
Worldwide Tankers and U.S. Barges U.S. Tankers ANS Tankers
Last 15 Years* 1996-2010 1994-2008 1989-2008 1989-2008
Full Record ** 1964-2010 1974-2008 1974-2008 1977-2008
Anderson & LaBelle (2000) 1964-1999 1974-1999 1974-1999 1977-1999
Anderson & LaBelle (1994) 1964-1992 1974-1992 1974-1992 1977-1992
Anderson & LaBelle (1990) 1964-1987
Lanfear & Amstutz (1983) 1964-1980
Data Series
* Data from last 20 years were used for tanker spills in U.S. waters and for ANS crude oil spills to include at least one spill in the record.
** Full record trended for OCS platforms and pipelines
Figure 11. Comparison of Historic Spill Rates for Spills ≥ 1,000 Barrel

43
0.65
0.67
0.44
0.71
0.17
0.24
0.72
0.85
0.33
0.58
0.72
0.44
0.16
0.68
0.81
0.23
0.43
0.59
0.33
0.12
0.55
0.56
0.2
0.32
0.42
0.19
0.06
0.11
0.16
0.12
0.11
0.11
0.18
0.13
0 0.1 0.2 0.3 0.4 0.5 0.6 0.7 0.8 0.9
Barges U.S. Crude
Barges U.S. Petroleum
Tankers ANS Crude
Tankers U.S. Waters
Tankers Worldwide
U.S. OCS Pipelines
U.S. OCS Platforms
Mean Number of Spills ≥ 10,000 bbl per Bbbl Handled
Last 15 Years*
Full Record **
Anderson & LaBelle (2000)
Anderson & LaBelle (1994)
Anderson & LaBelle (1990)
Lanfear & Amstutz (1983)
* Data from last 20 years was used for tankers in U.S. Waters and ANS crude oil to include at least one spill in the record.
** Full Record Trended for OCS Platforms and Pipelines
Data Series
Last 15 Years or 20 Years* 1996-2010 1994-2008 1989-2008 1989-2008
Full Record** 1964-2010 1974-2008 1974-2008 1977-2008
Anderson & LaBelle (2000) 1964-1999 1974-1999 1974-1999 1977-1999
Anderson & LaBelle (1994) 1964-1992 1974-1992 1974-1992 1977-1992
Anderson & LaBelle (1990) 1964-1987
Lanfear & Amstutz (1983) 1964-1980
OCS Data
Worldwide Tankers and U.S. Barges
U.S. Tankers
ANS Tankers
Figure 12. Comparison of Historic Spill Rates for Spills ≥ 10,000 Barrels

44
7.0 DISCUSSION AND CONCLUSIONS Rates for spills ≥1,000 bbl or ≥10,000 bbl are estimated updates of previously calculated rates based on data through 1999 (Anderson and LaBelle, 2000). 7.1 Spill Rates ≥1,000 Barrels This section addresses historic and current spill rates by spill sources for spills ≥ 1,000 barrels. Figure 13 shows these rates. 7.1.1 OCS Platforms: Spill Rates ≥ 1,000 Barrels In previous revisions, spill rates for OCS platform spills ≥1,000 bbl had continued to decline since they were first calculated by Stewart (1975, 1976) and in subsequent updates by Lanfear and Amstutz (1983) and Anderson and LaBelle (1990, 1994, 2000). In this latest revision, the rate for spills ≥1,000 bbl was unchanged at 0.32 (compared to Anderson and LaBelle, 2000) over the trend period (intervals numbered 3 to 18, Fig. 6). The rate for the most recent 15 years of data increased to 0.25 (1996 through 2010) as compared to 0.13 (15-year period from Anderson and LaBelle 2000: 1985 through 1999). This increase was due to the two recent platform spill occurrences, one from structures destroyed in Hurricane Rita in 2005 and the other from the Macondo spill in 2010. Prior to these two incidents, the last OCS platform spill ≥1,000 bbl was in 1980. 7.1.2 OCS Pipelines: Spill Rates ≥ 1,000 Barrels The OCS pipeline spill rate over the entire record had been relatively unchanged from the previous two revisions of spill rate estimates (Anderson and LaBelle 1994 and 2000). In this study, the OCS pipeline spill rate for spills ≥1,000 bbl declined since it was last calculated (Anderson and LaBelle, 2000), from 1.33 to 0.94 spills per Bbbl produced over the trend period (intervals numbered 18 to 36), and from 1.38 to 0.88 spills per Bbbl produced for the last 15 years of each dataset. 7.1.3 Worldwide Tankers: Spill Rates ≥ 1,000 Barrels The worldwide tanker spills rate for spills ≥1,000 bbl over the entire record continued the dramatic decline identified in the previous analysis (Anderson and LaBelle, 2000). In earlier examinations, the worldwide tanker spill rate had remained constant at 1.30 spills per Bbbl handled (Lanfear and Amstutz ,1983 and Anderson and LaBelle,1990 and 1994). Based on the 1974 through1999 data (Anderson and LaBelle, 2000), the rate dropped to 1.16 spills per Bbbl handled. In this analysis, the worldwide tanker spill rate declined to 0.84 spills per Bbbl over the entire record (1974 through 2008) and declined even further to 0.32 spills per Bbbl handled when examined for the last 15 years (1994 through 2008).

45
6415
6123
29495
37249
95224
13605
20131
2,834
5,385
68,765
31,925
34,932
2,771
5,066
3777
2750
4950
6310
9762
4551
6033
1,417
2,185
5,729
3,100
5,657
1,720
5,066
0 20000 40000 60000 80000 100000 120000
Barges U.S. Crude Oil
Barges U.S. Petroleum
Tankers ANS Crude
Tankers U.S. Waters
Tankers Worldwide
U.S. OCS Pipelines*
U.S. OCS Platforms*
Spill Size (bbl)
Spi
ll S
ourc
e
Median Size Last 15 Years
Median Size Entire Record
Average Size Last 15 Years
Average Size Entire Record
** 2.5 million
** 2.5 million** 7,000
** 395,500
*OCS Platforms and Pipelines: addressed all spills, not trend
***1989-2008 record used for U.S. and ANS Tankers to include at least one spill.
**1964‐2010 Entire Record and 1996‐2010 both include
Macondo spill. Both are annotated separately.
Sources:Table 14
Data Set Entire Record Last 15 Years
OCS Platforms* 1964‐2009 1995‐2009
OCS Pipelines* 1964‐2010 1996‐2010Worldwide Tankers and U.S. Barges 1974-2008 1994-2008
U.S. Tankers 1974-2008 1989-2008***
ANS Tankers 1977-2008 1989-2008***
Figure 13. Comparison of Average and Median Spill Size
by Spill Source for Spills ≥ 1,000 Barrels

46
The declines reflect reductions in both the “In Port” and “At Sea” spill rates that comprise the combined rates. It is likely the worldwide transition to double- hull tanker vessels (or their equivalent) which was mostly completed in 2005 (as mandated both by Oil Pollution Act of 1990, OPA 90) in the U.S. and the 1992 changes to MARPOL 73/78, the International Convention for the Prevention of Pollution by Ships) is a primary reason for the greatly improved worldwide tanker spill rates. (See http://www.ecy.wa.gov/programs/spills/prevention/bap/TAPS%20Trade%20Tanker%20Report.pdf.) 7.1.4 U.S. Tankers: Spill Rates ≥ 1,000 Barrels The spill rate for tankers in U.S. waters also continued to decrease dramatically, from 1.03 (Anderson and LaBelle (2000) to 0.85 spills per Bbbl handled based on the entire 1974 through 2008 record, and declined further to 0.34 spills per Bbbl handled when the last 20 years were examined (1989 through 2008). These rate reductions reflected a decline in both the “In Port” and “At Sea” spill rates that comprise the combined rates. In prior examinations, the rates for tanker spills in U.S. waters were lower than the worldwide tanker spill rates; based on the latest data over the entire record and the last 15-years, the spill rates in U.S. waters are now basically the same (slightly, but not significantly, higher) as the worldwide tanker spill rates. 7.1.5 ANS Tankers: Spill Rates ≥ 1,000 Barrels The updated spill rate for tankers carrying ANS crude oil continued the decline seen in previous studies (Anderson and LaBelle 1994, 2000) based on the entire 1977 through 2008 record from 0.88 to 0.72 spills per Bbbl handled compared to the previous revision (Anderson and LaBelle, 2000). The ANS crude oil tanker rate declined further to 0.46 spills per Bbbl handled when calculated for the last 20 years (1989 through 2008) compared to the previous 15-year rate of 0.92 (15-year period from Anderson and LaBelle 2000:1985 through 1999). There were no tanker spills of ANS crude oil ≥1,000 bbl in the last 15 years (1994 through 2008). 7.1.6 U.S. Barges: Petroleum Spill Rates ≥ 1,000 Barrels The rate for all petroleum spills (including crude oil and petroleum product spills) from barges in U.S. coastal, offshore, and inland waters declined from 4.30 (Anderson and LaBelle, 2000) to 3.37 spills per Bbbl handled based on the entire 1974 through 2008 record. This rate declined further when examining the last 15 years (1994 through 2008) to 1.20 spills per Bbbl handled. 7.1.7 U.S. Barges: Crude Oil Spill Rates ≥ 1,000 Barrels The rate for crude oil spills from barges in U.S. coastal, offshore, and inland waters declined from 3.55 (Anderson and LaBelle, 2000) to 3.09 spills per Bbbl handled based on the entire 1974 through 2008 record in this report. This rate declined more dramatically in the last 15 years (1994 through 2008) to 0.62 spills per Bbbl handled. This spill rate for crude oil spills from barges continues to be significantly lower than the rates for “All Petroleum” spills from barges.
47
7.2 Spill Rates ≥ 10,000 Barrels This section addresses historic and current spill rates by spill sources for spills ≥ 1,000 barrels. Figure 14 shows these rates. 7.2.1 OCS Platforms: Spill Rates ≥ 10,000 Barrels Spill rates for OCS platform spills ≥10,000 bbl declined from 0.12 (Anderson and LaBelle, 2000) to 0.06 over the trend period, January 1973 through 2010 (intervals numbered 3 to 18, Fig. 6). This a continuation of declining rates identified in previous revisions (Lanfear and Amstutz (1983), and Anderson and LaBelle (1990, 1994, 2000)). The rate for the most recent 15 years of data increased to 0.13 (1996 through 2010) as compared to 0.05 (Anderson and LaBelle, 2000, 1985 through 1999). This increase was due to the Macondo well spill in 2010. Prior to this incident, the last OCS platform spill ≥10,000 bbl was in 1970. 7.2.2 OCS Pipelines: Spill Rates ≥ 10,000 Barrels Spill rates for OCS pipeline spills ≥10,000 bbl declined from 0.33 to 0.19 spills per Bbbl handled for the trend period, December 1992 through 2010 (intervals numbered 18 to 36, Fig. 7) and from 0.34 to 0.18 spills per Bbbl handled for the last 15 years (compared to Anderson and LaBelle, 2000). This is a continuation of a decline identified in the previous two revisions (Anderson and LaBelle, 1994, 2000). The last OCS pipeline spill ≥10,000 bbl occurred in 1990. 7.2.3 Worldwide Tankers: Spill Rates ≥ 10,000 Barrels The worldwide tanker spill rate declined from 0.59 to 0.42 spills per Bbbl handled over the entire 1974 through 2008 record when compared to the previous study (Anderson and LaBelle, 2000). The rate drops even further to 0.11 spills per Bbbl handled when examined over the last 15 years (1994 through 2008). 7.2.4 U.S. Tankers: Spill Rates ≥ 10,000 Barrels The spill rate for tankers in U.S. waters dropped from 0.43 to 0.32 spills per Bbbl handled for the entire 1974 through 2009 record when compared to the previous study (Anderson and LaBelle, 2000), and even further to 0.11 spills per Bbbl handled in the last 20 years (1989 through 2008). The 0.32 spills per Bbbl rate over the entire record continues to be lower than the rate for tanker spills worldwide. The 0.11 spills per Bbbl for tanker spills in U.S. waters over the last 20 years matches the rate over the last 15 years for worldwide tanker spills. There were no tanker spills at sea in U.S. waters ≥10,000 bbl in the last 15 years; the most recent tanker spill in U.S waters was the 12,800 bbl Westchester spill in 2000 which was an in-port spill.

48
19344
21682
97062
92391
187028
52618
52467
23857
261900
96328
95517
18238
17857
15000
22905
56940
17705
59000
18785
261900
55306
43380
0 50000 100000 150000 200000 250000 300000
Barges U.S. Crude Oil
Barges U.S. Petroleum
Tankers ANS Crude
Tankers U.S. Waters
Tankers Worldwide
U.S. OCS Pipelines *
U.S. OCS Platforms *
Spill Size (bbl)
Spi
ll S
ourc
e
Median Size Last 15 Years
Median Size Entire Record
Average Size Last 15 Years
Average Size Entire Record
** 65,000
** 1.0 million
Data Set Entire Record Last 15 Years
OCS Platforms * 1964-2009 1995-2009
OCS Pipelines *1964-2010 1996-2010
Worldwide Tankers and U.S. Barges 1974-2008 1994-2008
U.S. Tankers 1974-2008 1989-2008***
ANS Tankers 1977-2008 1989-2008***
Source:Table 15
*OCS Platforms & Pipelines addressed all spills, not trend
** Entire Record (1964-2010) annotated separately.
***1989-2008 record used for U.S. amd ANS Tankers to include at least one spill.
Note:Last 15 Years (1996-2010) average & median not shown because (1) only 1 platform spill ≥ 10,000 bbl (Macondo); most recent platform spill ≥10,000 bbl prior to 2010 was 53,000 bbl in 1970. (2) No pipeline spills ≥ 10,000 bbl; most recent OCS Pipeline Spill ≥10,000 was 14,423 bbl in 1990.
Figure 14. Comparison of Average and Median Spill Size
by Spill Source for Spills ≥ 10,000 Barrels
49
7.2.5 ANS Tankers: Spill Rates ≥ 10,000 Barrels The spill rate for tankers carrying ANS crude oil dropped from 0.23 (Anderson and LaBelle, 2000) to 0.20 spills per Bbbl handled for the entire 1977 through 2008 record. The spill rate decreased further to 0.12 spills per Bbbl handled when examined for the last 20 years (1989 through 2008). There were no Tanker spills of ANS crude oil ≥10,000 bbl in the last 15 years; the most recent was the 262,000 bbl Exxon Valdez spill in 1989. 7.2.6 U.S. Barges: Petroleum Spill Rates ≥ 10,000 Barrels The rate for “All Petroleum” spills (including crude oil and petroleum product spills) from barges in U.S. coastal, offshore, and inland waters declined from 0.81 (Anderson and LaBelle 2000) to 0.56 spills per Bbbl handled based on the entire 1974 through 2008 record. This rate declined further when examined for the last 15 years (1994 through 2008) to 0.16 spills per Bbbl handled. 7.2.7 6 U.S. Barges: Crude Oil Spill Rates ≥ 10,000 Barrels The rate for crude oil spills from barges in U.S. coastal, offshore, and inland waters declined from 0.68 (Anderson and LaBelle, 2000) to 0.55 spills per Bbbl handled based on the entire 1974 through 2008 record. This rate declined more dramatically in the last 15 years (1994 through 2008) to 0.12 spills per Bbbl which was calculated from the 15-year rate for spills ≥1,000 bbl since no crude oil spills from barges ≥10,000 were observed from1994 through 2008 (Table 13). The last crude oil spill ≥ 10,000 bbl from barges in U.S. coastal waters was in 1984. 8.0 ACKNOWLEDGEMENTS Special thanks to Paul Nelson for assistance in preparation of the tables and figures, to Connie Murphy for preparation of the final manuscript, and to our technical reviewers: Darice Breeding, David Diamond, Rebecca Green, Walter Johnson, Margaret Metcalf, David Moore, Craig Ogawa, David Panzer, Dick Prentki, Sarah Peters, Caryn Smith, Geoff Wikel, and Susan Zalenski. We also wish to acknowledge the extraordinary contributions of Cheryl Anderson, whose service went above and beyond the call of duty.
50
9.0 REFERENCES Anderson, C.M. and LaBelle, R.P. 1990. Estimated occurrence rates for analysis of
accidental oil spills on the U.S. Outer Continental Shelf. Oil & Chem. Pollut. 6, 21-35. http://www.boemre.gov/eppd/sciences/osmp/pdfs/AndersonAndLaBelle/AndersonAndLaBelle1990.pdf
Anderson, C.M. and LaBelle, R.P. 1994. Comparative Occurrence Rates for
Offshore Oil Spills. Spill Science & Technology Bulletin, Vol.1 No. 2, 131-141. http://www.boemre.gov/eppd/sciences/osmp/pdfs/AndersonAndLaBelle/Anderson_LaBelle1944.pdf
Anderson, C.M. and LaBelle, R.P. 2000. Update of Comparative Occurrence Rates for Offshore Oil Spills. Spill Science & Technology Bulletin, Vol.6 No. 5/6, 303-321.
http://www.boemre.gov/eppd/sciences/osmp/pdfs/AndersonAndLaBelle/AndersonAndLaBelle2000.pdf
Bercha, F.G. 2006. Alternative Oil Spill Occurrence Estimators and Their Variability for
the Chukchi Sea - Fault Tree Method. Anchorage, AK: Prepared by Bercha Group, Calgary, Alberta, for MMS Alaska OCS Region; 2006; MMS OCS Study 2006-033.
http://www.alaska.boemre.gov/reports/2006rpts/2006_033_vol1.pdf Bercha, F.G. 2008. Final Task 4.A.1 Report Alternative Oil Spill Occurrence Estimators
and Their Variability for the Beaufort Sea – Fault Tree Method. Anchorage, AK: Prepared by Bercha International, Inc., for USDOI, MMS, Alaska OCS Region; 2008; MMS OCS Report 2008-035. V1 135 pp, v2 185 pp.
http://www.alaska.boemre.gov/reports/2008rpts/2008_035.pdf Bercha, F.G. 2011. Alternative Oil Spill Occurrence Estimators for the Beaufort and
Chukchi Sea – Fault Tree Method, BOEMRE OCS Report 2011-030. Anchorage, AK: Prepared by Bercha International, Inc. for USDOI, BOEMRE, Alaska OCS Region http://www.alaska.boemre.gov/reports/2011rpts/2011_030.pdf
Bradley, J.V. 1968. Distribution-Free Statistical Tests, Prentice-Hall, Inc. (388 pp.) British Petroleum Company. 1975-2009. BP [1999-2000 BP Amoco] Statistical Review of
World Energy (annual reports). The British Petroleum Company, Group Media & Publications, London. http://www.bp.com/liveassets/bp_internet/globalbp/globalbp_uk_english/reports_and_publications/statistical_energy_review_2008/STAGING/local_assets/2009_downloads/statistical_review_of_world_energy_full_report_2009.pdf

51
BSEE. 2009. Petroleum Spills from Federal Outer Continental Shelf Oil and Gas Facilities Caused by Major Hurricanes, 2002 to 2008, Lili (2002), Ivan (2004), Katrina (2005), Rita (2005), Gustav (2008) and Ike (2008). http://www.boemre.gov/incidents/PDFs/Hurricanes2002to2008.pdf
Eschenbach, T. G. and Harper, W. V. 2006. Estimators for the Beaufort/Chukchi Sea
OCS (Statistical Approach). Anchorage, AK: USDOI, MMS, Alaska OCS Region; 2006; OCS Study MMS 2006-059.
Ji, Z.-G., W. Johnson, and Z. Li. 2011. Oil Spill Risk Analysis Model and Its Application
to the Deepwater Horizon Oil Spill Using Historical Current and Wind Data, in Monitoring and Modeling the Deepwater Horizon Oil Spill: A Record-Breaking Enterprise, Geophys. Monogr. Ser., doi:10.1029/2011GM001117, pp. 227-236.
International Maritime Organization (IMO) website. June 2011. Tanker Safety Preventing
Accidental Pollution, http://www.imo.org/OurWork/Safety/Regulations/Pages/OilTankers.aspx
LaBelle, R.P. and Anderson, C.M. 1985. The Application of Oceanography to
Oil-Spill Modeling for the Outer Continental Shelf Oil and Gas Leasing Program, Marine Technology Society Journal, Vol. 19, No. 2, 19-26. http://www.boemre.gov/eppd/sciences/osmp/pdfs/AndersonLabelle1985.pdf
Lanfear, K.J. and Amstutz, D.E. 1983. A Reexamination of Occurrence
Rates for Accidental Oil Spills on the U.S. Outer Continental Shelf, 1983 Oil Spill Conference, American Petroleum Institute, Washington, DC http://www.boemre.gov/eppd/sciences/osmp/pdfs/LanfearAndAmstutz1983.pdf
Nakassis, Anastase. 1982. Has Offshore Oil Production Become Safer?, U.S. Geological
Survey Open-File Report 82-232. http://www.boemre.gov/eppd/sciences/osmp/pdfs/Nakassis1982.pdf
Ross, S.M. 1985. Introduction to Probability Models. Academic Press,
Orlando, FL. Smith, R.A., Slack, J.R., Wyant, T. and Lanfear, K. J. 1982. The Oil Spill
Risk Analysis Model of the U.S. Geological Survey. USGS Professional Paper 1227, U.S. Geological Survey, Reston, VA. http://www.boemre.gov/eppd/PDF/smithetal.pdf
Stewart, R.J. 1975. Oil Spillage Associated with the Development of
Offshore Petroleum Resources. Report to Organization for Economic Co-operation and Development. Martingale, Inc., Cambridge, MA. http://www.boemre.gov/eppd/sciences/osmp/pdfs/Stewart1975/Stewart1975-pg1-23.pdf

52
http://www.boemre.gov/eppd/sciences/osmp/pdfs/Stewart1975/Stewart1975-pg24-49.pdf
Stewart, R.J. 1976. A Survey and Critical Review of U.S. Oil Spill Data
Resources with Application to the Tanker/Pipeline Controversy. Report to Office of Policy Analysis, U.S. Department of the Interior, Washington, DC. Martingale, Inc., Cambridge, MA. http://www.boemre.gov/eppd/sciences/osmp/pdfs/StewartKennedy1976/Stewart1976-Title-19.pdf http://www.boemre.gov/eppd/sciences/osmp/pdfs/StewartKennedy1976/Stewart1976-pg20-43.pdf http://www.boemre.gov/eppd/sciences/osmp/pdfs/StewartKennedy1976/Stewart1976-pg44-61.pdf http://www.boemre.gov/eppd/sciences/osmp/pdfs/StewartKennedy1976/Stewart1976-pg62-74.pdf
U.S. Army, Corps of Engineers (COE). 2000. Waterborne Commerce of the United
States (for calendar years 1974 through 2009). U.S. Department of the Army Corps of Engineers, Waterborne Commerce Statistics Center, New Orleans, LA. (www.wrsc.usace.army.mil/ndc/wscompqr.htm)
U.S. Department of Commerce (DOC). 2000. Annual Summaries of
Alaskan North Slope Crude Oil Loadings (1977-1998). U.S. Department of Commerce, Maritime Administration, Office of Policy and Plans, Washington, DC.
References related to the BOEM Oil Spill Modeling Program can be found on these two pages: http://www.boem.gov/Environmental-Stewardship/Environmental-Assessment/Oil-Spill-Modeling/Oil-Spill.aspx. http://www.boem.gov/Environmental-Stewardship/Environmental-Assessment/Oil-Spill-Modeling/Oil-Spill-Modeling-Program Some other early spill rate-related references can be found at: http://www.boemre.gov/eppd/sciences/osmp/spillraterefs.htm

53
APPENDIX A. TREND ANALYSIS FOR OIL SPILL OCCURRENCE RATES
This appendix describes historic and recent tests on the oil spill occurrence frequency on the OCS from pipelines and platforms as related to volume of production. These analyses were conducted to identify trends that may occur. A. 1 Spill Rates Trend Analyses All references to spills in this discussion refers to petroleum spills ≥ 1,000 bbl resulting from OCS offshore oil and gas activities beginning in 1964 (through 2010 in this report). Historically, most of the spills of this size have been crude oil or condensate (a liquid product of natural gas production) but the few diesel spills ≥ 1,000 bbl are also included because they are associated with oil and gas activities from platforms. BOEM and BSEE use spill rates based on historic spills from OCS offshore oil and gas activities to estimate future oil spill occurrences. These rates are expressed in terms of number of spills per Bbbl “handled”, which means produced by OCS platforms or OCS pipelines, or transported by barges or tankers. From1964 through 2010, there have been 18.1 Bbbl of crude oil and condensate produced and this is associated with 13 platform spills (platform spills include spills related to operations at both drilling rigs and production platforms) and 20 pipeline spills. Spill rates calculated over this entire record are: (13 spills / 18.1 Bbbl) or 0.72 spills per Bbbl for platforms; and (20 spills /18.1 Bbbl) or 1.10 spills per Bbbl for pipelines. If the spill occurrence record were to improve over time, it would be reflected in a lower spill rate, i.e. fewer spills per Bbbl handled when some portion of the oldest record is excluded from the calculation. In fact, when the rates were calculated for the most recent 15 years of data (1996 through 2010) the spill rates are 0.25 spills per Bbbl for platforms and 0.88 spills per Bbbl for pipelines because there were 2 platform spills and 7 pipeline spills during the production of over 8.0 Bbbl (See Table 9). So (2/8 = 0.25, which is 0.25 spills per Bbbl for the platforms and 7/8 = 0.875, which rounds to 0.88 spills per Bbbl for pipelines). This is a dramatic reduction in both platform and pipeline spill rates when considering that the most recent 15 years captures 44% of the program’s production experience and 27 % of the spills, and suggests an observed decline (improvement trend) in spill rates over time. To support the existence of a trend, the analyses below specifically focuses on the volume of production between spills, (hereafter referred to as VPBS). The VPBS is expressed in millions of bbl (MMbbl). If the VPBS increases for every spill, i.e. 50 MMbbl produced between the first and second spill, 60 MMbbl produced between the second and third spill, 70 MMbbl between third and fourth spill, and so on, then the VPBS would be a strictly monotonic data series and would clearly represent an improvement trend. If the VPBS isn’t strictly monotonic, but increases between spills

54
most of the time, it still probably reveals an improvement trend. Testing is done on the VPBS data to determine whether there is an improvement trend, or whether the variation in VPBS is just random. The hypothesis that there had been gradual improvement in the offshore oil production safety using data on OCS platform spills ≥ 1,000 bbl from1964 through1979 was supported in Nakassis (1982). Statistical tests were used to demonstrate there was a general tendency (not strictly monotonic) for the VPBS to increase between spills over time, and to reject the hypothesis that the tendency was a random phenomenon. Nakassis’s report documents the extensive statistical analysis. http://www.boemre.gov/eppd/sciences/osmp/pdfs/Nakassis1982.pdf. Anderson and LaBelle, 1990, repeated several of Nakassis’ tests using OCS platform and pipeline data for spills ≥ 1,000 bbl that occurred from1964 through 1987. Improving trends were identified in both the OCS platform and pipeline spill rates. Specific starting points in the spill data were selected to represent the beginning of the platform spill and pipeline spill trends (these designated starting points were somewhat subjective). (The platform trend starting point parses between two January1973 spills.) http://www.boemre.gov/eppd/sciences/osmp/pdfs/AndersonAndLaBelle/AndersonAndLaBelle1990.pdf Anderson and LaBelle (1994 and 2000) reaffirmed the trend in the platform spill record as the OCS data set was expanded to spills of ≥1,000 bbl that occurred from1964 through 1992 and 1964 through 1999 respectively. For pipeline spills ≥1,000 bbl, however, neither Anderson and LaBelle, (1994) nor Anderson and LaBelle (2000) could reaffirm the trend identified in the OCS spill rate previously identified in Anderson and LaBelle, 1990http://www.boemre.gov/eppd/sciences/osmp/pdfs/AndersonAndLaBelle/Anderson_LaBelle1944.pdf http://www.boemre.gov/eppd/sciences/osmp/pdfs/AndersonAndLaBelle/AndersonAndLaBelle2000.pdf For this report, a sensitivity analysis was again conducted to determine an appropriate starting point for a trend, if the existence of a trend was apparent. An appropriate starting point for the trend was selected by identifying the point in the data where major increases or decreases in the spill rate were no longer apparent. Data were examined for platform spills and pipeline spills ≥1,000 bbl that occurred from 1964 through 2010. Table A-1 contains data for OCS platform spills ≥ 1,000 bbls, listing the date of each spill along with the volume of production between spills (VBPS). Adjacent columns summarize the cumulative number of spills, cumulative production volume, the percentage of spills, and the percent production volume that had occurred from each spill forward through 2010 as the earlier (older) spill records are excluded. Beginning with the 2/10/1970 platform spill (excluding the previous five platform spills and the production from the1960’s) and incorporating all subsequent spills through 2010, will include 94% of the production record (17.1 of 18.1 Bbbl) and 62% (8 of 13) of the platform spills.

55
Table A‐1. Cumulative Percent of OCS Platform Spills and Production
Volume as Older Spills are Sequentially Eliminated
Number
of Spills
% of Spills
Included
Million bbl
Production
% Production
Included
1 4/8/1964 29.874 13 100.00% 18,127.232 100.00%
2 10/3/1964 54.261 12 92.31% 18,097.358 99.84%
3 7/19/1965 101.634 11 84.62% 18,043.097 99.54%
4 1/28/1969 725.577 10 76.92% 17,941.462 98.98%
5 3/16/1969 38.911 9 69.23% 17,215.885 94.97%
6 2/10/1970 279.875 8 61.54% 17,176.974 94.76%
7 12/1/1970 285.281 7 53.85% 16,897.099 93.21%
8 1/9/1973 841.380 6 46.15% 16,611.819 91.64%
9 1/26/1973 17.922 5 38.46% 15,770.438 87.00%
10 11/23/1979 2,235.420 4 30.77% 15,752.517 86.90%
11 11/14/1980 274.150 3 23.08% 13,517.097 74.57%
12 9/24/2005 10,481.314 2 15.38% 13,242.947 73.06%
13 4/20/2010 2,350.862 1 7.69% 2,761.633 15.23%Balance3
410.771 0 0.00% 410.771 2.27%
Total Production4 18,127.232
2 Volume of Production Between Spills, in Mbbl (millions of barrels); a barrel is 42 U.S. gal.3 Balance=the amount of production between the last spill and the end of the study period.4 Total production= Total OCS production through the end of the study period; 2010 OCS
production data was used, and was updated as of May 2011 using ONRR data.Source: U.S. DOI/BOEMRE OCS Oil Spill Database, May 2011; U.S. DOI/ONRR OCS
Production Data, May 2011). (http://www.boemre.gov/stats/OCSProduction.htm).
Spill1 #Platform Spill
Dates VPBS2
Cumulative Numbers
1 Includes all OCS platform spills ≥ 1,000 barrels
In Anderson and LaBelle (1990) the platform record from the 1/26/1973 spill forward was selected (somewhat subjectively) to represent the beginning of the platform spill trend as indicated by statistical tests. Anderson and LaBelle (1994 and 2000) also used the 1/26/1973 spill to represent the beginning of the platform spill trend. Using the OCS platform spill data through 2010, Table A-1 shows that the platform spill record from 1/26/1973 forward captures 87% of the production record and includes 38.5% (5 of 13) of the platform spills. The same analysis was conducted for OCS pipeline spills ≥1,000 bbl. Table A-2 displays similar data for OCS pipeline spills, but no trend in the cumulative pipeline spill data is particularly apparent. As the oldest pipeline spills are dropped, the cumulative percentage of pipeline spills included continues to be roughly similar to the percentage of the production record included.

56
Table A‐2. Cumulative Percent OCS Pipeline Spills and Production Volume as Older Pipeline Spills are Sequentially Eliminated
Number
of Spills
% of Spills
Included
Million bbl
Production
% Production
Included
1 10/15/1967 588.040 20 100.000% 18,127.232 100.00%
2 3/12/1968 93.986 19 95.000% 17,539.192 96.76%
3 2/11/1969 240.911 18 90.000% 17,445.206 96.24%
4 5/12/1973 1,563.527 17 85.000% 17,204.295 94.91%
5 4/17/1974 349.682 16 80.000% 15,640.769 86.28%
6 9/11/1974 142.942 15 75.000% 15,291.087 84.35%
7 12/18/1976 736.530 14 70.000% 15,148.145 83.57%
8 12/11/1981 1,471.440 13 65.000% 14,411.615 79.50%
9 2/7/1988 2,223.490 12 60.000% 12,940.175 71.39%
10 1/24/1990 641.797 11 55.000% 10,716.685 59.12%
11 5/6/1990 105.079 10 50.000% 10,074.888 55.58%
12 8/31/1992 737.025 9 45.000% 9,969.809 55.00%
13 11/16/1994 801.686 8 40.000% 9,232.784 50.93%
14 1/26/1998 1,397.560 7 35.000% 8,431.099 46.51%
15 9/29/1998 365.602 6 30.000% 7,033.539 38.80%
16 7/23/1999 388.749 5 25.000% 6,667.937 36.78%
17 1/21/2000 267.907 4 20.000% 6,279.189 34.64%
18 9/15/2004 2,719.374 3 15.000% 6,011.282 33.16%
19 9/13/2008 1,975.691 2 10.000% 3,291.909 18.16%
20 7/25/2009 469.485 1 5.000% 1,316.218 7.26%Balance3
846.733 0 0.000% 846.733 4.67%
Total Production4 18,127.232
2 Volume of Production Between Spills, in MMbbl (millions of barrels); a barrel is 42 U.S. gal.3 Balance=the amount of production between the last spill and the end of the study period.
Source: U.S. DOI/BOEMRE OCS Oil Spill Database, May 2011; U.S. DOI/ONRR OCS
Production Data, May 2011). (http://www.boemre.gov/stats/OCSProduction.htm).
Spill1 #Pipeline Spill
Dates VPBS 2
Cumulative Numbers
1 Includes all OCS pipeline spills ≥ 1,000 barrels
4 Total production= Total OCS production through the end of the study period; 2010 OCS
production data was used, and was updated as of May 2011 using ONRR data.
A.2 Statistical Tests This section describes the statistical tests conducted in this study on the entire record (1964 through 2010) for both OCS platform and pipeline spills ≥ 1,000 bbl. The 1964 through 2010 platform and pipeline data was subjected to three of the nonparametric statistical tests presented in Nakassis, 1982. All three tests involve a measure of the volume of production between spills (VPBS). These tests attempt to

57
discern whether the VPBS is generally increasing over time, which would indicate an improvement trend, or whether the VPBS sequences are relatively random. The tests are: Kendall’s Test for Correlation Hotelling and Pabst’s Test for Rank-Order Correlation Runs Up, Runs Down Test for Randomness
The OCS production data utilized for these tests was production data through 2010, as updated in the production database as of May 2011. A.2.1 Statistical Treatment of Variations in Data Sets Two earlier spill rate papers identified trends in the data for OCS Platform spills ≥1,000 bbl. Nakassis (1982) either treated the two 1973 spills that occurred 17 days apart as one spill, or possibly the second 1973 spill was not yet identified as a spill ≥1,000 bbl when Nakassis did his analysis. Anderson and LaBelle (1990) used the two 1973 spills in their analysis, and a slightly different dataset for OCS production. This data was arrayed in their Figure 3, comparing cumulative production and cumulative spills over time, which is similar to the concept in Table A-1 (a, b, and c) of this paper. However, their Figure 3 dropped oldest intervals of 0.5 Bbbl of production, rather than dropping the oldest spills in each step. In this case, the first 1973 spill happened to fall into a separate 0.5 Bbbl production interval than the second 1973 spill. This allowed them to select from the second 1973 spill forward, which represented 67% of the production record and only 27% of the spill record. In Section 3.1.1 of Anderson and LaBelle (1990), it implies that Kendall’s Test for Correlation supported the statement “the volume of oil handled between spills appeared to be nonrandom and to increase over time” indicated that the one brief spill interval between the two 1973 spills did not invalidate the likelihood that overall a positive non-random trend was present. One could argue that the two January 1973 spills should be treated as one event. We do this for the three October 1964 spills that occurred during Hurricane Hilda and for the three September 2005 spills that occurred during Hurricane Rita. Since we are analyzing production volume between spills to test the distribution of spill occurrence, and both the October 1964 and September 2005 spills are clusters of three hurricane-related spills which had no production between the spill occurrences, this is reasonable. The two January 1973 spills occurred 17 days apart, and were very close in terms of the volume of production between spills. The two platform spills from 1973 were analyzed as a single spill event and as two separate spills in this report.

58
Figure A-1. Kendall's Test for Correlation for OCS Platform Spills ≥1,000 Barrels
Figure A‐1(a) Kendall’s Test using Data from Nakassis (1982) Spills of ≥ 1,000 bbl2 from OCS Platforms
Spill # 1 2 3 4 5 6 7 8 9
Spill Date Spill # VPBS131.3 55.9 103.1 712.9 43.5 270.5 272.5 804.9 2,054.3
4/8/1964 1 31.3
10/3/1964 2 55.9 T
7/19/1965 3 103.1 T T
1/28/1969 4 712.9 T T T
3/16/1969 5 43.5 T I I I
2/10/1970 6 270.5 T T T I T
12/1/1970 7 272.5 T T T I T T
1/9/1973 8 804.9 T T T T T T T
11/23/1979 9 2,054.3 T T T T T T T TTotal Production 4,348.9
T 8 6 5 2 4 3 2 1
I 0 1 1 3 0 0 0 0
Prob (S ≥ 26 | n = 9) ≤ 0.5% (Bradley, 1968, Table XI)NOTES: Nakassis' paper had T=33, I = 3, S=30; his counts are in error
1 VPBS= Volume of oil proudced between spills, in millions of barrels (MMbbl)2 bbl = barrels; 1 barrel= 42 U.S. gallonsT = smaller before larger, I = larger before smallerSource: Data from Table II of Nakassis (1982)ANALYSIS: 9 observations, T = 31, I = 5, no ties. S = T - I = 26
Prob of 0.5% cited by Nakassis is for S=26 rather than S=30 A.2.2 Kendall’s Test for Correlation for OCS Platform Spills In Kendall’s Test for Correlation, the VPBS is compared between spills in pairs; each spill is compared to every other spill. A pairing is marked “T” if the earlier spill’s VPBS is smaller than the latter spill’s, or marked “I” if the earlier spill’s VPBS is larger than the latter spills. Ties are noted but thrown out. The Kendall statistic, S = T – I is calculated and then S is looked up in Table XI, of Bradley (1968). If S is high because T is high compared to I, it indicates an improving record because it generally means the most recent incidents have more production between spills. Figure A-1 presents three separate iterations of applying Kendall’s Test for Correlation to OCS platform spill data ≥ 1,000 bbl:
1. Reproduction of the Kendall’s Test from Nakassis (1982) with 9 platform spill observations from1964 through1979 that included one January 1973 spill
2. Results of the Kendall’s Test with 12 platform spill observations from1964 through 2010 that treated the two January 1973 spills as a single spill event.
3. Results of the Kendall’s Test with 13 platform spill observations from 1964 through 2010 that included two separate January 1973 spills
Conclusions on Kendall’s Test for Correlation, as Related to Platform Spill Data
1. Nakassis’s results indicate the relatively high S value of 26 with 9 observations (based on a net calculation from 31 spill pairs with the earlier spill having a lower

59
Figure A-1. Kendall's Test for Correlation for OCS Platform Spills (continued)
Figure A‐1(b) Kendall’s Test including One January 1973 Spill and OCS Production Data as of May 2011
Spills of ≥ 1,000 bbl2 from OCS PlatformsSpill Spill # 1 2 3 4 5 6 7 8 9 10 11 12
Date Spill # VPBS129.9 54.3 101.6 725.6 38.9 279.9 285.3 859.3 2,235.4 274.2 10,481.3 2,350.9
4/8/1964 1 29.9
10/3/1964 2 54.3 T
7/19/1965 3 101.6 T T
1/28/1969 4 725.6 T T T
3/16/1969 5 38.9 T I I I
2/10/1970 6 279.9 T T T I T
12/1/1970 7 285.3 T T T I T T
1/9/1973 8 859.3 T T T T T T T
11/23/1979 9 2,235.4 T T T T T T T T
11/14/1980 10 274.2 T T T T T I I I I
9/24/2005 11 10,481.3 T T T T T T T T T T
4/20/2010 12 2,350.9 T T T T T T T T T T IBalance3
410.7Total Production4
18,127.3
T 11 9 8 5 7 5 4 3 2 2 0
I 0 1 1 3 0 1 1 1 1 0 11 VPBS= Volume of oil proudced between spills, expressed in millions of barrels (MMbbl)2 bbl = barrels; 1 barrel= 42 U.S. gallons3 Balance= balance of production since the last spill
12 observations, T = 56, I = 10, no ties. S = T - I = 46Prob (S ≥ 46 | n = 12) < Prob (S ≥ 38 | 13) ≤ 0.5% (Bradley, 1968, Table XI)
4 Total Production includes 2010 production data, updated as of May 2011 from ONRR data.T = smaller before larger, I = larger before smallerNOTE: Includes one January 1973 spill.

60
Figure A-1. Kendall's Test for Correlation for OCS Platform Spills (continued)
Figure A‐1(c) Kendall’s Test for OCS Platform Spills including Both January 1973 Spills and OCS Production Data as of May 2011
Spills of ≥ 1,000 bbl2 from OCS PlatformsSpill # 1 2 3 4 5 6 7 8 9 10 11 12 13
Spill Date Spill # VPBS129.9 54.3 101.6 725.6 38.9 279.9 285.3 841.4 17.9 2,235.4 274.2 10,481.3 2,350.9
4/8/1964 1 29.9
10/3/1964 2 54.3 T
7/19/1965 3 101.6 T T
1/28/1969 4 725.6 T T T
3/16/1969 5 38.9 T I I I
2/10/1970 6 279.9 T T T I T
12/1/1970 7 285.3 T T T I T T
1/9/1973 8 841.4 T T T T T T T
1/26/1973 9 17.9 I I I I I I I I
11/23/1979 10 2,235.4 T T T T T T T T T
11/14/1980 11 274.2 T T T I T I I I T I
9/24/2005 12 10,481.3 T T T T T T T T T T T
4/20/2010 13 2,350.9 T T T T T T T T T T T IBalance3
410.7Total Production4
18,127.3
T 11 9 8 4 7 5 4 3 4 2 2 0
I 1 2 2 5 1 2 2 2 0 1 0 1
NOTE: Includes both January 1973 spills. 13 observations, T = 59, I = 19, no ties S = T - I = 40Prob (S ≥ 59 | n = 13) < Prob (S ≥ 44 | 13) < 1% (Bradley, 1968, Table XI)
1 VPBS= Volume of oil proudced between spills, expressed in millions of barrels (MMbbl)2 bbl = barrels; 1 barrel= 42 U.S. gallons3 Balance= balance of production since the last spill4 Total Production includes 2010 production data, updated as of May 2011 from ONRR data.T = smaller before larger, I = larger before smaller

61
VPBS and 5 spill pairs with the earlier spill having a higher VPBS) was unlikely to be a random result (probability ≤0.5%).
2. Extending the platform data through to 2010 and treating the two January 1973 spills as a single event indicate the relatively high S value of 46 with 12 observations (based on a net calculation from 56 spill pairs with the earlier spill having a lower VPBS and 10 spill pairs with the earlier spill having a higher VPBS) is unlikely to be a random result (probability ≤ 0.5%), so it could be considered a trend.
3. Extending the platform data through to 2010 with two separate January 1973 spills indicate the relatively high S value of 40 with 13 observations (based on a net calculation from 59 spill pairs with the earlier spill having a lower VPBS and 19 spill pairs with the earlier spill having a higher VPBS) is unlikely to be a random result (probability of < 1%), so it could be considered a trend (Fig. A-1(c).
A.2.3 Runs Up, Runs Down Test for OCS Platform Spills In the Runs Up, Runs Down Test for randomness, the VPBS between each spill and the previous spill are compared and marked “+” if the more recent spill has a higher VPBS than the previous spill and marked “- “ if the VPBS is less than the previous spills. The resulting sequence is examined for the number of runs where runs are discrete sequences of pluses or minuses. For example, “+ + - + + + + - -” is based on 10 observations, has 4 runs, and the longest run is 4. The probability of the number of sequences (or fewer) not being random is looked up in Table X, of Bradley (1968). More pluses in the sequence may indicate an improvement trend, especially if they occur in the latter part of the sequence because the plus indicates more production between spills than observed for the previous spill. Table A-3 presents three separate iterations of applying the Runs Up, Runs Down Test on platform spill data:
1. Reproduction of the Runs Up, Runs Down Test from Nakassis, 1982, with 9 platform spill observations from1964 through1979 that included one January 1973 spill
2. Results of the Runs Up, Runs Down Test with 12 platform spill observations from1964 through 2010 that includes the two January 1973 spills as a single event
3. Results of the Runs Up, Runs Down Test with 13 platform spill observations from 1964 through 2010 with two separate January 1973 spills
Conclusions on the Runs Up, Runs Down Test, as Related to OCS Platform Spill Data:
1. Nakassis’s results indicate having 3 runs with 9 observations was unlikely to be a
random result (probability of 2.57%). 2. Extending the platform data through to 2010 and treating the two January 1973
spills as a single spill event generated 6 runs with 12 observations; the test results

62
Table A‐3. Runs Up, Runs Down Test for OCS Platform Spills ≥ 1,000 Barrels
1 1 4/8/1964 29.874 1 1 2
2 2 10/3/1964 54.261 3 3 4
3 3 7/19/1965 101.634 4 4 5
4 4 1/28/1969 725.577 7 8 9
5 5 3/16/1969 38.911 2 2 3
6 6 2/10/1970 279.875 5 6 7
7 7 12/1/1970 285.281 6 7 8
X 8 1/9/1973 841.380 ‐ X X 10
8 9 1/26/1973 17.922 859.302 8 9 1
9 10 11/23/1979 2,235.420 9 10 11
10 11 11/14/1980 274.150 5 6
11 12 9/24/2005 10,481.314 12 13
12 13 4/20/2010 2,350.862 11 12
Balance4 410.771
Total Production5 18,127.2321Nakassis (1982) included only one spill from January 1973. His spill record ended in 1979.
4Balance=the amount of production between the last spill and the end of the study period.
9 observations, 3 runs, longest run 4.
12 observations, 6 runs, longest run 4
13 observations, 8 runs, longest run 3
Spill Date
VPBS2
(MMbbl3)
Two 1973
Spills
One Spill
VPBS2
Rank,
Nakassis
(1982)
VPBS2
Rank in
this
Report,
One 1973
Spill
VPBS2
Rank in
this
Report,
Two 1973
Spills
2VPBS volume of oil produced between spills, in millions of bbl (MMbbl) 3MMbbl= million barrels. A barrel is 42 U.S. gallons
NOTE: Anderson and Labelle (1990) included one spill from January 1973.
Analysis of Nakassis (1982):
Spill
Number
(by Date)
Including
One 1973
Spill1
Spill
Number
(by Date)
Including
Two 1973
Spills
Source: U.S. DOI/BOEMRE OCS Oil Spill Database, May 2011; U.S. DOI/ONRR OCS
Production Data, May 2011). (http://www.boemre.gov/stats/OCSProduction.htm).
5Total production= Total OCS production through the end of the study period; 2010 OCS
production data was used, and was updated as of May 2011, using ONRR data.
Analysis Including Two January 1973 Spills
Prob (8 runs or fewer | 13) = 54.13% (Bradley, 1968, Table X)
+ + + ‐ + + + +
+ + + ‐ + + + + ‐ + ‐
+ + + ‐ + + + ‐ + ‐ + ‐
Prob (3 runs or fewer| 9) = 2.57% (Bradley, 1968, Table X)
Analysis Including One January 1973 Spill
Prob (6 runs or fewer | 12) = 19.18% (Bradley, 1968, Table X)

63
suggest the VPBS sequence of runs still could be relatively random (probability of 19.18%).
3. Extending the platform data through to 2010 with two separate January 1973 spills generated 8 runs with 13 observations; the test results suggest the VPBS sequence of runs could be relatively random (probability of 54.13%).
A.2.4 Hotelling and Pabst’s Test for OCS Platform Spills The Hotelling and Pabst’s Test for Rank-Order Correlation is a measure of the tendency of our observations to form a monotonic sequence, with small D values indicating an increasing sequence. Each spill is assigned an order number, and each spills’ VPBS is ranked from low to high, i.e., for 20 spill observations, spills are assigned an order number of 1 to 20, where 1 is the earliest spill, and each VPBS is ranked from 1 to 20, where 1 is the smallest VPBS. The D value is calculated by subtracting each spill’s VPBS rank from the spill’s order number, square the result, and add the results for a sum of squares. The resulting sum D is looked up in Table I, Bradley (1968). The smaller the value of D, the more likely there is an improvement trend because a small D indicates the earliest spills have the smaller VPBS rank and the more recent spills have the higher VPBS rank so the subtraction of the spill order number from the spill VPBS rank would produce many zeros, ones and twos to square and sum together to equal D. Table A-4 presents three separate iterations of applying the Hotelling and Pabst’s Test to platform spill data:
1. Reproduction of the Hotelling and Pabst’s Test from Nakassis (1982) with 9 platform spill observations from 1964 through1979 that included one January 1973 spill
2. Results of the Hotelling and Pabst’s Test with 12 platform spill observations from1964 through 2010 that treated the two January 1973 spills as a single spill event.
3. Results of the Hotelling and Pabst’s Test with 13 platform spill observations from1964 through 2010 with two separate January 1973 spills.
Conclusions on Hotelling and Pabst’s Test, as Related to OCS Platform Spill Data:
1. Nakassis’ results indicate that the low D value of 22 with 9 observations,
calculated from the sum of squares of the difference between the spill number of 1 to 9 (based on spill date) and the VPBS rank of 1 to 9 (based on relative VPBS amount low to high order), was unlikely to be a random result (probability ≤1%).
2. Extending the platform data through to 2010 and treating the two January 1973 spills as a single event results in a low D value of 56 with 12 observations, calculated from the sum of squares of the difference between the spill number of 1 to 12 (based on spill date) and the VPBS rank of 1 to 12 (based on relative VPBS amount low to high order), and is unlikely to be a random result (probability ≤ 0.5%).

64
Table A‐4. Hoteling and Pabst Rank‐Order Correlation Test for OCS Platform Spills ≥1,000 Barrels
D = (1‐1)^2 + (2‐3)^2 + (3‐4)^2 + (4‐7)^2 + (5‐2)^2 + (6‐5)^2
+ (7‐6)^2 + (8‐8)^2 + (9‐9)^2
= 22 Prob (D ≤ 22 | 9) < Prob (D ≤ 26 | 9) ≤ 1 %
[Bradley (1968) Table I]
D = (1‐1)^2 + (2‐3)^2 + (3‐4)^2 + (4‐8)^2 + (5‐2)^2 + (6‐6)^2 + (7‐7)^2
+ (8‐9)^2 + (9‐10)^2 + (10‐5)^2
+ (11‐12)^2 + (12‐11)^2
= 56 Prob (D ≤ 56 | 12) < Prob (D ≤ 76 | 12) ≤ 0.5 %
D = (1‐2)^2 + (2‐4)^2 + (3‐5)^2 + (4‐9)^2 + (5‐3)^2 + (6‐7)^2 + (7‐8)^2
+ (8‐10)^2 + (9‐1)^2 + (10‐11)^2
+ (11‐6)^2 + (12‐13)^2 + (13‐12)^2
= 136 Prob (D ≤ 136 | 13) < Prob (D ≤ 160 | 13) ≤ 2.5 %
[Bradley (1968) Table I]
Analysis Using Data from Nakassis (1982):
Analysis Including One January 1973 Spill:
Analysis Including Two January 1973 Spills:
[Bradley (1968) Table I]
3. Extending the platform data through to 2010 with two separate January 1973 spills still generates a relatively low D value of 136 with 13 observations, calculated from the sum of squares of the difference between the spill number of 1 to 13 (based on spill date) and the VPBS rank of 1 to 13 (based on relative VPBS amount low to high order), is unlikely to be a random result (probability of less than ≤ 2.5%).
A.2.5 Kendall’s Test for Correlation for OCS Pipeline Spills Figure A-2 presents the application of Kendall’s Test for Correlation to the 20 pipeline spill observations from1964 through 2010 using May 2011 production data. This test is calculated as was described earlier for Figure A-1. If S is high because T is high compared to I, it indicates an improving record because it generally means the most recent incidents have more production between spills. Conclusions on Kendall’s Test for Correlation, as Related to OCS Pipeline Spill Data: The application of Kendall’s Test to the 1964 – 2010 pipeline spill data generated a relatively low S value of 38 with 20 observations (based on a net calculation from 114 spill pairs with the earlier spill having a lower VPBS and 76 spill pairs with the earlier spill having a higher VPBS) and is possibly a relatively random result (probability >10%).

65
Figure A‐2. Kendall’s Test for Correlation, OCS Pipeline Spills ≥1,000 Barrels Spill 1 2 3 4 5 6 7 8 9 10 11 12 13 14 15 16 17 18 19 20
Datep# VPBS
1588.0 94.0 240.9 1,563.5 349.7 142.9 736.5 1,471.4 2,223.5 641.8 105.1 737.0 801.7 1,397.6 365.6 388.7 267.9 2,719.4 1,975.7 469.5
10/15/1967 1 588.03/12/1968 2 94.0 I2/11/1969 3 240.9 I T5/12/1973 4 1,563.5 T T T4/17/1974 5 349.7 I T T I9/11/1974 6 142.9 I T I I I12/18/1976 7 736.5 T T T I T T12/11/1981 8 1,471.4 T T T I T T T2/7/1988 9 2,223.5 T T T T T T T T
1/24/1990 10 641.8 T T T I T T I I I5/6/1990 11 105.1 I T I I I I I I I I
8/31/1992 12 737.0 T T T I T T T I I I T11/16/1994 13 801.7 T T T I T T T I I T T T1/26/1998 14 1,397.6 T T T I T T T I I T T T T9/29/1998 15 365.6 I T T I T T I I I I T I I I7/23/1999 16 388.7 I T T I T T I I I I T I I I T1/21/2000 17 267.9 I T T I I T I I I I T I I I I I
9/15/2004 18 2,719.4 T T T T T T T T T T T T T T T T T
9/13/2008 19 1,975.7 T T T T T T T T I T T T T T T T T I
7/25/2009 20 469.5 I T T I T T I I I I T I I I T T T I IBalance3
846.7
Total Production 18,127.2
T 10 18 15 3 12 13 7 3 1 4 9 4 3 2 4 3 3 0 0
I 9 0 2 13 3 1 6 9 10 6 0 4 4 4 1 1 0 2 1
Source: Data from Table II of Nakassis (1982)
1 VPBS= Volume of oil proudced between spills, in millions of barrels2 (MMbbl)2 bbl = barrels; 1 barrel= 42 U.S. gallons3 Balance= balance of production since the last spill4 Total Production includes 2010 production data, updated as of May 2011 from ONRR data.T = smaller before larger, I = larger before smaller
Analysis: 20 observations, T = 114, I = 76, no ties S = T - I = 38Prob (S ≥ 38 | n = 20) > Prob (S ≥ 42 | 20) > 10% (Bradley, 1968, Table XI)

66
A.2.6 Runs Up, Runs Down Test for OCS Pipeline Spills
Table A-5 presents the application of the Runs Up, Runs Down Test to the 20 pipeline spill observations from1964 through 2010 and using OC production data as of May 2011. The description of the Runs Up, Runs Down Test is described in Section A.2.3.
Conclusions on the Runs Up, Runs Down Test, as Related to Pipeline Data: The application of the Runs Up, Runs Down Test to the 1964 through 2010 pipeline spill data generated 11 runs with 20 observations, the test results suggest the VPBS sequence of runs could be random (probability of 20.12%). A.2.7 Hotelling and Pabst’s Test for Pipeline Spills Table A-6 presents the application of the Hotelling and Pabst’s Test to the 20 pipeline spill observations from1964 through 2010 and using May 2011 production data, and for the period of the last twenty years (1990-2009). Conclusions on Hotelling and Pabst’s Test, as Related to Pipeline Spill Data: The application of the Hotelling and Pabst’s Test to the 1964-2010 pipeline spill data generated a D value of 934 with 20 observations, calculated from the sum of squares of the difference between the spill number of 1 to 20 (based on spill date) and the VPBS rank of 1 to 20 (based on relative VPBS amount low-to-high order), may not be a random result (probability of > 10%).

67
Table A‐5. Runs Up, Runs Down Tests for
OCS Pipeline Spills ≥1,000 Barrels, 1964 through 2010
Spill #
Pipeline Spill
Date
VPBS1
(MMbbl2)
Two 1973
Spills
VPBS3
Rank
Runs Up,
Runs
Down
1 10/15/1967 588.040 10
2 3/12/1968 93.986 1 -3 2/11/1969 240.911 4 +4 5/12/1973 1,563.527 17 +5 4/17/1974 349.682 6 -6 9/11/1974 142.942 3 -7 12/18/1976 736.530 12 +8 12/11/1981 1,471.440 16 +9 2/7/1988 2,223.490 19 +10 1/24/1990 641.797 11 -11 5/6/1990 105.079 2 -12 8/31/1992 737.025 13 +13 11/16/1994 801.686 14 +14 1/26/1998 1,397.560 15 +15 9/29/1998 365.602 7 -16 7/23/1999 388.749 8 +17 1/21/2000 267.907 5 -18 9/15/2004 2,719.374 20 +19 9/13/2008 1,975.691 18 -20 7/25/2009 469.485 9 -
Balance 2010 846.733
Total 18,127.232
2MMbbl = million barrels. A barrel is 42 U.S. gallons
Analysis: 20 observations, 11 runs, longest run 3
1VPBS = volume of oil produced between spills,
expressed in millions of bbl (MMbbl)
Prob (11 runs or fewer | 20) = 20.12%
(Bradley 1968, Table X)
3 Balance=the amount of production between the last
spill and the end of the study period.4 Total production= Total OCS production through the
end of the study period; 2010 OCS production data was
used, and was updated as of May 2011 using ONRR
data.

68
Table A‐6. Hotelling and Pabst's Tests for OCS Pipeline Spills ≥ 1,000 Barrels, 1964 through 2009
D = (1‐10)^2 + (2‐1)^2 + (3‐4)^2 + (4‐17)^2 + (5‐6)^2 + (6‐3)^2 + (7‐12)^2
+ (8‐16)^2 + (9‐19)^2 + (10‐11)^2 + (11‐2)^2
+ (12‐13)^2 + (13‐14)^2 + (14‐15)^2 + (15‐7)^2 + (16‐8)^2
+ (17‐5)^2 + (18‐20)^2 + (19‐18)^2+ (20‐9)^2
= 934 Prob (D ≤ 934 | 20) > Prob (D ≤ 932 | 20) > 10 %
(Bradley, 1968, Table I)
For Full Record (1964‐2009)

69
APPENDIX B. SAMPLE CALCULATION OF ESTIMATED PROBABILITY OF SPILL OCCURRENCE
USING 1964 TO 2008 WORLDWIDE TANKER SPILL RATE Appendix shows how the spill rates can be used to estimate spill probabilities. Since information on spill rates is used in public policymaking, it is useful to provide an example of how BOEM uses the spill rate and the Poisson distribution (see Section 2.4.2 Poisson Distribution Used in Spill-Rate Estimations). This appendix represents such an example. This procedure is adapted from Anderson and LaBelle (1994). For the purpose of this example, we have assumed that 0.75 Bbbl (Bbbl = 109 bbl or 1,000,000,000 bbl) of crude oil would be transported during a10-year period. Using the spill rate (λ) for worldwide tanker spills (Table 10) of 0.84 spills ≥ 1,000 bbl per 109 bbl handled, and an estimated transport (t) of 0.75 x 10⁹ bbl of crude oil by tanker, it is estimated that a mean number (λ x t), or 0.63 spills ≥ 1,000 bbl will occur over that 10-year period as a result of the transport 0.75 Bbbl of crude oil by tanker, or
(0.84 spills per 109 bbl x 0.75 x 109 bbl= 0.63 spills) The estimated probability of zero (0) spills (P(0)) occurring over that 10-year period as a result of handling the 0.75 x 10⁹ bbl of crude oil by tanker is calculated by substituting 0 for n and 0.63 for λ t in equation (1), or
P(0) = (0.630 X e-0.63) = (1 X 0. 53) = 0.53 or 53% 0! 1 Table B-1 shows the results of similar calculations for the probabilities of 1 spill occurring and the probabilities of 2 spills occurring in each of the three spill size categories (≥1,000 bbl, ≥10,000 bbl, and ≥100,000 bbl). The estimated probability of one or more spills occurring is equal to 1.00 minus the probability of 0 spills occurring, or
1.0 – P(0) = 1.00 – 0 .53 or 0 .47 (47%) Thus, one could estimate that the probability (expressed as percent chance) of one or more spills ≥1,000 bbl occurring due to the transportation of 0.75 Bbbl of crude oil by tanker would be 47% over the 10-year period.
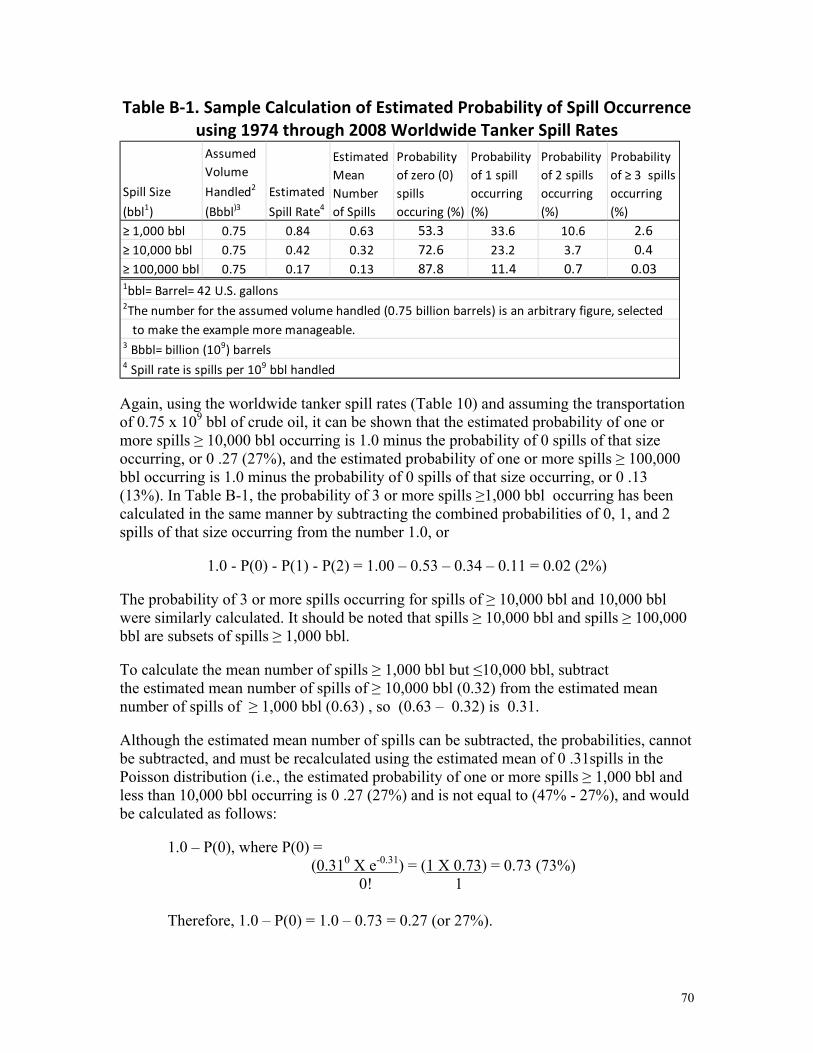
70
Table B‐1. Sample Calculation of Estimated Probability of Spill Occurrence using 1974 through 2008 Worldwide Tanker Spill Rates
Spill Size
(bbl1)
Assumed
Volume
Handled2
(Bbbl)3Estimated
Spill Rate4
Estimated
Mean
Number
of Spills
Probability
of zero (0)
spills
occuring (%)
Probability
of 1 spill
occurring
(%)
Probability
of 2 spills
occurring
(%)
Probability
of ≥ 3 spills
occurring
(%)
≥ 1,000 bbl 0.75 0.84 0.63 53.3 33.6 10.6 2.6
≥ 10,000 bbl 0.75 0.42 0.32 72.6 23.2 3.7 0.4
≥ 100,000 bbl 0.75 0.17 0.13 87.8 11.4 0.7 0.03
2The number for the assumed volume handled (0.75 billion barrels) is an arbitrary figure, selected
to make the example more manageable.3 Bbbl= billion (109) barrels4 Spill rate is spills per 109 bbl handled
1bbl= Barrel= 42 U.S. gallons
Again, using the worldwide tanker spill rates (Table 10) and assuming the transportation of 0.75 x 10⁹ bbl of crude oil, it can be shown that the estimated probability of one or more spills ≥ 10,000 bbl occurring is 1.0 minus the probability of 0 spills of that size occurring, or 0 .27 (27%), and the estimated probability of one or more spills ≥ 100,000 bbl occurring is 1.0 minus the probability of 0 spills of that size occurring, or 0 .13 (13%). In Table B-1, the probability of 3 or more spills ≥1,000 bbl occurring has been calculated in the same manner by subtracting the combined probabilities of 0, 1, and 2 spills of that size occurring from the number 1.0, or
1.0 - P(0) - P(1) - P(2) = 1.00 – 0.53 – 0.34 – 0.11 = 0.02 (2%) The probability of 3 or more spills occurring for spills of ≥ 10,000 bbl and 10,000 bbl were similarly calculated. It should be noted that spills ≥ 10,000 bbl and spills ≥ 100,000 bbl are subsets of spills ≥ 1,000 bbl. To calculate the mean number of spills ≥ 1,000 bbl but ≤10,000 bbl, subtract the estimated mean number of spills of ≥ 10,000 bbl (0.32) from the estimated mean number of spills of ≥ 1,000 bbl (0.63) , so (0.63 – 0.32) is 0.31. Although the estimated mean number of spills can be subtracted, the probabilities, cannot be subtracted, and must be recalculated using the estimated mean of 0 .31spills in the Poisson distribution (i.e., the estimated probability of one or more spills ≥ 1,000 bbl and less than 10,000 bbl occurring is 0 .27 (27%) and is not equal to (47% - 27%), and would be calculated as follows:
1.0 – P(0), where P(0) = (0.310 X e-0.31) = (1 X 0.73) = 0.73 (73%)
0! 1 Therefore, 1.0 – P(0) = 1.0 – 0.73 = 0.27 (or 27%).
71
APPENDIX C. DATA ON OCS OIL SPILLS This appendix presents additional details about spills of crude oil and condensate on the OCS from1964 through 2010. It considers historic spill sizes versus spill occurrence numbers prior to 2009 and after 2010 (when the Macondo well spill occurred) and it addresses spills due to hurricane damage in the Gulf of Mexico. C.1 OCS Petroleum Spills, 1964 through 2009 From 1964 through 2009, more than 17.5 billion bbl of crude oil and condensate were produced on the OCS while spilling less than 570,000 bbl of petroleum (crude oil, condensate and refined products such as diesel and gasoline used in exploration and development operations). Overall, this was more than 30,000 bbl petroleum produced per bbl spilled (Table 1 in the main report). This record improved over time, from 1964 through 2009: Slightly less than 4,000 bbl was produced per bbl spilled from 1964 through1970
(7 years). (This data category was selected to end in 1970, due to increased spill data quality after 1970.)
Almost 60,000 bbl was produced per bbl spilled from 1971 through 1990 (20
years). More than 155,000 bbl was produced per bbl spilled from1991 through 2009 (19
years). The improvement in the 46-year period from 1964 through 2009 was largely due to the elimination of larger spill events of 50,000, 20,000 or even 10,000 bbl or more in size. (See Table 2 in the main report). Specifically: From1964 through 1970, there were ten spills ≥ 1,000 bbl, four of which were ≥
50,000 bbl (between 53,000 and 161,000 bbl). There were no single spills ≥ 20,000 bbl from1971 through 2009.
There were no single spills ≥ 10,000 bbl from 1991 through 2009.
There were no single spills ≥ 5,000 bbl from 2006 through 2009.
This continuity of improvement was broken by a spill in 2010 which, over a period of three months, may have released about 8.5 times more petroleum than had cumulatively spilled from OCS activities over the preceding 46 years of the program (from 1964 through 2009). The incident began on April 20, 2010 with a loss of well control, explosion, and fire on the Deepwater Horizon rig at BP’s Macondo well located at Mississippi Canyon 252 (MC 252) more than 50 miles offshore in a water depth of just

72
under 5,000 feet. The resulting release of tens of thousands of bbl of oil per day was not brought under control until July 15, 2010. This report assumes the volume of oil released from this incident was 4.9 billion bbl, the volume utilized in: “Oil Budget Calculator: Deepwater Horizon Technical Documentation”, November 2010, Report by The Federal Interagency Solutions Group, Oil Budget Calculator Science and Engineering Team http://www.noaanews.noaa.gov/stories2010/PDFs/OilBudgetCalc_Full_HQ-Print_111110.pdf This spill volume may be revised in the future based on additional studies. The vast majority of OCS spills are ≤ 1,000 barrels. If you include all OCS spills ≥ one barrel, for the 46-year time period from 1964 through 2009, you find that 98.9 percent of all OCS spills were <1,000 barrels in volume and 1.1 percent of spills were ≥ 1,000 barrels in volume. However, the spills of 1,000 barrels or more accounted for 90.6 percent by volume of the almost 570,000 bbl petroleum spilled in that time period (Fig. 10, main report) and more than 99.9 percent of the total spillage from 1964 through 2010 was due to the Macondo well spill.
Comparing the 1964 through 2009 period above (Figure 10, main report) with the 15-year period from1995 through 2009 (Fig. C-1), OCS spills ≥ 1,000 bbl were still 1.1 percent of all spills, but accounted for 48.1 percent of the spillage; and spills of 50 to 999 bbl (14.6% of spills) accounted for 43.5 percent of the spillage. The reduction in relative contribution of spills ≥ 1,000 bbl to the total spillage was because spills ≥ 1,000 bbl have tended to decrease in size over time through 2009; and there was an increase in reporting of spills between 50 and 999 bbl in size during this period, due to the damage from major hurricanes (Lili 2002, Ivan 2004, Katrina and Rita 2005, Gustav and Ike 2008).
C.2 OCS Petroleum Spills, Most Recent 15‐Year Periods, 1995 through 2009 and 1996 through 2010 The effect of the Macondo well spill on the OCS spill record can also be seen by comparing data for all spills for two 15-year periods: 1) 1995 through 2009 (Figs. C-1 and C-2) and 2) 1996 through 2010 (Fig. C-3). For this period (1995 through 2009) (Figs. C-1 and C-2): Most, 96.2%, of OCS petroleum spills were < one bbl (42 gallons), but these
spills accounted for 1.9% of the spillage. More than 98% of these spills were < 10 bbl (96.2%+2.4%).
Spills ≥ 1,000 bbl accounted for a very small percentage, 0.04%, of the total
number of OCS petroleum spills that occurred. Spills ≥ 1,000 bbl accounted for a significant portion, 47.1%, of the volume
spilled.
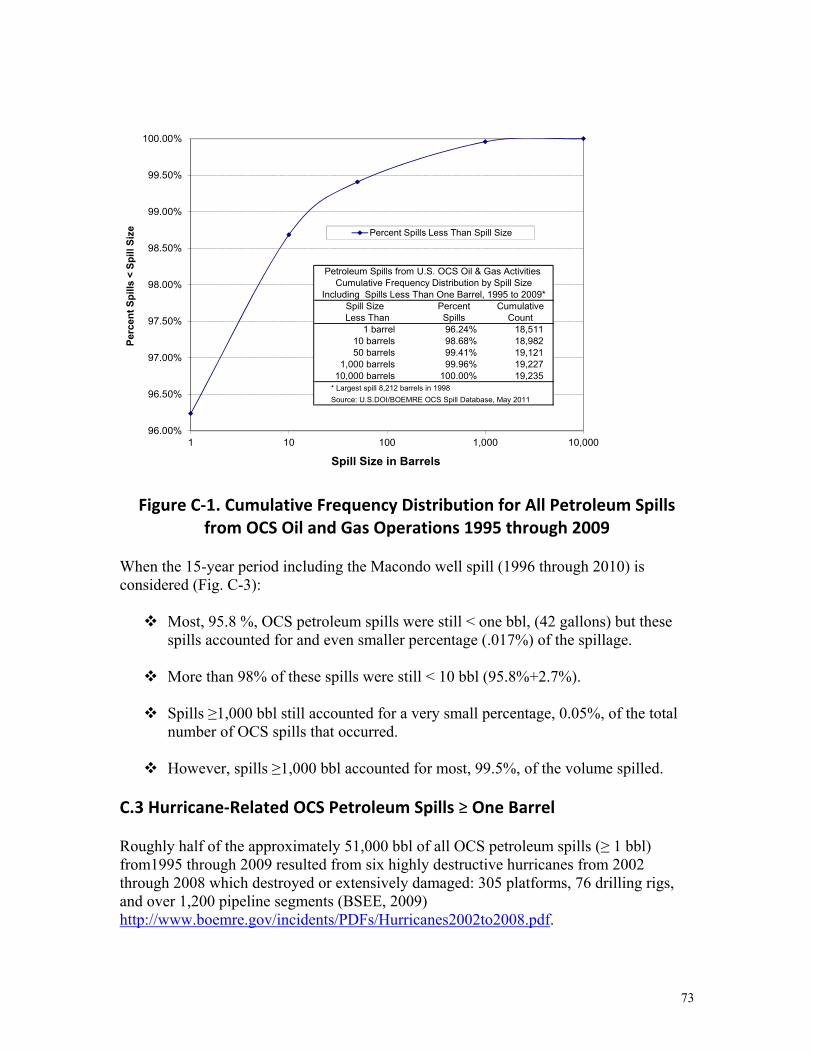
73
96.00%
96.50%
97.00%
97.50%
98.00%
98.50%
99.00%
99.50%
100.00%
1 10 100 1,000 10,000
Per
cen
t S
pill
s <
Sp
ill S
ize
Spill Size in Barrels
Percent Spills Less Than Spill Size
Spill Size Percent CumulativeLess Than Spills Count
1 barrel 96.24% 18,51110 barrels 98.68% 18,98250 barrels 99.41% 19,121
1,000 barrels 99.96% 19,22710,000 barrels 100.00% 19,235
Petroleum Spills from U.S. OCS Oil & Gas Activities Cumulative Frequency Distribution by Spill Size
Including Spills Less Than One Barrel, 1995 to 2009*
Source: U.S.DOI/BOEMRE OCS Spill Database, May 2011
* Largest spill 8,212 barrels in 1998
Figure C‐1. Cumulative Frequency Distribution for All Petroleum Spills
from OCS Oil and Gas Operations 1995 through 2009 When the 15-year period including the Macondo well spill (1996 through 2010) is considered (Fig. C-3): Most, 95.8 %, OCS petroleum spills were still < one bbl, (42 gallons) but these
spills accounted for and even smaller percentage (.017%) of the spillage. More than 98% of these spills were still < 10 bbl (95.8%+2.7%).
Spills ≥1,000 bbl still accounted for a very small percentage, 0.05%, of the total
number of OCS spills that occurred. However, spills ≥1,000 bbl accounted for most, 99.5%, of the volume spilled.
C.3 Hurricane‐Related OCS Petroleum Spills ≥ One Barrel Roughly half of the approximately 51,000 bbl of all OCS petroleum spills (≥ 1 bbl) from1995 through 2009 resulted from six highly destructive hurricanes from 2002 through 2008 which destroyed or extensively damaged: 305 platforms, 76 drilling rigs, and over 1,200 pipeline segments (BSEE, 2009) http://www.boemre.gov/incidents/PDFs/Hurricanes2002to2008.pdf.

74
1851196%
471
139106
8
< 1 bbl
1‐9 bbbl
10‐49 bbl
50‐999 bbl
≥ 1,000 bbl
986.15432%1392.49
3%
2893.175%
22158.1443%
24464.6947%
< 1 bbl
1‐9 bbbl
10‐49 bbl
50‐999 bbl
≥ 1,000 bbl
Number of Spills, All Spill Sizes
Total = 19,235
1995 through 2009
Spill Volume, All Spill Sizes
Total 51,895 Barrels
1995 through 2009
Spill SizeNumber of
SpillsBarrels Spilled
Average Spill Size
% Spills ≥
1 bbl1% Volume
≥ 1 bbl1
% of All Spills by Number
% of All Spills by Volume
< 1 bbl 18,511 986 0.0533 96.236% 1.900%1-9 bbbl 471 1,392 2.9565 65.055% 2.735% 2.449% 2.683%
10-49 bbl 139 2,893 20.8142 19.199% 5.683% 0.723% 5.575%50-999 bbl 106 22,158 209.0391 14.641% 43.525% 0.551% 42.698%≥ 1,000 bbl 8 24,465 3058.0863 1.105% 48.056% 0.042% 47.143%Total ≥ 1 bbl 724 50,908 70.3156 100.000% 100.000%
All Spills 19,235 51,895 2.6979 100.000% 100.000%bbl1= Barrel= 42 U.S. Gallons
Petroleum Spills from OCS Oil & Gas Activities by Spill Size, 1995 through 2009
Figure C‐2. Petroleum Spills from OCS Oil and Gas Activities by Spill Size and Volume, 1995‐2009
Almost 26,000 bbl of crude and refined products were lost as a result of 231 petroleum spills ≥ 1 bbl during major Hurricanes: Lili (2002), Ivan (2004), Katrina (2005), Rita (2005), Gustav (2008), and Ike (2008). These six storms were responsible for three of the eight spill events ≥ 1,000 bbl (totaling 8,100 bbl); and 75 of the 106 spills of 50 to 999 bbl (totaling about 16,000 bbl) that occurred over the 15-year period (1995 through 2009). (A fourth spill ≥ 1,000 bbl in size was an 8,200 bbl pipeline spill caused by Hurricane Georges in 1998.)
Percentage of Spills in Each Size Category Spill Size Categories vs. Spill Volume In Barrels

75
16,16396%
4593%
1391%
1030%
90%
< 1 bbl
1‐9 bbl
10‐49 bbl
50‐999 bbl
≥ 1,000 bbl
8220%
1,3620%
2,9760%
21,0210%
4,924,465100% < 1 bbl
1‐9 bbl
10‐49 bbl
50‐999 bbl
≥ 1,000 bbl
Number of Spills, All Spill SizesTotal = 16,873
1996 through 2010
Spill Volume, All Spill SizesTotal = 4,950,646 Barrels
1996 through 2010
Spill SizeNumber of Spills
Spill Volume
(bbl1)Average Spill
Size
% Spills ≥
1 bbl1
% Spill Volume
≥ 1 bbl1
% of All Spills by Number
% of All Spills by Number
< 1 bbl 16,163 822 0.0509 95.792% 0.017%1-9 bbl 459 1,362 2.9662 64.648% 0.028% 2.720% 0.028%
10-49 bbl 139 2,976 21.4129 19.577% 0.060% 0.824% 0.060%50-999 bbl 103 21,021 204.0845 14.507% 0.425% 0.610% 0.425%≥ 1,000 bbl 9 4,924,465 547162.7778 1.268% 99.488% 0.053% 99.471%
Total ≥ 1 bbl 710 4,949,824 6971.5825 100.000% 100.000%All Spills 16,873 4,950,646 293.4064 100.0% 100.0%
1 bbl= Barrel= 42 U.S. Gallons
Petroleum Spills from U.S. OCS Oil & Gas Activities by Spill Size, 1996 to 2010
Figure C‐3. Petroleum Spills from OCS Oil and Gas Activities
by Spill Size and Volume, 1996 through 2010 Historically, OCS hurricane-related spills were mostly active spills from oil and gas facilities, i.e., spills that were observed and generally required some intervention after the storms. Beginning in 2004 with Hurricane Ivan, petroleum that was lost or missing from pre-storm inventories on OCS structures that were destroyed, heavily damaged, and/or missing (platforms and pipelines) were counted as spills by DOI (even though these spills were not observed and required no response). The change to specifically include these passive spills in the database resulted in an increase in the number and volume of spills attributed to these six hurricanes.
Percentage of Spills in Each Size Category Spill Size Categories vs. Spill Volume
In Barrels

76
The loss of petroleum during these hurricanes was minimized by the successful operation of the safety valves that are required to be installed at least 100 feet below the mudline in each wellbore. Pipeline check valves limited the potential losses from damaged pipeline segments. All OCS facilities in areas threatened by the storms’ approach were shut in prior to the hurricanes so that oil losses were mostly limited to the oil stored on the damaged platforms or contained in damaged pipeline sections between the check valves. The hydrocarbons released during the hurricanes were thoroughly dispersed offshore by the hostile sea conditions, which eliminated the potential for oiling shoreline. There were no accounts of environmental consequences resulting from spills from OCS facilities which occurred during these major hurricanes from 2002 through 2008: no spill contacts to the shoreline; no reported oiling of marine mammals, birds, or other wildlife; no large volumes of oil on the ocean surface to be collected or cleaned up; and no identified environmental impacts from any OCS spills from these hurricanes (BSEE, 2009).