Updata Partners SaaS Metrics Framework · · 2017-06-21Updata Partners SaaS Metrics Framework ......
12
Updata Partners SaaS Metrics Framework 2099 Pennsylvania Ave NW, 8 th Floor, Washington, DC 20006 www.updata.com
Transcript of Updata Partners SaaS Metrics Framework · · 2017-06-21Updata Partners SaaS Metrics Framework ......
Updata Partners SaaS Metrics Framework
2099 Pennsylvania Ave NW, 8th Floor, Washington, DC 20006
www.updata.com

2
About Updata Partners
Updata Partners provides growth capital to software and software-enabled businesses.
Led by an investment team averaging more than 25 years of technology experience,
Updata invests in high-growth businesses where the combination of our capital and
operating experience will help accelerate success. As former executives and
entrepreneurs, Updata’s General Partners collaborate with management teams to build
companies that stand out in their markets. With more than $750 million of committed
capital since inception, we have provided growth equity funding to over 40 leading
technology companies.
About the Authors
Carter Griffin, General Partner
Carter Griffin is a General Partner and co-manages the firm. Carter has more than twenty years experience as an operator and investor in the software industry. He co-founded Brivo Systems and served as Chairman and CEO until selling the company to a strategic acquirer. Brivo Systems pioneered the software-as-a-service model in the physical security market by introducing the first-ever on-demand system for facility access control. Carter also spent four years as a Senior Vice President at Kaiser Associates, where he advised Fortune 500 clients on competitive positioning and new-market entry strategies. Earlier in his career, Carter worked in London for the Coca-Cola Company and held positions at American Management Systems and Arthur Andersen.
Carter serves on the Board of Directors of Mindshare, a leading forum for over 700 tech CEOs. He also serves on the Board of Directors of the Mid-Atlantic Venture Association where he has twice served as Co-Chair of Capital Connection.
Carter is a graduate of the University of North Carolina at Chapel Hill and holds a M.B.A. from the
J.L. Kellogg Graduate School of Management at Northwestern University. He lives in Chevy
Chase, Maryland with his wife and daughter.
Dan Moss, Vice President Prior to joining Updata Partners, Dan was an analyst in the Technology Investment Banking Group
at Barclays Capital. Based in their New York City office, he provided strategic and M&A advisory
services and participated in executing capital markets transactions. Dan began his career in
Boston as an analyst at America’s Growth Capital.
Dan graduated summa cum laude from Colby College with a double major in Mathematical
Sciences and Economics with a Concentration in Financial Markets. He is a member of the Phi
Beta Kappa Society.
Arun Singh, Associate Prior to joining Updata Partners, Arun worked in Esports Business Development at Riot Games,
where he worked on global partnerships & sponsorships for professional Esports leagues.
Previously, Arun worked as an analyst at Vista Equity Partners, a private equity fund, where he
participated in the sourcing, evaluation, and due diligence of investments in software &
technology-enabled businesses.
Arun graduated from the University of California at Berkeley with a major in Economics.
3
Introduction
Five years ago, Updata introduced our framework for analyzing SaaS companies. Since then,
we’ve refined our thinking by evaluating hundreds of potential investments and gaining insight
from many CEOs, CFOs and other collaborators. We’re now publishing our updated framework,
as well as an Excel tool here, so others can run their own numbers.
We owe thanks to many others, including Neil Hartz, a co-author of the original document.
Please keep the feedback coming!
# # #
We believe there are two SaaS metrics that matter most: Gross Margin Payback Period
(GMPP) and Return on Customer Acquisition Cost (rCAC). GMPP is the number of
months required to break even on the cost of acquiring a customer. rCAC incorporates
the element of customer churn/retention into the equation and calculates the multiple of
the acquisition cost provided by the lifetime gross profit of a customer. A good SaaS
business will have GMPP under 18 months and rCAC above 3x. A great SaaS business
will have GMPP & rCAC of less than 12 months and above 5x, respectively.
Perhaps the most underappreciated part of unit economics analysis is the importance of
cohorts. GMPP and rCAC offer powerful insights but are often meaningless if calculated only at
the company level. Company-wide metrics ignore the fact that most SaaS vendors sell multiple
products through a variety of channels and acquire customers over many months, quarters and
years. Accordingly, we believe cohort level analysis is necessary and must be run across at
least three critical dimensions: Vintage, Product, and Channel. Doing so will allow us to
answer important questions such as:
Vintage: “Are customer payback periods increasing or decreasing?”
Channel: “Do we get a better ROI from direct sales or from channel sales?”
Product: “How does customer lifetime value vary by product?”
Please note that this cohort-based unit economics framework is focused on customer-level data
and yields completely different insights than can be derived from analyzing GAAP financial
statements. These unit economics are more telling than GAAP financials about the health of a
business. In fact, this framework is the underpinning of every investment we make in a SaaS or
recurring revenue business.
4
Our metrics and recommended sequence of analysis are as follows:
Step 1. MRR Monthly Recurring Revenue
Step 2. tCAC Total Customer Acquisition Cost
Step 3. RGP Recurring Gross Profit
Step 4. GMPP Gross Margin Payback Period
Step 5. eLT Expected Lifetime
Step 6. LTV Lifetime Value
Step 7. rCAC Return on Total Customer Acquisition Cost
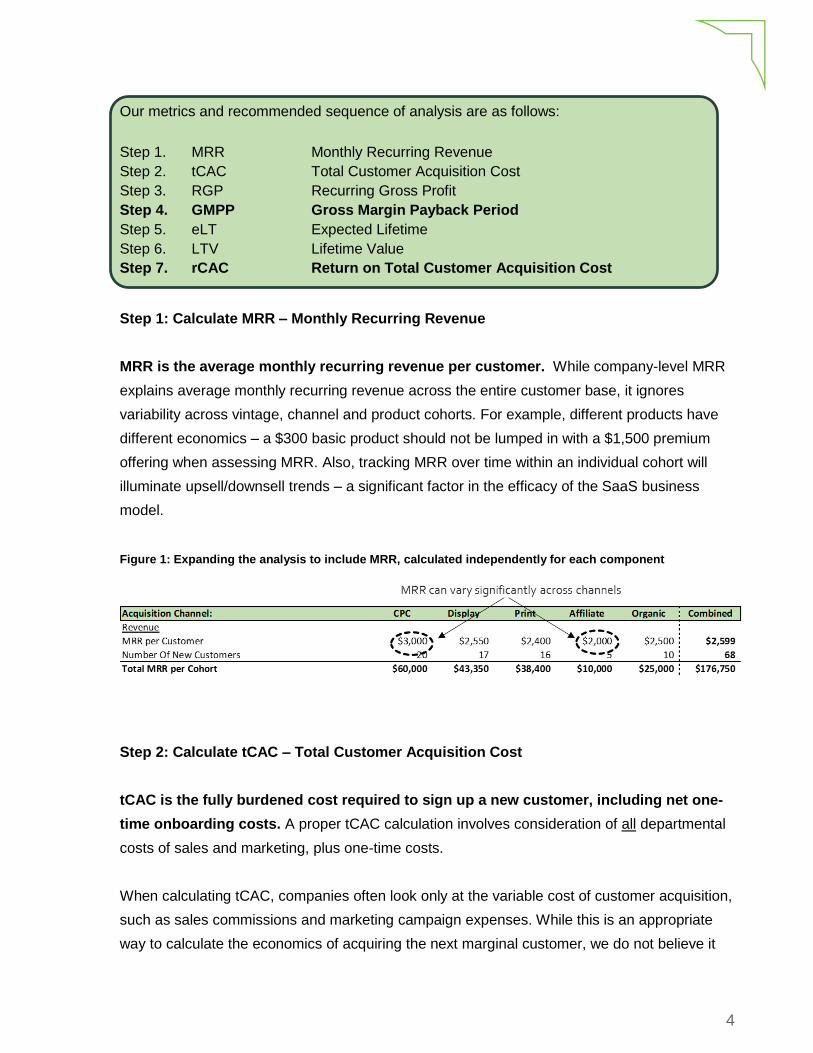
Step 1: Calculate MRR – Monthly Recurring Revenue
MRR is the average monthly recurring revenue per customer. While company-level MRR
explains average monthly recurring revenue across the entire customer base, it ignores
variability across vintage, channel and product cohorts. For example, different products have
different economics – a $300 basic product should not be lumped in with a $1,500 premium
offering when assessing MRR. Also, tracking MRR over time within an individual cohort will
illuminate upsell/downsell trends – a significant factor in the efficacy of the SaaS business
model.
Figure 1: Expanding the analysis to include MRR, calculated independently for each component
Step 2: Calculate tCAC – Total Customer Acquisition Cost
tCAC is the fully burdened cost required to sign up a new customer, including net one-
time onboarding costs. A proper tCAC calculation involves consideration of all departmental
costs of sales and marketing, plus one-time costs.
When calculating tCAC, companies often look only at the variable cost of customer acquisition,
such as sales commissions and marketing campaign expenses. While this is an appropriate
way to calculate the economics of acquiring the next marginal customer, we do not believe it
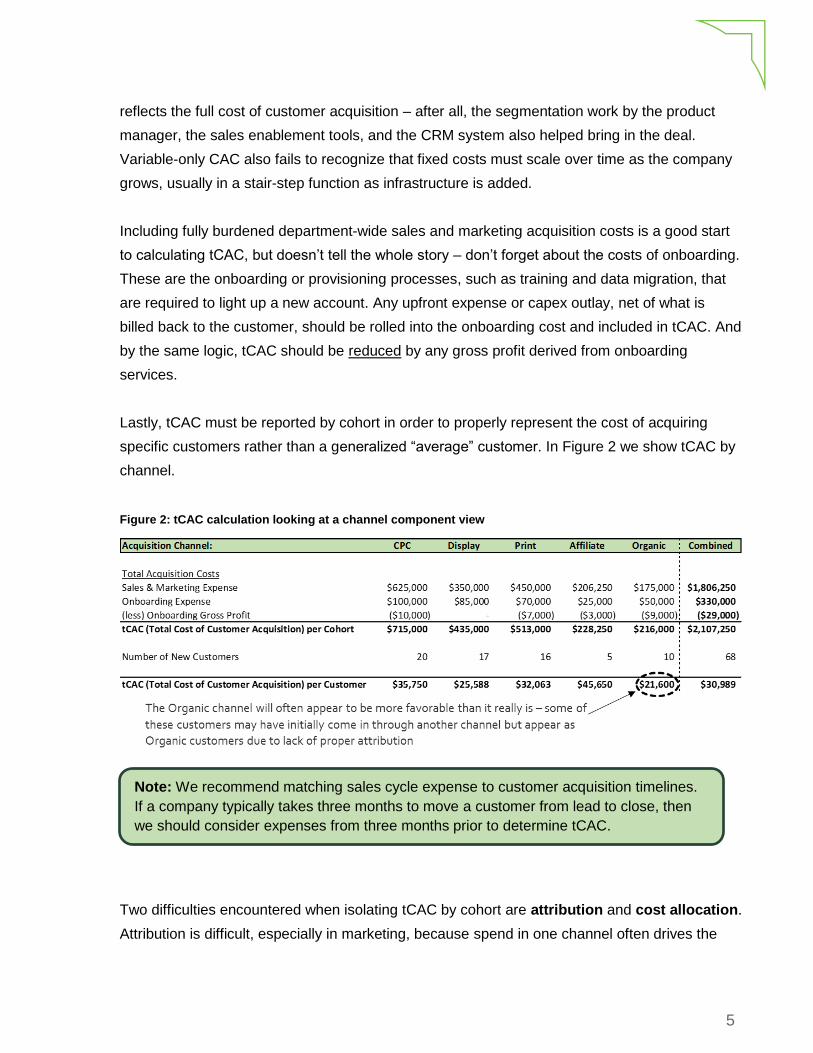
5
reflects the full cost of customer acquisition – after all, the segmentation work by the product
manager, the sales enablement tools, and the CRM system also helped bring in the deal.
Variable-only CAC also fails to recognize that fixed costs must scale over time as the company
grows, usually in a stair-step function as infrastructure is added.
Including fully burdened department-wide sales and marketing acquisition costs is a good start
to calculating tCAC, but doesn’t tell the whole story – don’t forget about the costs of onboarding.
These are the onboarding or provisioning processes, such as training and data migration, that
are required to light up a new account. Any upfront expense or capex outlay, net of what is
billed back to the customer, should be rolled into the onboarding cost and included in tCAC. And
by the same logic, tCAC should be reduced by any gross profit derived from onboarding
services.
Lastly, tCAC must be reported by cohort in order to properly represent the cost of acquiring
specific customers rather than a generalized “average” customer. In Figure 2 we show tCAC by
channel.
Figure 2: tCAC calculation looking at a channel component view
Two difficulties encountered when isolating tCAC by cohort are attribution and cost allocation.
Attribution is difficult, especially in marketing, because spend in one channel often drives the
Note: We recommend matching sales cycle expense to customer acquisition timelines.
If a company typically takes three months to move a customer from lead to close, then
we should consider expenses from three months prior to determine tCAC.
6
end result in another. For example, a display advertising campaign may generate customer
interest that results in a sale through an affiliate channel. These untraceable accounts often fall
into the “organic” channel, inflating its apparent efficacy.
The second issue of cost allocation arises because it’s not always clear how to allocate costs
between tCAC and recurring COGS. After all, some customers will require extra handholding
and attention at the outset of their tenure and some will require constant care during their
lifetime to prevent churn. To deal with these ambiguous situations, we recommend keeping it
simple, clearly defining assumptions, and being consistent over time.
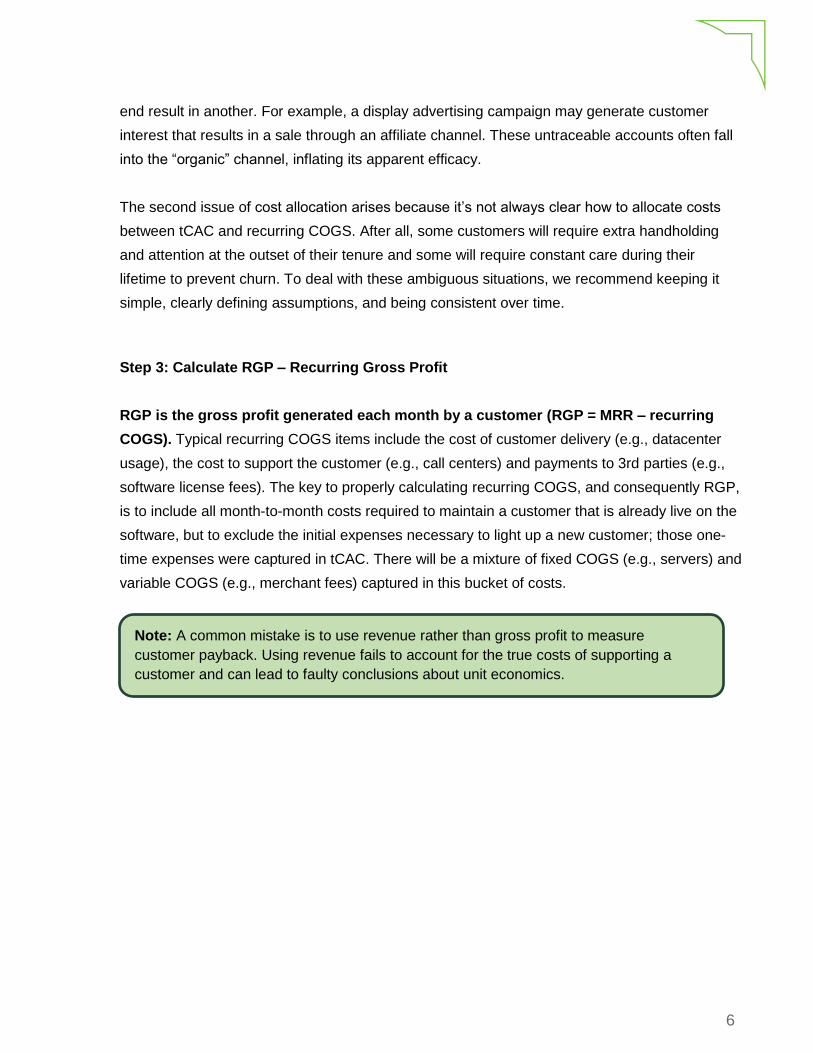
Step 3: Calculate RGP – Recurring Gross Profit
RGP is the gross profit generated each month by a customer (RGP = MRR – recurring
COGS). Typical recurring COGS items include the cost of customer delivery (e.g., datacenter
usage), the cost to support the customer (e.g., call centers) and payments to 3rd parties (e.g.,
software license fees). The key to properly calculating recurring COGS, and consequently RGP,
is to include all month-to-month costs required to maintain a customer that is already live on the
software, but to exclude the initial expenses necessary to light up a new customer; those one-
time expenses were captured in tCAC. There will be a mixture of fixed COGS (e.g., servers) and
variable COGS (e.g., merchant fees) captured in this bucket of costs.
Note: A common mistake is to use revenue rather than gross profit to measure
customer payback. Using revenue fails to account for the true costs of supporting a
customer and can lead to faulty conclusions about unit economics.
7
Figure 3: Calculating Recurring Gross Profit by netting out recurring variable costs from MRR
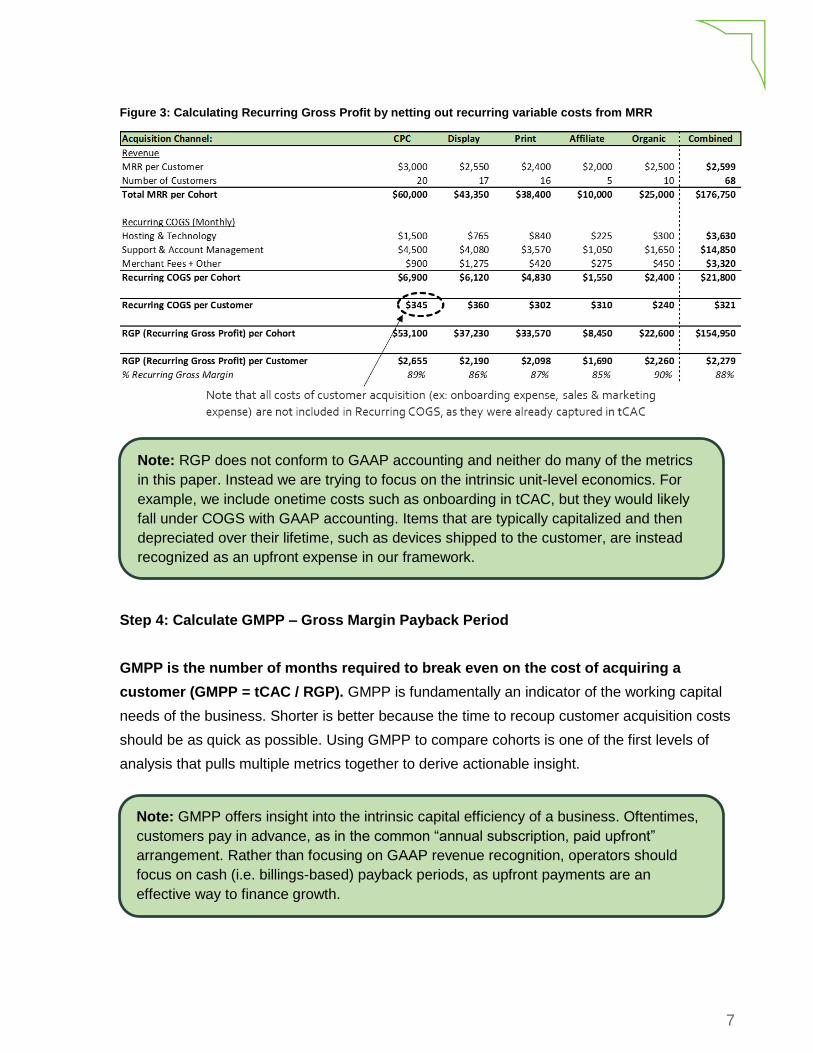
Step 4: Calculate GMPP – Gross Margin Payback Period
GMPP is the number of months required to break even on the cost of acquiring a
customer (GMPP = tCAC / RGP). GMPP is fundamentally an indicator of the working capital
needs of the business. Shorter is better because the time to recoup customer acquisition costs
should be as quick as possible. Using GMPP to compare cohorts is one of the first levels of
analysis that pulls multiple metrics together to derive actionable insight.
Note: RGP does not conform to GAAP accounting and neither do many of the metrics
in this paper. Instead we are trying to focus on the intrinsic unit-level economics. For
example, we include onetime costs such as onboarding in tCAC, but they would likely
fall under COGS with GAAP accounting. Items that are typically capitalized and then
depreciated over their lifetime, such as devices shipped to the customer, are instead
recognized as an upfront expense in our framework.
Note: GMPP offers insight into the intrinsic capital efficiency of a business. Oftentimes,
customers pay in advance, as in the common “annual subscription, paid upfront”
arrangement. Rather than focusing on GAAP revenue recognition, operators should
focus on cash (i.e. billings-based) payback periods, as upfront payments are an
effective way to finance growth.
8
Figure 4: Combining the elements above to derive GMPP
Before jumping to conclusions about marketing budget reallocations, however, it’s important for
high-growth SaaS businesses to realize that acquisition channels are not perfectly elastic.
Channels that appear scalable at 100 monthly additions with rapid GMPP may not scale with
consistent efficiency to 1,000 monthly additions. For example, CPC campaigns that work at low
volumes can become prohibitively expensive at high volumes due to finite online inventory.
Having said that, we are enthusiastic advocates of A/B testing, new channel development, and
data-driven searches for incremental gains. Armed with this cohort level analysis, SaaS
companies have a better chance at getting closer to the elusive efficient frontier of channel mix.
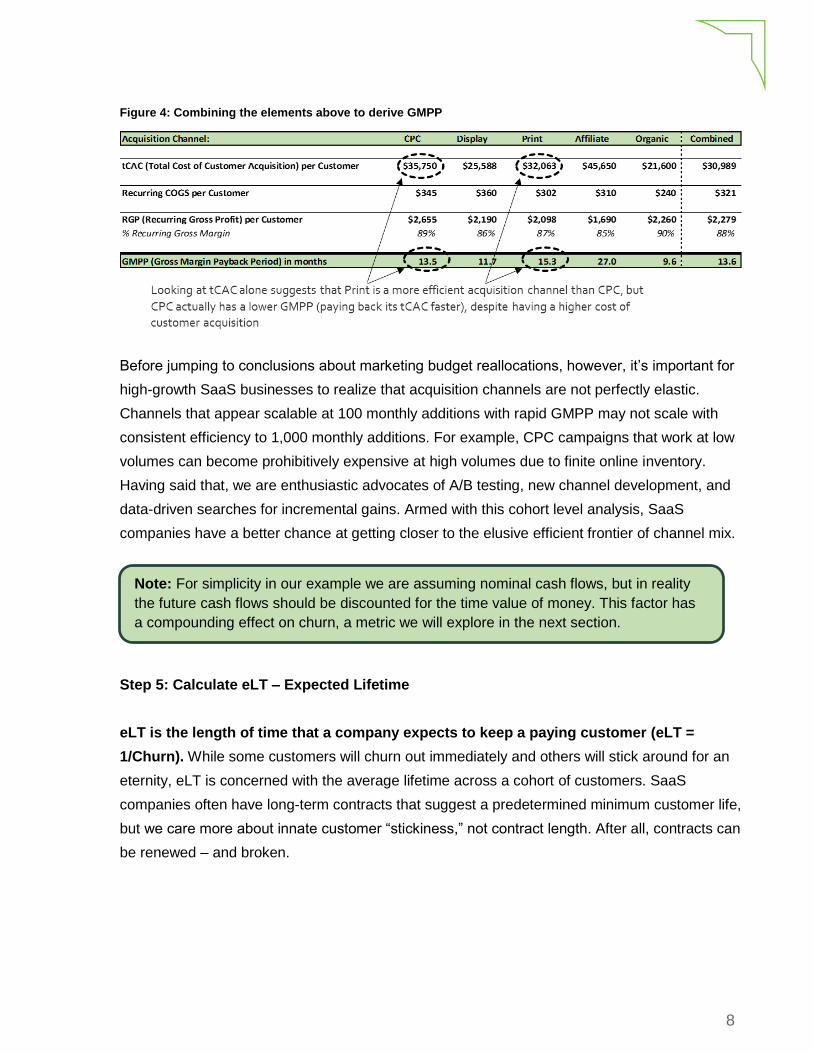
Step 5: Calculate eLT – Expected Lifetime
eLT is the length of time that a company expects to keep a paying customer (eLT =
1/Churn). While some customers will churn out immediately and others will stick around for an
eternity, eLT is concerned with the average lifetime across a cohort of customers. SaaS
companies often have long-term contracts that suggest a predetermined minimum customer life,
but we care more about innate customer “stickiness,” not contract length. After all, contracts can
be renewed – and broken.
Note: For simplicity in our example we are assuming nominal cash flows, but in reality
the future cash flows should be discounted for the time value of money. This factor has
a compounding effect on churn, a metric we will explore in the next section.
9
Figure 5: Expected Lifetime (eLT) is derived from churn and added to our analysis
Keep in mind that dollar churn is more important than account churn. While SaaS companies
will constantly be fighting a losing battle against account churn (at best, breakeven), customers
who stick around often increase the size of their subscription over time. Account growth can
occur through price increases, seat license growth, or the purchase of additional modules.
Churn itself is a much deeper concept that we explore in a separate white paper here, and
indeed most retention curves are more complex than our simplification suggests. Churn is a
tricky topic that can be easily misconstrued or gamed to tell a certain story …is it monthly or
annual? Logo or dollar? Gross or net? Cohort or company-wide? Thus, we discourage thinking
about churn as a single number and believe instead that eLT and detailed retention curves by
cohort provide the best insight into customer behavior.
Step 6: Calculate LTV – Lifetime Value
LTV is the economic value, net of costs, delivered over the life of a customer, and is
equal to lifetime gross profit (LTV = RGP x eLT). While GMPP is a great tool for comparing
the efficiency of different cohorts from a time-to-payback perspective, LTV takes it one step
further by incorporating expected lifetime. As previously noted, we encourage cutting off
customer lifetimes at five years for conservatism.
After repaying the fully burdened cost to acquire a customer and any variable recurring costs
required to support the customer, LTV goes towards paying off the remaining fixed costs in the
business – G&A and R&D – where significant operating leverage can be found with scale.
Note: We recommend cutting off eLT at five years because (1) the true value of “out
year” cash flows are significantly impacted by the time value of money, and (2) it’s very
hard to predict customer churn behavior five years in the future.
10
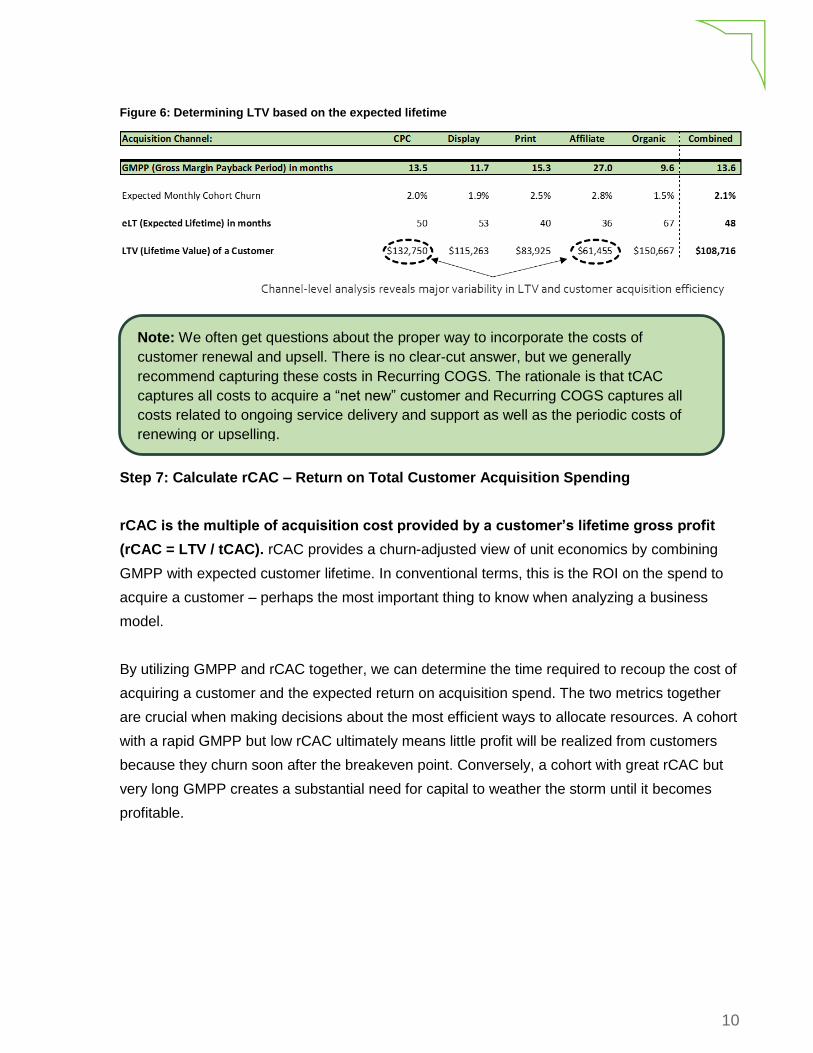
Figure 6: Determining LTV based on the expected lifetime
Step 7: Calculate rCAC – Return on Total Customer Acquisition Spending
rCAC is the multiple of acquisition cost provided by a customer’s lifetime gross profit
(rCAC = LTV / tCAC). rCAC provides a churn-adjusted view of unit economics by combining
GMPP with expected customer lifetime. In conventional terms, this is the ROI on the spend to
acquire a customer – perhaps the most important thing to know when analyzing a business
model.
By utilizing GMPP and rCAC together, we can determine the time required to recoup the cost of
acquiring a customer and the expected return on acquisition spend. The two metrics together
are crucial when making decisions about the most efficient ways to allocate resources. A cohort
with a rapid GMPP but low rCAC ultimately means little profit will be realized from customers
because they churn soon after the breakeven point. Conversely, a cohort with great rCAC but
very long GMPP creates a substantial need for capital to weather the storm until it becomes
profitable.
Note: We often get questions about the proper way to incorporate the costs of
customer renewal and upsell. There is no clear-cut answer, but we generally
recommend capturing these costs in Recurring COGS. The rationale is that tCAC
captures all costs to acquire a “net new” customer and Recurring COGS captures all
costs related to ongoing service delivery and support as well as the periodic costs of
renewing or upselling.
11
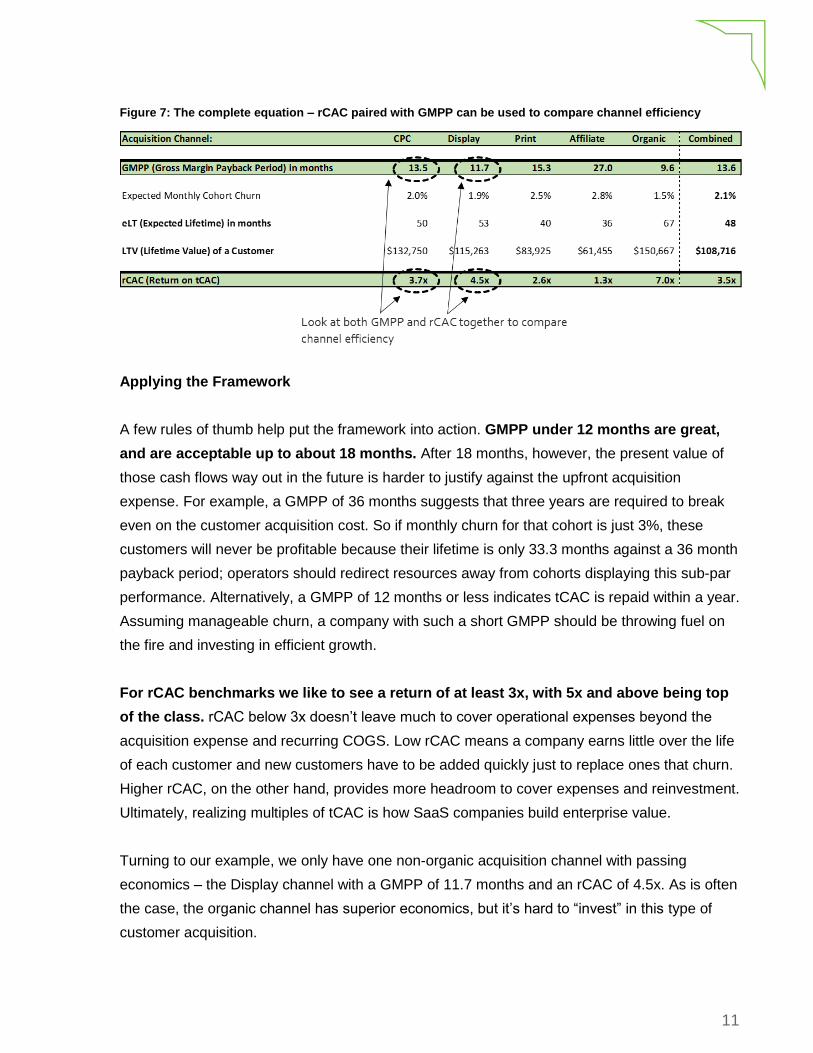
Figure 7: The complete equation – rCAC paired with GMPP can be used to compare channel efficiency
Applying the Framework
A few rules of thumb help put the framework into action. GMPP under 12 months are great,
and are acceptable up to about 18 months. After 18 months, however, the present value of
those cash flows way out in the future is harder to justify against the upfront acquisition
expense. For example, a GMPP of 36 months suggests that three years are required to break
even on the customer acquisition cost. So if monthly churn for that cohort is just 3%, these
customers will never be profitable because their lifetime is only 33.3 months against a 36 month
payback period; operators should redirect resources away from cohorts displaying this sub-par
performance. Alternatively, a GMPP of 12 months or less indicates tCAC is repaid within a year.
Assuming manageable churn, a company with such a short GMPP should be throwing fuel on
the fire and investing in efficient growth.
For rCAC benchmarks we like to see a return of at least 3x, with 5x and above being top
of the class. rCAC below 3x doesn’t leave much to cover operational expenses beyond the
acquisition expense and recurring COGS. Low rCAC means a company earns little over the life
of each customer and new customers have to be added quickly just to replace ones that churn.
Higher rCAC, on the other hand, provides more headroom to cover expenses and reinvestment.
Ultimately, realizing multiples of tCAC is how SaaS companies build enterprise value.
Turning to our example, we only have one non-organic acquisition channel with passing
economics – the Display channel with a GMPP of 11.7 months and an rCAC of 4.5x. As is often
the case, the organic channel has superior economics, but it’s hard to “invest” in this type of
customer acquisition.
12
# # #
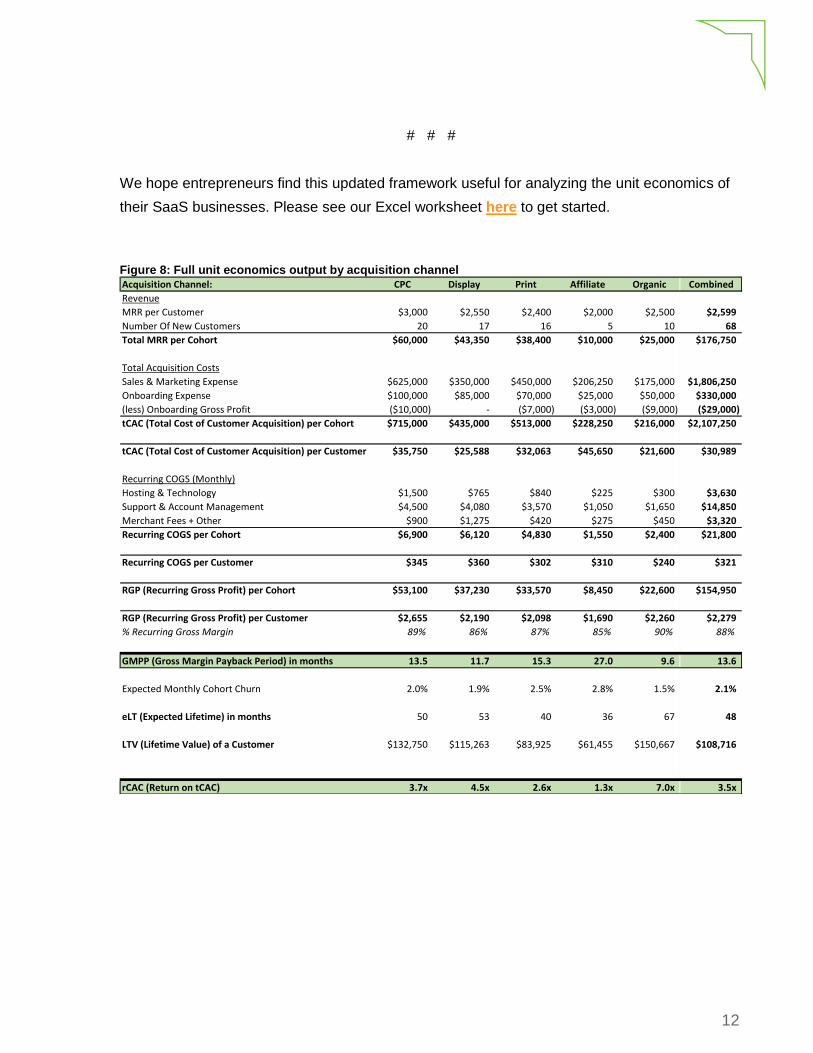
We hope entrepreneurs find this updated framework useful for analyzing the unit economics of
their SaaS businesses. Please see our Excel worksheet here to get started.
Figure 8: Full unit economics output by acquisition channel
Acquisition Channel: CPC Display Print Affiliate Organic Combined
Revenue
MRR per Customer $3,000 $2,550 $2,400 $2,000 $2,500 $2,599
Number Of New Customers 20 17 16 5 10 68
Total MRR per Cohort $60,000 $43,350 $38,400 $10,000 $25,000 $176,750
Total Acquisition Costs
Sales & Marketing Expense $625,000 $350,000 $450,000 $206,250 $175,000 $1,806,250
Onboarding Expense $100,000 $85,000 $70,000 $25,000 $50,000 $330,000
(less) Onboarding Gross Profit ($10,000) - ($7,000) ($3,000) ($9,000) ($29,000)
tCAC (Total Cost of Customer Acquisition) per Cohort $715,000 $435,000 $513,000 $228,250 $216,000 $2,107,250
tCAC (Total Cost of Customer Acquisition) per Customer $35,750 $25,588 $32,063 $45,650 $21,600 $30,989
Recurring COGS (Monthly)
Hosting & Technology $1,500 $765 $840 $225 $300 $3,630
Support & Account Management $4,500 $4,080 $3,570 $1,050 $1,650 $14,850
Merchant Fees + Other $900 $1,275 $420 $275 $450 $3,320
Recurring COGS per Cohort $6,900 $6,120 $4,830 $1,550 $2,400 $21,800
Recurring COGS per Customer $345 $360 $302 $310 $240 $321
RGP (Recurring Gross Profit) per Cohort $53,100 $37,230 $33,570 $8,450 $22,600 $154,950
RGP (Recurring Gross Profit) per Customer $2,655 $2,190 $2,098 $1,690 $2,260 $2,279
% Recurring Gross Margin 89% 86% 87% 85% 90% 88%
GMPP (Gross Margin Payback Period) in months 13.5 11.7 15.3 27.0 9.6 13.6
Expected Monthly Cohort Churn 2.0% 1.9% 2.5% 2.8% 1.5% 2.1%
eLT (Expected Lifetime) in months 50 53 40 36 67 48
LTV (Lifetime Value) of a Customer $132,750 $115,263 $83,925 $61,455 $150,667 $108,716
rCAC (Return on tCAC) 3.7x 4.5x 2.6x 1.3x 7.0x 3.5x