Upcoming Round 1.5. “Unconventionals”. Part I: Exploring contract terms and fiscal incentives...
26
Quinquennial Plan of bids, drilled shale wells and basins boundaries where tentative Shale blocks correspond to “Exploration” [6] . Modified from National Commission of Hydrocarbons - CNH. Nuevo Laredo Reynosa Piedras Negras Eagle Ford Sabinas Burgos Corpus Christi 2011-2013 Shale Wells Pimienta Eagle Ford
-
Upload
juan-diego-suarez-fromm -
Category
Business
-
view
225 -
download
1
Transcript of Upcoming Round 1.5. “Unconventionals”. Part I: Exploring contract terms and fiscal incentives...
Quinquennial Plan of bids, drilled shale wells and basins boundaries where tentative Shale blocks
correspond to “Exploration” [6]
. Modified from National Commission of Hydrocarbons - CNH.
Nuevo Laredo
Reynosa
Piedras Negras
Eagle FordSabinas
Burgos
Corpus Christi
2011-2013 Shale Wells
Pimienta
Eagle Ford

1
Upcoming Round 1.5. “Unconventionals”.
Part I: Exploring contract terms and fiscal
incentives for Shale gas development in Mexico.
Keywords: Round One, License Contract, profitability, royalty, government take,
Mexico Shale, Eagle Ford, Type well, shale technologies, National Infrastructure
Program, gas market.
For further details or full report please contact:
Juan Diego Suarez Fromm
Senior Reservoir Engineering Advisor
Mexico

2
“We require new strategies in the way we finance and manage shale gas/oil
projects. Shale gas eventually will become the main source of natural gas for
Mexico”. Dr. Edgar Rangel German.
3
0. Summary
Shale gas potential in Mexico has been identified by government, Mexican National Oil
Company - PEMEX, and international petroleum industry, as a great opportunity for
resources development in order to solve increasing natural gas demand.
Large gas pipeline extension and power generation projects have been launched and
others are on the way according to National Infrastructure Program. In the mid-term
U.S. gas exports are expected to continuously rise, which for some political parties is a
threat to Mexican energy independence.
The upcoming Round One bids for onshore fields will comprise Unconventional
resources including Shale Gas, Shale Oil and Chicontepec. The aim of this study is to
evaluate Shale Gas development profitability for different gas prices, costs and
royalties and more important to develop fiscal and contract incentives alternatives
based on geological trends, current well construction technologies, technical risks and
market risk.
In spite of Shale Gas Potential in Mexico and closeness to U.S. shale technologies and
human capital talent, current market conditions are not favourable for Shale Gas
development.
Basically are needed two conditions for building up the shale industry in Mexico: time
and fiscal incentives in order to mitigate market and technical risks.
Among several barriers, the following emerge as very relevant for shale development.
Low present and future prices.
The exploration and appraisal phases are time consuming; as well also it is the
cost optimization process and productivity enhancement.
Transport infrastructure requirements for the logistic of rigs and materials.
Shale industry is very capital intensive, where +90% of capital expenditures are
new wells.
Huge water resources availability for fracking.
Security issues in some places.
In this study, fiscal incentives are set by applying deductions in income taxes
permitted by “Hydrocarbon Revenue Law” [10].

4
Several economical models were run based on U.S. Eagle Ford development history;
showing that only marginal profitability is obtained under current market conditions;
even with fiscal incentives.
On the other hand, an optimistic case was run assuming well costs optimization and
more favourable sale prices; showing that fiscal incentives could be taken away.
Therefore, three general recommendations can be set for Shale gas development in
Mexico under license contracts.
1. Redefinition of contract periods: The “Exploration period” will replace
the “Evaluation Period”, which will be run before Development Period. During
the Exploration period, the Minimal Work Commitment must be fulfilled and the
operator will have the option for the continuing of operations or the end of the
contract.
2. Extension of Exploration Period: Instead of one year period, the exploration
phase will last about 5 years. During this period, operators are expected to
successfully apply well construction optimizations.
3. Fiscal incentives: During Exploration Period, all development capital
expenditures will be treated as Exploration expenditures, thus allowing 100%
deduction for income tax determination.
These fiscal incentives and contract terms or similar are strongly
recommended for Shale Gas Development in Mexico under License Contracts.
During the Exploration period, they will mitigate market and technical risks
for operators, allowing them to develop a learning curve regarding well
construction and project management in order to sustain future intensive
capital expenditures in the development period. During the second period,
where main field development takes place, incentives will no longer be
needed, favouring government income.

5
1. Introduction
1.1. The Grand Energy Transition
Robert Hefner published in 2009 “The Grand Energy Transition: THE RISE OF ENERGY
GASES, SUSTAINABLE LIFE AND GROWTH, AND THE NEXT GREAT ECONOMIC
EXPANSION”, where he states that gases will completely replace liquid and solid
carbon based fuels, leading to a low-carbon energy matrix (Chart 1).
In this transition natural gas is one link of this macro process, which presents many
advantages from technical and environmental point of view. Methane, and latterly
Propane and Butane are being used for transportation, which is a major Dioxide
Carbon generator when based on gasoline burn.
Chart 1. Energy matrix transition. From “The Grand Energy Transition”, Robert Hefner [1].

6
1.2. National market of natural gas Mexican natural gas demand has been increasing, averaging 1,4% since 2008
(Chart 2). Today, gas pipeline network covers 8,990 Km with 5,750 MMcf/d capacity,
over 19 states; and it is projected to expand 5,200 Km according National
Infrastructure Program 2014-2018 [2].
Chart 2. Mexican Gas demand by sector. From “Mexico’s new chapter in natural gas”, National
Commission of Hydrocarbons (CNH) [3].
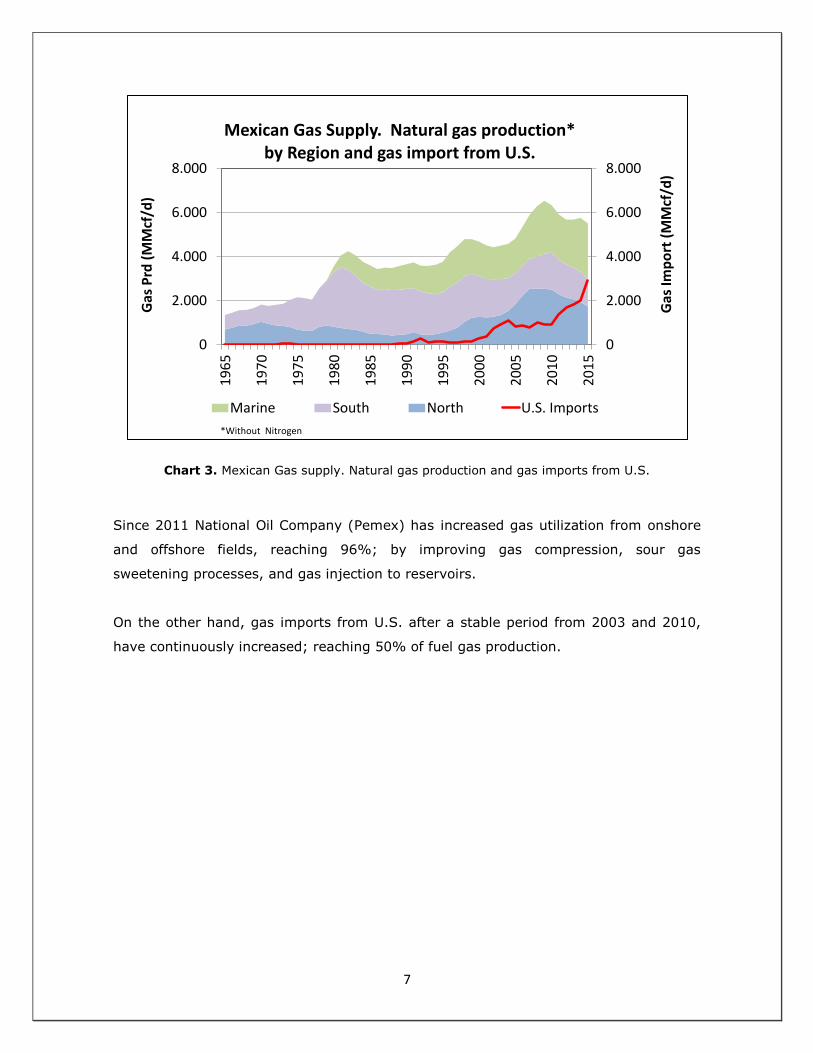
Gas production peaked in 2009, boosted by Marine and North regions. Since then it
has declined due to onshore fields depletion (Chart 3).
7
Chart 3. Mexican Gas supply. Natural gas production and gas imports from U.S.
Since 2011 National Oil Company (Pemex) has increased gas utilization from onshore
and offshore fields, reaching 96%; by improving gas compression, sour gas
sweetening processes, and gas injection to reservoirs.
On the other hand, gas imports from U.S. after a stable period from 2003 and 2010,
have continuously increased; reaching 50% of fuel gas production.
0
2.000
4.000
6.000
8.000
0
2.000
4.000
6.000
8.000
19
65
19
70
19
75
19
80
19
85
19
90
19
95
20
00
20
05
20
10
20
15
Gas
Imp
ort
(M
Mcf
/d)
Gas
Prd
(M
Mcf
/d)
Mexican Gas Supply. Natural gas production*by Region and gas import from U.S.
Marine South North U.S. Imports
*Without Nitrogen

8
1.3. Natural gas from North Mexico. Multiple Service Contracts in
Burgos
Natural gas plays a central role in North Mexico for power generation industry. The
Northwest region has high electric power consumption due to fans, air-conditioning,
refrigerators, and agricultural irrigation systems. And the Northeast has a vast
manufacture industry as steel, cement, chemical, and glass among others, very energy
demanding [2].
Mexican gas industry started in 1945 with the discovery of “Mision” field in Burgos
Basin. This basin is the main non associated natural gas resource in Mexico, extending
in the U.S. as “Rio Grande” basin. Located at Northwest, it develops over States of
Tamaulipas and Nuevo Leon, and covers 30,000 Km2 (Chart 4).
Chart 4. Petroleum provinces in Mexico. From “National Hydrocarbon Commission” (CNH).

9
Gas production stabilized in 600 MMcf/d between late 60’s and 70’s. In early 80’s it
declined steadily, reaching 200 MMcf/d in mid-90’s (Chart 5). In response to this
situation, PEMEX retook exploration and development, achieving production
enhancement to 1.000 MMcf/d by 2000. Even so, U.S. gas import continuously
increased, reaching 300 MMcf/d at 2000. Consequently, PEMEX called International Oil
Companies looking for private investment and knowhow. By 2003, PEMEX awarded 7
fields in Burgos basin, opening for first time the petroleum industry to private
operators, with “Multiple Service Contracts” (MSC). In the second (2004-2005) and
third call (2007), three additional blocks were awarded.
Chart 5. Gas supply in North Mexico. Burgos’s production and U.S. imports.
The MSC contracts allow Burgos production enhancement from 2005 to 2009, boosted
by high gas prices (Chart 6). By 2004 prices were around 6 usd/MMbtu (Henry Hub)
and 50 usd/bbl (West Texas Intermediate), being very attractive market conditions for
PEMEX, allowing profitable development for these service contracts.
0
500
1000
1500
2000
2500
3000
19
65
19
70
19
75
19
80
19
85
19
90
19
95
20
00
20
05
20
10
20
15
Gas
[M
Mcf
/d]
Gas supply in North Mexico.Burgos's production & U.S. imports
U.S. Imports Burgos's Nat Gas prd.
Sabinas development
Burgos new developments
(Pemex)
Burgos's COPFContracts

10
On the other hand, by late 2009, oil and gas prices were decoupled. Gas price dropped
from 13 usd/MMbtu in 2008 to 3 usd/MMbtu in 2009, staying between 2 and 4,5
usd/MMbtu since then. Therefore PEMEX decreased capital expenditures in Burgos, in
traditional fields and MSC contracts, and thus redirecting investment on condensate
fields.
Lately, oil price crisis directed PEMEX to cut off almost all capital expenditures in
Burgos, keeping only operation and maintenance budgets. This situation explains total
production decline since 2010.
Chart 6. Henry Hub and West Texas Intermediate prices.
0
2
4
6
8
10
12
14
16
18
20
0
20
40
60
80
100
120
140
160
180
200
19
95
20
00
20
05
20
10
20
15
He
nry
Hu
b [
USD
/MM
BTU
]
WTI
[U
SD/B
BL]
WTI & Henry Hub
WTI (USD/bbl) Henry Hub (usd/Mmbtu)
Burgos COPFContracts

11
1.4. The U.S. Shale boom
Shale resources have a long history; since War World Two, shale has been identified by
U.S. government as a future oil source. But it development had to wait until market
conditions incentivized by Federal government promoted the investigation of new
technologies that jointly triggered shale industry development (Chart 7). By 2000
shale production accounted for only 1.6 percent of total U.S. natural gas production,
while currently it accounts for 40 percent (Chart 8).
Chart 7. U.S. shale plays. From EIA.
12
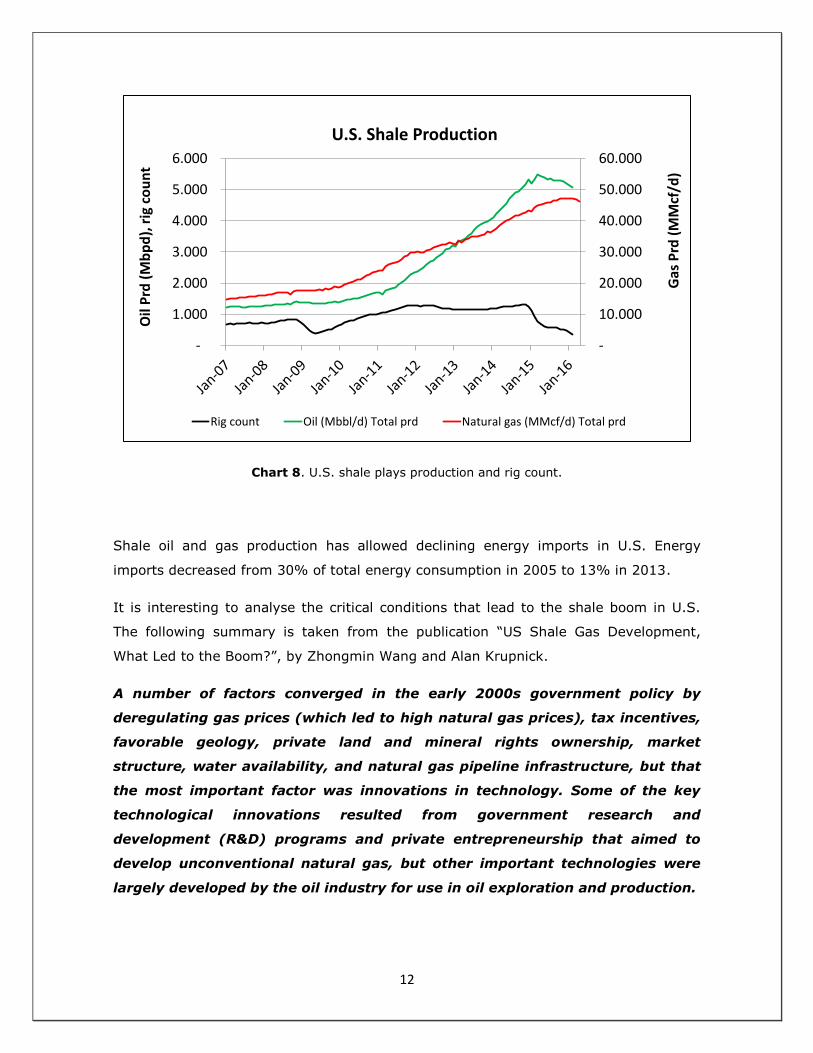
Chart 8. U.S. shale plays production and rig count.
Shale oil and gas production has allowed declining energy imports in U.S. Energy
imports decreased from 30% of total energy consumption in 2005 to 13% in 2013.
It is interesting to analyse the critical conditions that lead to the shale boom in U.S.
The following summary is taken from the publication “US Shale Gas Development,
What Led to the Boom?”, by Zhongmin Wang and Alan Krupnick.
A number of factors converged in the early 2000s government policy by
deregulating gas prices (which led to high natural gas prices), tax incentives,
favorable geology, private land and mineral rights ownership, market
structure, water availability, and natural gas pipeline infrastructure, but that
the most important factor was innovations in technology. Some of the key
technological innovations resulted from government research and
development (R&D) programs and private entrepreneurship that aimed to
develop unconventional natural gas, but other important technologies were
largely developed by the oil industry for use in oil exploration and production.
-
10.000
20.000
30.000
40.000
50.000
60.000
-
1.000
2.000
3.000
4.000
5.000
6.000
Gas
Prd
(M
Mcf
/d)
Oil
Prd
(M
bp
d),
rig
co
un
tU.S. Shale Production
Rig count Oil (Mbbl/d) Total prd Natural gas (MMcf/d) Total prd

13
The most important energy-related technological innovations were assessed
in 1980s and the 1990s, which included three technologies that are critical to
shale gas development: horizontal drilling, three-dimensional (3-D) seismic
imaging, and fracturing technology.
Horizontal Drilling. Few practical applications of horizontal drilling took place
until the early 1980s and it did not achieve commercial viability until the late
1980s.
Massive Hydraulic Fracturing. Agarwal et al. (1979, 172) note that MHF was
already “a proven technique for developing commercial wells in low-
permeability or ‘tight’ gas formations.” With financial assistance from DOE,
Mitchell Energy conducted in 1978 what was, at the time, the largest MHF in a
tight gas formation. Mitchell Energy quickly applied MHF to the Barnett shale.
3-D Seismic Imaging. Limited commercial application of 3-D seismic
technology began in the early 1980s (Haar 1992). 3-D seismic imaging
provides a better picture of the structure and properties of subsurface rocks
than the earlier two-dimensional (2-D) method.
Microseismic Fracturing Mapping. Since the early 2000s, microseismic frac
monitoring has played a key role in optimizing how shale gas wells are
hydraulically stimulated. Unlike 3-D seismic imaging, microseismic fracture
monitoring is a passive method that uses sensors to listen for underground
seismic energy and record the minor seismic events generated during the
fracturing of a nearby well. This technology can reveal the height, length,
orientation, and other attributes of induced fractures.
From “US Shale Gas Development, What Led to the Boom?”, by Zhongmin Wang and
Alan Krupnick.

14
1.5. Shale Resources in Mexico
Mexico’s shale resources hold fourth Global place according to World Shale Gas
Resources from U.S. Energy Information Administration publication (EIA) [4]
(Chart 9).
Chart 9. Worldwide shale resources, Proved Reserves and cumulative production. From
“Mexico’s new chapter in natural gas”, National Commission of Hydrocarbons (CNH) [3].

15
Mexico’s Shale potential is located in four onshore petroleum provinces, according to
EIA’s and PEMEX studies (Chart 10).
1. Burgos.
2. Sabinas.
3. Tampico-Misantla.
4. Veracruz.
The following information is taken from the book from EIA “Technically Recoverable
Shale, Oil and Shale Gas Resources in Mexico” [5].

16
Chart 10. Prospective shale basins in Mexico [5]
. From EIA.
According to EIA assessment, Burgos and Sabinas basins account with large Shale Gas
resources, while Shale Oil potential is located in Burgos and Tampico-Misantla basins.
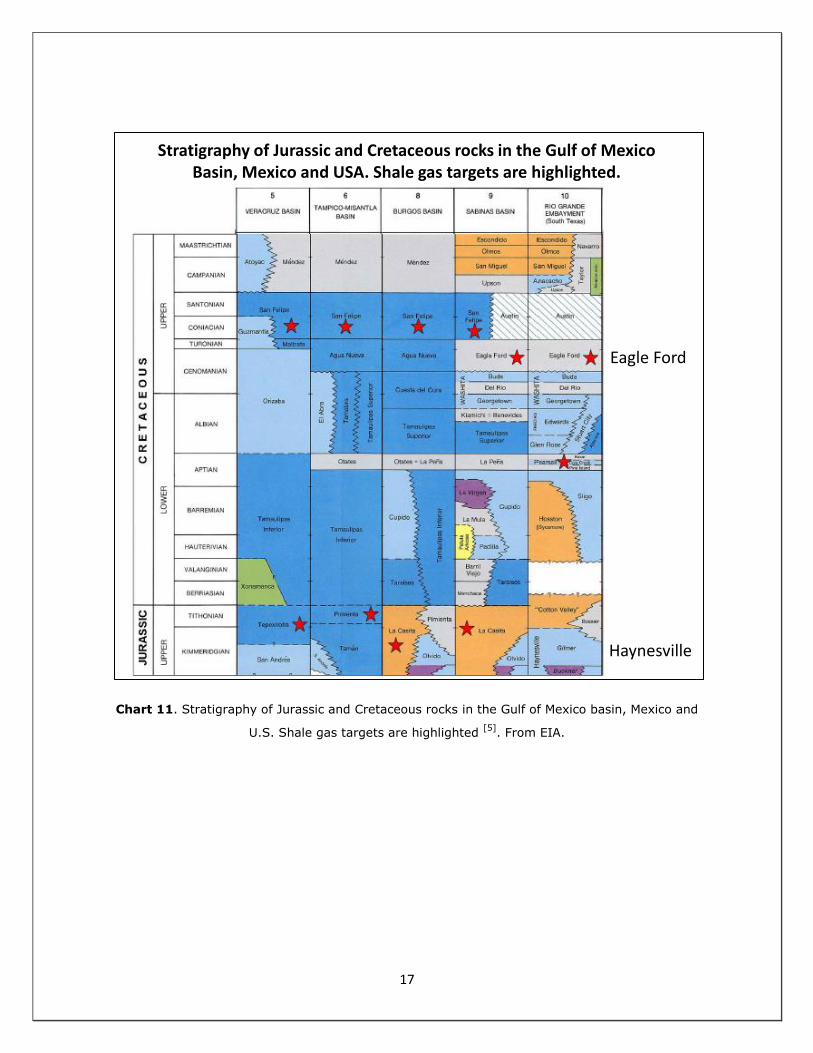
In Mexico two shale formations: Cretaceous “San Felipe” and Jurassic “Pimienta-La
Casita” are developed over these regions (Chart 11). They are organic rich marine
deposits with suitable thermal maturity, areal extension and good gross thickness.
They are main source rocks for conventional oil and gas fields in Mexican petroleum
provinces, and correlate with two U.S. Shale Plays: Cretaceous Eagle Ford and Jurassic
Haynesville.
17
Chart 11. Stratigraphy of Jurassic and Cretaceous rocks in the Gulf of Mexico basin, Mexico and
U.S. Shale gas targets are highlighted [5]
. From EIA.
Stratigraphy of Jurassic and Cretaceous rocks in the Gulf of Mexico Basin, Mexico and USA. Shale gas targets are highlighted.
Eagle Ford
Haynesville

18
About 14 shales wells have been drilled and tested in Burgos and Sabinas basins by
the National Oil Company - Pemex between 2011 and mid-2013, targeting Eagle Ford
and Pimienta formations. The rest of petroleum provinces have some indirect
antecedents from conventional wells, increasing the geological risk.
If U.S. Shale boom could be replicated in Mexico has not a straight forward answer.
Many barriers will be needed to overcome:
Low present and future oil and gas prices.
The exploration and appraisal phases are time consuming; as well also it is the
cost optimization process and productivity enhancement.
Transport infrastructure requirements for the logistic of rigs and materials.
Shale industry is very capital intensive, where +90% of capital expenditures are
new wells.
Huge water resources availability for fracking.
Security issues in some places.
From government point of view, some incentives should be set in order to promote
private interest in the upcoming bids of Unconventional resources.

19
2. Technical and economical assessment for Shale Gas development in
North Mexico. Evaluation of fiscal incentives for License Contracts.
2.1. Geological overview
Upcoming onshore bids will be the so called “Unconventionals”, which comprises Shale
Oil & Gas Exploration, and Chicontepec field development. The last is a tight oil Play,
and despite of it is not a shale formation same development technologies are applied.
This paper will be devoted to Shale Gas, which is located in Northern Burgos and
Sabinas basins.
The following chart shows Quinquennial Plan of bids [6], drilled shale wells and basins
boundaries where tentative Shale blocks correspond to “Exploration” (Opening
Chart).
Whereas Mexico’s marine-deposited shales appear to have good rock quality,
the geologic structure of its sedimentary basins often is considerably more
complex than in the U.S. Compared with the broad and gently dipping shale
belts of Texas and Louisiana, Mexico’s coastal shale zone is narrower, less
continuous and structurally more disrupted [5].
Regional compression and thrust faulting related to the formation of the
Sierra Madre Ranges have squeezed Mexico’s coastal plain, creating a series
of discontinuous sub-basins. Many of Mexico’s largest conventional oil and
gas fields also occur in this area, producing from conventional sandstone
reservoirs of Miocene and Pliocene age that were sourced by deep, organic-
rich and thermally mature Jurassic and Cretaceous-age shales. These deep
source rocks are the principal targets for shale gas/oil exploration in Mexico
[5].
From U.S. Energy Information Administration - EIA, “Technically Recoverable Shale, Oil
and Shale Gas Resources in Mexico”, September 2015.

20
Chart 12. Burgos and Sabinas basins. Structural and geological features. Drilled shale wells
2011-2013. Modified from PEMEX.
Burgos
2011-2013 Shale Wells
Eagle Ford
Piedras NegrasB
B’
Sabinas
Salt Dome
Thrust fault
Anticline
Pimienta
Eagle Ford

21
Chart 13. General Cross section Burgos and Sabinas basins [7]
.
2.2. Main evaluation assumptions
Some assumptions were made for shale gas development evaluation in Mexico.
Economical evaluation will be based on “Eagle Ford” formation:
The “Eagle Ford” has been developed in U.S. over last 10 years. Public
information is available for evaluation of production performance and costs.
“Eagle Ford” is the main shale target regarding EIA evaluation.
Expected shale blocks distribution will favour Eagle Ford development, mainly
for gas development.
In spite of shale gas potential for “Pimienta – La Casita”, for simplicity this evaluation
will only cover “Eagle Ford” development.
To sum up, only “Eagle Ford” development will be evaluated assuming natural
gas window for shale blocks to be auctioned.
B B’
BurgosBasin
SabinasBasin
La CasitaPimienta
Terciary

22
2.3. Main evaluation results
Main evaluation results are presented in the following charts.
Income tax deductions play a very relevant role for shale development profitability
under License Contracts. The Base Case needs them in order to achieve a profitable
case. In this scenario all development capital expenditures are considered as
Exploration capital expenditures, thus generating an income tax deduction of 100%.
Chart 14. Gas production profile for Base Case. The economic limit is 0,2 MMcf/d per well.
Chart 15. Capital and Operation Expenditure’s for Base Case. The economic limit is 0,2
MMcf/d per well.
0
20
40
60
80
0 1 2 3 4 5 6 7 8 9 10 11 12
[MM
pc/
d]
year
Gas production profile for Base Case
G Inc MMpc/d G Base MMpc/d
-100,00
-80,00
-60,00
-40,00
-20,00
0,00
0 1 2 3 4 5 6 7 8 9 10 11 12 13
[MM
usd
/ye
ar]
Year
Capital & Operation Expenditure's for Base Case
CAPEX [Mmusd/year] OPEX [Mmusd/year]

23
Chart 16. Sensibility analysis results for Shale gas development with License Contract.
Reference case is Base case (3 usd/MMbtu, 60 usd/bbl and additional royalty 5%). Income
Tax deductions treatment for development capital expenditures: Exploration -100%
deductible.

24
Chart 17. Sensibility analysis results for Shale gas development with License Contract.
Percentages represent variations respect to Base Case. Reference case is Base case (3
usd/MMbtu, 60 usd/bbl and additional royalty 5%). Income Tax deductions treatment for
development capital expenditures: Exploration -100% deductible.

25
4. References
1. Hefner III, Robert. “The Grand Energy Transition: THE RISE OF ENERGY GASES,
SUSTAINABLE LIFE AND GROWTH, AND THE NEXT GREAT ECONOMIC EXPANSION”,
WILEY, 2009.
2. Presidencia de los Estados Unidos Mexicanos. “National Infrastructure Program
2014-2018”, “Programa Nacional de Infraestructura 2014 – 2018”, December 2015
3. Rangel Germán, Edgar. “Mexico’s new chapter in natural gas”, National Commission
of Hydrocarbons (CNH), 16th Mexican Energy Conference, November 13-14, 2012,
Houston, Texas.
4. U.S. Energy Information Administration. “World Shale Gas Resources: An Initial
Assessment of 14 Regions Outside the United States”, April 2011.
5. U.S. Energy Information Administration. “Technically Recoverable Shale, Oil and
Shale Gas Resources in Mexico”, September 2015.
6. National Hydrocarbon Comission - CNH. “Quinquenial Program of Bids for
Exploration and Production– 2015-2019”, “Plan Quinquenal de Licitaciones para la
Exploracion y Extraccion de Hidrocarburos. 2015-2019”, 2014.
7. Dyer, M.J. and Bartolini, C. “Sabinas Basin Lower Cretaceous to Jurassic
Production—Comparison to South Texas Equivalents”. IHS Energy
8. Hughes, David. “DRILLING DEEPER: A REALITY CHECK ON U.S. GOVERNMENT
FORECASTS FOR A LASTING TIGHT OIL & SHALE GAS BOOM, PART 2: TIGHT OIL”,
post carbon institute.
9. U.S. Energy Information Administration. “Annual Energy Outlook 2015, with
projections to 2040”, April 2015.
10. Cámara de Diputados del Honorable Congreso de la Unión. “Mexican Hydrocarbon
Revenue Law”, “Ley de Ingresos sobre Hidrocarburos”.