Up-date on Nitrogen BMP Efforts with Tomato Production...
36
Up Up - - date on Nitrogen BMP Efforts with date on Nitrogen BMP Efforts with Tomato Production in Florida Tomato Production in Florida Monica Ozores Monica Ozores - - Hampton, Eric Simonne, Eugene McAvoy Hampton, Eric Simonne, Eugene McAvoy, Phil Stansly Phil Stansly , , Sanjay Shukla, Pam Roberts, Fritz Roka, Sanjay Shukla, Pam Roberts, Fritz Roka, Kent Cushman, Darrin Parmenter, Phyllis Gilreath and Kent Cushman, Darrin Parmenter, Phyllis Gilreath and Tom Obreza. Tom Obreza.
Transcript of Up-date on Nitrogen BMP Efforts with Tomato Production...

UpUp--date on Nitrogen BMP Efforts with date on Nitrogen BMP Efforts with Tomato Production in FloridaTomato Production in Florida
Monica OzoresMonica Ozores--Hampton, Eric Simonne, Eugene McAvoyHampton, Eric Simonne, Eugene McAvoy, Phil StanslyPhil Stansly, , Sanjay Shukla, Pam Roberts, Fritz Roka, Sanjay Shukla, Pam Roberts, Fritz Roka, Kent Cushman, Darrin Parmenter, Phyllis Gilreath and Kent Cushman, Darrin Parmenter, Phyllis Gilreath and
Tom Obreza.Tom Obreza.

Thanks, Thanks and Thanks to the “tomato growers” their
high level of engagement created a popular BMP program

BMP BackgroundBMP BackgroundU.S Federal Clean Water Act of 1977 U.S Federal Clean Water Act of 1977 required that States assess the impact of required that States assess the impact of nonnon--point source of pollution on surface and point source of pollution on surface and ground water and establish programs to ground water and establish programs to minimize them.minimize them.Section 303 (d) required States to identify Section 303 (d) required States to identify impaired water bodies and establish Total impaired water bodies and establish Total Maximum Daily Loads (TMDL) for pollutants Maximum Daily Loads (TMDL) for pollutants entering these water bodiesentering these water bodies

BMP BackgroundBMP BackgroundAs a response to the federal TMDL As a response to the federal TMDL mandate, the Florida legislature passed mandate, the Florida legislature passed the Florida Watershed Restoration Act. the Florida Watershed Restoration Act. The legislation gave the Florida The legislation gave the Florida Department of Agriculture and Department of Agriculture and Consumer Services (FDACS) the Consumer Services (FDACS) the authority to develop BMP (Best authority to develop BMP (Best management Practices) to reduce management Practices) to reduce pollutants loads in target watershed.pollutants loads in target watershed.

BMP for VegetablesBMP for VegetablesDACS. DACS. ‘‘The BMP manual for The BMP manual for
vegetable and agronomic vegetable and agronomic crops grown in Florida has crops grown in Florida has been adopted by reference been adopted by reference and by rule 5Mand by rule 5M--8 of the 8 of the Florida Administrative code Florida Administrative code on February 9, 2006.on February 9, 2006.’’
DACS webDACS web--site:site:www.Floridaagwaterpolicy.comwww.Floridaagwaterpolicy.com
The BMP program is The BMP program is ““voluntaryvoluntary””
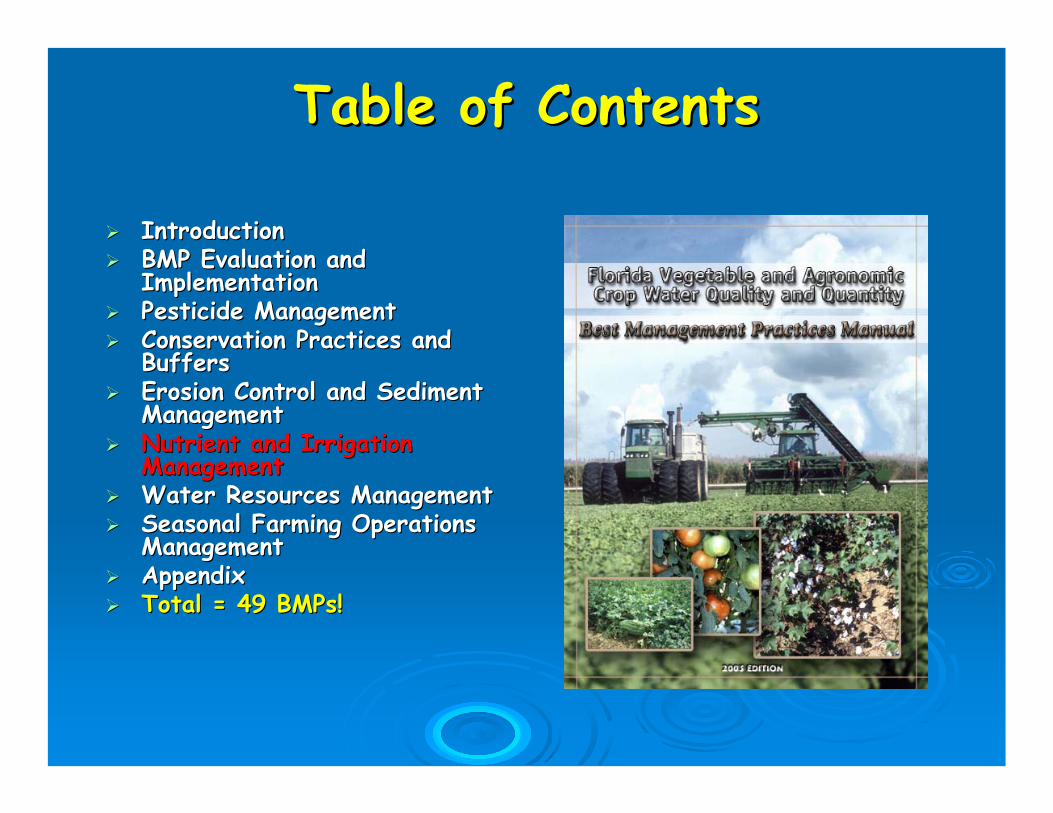
Table of ContentsTable of Contents
IntroductionIntroductionBMP Evaluation and BMP Evaluation and ImplementationImplementationPesticide ManagementPesticide ManagementConservation Practices and Conservation Practices and BuffersBuffersErosion Control and Sediment Erosion Control and Sediment ManagementManagementNutrient and Irrigation Nutrient and Irrigation ManagementManagementWater Resources ManagementWater Resources ManagementSeasonal Farming Operations Seasonal Farming Operations ManagementManagementAppendixAppendixTotal = 49 BMPs!Total = 49 BMPs!

Nutrient and Irrigation Management Nutrient and Irrigation Management BMPBMP’’ss
Optimum fertilizer management/application (33)Optimum fertilizer management/application (33)
1. Use UF/IFAS (200 lb/acre) or reputable published 1. Use UF/IFAS (200 lb/acre) or reputable published fertilizer recommendation.fertilizer recommendation.
2. If UF/IFAS rates are exceeded, 2. If UF/IFAS rates are exceeded, ‘‘grower are expected grower are expected to employ additional nutrient and irrigation BMPto employ additional nutrient and irrigation BMP’’s to s to negate possible environmental impactsnegate possible environmental impacts’’ (A(A--8)8)
3. 3. ‘‘For farming operations in significantly impaired basins For farming operations in significantly impaired basins caused by nutrients, growers must strictly adhere to all caused by nutrients, growers must strictly adhere to all recommendations set forth by the Basin Management recommendations set forth by the Basin Management Action PlanAction Plan’’
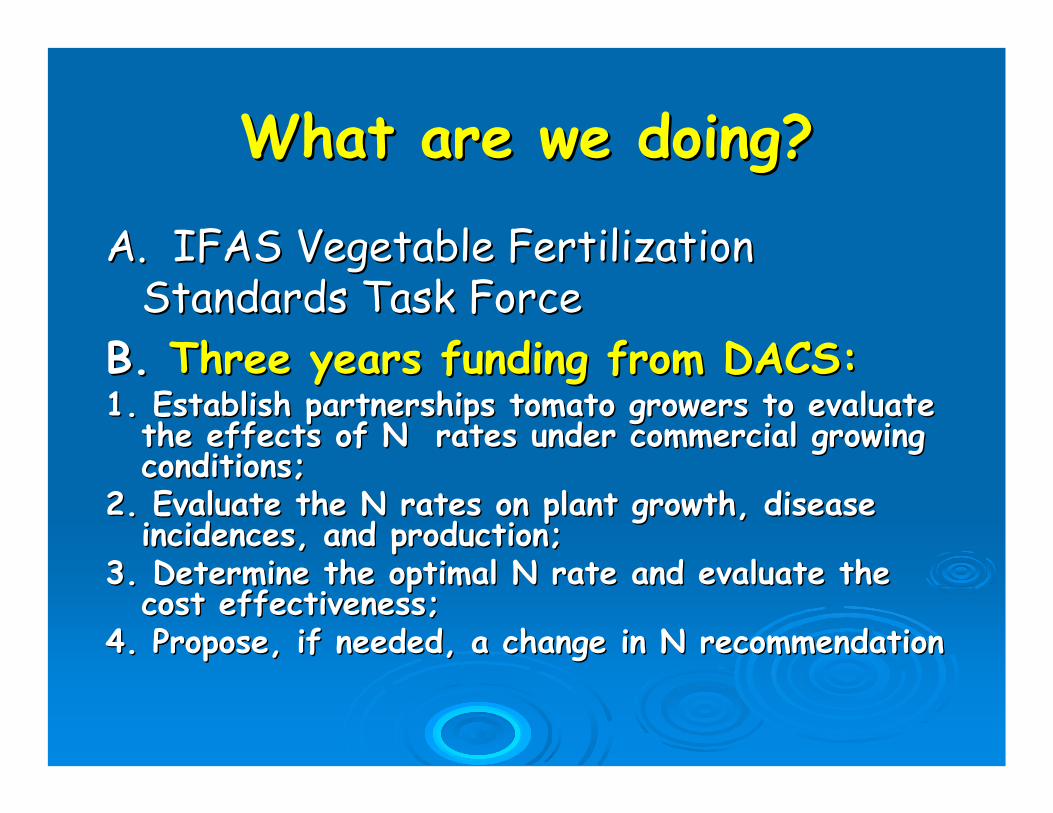
What are we doing?What are we doing?
A. IFAS Vegetable Fertilization A. IFAS Vegetable Fertilization Standards Task ForceStandards Task Force
B.B. Three years funding from DACS: Three years funding from DACS: 1. Establish partnerships tomato growers to evaluate 1. Establish partnerships tomato growers to evaluate
the effects of N rates under commercial growing the effects of N rates under commercial growing conditions;conditions;
2. Evaluate the N rates on plant growth, disease 2. Evaluate the N rates on plant growth, disease incidences, and production;incidences, and production;
3. Determine the optimal N rate and evaluate the 3. Determine the optimal N rate and evaluate the cost effectiveness;cost effectiveness;
4. Propose, if needed, a change in N recommendation4. Propose, if needed, a change in N recommendation
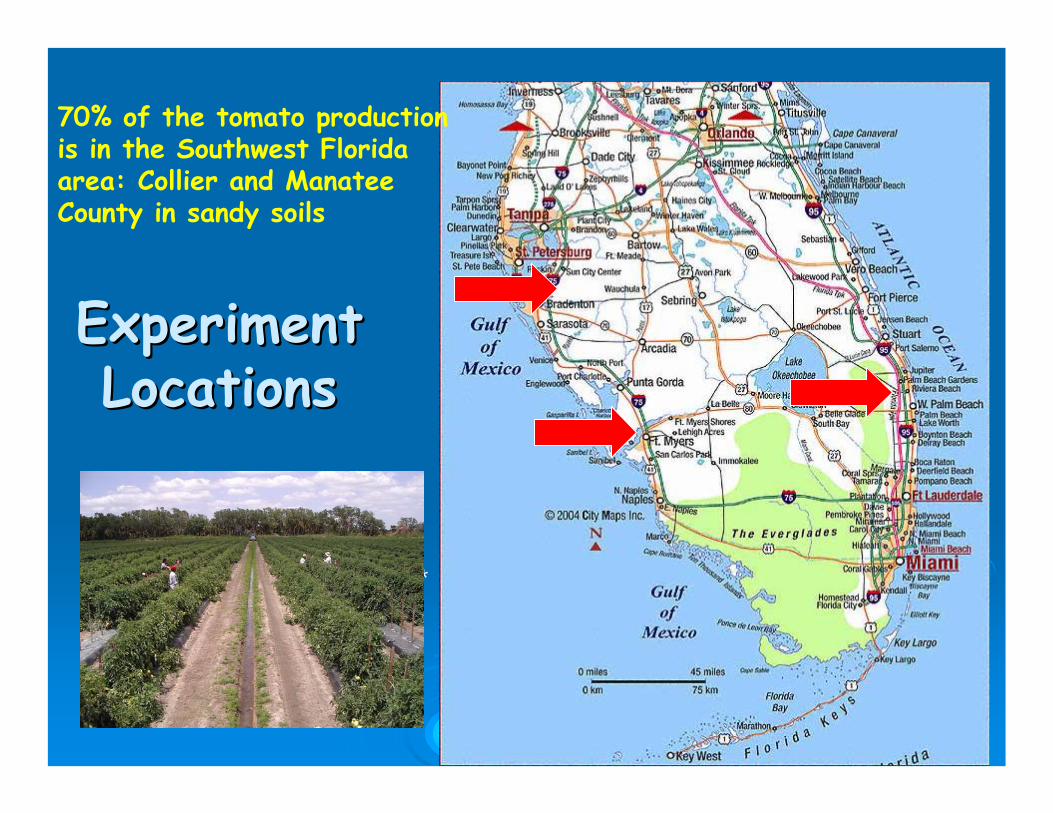
Experiment Experiment LocationsLocations
*
70% of the tomato production is in the Southwest Florida area: Collier and Manatee County in sandy soils
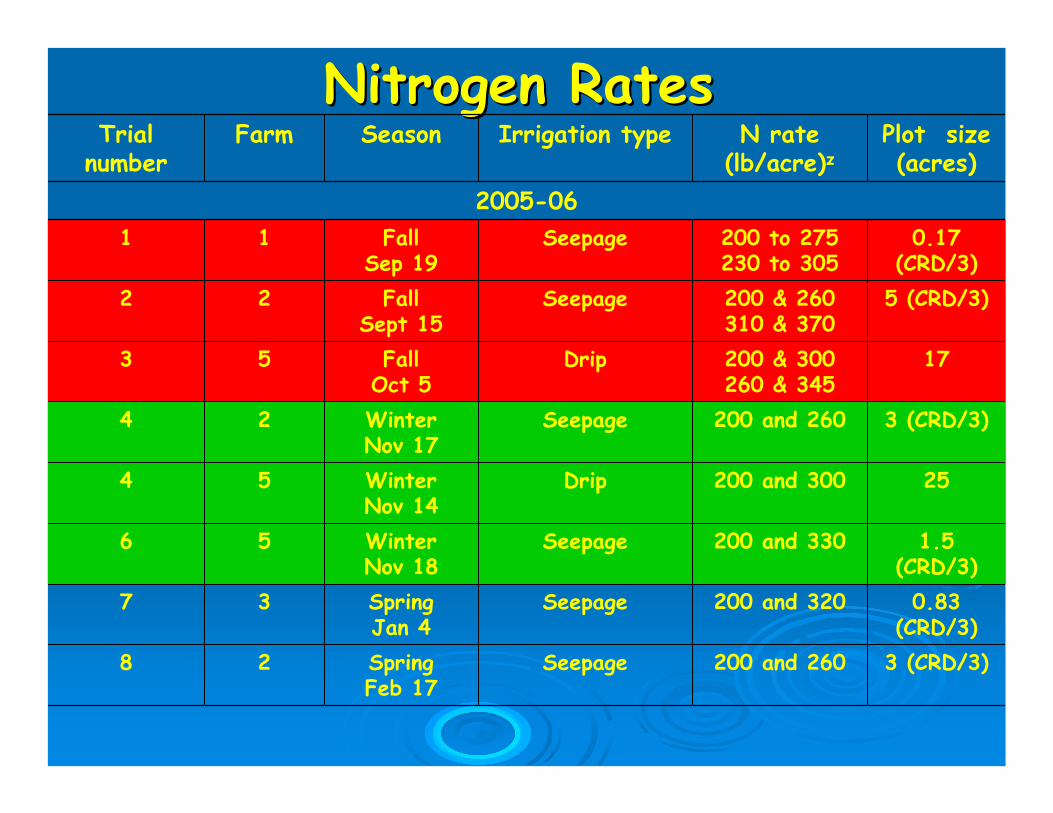
Nitrogen RatesNitrogen Rates
3 (CRD/3)200 and 260SeepageSpringFeb 17
2 8
0.83(CRD/3)
200 and 320SeepageSpringJan 4
3 7
1.5(CRD/3)
200 and 330SeepageWinterNov 18
5 6
25200 and 300DripWinterNov 14
5 4
3 (CRD/3)200 and 260SeepageWinterNov 17
2 4
17200 & 300260 & 345
DripFallOct 5
5 3
5 (CRD/3)200 & 260310 & 370
SeepageFallSept 15
2 2
0.17 (CRD/3)
200 to 275230 to 305
SeepageFallSep 19
1 12005-06
Plot size (acres)
N rate (lb/acre)z
Irrigation typeSeasonFarmTrial number
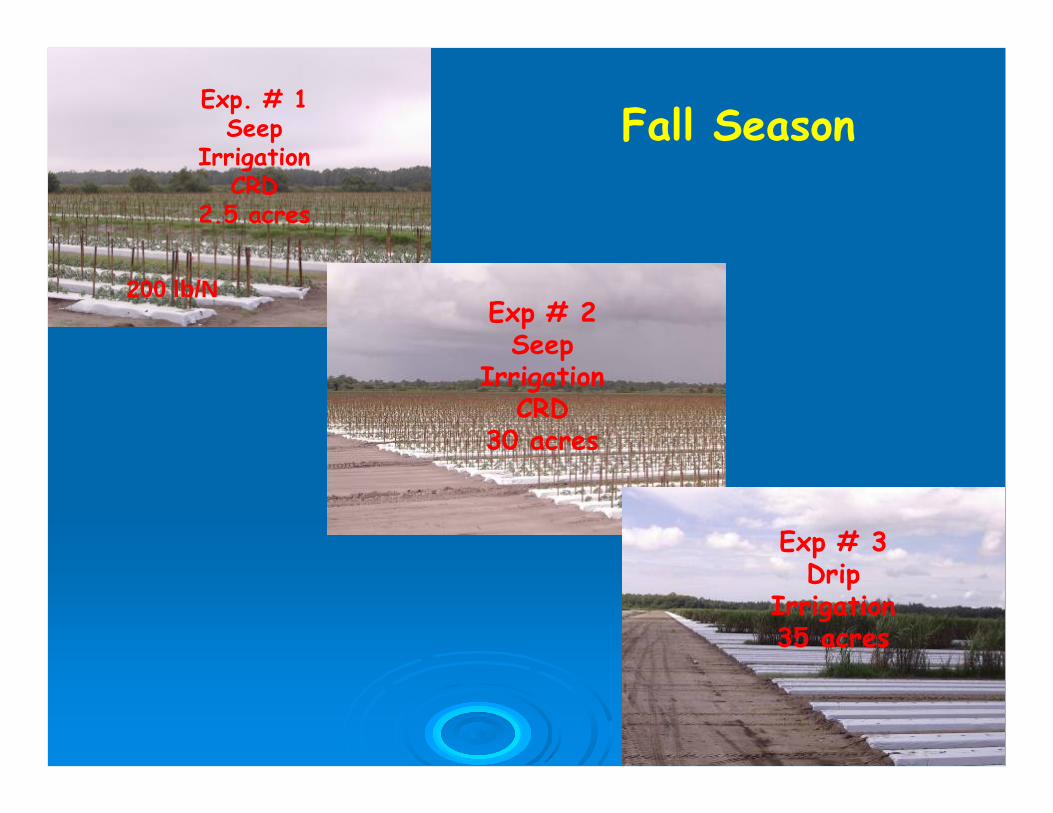
Exp. # 1Seep
IrrigationCRD
2.5 acres
200 lb/NExp # 2Seep
Irrigation CRD
30 acres
Exp # 3Drip
Irrigation35 acres
Fall Season
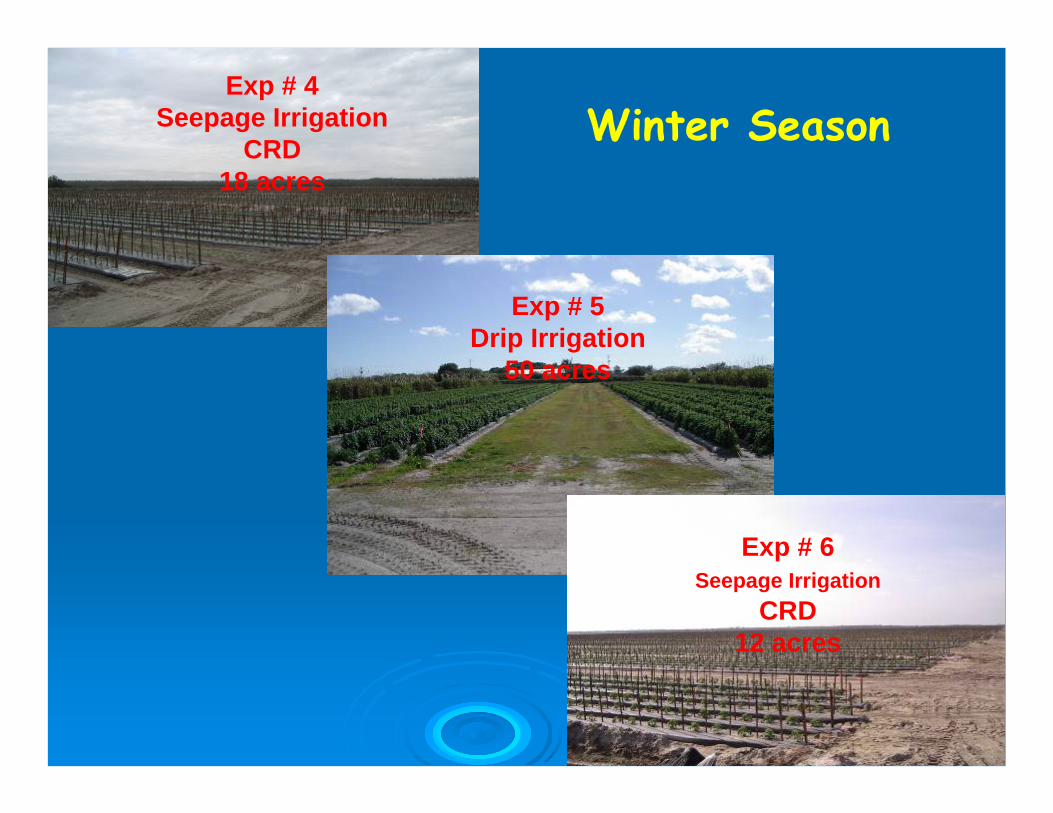
Exp # 4Seepage Irrigation
CRD18 acres
Exp # 5Drip Irrigation
50 acres
Exp # 6Seepage Irrigation
CRD12 acres
Winter Season

Exp # 7Seepage Irrigation
CRD6 acres
Exp # 8Seepage Irrigation
CRD18 acres
Spring Season
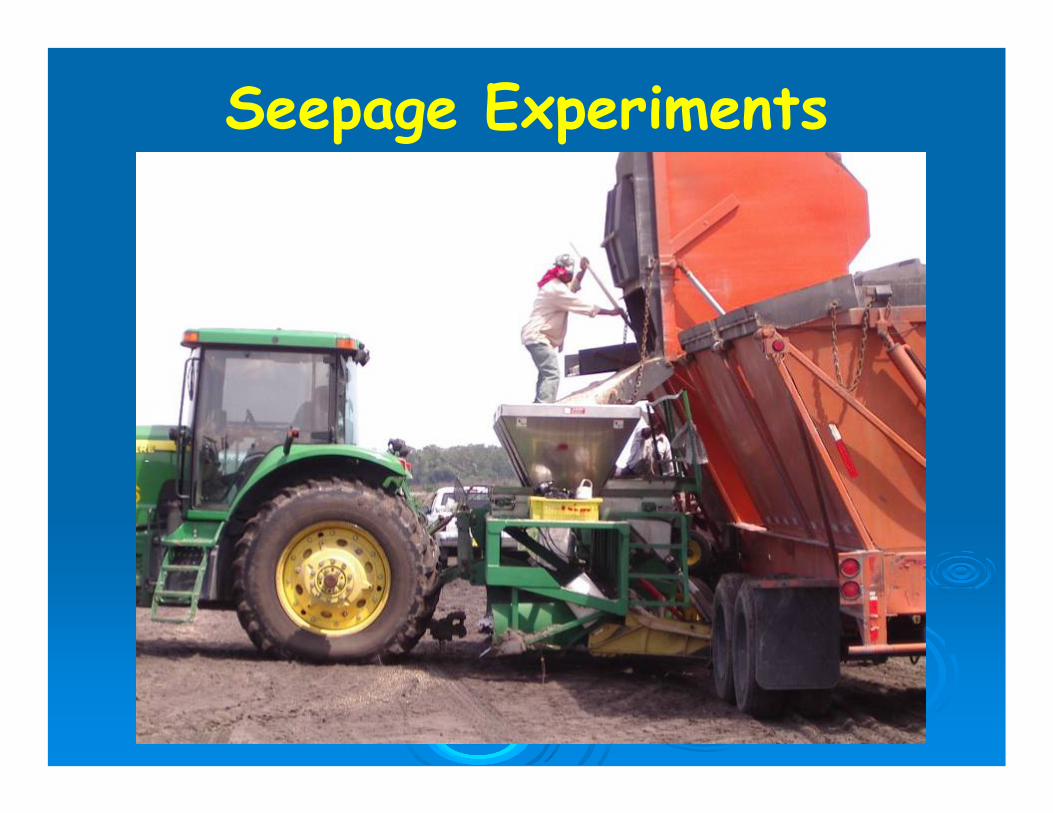
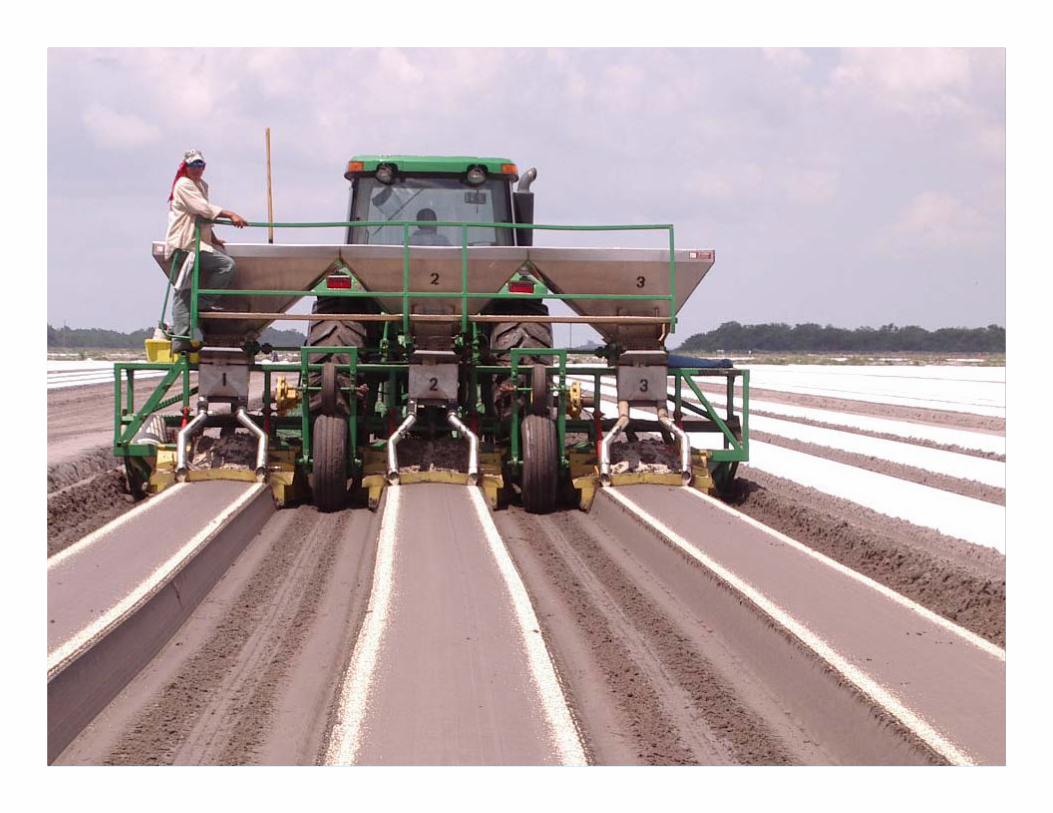
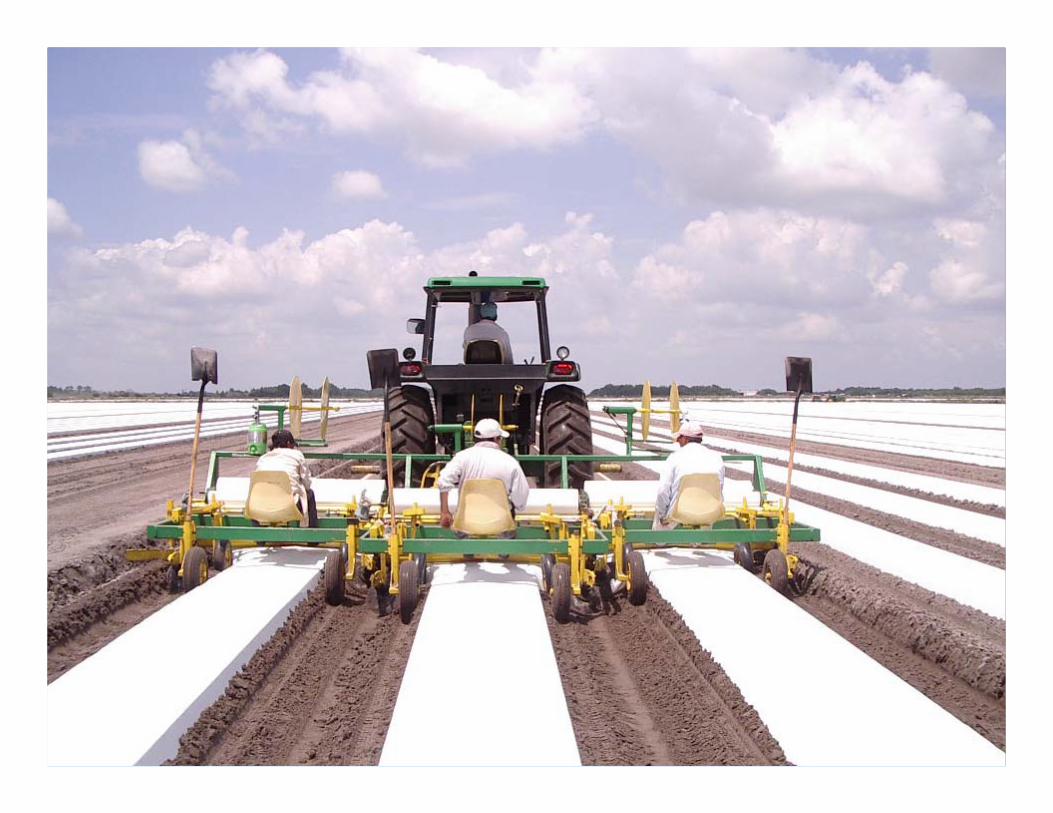
Seepage Experiments

2-12 plots per treatment with 3 reps10 plants per plot
Sap Nitrate- NO3- K
Wells-Water Tables
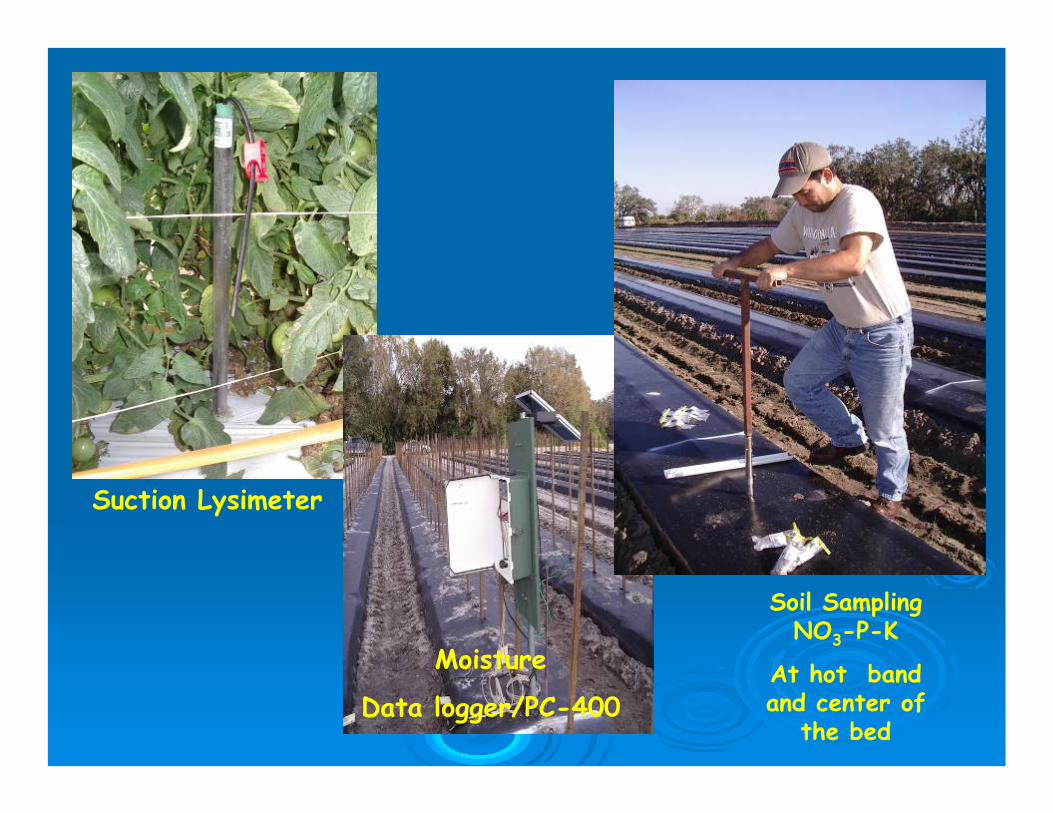
Suction Lysimeter
Moisture
Data logger/PC-400
Soil Sampling NO3-P-K
At hot band and center of
the bed

Three Harvest 5/6, 6/6, 6/7 and culls
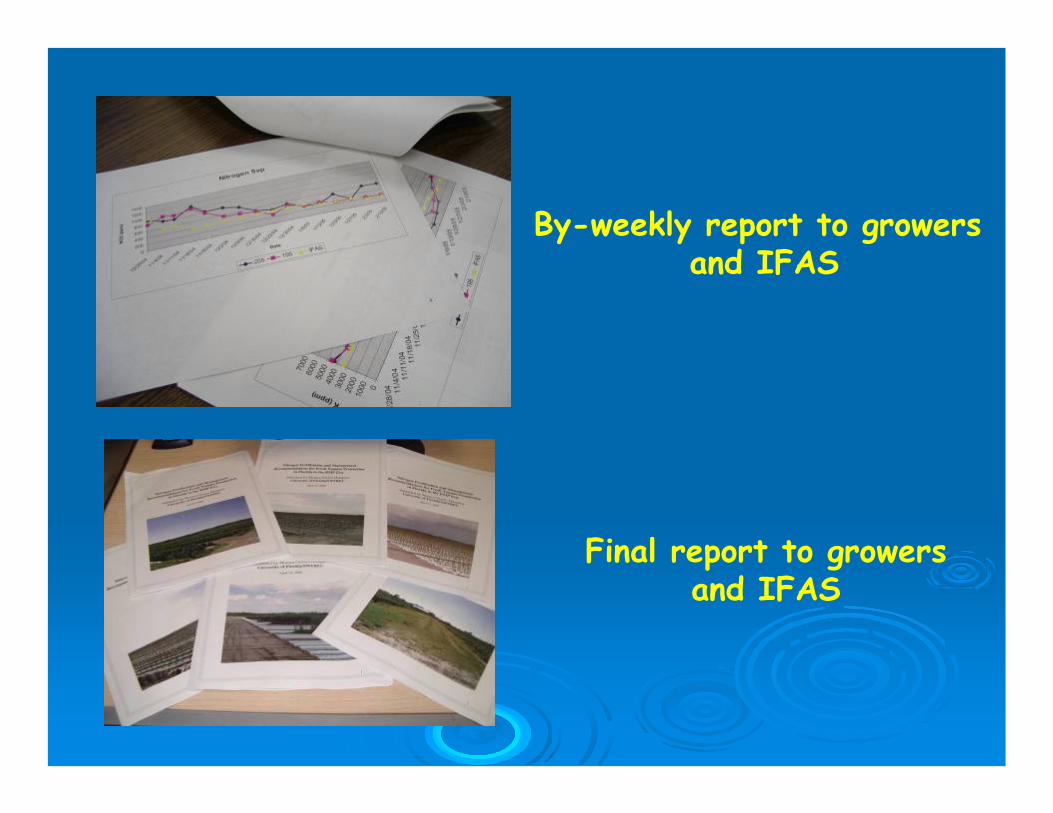
By-weekly report to growers and IFAS
Final report to growers and IFAS

Results and Discussions
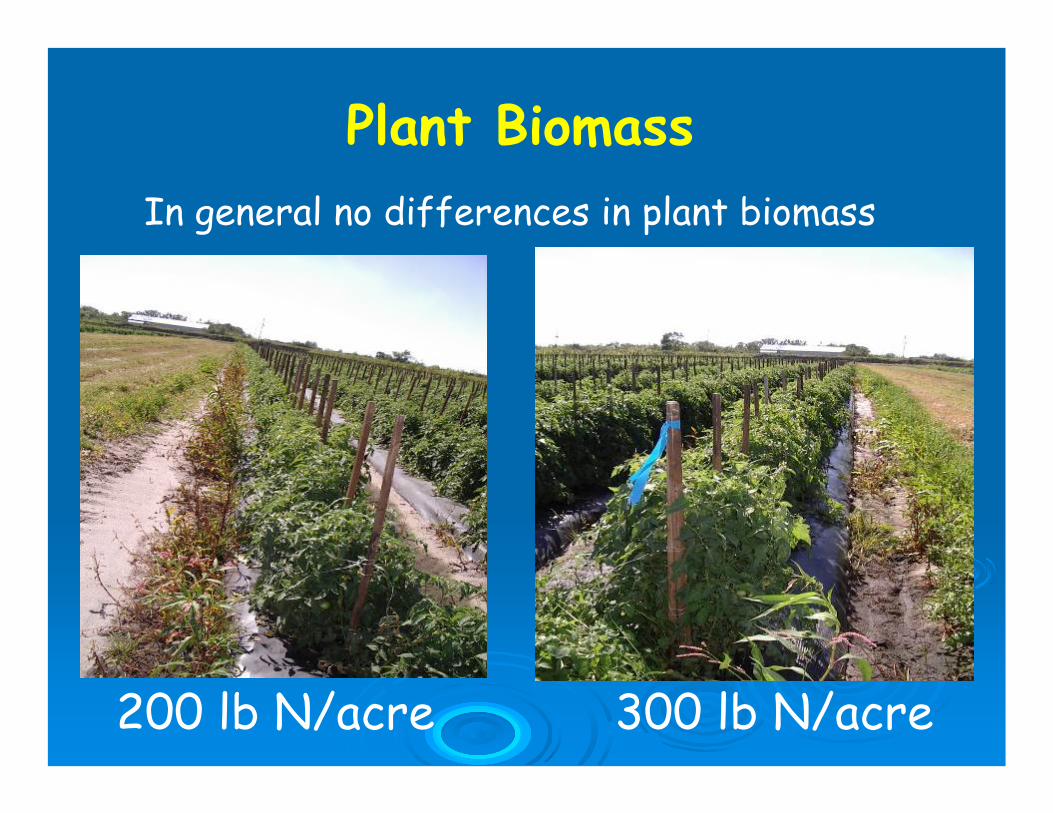
200 lb N/acre 300 lb N/acre
Plant BiomassIn general no differences in plant biomass
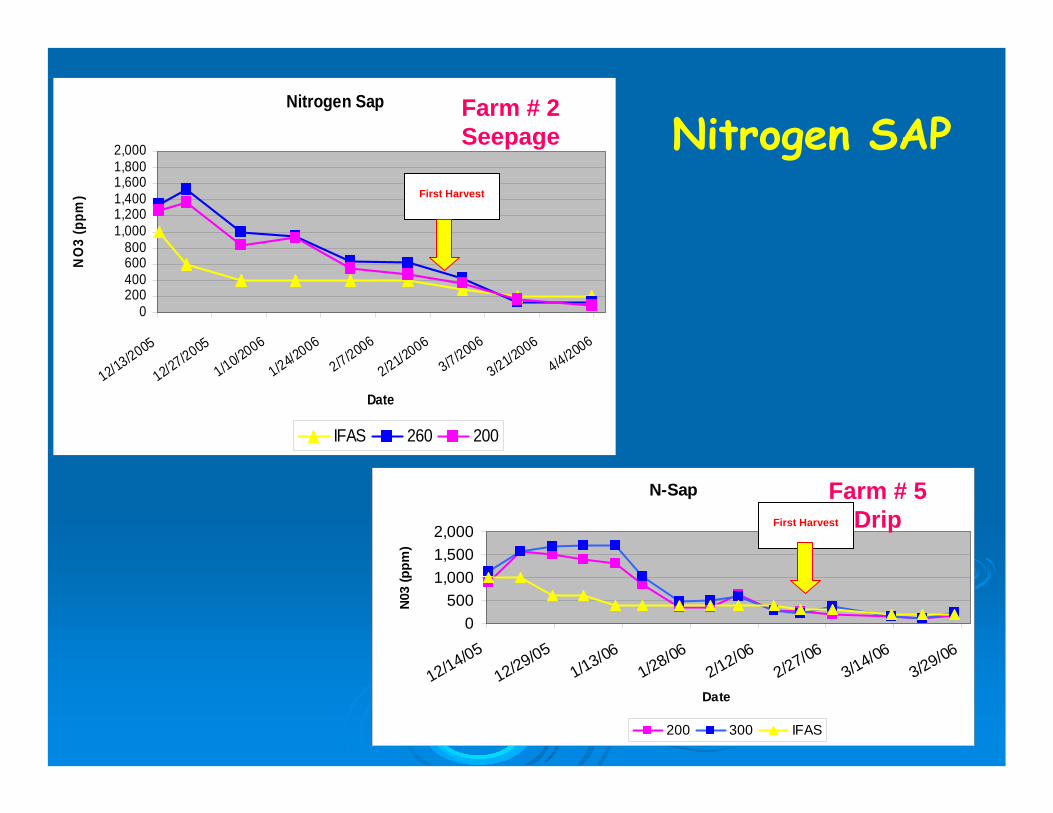
Nitrogen Sap
0200400600800
1,0001,2001,4001,6001,8002,000
12/13/2005
12/27/2005
1/10/2006
1/24/2006
2/7/2006
2/21/2006
3/7/2006
3/21/2006
4/4/2006
Date
NO
3 (p
pm)
IFAS 260 200
First Harvest
Nitrogen SAPFarm # 2Seepage
N-Sap
0500
1,0001,5002,000
12/14/0512/29/05
1/13/061/28/06
2/12/062/27/06
3/14/063/29/06
Date
N03
(ppm
)
200 300 IFAS
First Harvest
Farm # 5Drip
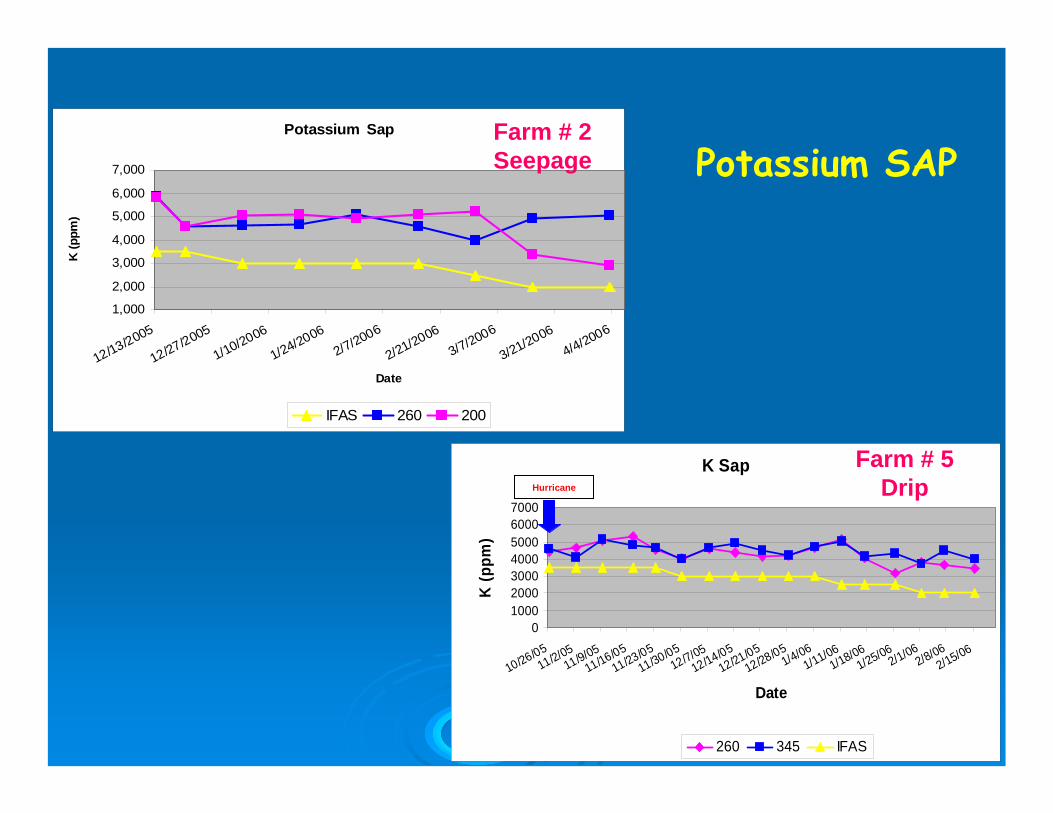
Potassium Sap
1,000
2,000
3,000
4,000
5,000
6,000
7,000
12/13/2005
12/27/2005
1/10/2006
1/24/20062/7/2006
2/21/20063/7/2006
3/21/20064/4/2006
Date
K (p
pm)
IFAS 260 200
K Sap
01000200030004000500060007000
10/26/0511/2/05
11/9/0511/16/05
11/23/0511/30/05
12/7/0512/14/05
12/21/0512/28/05
1/4/061/11/06
1/18/061/25/06
2/1/062/8/06
2/15/06
Date
K (p
pm)
260 345 IFAS
Hurricane
Potassium SAPFarm # 2Seepage
Farm # 5Drip
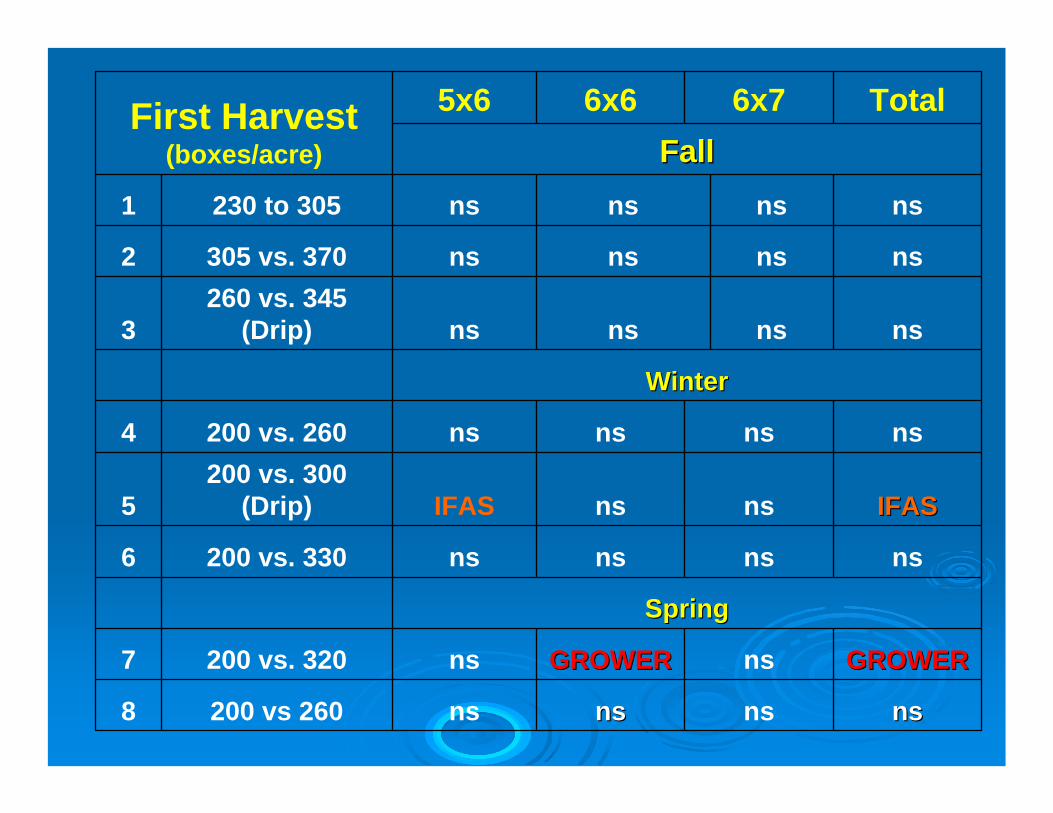
GROWERGROWERnsGROWERGROWERns200 vs. 3207
nsnsnsnsnsns200 vs 2608
SpringSpring
nsnsnsns200 vs. 3306
IFASIFASnsnsIFAS200 vs. 300
(Drip)5
nsnsnsns200 vs. 2604
WinterWinter
nsnsnsns260 vs. 345
(Drip)3
nsnsnsns305 vs. 3702
nsnsnsns230 to 3051
FallFallTotal6x76x65x6First Harvest
(boxes/acre)

nsnsnsnsGROWERGROWERnsns200 vs. 320200 vs. 32077
nsnsGROWERGROWERnsnsIFASIFAS200 vs 260200 vs 26088
SpringSpringnsnsnsnsnsnsnsns200 vs. 330200 vs. 33066
nsnsnsnsnsnsnsns200 vs. 300 (Drip)200 vs. 300 (Drip)55
nsnsnsnsnsnsnsns200 vs. 260200 vs. 26044
WinterWinternsnsnsnsnsnsnsns260 vs. 345 (Drip)260 vs. 345 (Drip)33
nsnsnsnsnsnsIFASIFAS305 vs. 370305 vs. 37022
nsnsnsnsnsnsnsns230 to 305230 to 30511
FallFall
TotalTotal6x76x76x66x65x65x6Second Second HarvestHarvest
(boxes/acre)(boxes/acre)

GROWERGROWERGROWERGROWERGROWERGROWERGROWERGROWER200 vs. 320200 vs. 32077
nsnsnsnsnsnsnsns200 vs 260 200 vs 260 88
SpringSpringnsnsnsnsnsnsnsns200 vs. 330200 vs. 33066
GROWERGROWERGROWERGROWERnsnsnsns200 vs. 300 200 vs. 300
(Drip)(Drip)55
GROWERGROWERGROWERGROWERGROWERGROWERnsns200 vs. 260200 vs. 26044
WinterWinternsnsnsnsnsnsnsns
260 vs. 345 260 vs. 345 (Drip)(Drip)33
nsnsnsnsnsnsns305 vs. 370305 vs. 37022
nsnsnsnsnsnsnsns230 to 305230 to 30511
FallFallTotalTotal6x76x76x66x65x65x6Third HarvestThird Harvest
(boxes/acre)(boxes/acre)

GROWERGROWERGROWERGROWERGROWERGROWERnsns200 vs. 320200 vs. 32077
nsnsnsnsnsnsIFAS200 vs 260200 vs 26088
SpringSpringnsnsnsnsnsnsnsns200 vs. 330200 vs. 33066
nsnsGROWERGROWERnsnsIFAS200 vs. 300 (Drip)200 vs. 300 (Drip)55
nsnsnsnsnsnsnsns200 vs. 260200 vs. 26044
WinterWinternsnsnsnsnsnsnsns260 vs. 345 (Drip)260 vs. 345 (Drip)33
nsnsGROWERGROWERnsnsnsns305 vs. 370305 vs. 37022
nsnsnsnsnsnsnsns230 to 305230 to 30511
FallFallTotalTotal6x76x76x66x65x65x6Total HarvestTotal Harvest
(boxes/acre)(boxes/acre)

Tomato Yields Total HarvestSeason 2005-06
0500
1,0001,5002,0002,5003,0003,5004,0004,500
0 100 200 300 400 500
N Rate (lb/acre)
Yiel
ds (b
oxes
/acr
e)
FallWinterSpring
Regular Anova shows few statistical differences. Does 'No difference" mean "equality"?
Perhaps the Power of our experiment is “low”One way to increase the power is to increased the
number of replications

Increasing N Increasing N -- 200 to 300 lb/acre200 to 300 lb/acre@ $40/acre@ $40/acre
40.0
13.3
2.73.13.64.45.78.0
0
5
10
15
20
25
30
35
40
45
$4.50 $6.50 $8.50 $10.50 $12.50 $14.50 $16.50 $18.50Price ($/ctn)
Yiel
d (c
tn/a
cre)
Yield
Based on economics, we need to be able to detect yield differences of 3, 10, 100 boxes

NonNon--parametric approachparametric approachBinomial DistributionBinomial Distribution
Because we will never be able to pick up these differences, we can look at trends: that's where we do the +/-approach which really equates to a non-parametric approach
We assign the +/- and do the binomial distribution calculations
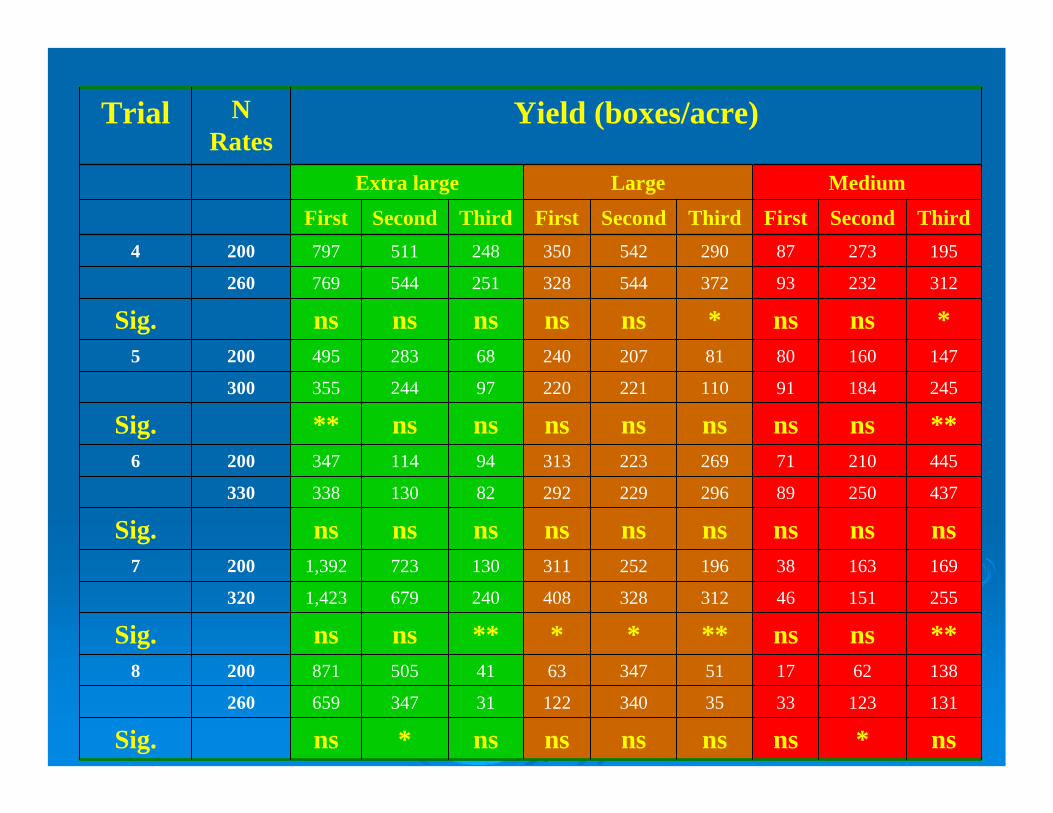
ns*nsnsnsnsns*nsSig.131123333534012231347659260
13862175134763415058712008
**nsns******nsnsSig.255151463123284082406791,423320
169163381962523111307231,3922007
nsnsnsnsnsnsnsnsnsSig.4372508929622929282130338330
44521071269223313941143472006
**nsnsnsnsnsnsns**Sig.2451849111022122097244355300
1471608081207240682834952005
*nsns*nsnsnsnsnsSig.31223293372544328251544769260
195273872905423502485117972004
ThirdSecondFirstThirdSecondFirstThirdSecondFirst
MediumLargeExtra large
Yield (boxes/acre)N Rates
Trial
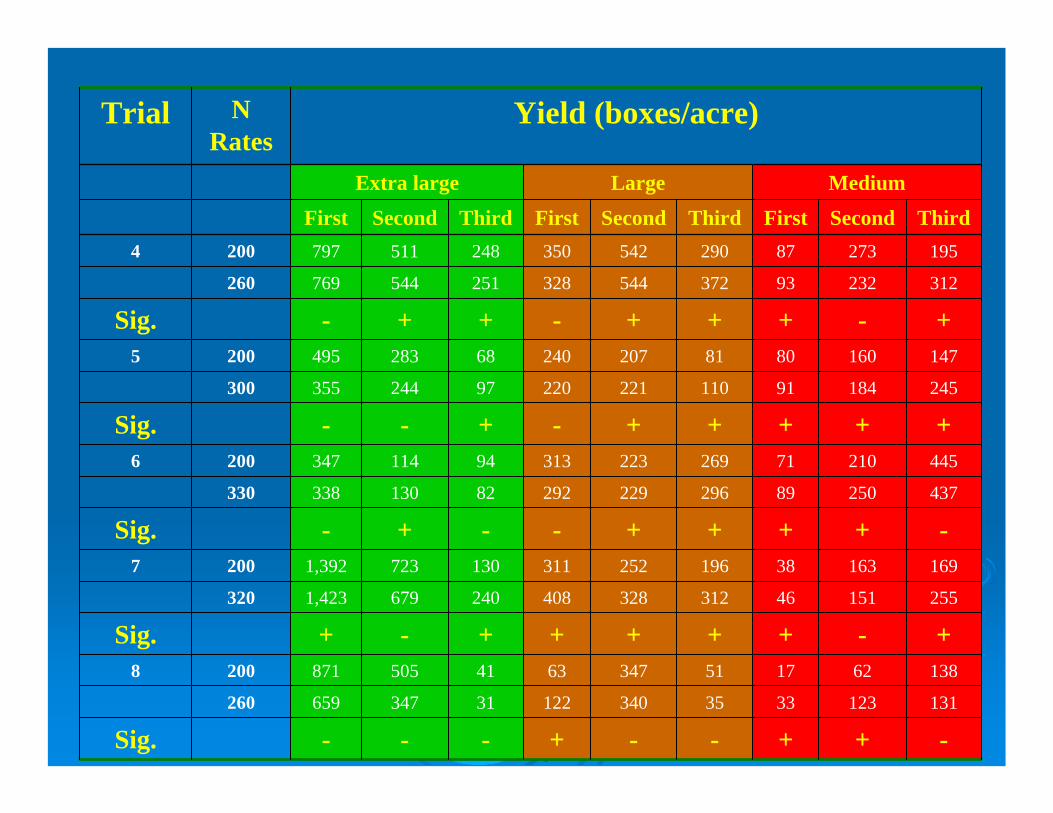
-++--+---Sig.131123333534012231347659260
13862175134763415058712008
+-+++++-+Sig.255151463123284082406791,423320
169163381962523111307231,3922007
-++++--+-Sig.4372508929622929282130338330
44521071269223313941143472006
+++++-+--Sig.2451849111022122097244355300
1471608081207240682834952005
+-+++-++-Sig.31223293372544328251544769260
195273872905423502485117972004
ThirdSecondFirstThirdSecondFirstThirdSecondFirst
MediumLargeExtra large
Yield (boxes/acre)N Rates
Trial

NonNon--parametric approachparametric approachTrends with higher N ratesTrends with higher N rates
P<0.05P<0.05
ExtraExtra--LargeLarge 6 (+) & 9 (6 (+) & 9 (--) = P 0.15 ns) = P 0.15 nsLargeLarge 10 (+) & 5 (10 (+) & 5 (--) = P 0.09 ns) = P 0.09 nsMedium 11 (+) & 4 (-) = P 0.04 Sig.First harvest 8 (+) & 7 (First harvest 8 (+) & 7 (--) = P 0.19 ns) = P 0.19 nsSecond harvest 9 (+) & 6 (Second harvest 9 (+) & 6 (--) = P 0.15 ns) = P 0.15 nsThird harvest 11 (+) & 4 (-) = P 0.04 Sig.
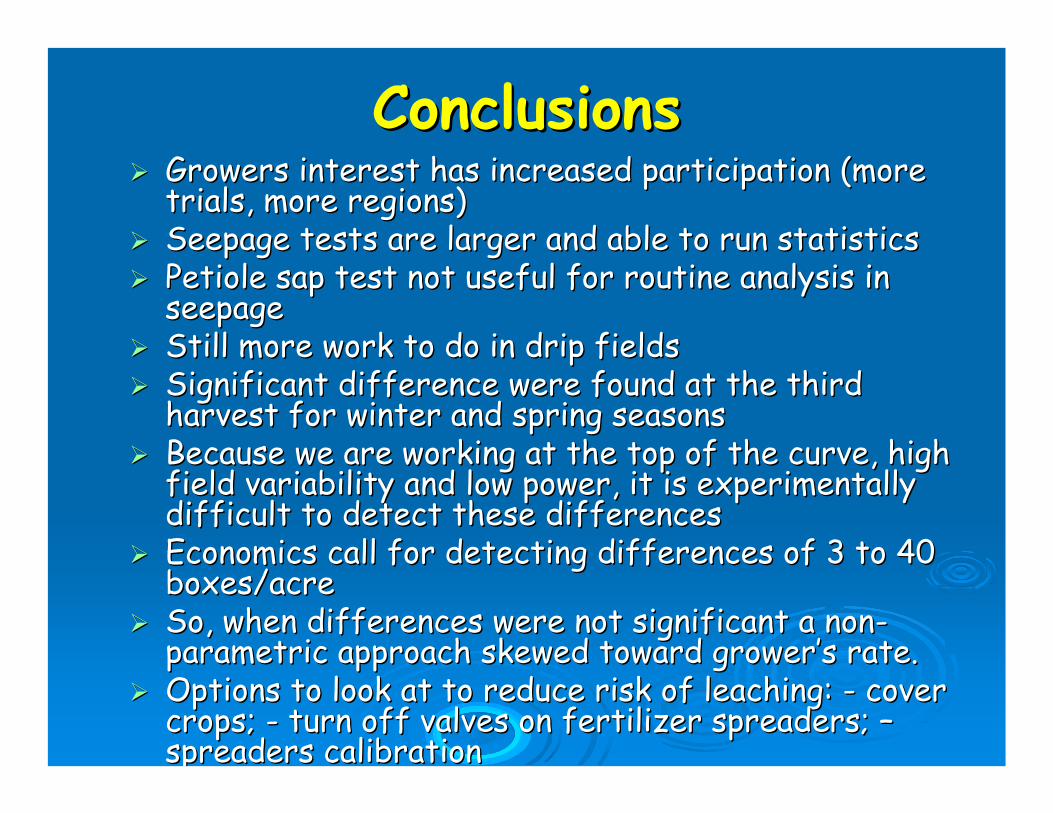
ConclusionsConclusionsGrowers interest has increased participation (more Growers interest has increased participation (more trials, more regions)trials, more regions)Seepage tests are larger and able to run statisticsSeepage tests are larger and able to run statisticsPetiole sap test not useful for routine analysis in Petiole sap test not useful for routine analysis in seepageseepageStill more work to do in drip fieldsStill more work to do in drip fieldsSignificant difference were found at the third Significant difference were found at the third harvest for winter and spring seasonsharvest for winter and spring seasonsBecause we are working at the top of the curve, high Because we are working at the top of the curve, high field variability and low power, it is experimentally field variability and low power, it is experimentally difficult to detect these differencesdifficult to detect these differencesEconomics call for detecting differences of 3 to 40 Economics call for detecting differences of 3 to 40 boxes/acreboxes/acreSo, when differences were not significant a nonSo, when differences were not significant a non--parametric approach skewed toward growerparametric approach skewed toward grower’’s rate.s rate.Options to look at to reduce risk of leaching: Options to look at to reduce risk of leaching: -- cover cover crops; crops; -- turn off valves on fertilizer spreaders; turn off valves on fertilizer spreaders; ––spreaders calibrationspreaders calibration

Monica OzoresMonica Ozores--HamptonHampton
[email protected]@ifas.ufl.edu
Website: Website: http://swfrec.ifas.ufl.edu/bmp/vegetable/http://swfrec.ifas.ufl.edu/bmp/vegetable/