Unveiling rural by-employment patterns and its ...
26
1 Paper prepared for the Hi-Stat Workshop on Historical Occupational Structures: Asian and European Perspectives Sano Shoin, Hitotsubashi University 28 September 2007 Unveiling rural by-employment patterns and its implications for national income estimates in early phases of Japan’s industrialisation Osamu Saito and Tokihiko Settsu (Hi-Stat, Hitotsubashi University) Introduction According to Adam Smith’s theory of the division of labour, the separation of different trades and occupations from one another proceeds with economic development. This separation is ‘generally carried furthest in those countries which enjoy the highest degree of industry and improvement … In every improved society, the farmer is generally nothing but a farmer; the manufacturer, noting but a manufacturer’. 1 This proposition holds as a general tendency for any country or region of the world. As for the early modern period is concerned, however, it is widely recognised, thanks to the debate on proto-industrialisation, that there was a phase in which dual occupation in the form of farm family by-employment increased, rather than decreased, with economic development. Indeed, the Japanese historiography reveals that rural by-employment was widespread. Exceptionally detailed data from Chōshū, a domain in western Japan, indicate that while as many as 80 per cent of the population were classified as farmers, the proportion of non-agricultural produce in gross regional product turns out to have reached the 40 per cent mark. According to a recent work based on the same data, it is likely that non-farm earnings amounted to a quarter of the total pre-tax household income earned by the farm family in the 1840s. 2 All this suggests that unveiling rural by-employment patterns will have a direct bearing on national income estimates in the period after the Meiji Restoration of 1 Smith, Wealth of Nations, vol.1, pp.15-16. 2 Smith, ‘Farm family by-employments’ and Nishikawa, ‘Chōshū’. The estimated proportion of non-farm earnings to the total farm household income is from a mimeographed paper by Nishikawa and Saito. See also Saito, ‘‘Pre-modern economic growth’ and ‘By-employment’.
Transcript of Unveiling rural by-employment patterns and its ...

1
Paper prepared for the Hi-Stat Workshop on Historical Occupational Structures: Asian and European Perspectives
Sano Shoin, Hitotsubashi University
28 September 2007
Unveiling rural by-employment patterns and its implications for national income estimates in early phases of Japan’s industrialisation
Osamu Saito and Tokihiko Settsu (Hi-Stat, Hitotsubashi University)
Introduction According to Adam Smith’s theory of the division of labour, the separation of different trades and occupations from one another proceeds with economic development. This separation is ‘generally carried furthest in those countries which enjoy the highest degree of industry and improvement … In every improved society, the farmer is generally nothing but a farmer; the manufacturer, noting but a manufacturer’.1
This proposition holds as a general tendency for any country or region of the world. As for the early modern period is concerned, however, it is widely recognised, thanks to the debate on proto-industrialisation, that there was a phase in which dual occupation in the form of farm family by-employment increased, rather than decreased, with economic development. Indeed, the Japanese historiography reveals that rural by-employment was widespread. Exceptionally detailed data from Chōshū, a domain in western Japan, indicate that while as many as 80 per cent of the population were classified as farmers, the proportion of non-agricultural produce in gross regional product turns out to have reached the 40 per cent mark. According to a recent work based on the same data, it is likely that non-farm earnings amounted to a quarter of the total pre-tax household income earned by the farm family in the 1840s.2
All this suggests that unveiling rural by-employment patterns will have a direct bearing on national income estimates in the period after the Meiji Restoration of
1 Smith, Wealth of Nations, vol.1, pp.15-16. 2 Smith, ‘Farm family by-employments’ and Nishikawa, ‘Chōshū’. The estimated proportion of non-farm earnings to the total farm household income is from a mimeographed paper by Nishikawa and Saito. See also Saito, ‘‘Pre-modern economic growth’ and ‘By-employment’.

2
1868, since the age of by-employment may well have turned into the Meiji period. Thus, the next section will briefly examine the ways in which sector-specific
estimates of net output were made by the late Professor Kazushi Ohkawa and his associates for the Long-term Economic Statistics of Japan since 1868 (LTES hereafter).3 We pay particular attention to tertiary employments since it was that sector where the number of persons engaged in commerce and services and also in some forms of transport, both as principal and subsidiary occupation, was used to estimate the amount earned by them. It will be noted that assumptions made to derive the numbers of subsidiary occupiers were rather arbitrary. In section 2, patterns of by-employment will be set out in matrix format for two prefectures in two separates points of time, i.e. 1879 and 1925. This enables us to explore the by-employment patterns in relation to indicators of development, such as the declining proportion of primary employment and to the increasing tempo of urbanisation. Some regression analysis will be conducted, based on the results of which an attempt will be made, in section 3, to re-estimate the numbers of subsidiary workers in tertiary employment for the period between 1885 and 1940, and income and output values in the tertiary sector for several benchmark years. Finally in section 4, some implications will be discussed concerning the findings from this exercise. 1. The LTES estimates Kazushi Ohkawa and others took an output approach for most of production branches4. As for agriculture, forestry and fishery, manufacturing, mining and construction, and also communication and public utilities and much of transport, domestic product at factor cost was estimated by applying income ratios to gross output figures.
As for commerce and services and also for most of transport, communication and public utilities, however, an income approach was adopted. As Ohkawa himself admits, the income approach is difficult to apply until there emerge well articulated factor markets. Yet, labour markets in the tertiary sector of the Meiji period were never fully fledged. A vast majority of tertiary workers in the Meiji period were self-employed and many worked as subsidiary (either part-time or ‘side’) workers whose principal
3 14 volumes were published by Toyo Keizai Shimposha, Tokyo, from 1965 to 1988, with the general editors being Kazushi Ohkawa, Miyohei Shinohara and Mataji Umemura, all Hitotsubashi University. Ohkawa and Shonohara, Patterns, is an abridged, one-volume English publication. Note that both the English book and the Japanese volume 1 on national income, published in 1974, do not reflect the revisions made in the Japanese volume 2 on manpower, which was published in 1988. 4 Ohkawa, Takamatsu and Yamamoto, Kokumin shotoku (national income). For English summary of estimation procedures, see pp.159-173.

3
occupations were in the primary and, to a lesser extent, the secondary sector. Thus Nobukiyo Takamatsu, who was responsible for much of estimation of tertiary-sector output and incomes, applied the formula, number of those gainfully occupied in the tertiary sector times average wage, to the series of employed and self-employed workers. By ‘wage’ both salaries and wages are meant: it is relatively easy to estimate average salary earnings for those who received salaries, but it is very difficult to do so for wage earners and the self-employed. Some strong assumptions were made to derive a wage series for tertiary employments from that in manufacturing.
More problematic, perhaps, is to estimate the true numbers of workers in commerce, services and transport. Takamatsu recognised the need to include subsidiary workers whose principal occupation was in other sectors. In order to do so, he decided to apply the ratios of subsidiary to principal employments in the sector of commerce and services to the following sub-periods:5
1885-1904: 0.3; 1905-1920: 0.24; 1921-1929: linear interpolation between 1920 and 1930; and 1930-1940: 0.108.
The ratios for the periods of 1905-1920 and 1930-1940 come from sample tabulations of the 1920 and 1930 national censuses,6 while that for the first sub-period is a mere guesstimate. These ratios were applied to the number of principal workers of the tertiary sector estimated separately by Mataji Umemrura (the series available was a provisional one).7 The total number thus estimated stood at 640,000 in 1885, with its time-series graphed in figure 1 (solid line). Given the paucity of data concerning actual working hours this group of subsidiary workers spent, a half of the wage amount estimated above is used to calculate the incomes they generated. There remain several problems, however. First, the time-series graph exhibits an irregular, zigzag pattern, a product of the assumption of a fixed ratio applied for a given sub-period. Second, the estimation procedure does not take into account information about the size of the workforce in other sectors, while the number of subsidiary workers whose principal occupation was in other branches of the tertiary sector is included in the numerator of the calculation. To put differently, Takamatsu did
5 Note that for some unknown reason, Takamatsu did not include transport in this estimation of subsidiary workers. 6 Naikaku Tōkei-kyoku, Chūshutsu hōhō ni yoru daiikkai kokusei chōsa no gaiyō (Tokyo: Naikaku Tōkei-kyoku, 1924), and Chūshutsu hōhō ni yoru Shōwa 5-nen kokusei chōsa no gaiyō (Tokyo: Naikaku Tōkei-kyoku, 1932). 7 Umemura’s provisional estimates of gainfully occupied workers are published in ‘Population and labor force’ in Patterns, pp.392-395, although no breakdown figures are set out for the period before 1905.

4
not pay attention to the source of subsidiary labour in tertiary employment. Third, the ratio of 0.3 for the first sub-period is an arbitrary one, but there is also an implicit assumption that the proportion of those engaged in tertiary activities as by-employments declined linearly over time. This may or may not be true for the period in question, and is a question to be settled empirically. Finally, it is probably worth pointing out that Takamatsu could not take into account the revisions Umemura did later for his sectoral estimates of principal workers.8 As far as the tertiary sector is concerned, the new series gives somewhat lower estimates for earlier years and higher estimates for later years; as a result of this revision, a revised Takamatsu series of subsidiary workers in commerce, services and transport should have looked like the dotted line in figure 1, with 590,000 rather than 640,000 for 1885, for example. 2. Patterns of rural by-employment Reflecting, perhaps, the spread of by-employment in the countryside, some of Japan’s early population surveys enumerate both principal and subsidiary occupations. Having examined one Chōshū village survey in the 1840s, a pilot census of Yamanashi prefecture in 1879, and the first national census taken in 1920, we have hypothesised that the historical relationship between by-employment and developmental phases was an inverse-U shaped one. In early phases of development, an increase in non-farm occupations took the form of farm-family by-employment. The Chōshū village survey shows that by-employments farm families took up included craft and various service occupations but a vast majority were salt sellers, which undoubtedly reflected the very local character of this commercialised, Inland Sea area. The 1879 pilot census gives us a little more comprehensive picture of one of the silk-producing regions after the opening of the Treaty ports. Especially, a table showing sectoral distributions of principal and subsidiary occupations in matrix form reveals that in non-farm sectors there were as many subsidiary as principal workers, and that the overwhelming proportion of those non-farm by-employments were linked to the farm household sector, reflecting the rural-centred growth of silk and related industries. The weight of subsidiary employment, relative to that of principal employment, declined over the subsequent period to 1920, the year when the first national census was taken. By 1920, the separation of different occupations from one another proceeded. As industry and commerce grew further, therefore, rural by-employment started to decline and the turning point must have reached some time between 1879 and 19209.
8 Umemura et al., Rōdōryoku (manpower). 9 Saito, ‘By-employment’.
5
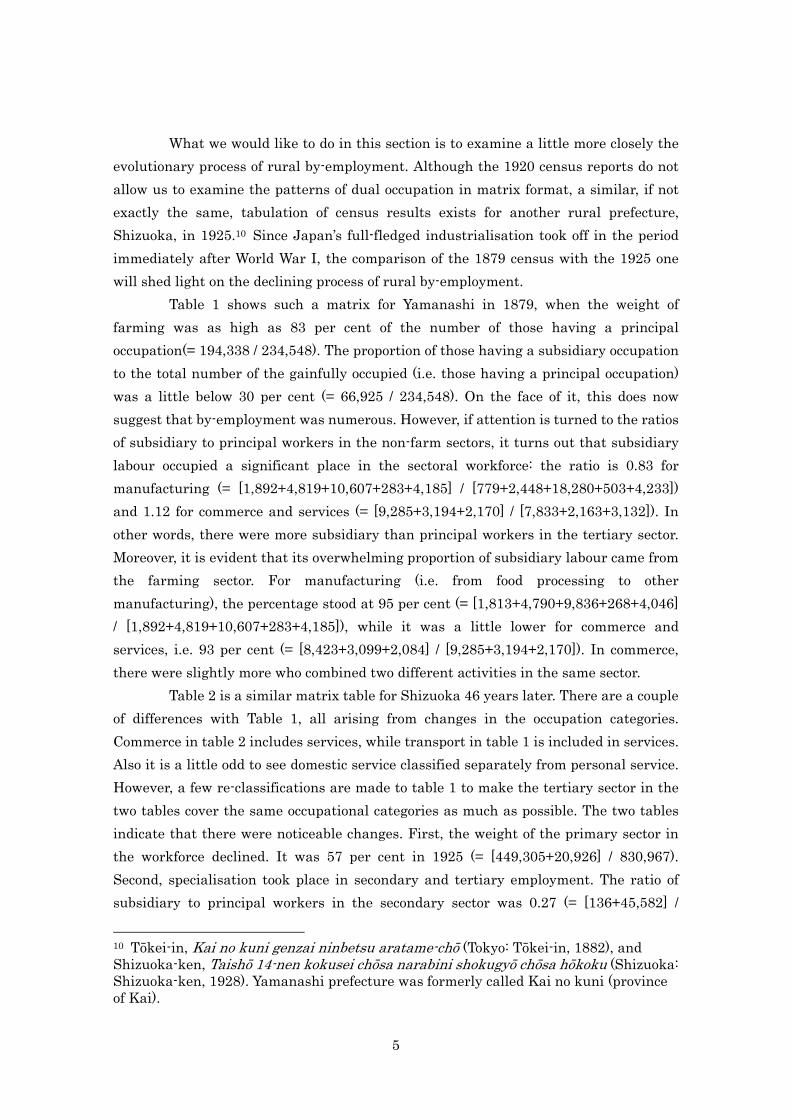
What we would like to do in this section is to examine a little more closely the evolutionary process of rural by-employment. Although the 1920 census reports do not allow us to examine the patterns of dual occupation in matrix format, a similar, if not exactly the same, tabulation of census results exists for another rural prefecture, Shizuoka, in 1925.10 Since Japan’s full-fledged industrialisation took off in the period immediately after World War I, the comparison of the 1879 census with the 1925 one will shed light on the declining process of rural by-employment. Table 1 shows such a matrix for Yamanashi in 1879, when the weight of farming was as high as 83 per cent of the number of those having a principal occupation(= 194,338 / 234,548). The proportion of those having a subsidiary occupation to the total number of the gainfully occupied (i.e. those having a principal occupation) was a little below 30 per cent (= 66,925 / 234,548). On the face of it, this does now suggest that by-employment was numerous. However, if attention is turned to the ratios of subsidiary to principal workers in the non-farm sectors, it turns out that subsidiary labour occupied a significant place in the sectoral workforce: the ratio is 0.83 for manufacturing (= [1,892+4,819+10,607+283+4,185] / [779+2,448+18,280+503+4,233]) and 1.12 for commerce and services (= [9,285+3,194+2,170] / [7,833+2,163+3,132]). In other words, there were more subsidiary than principal workers in the tertiary sector. Moreover, it is evident that its overwhelming proportion of subsidiary labour came from the farming sector. For manufacturing (i.e. from food processing to other manufacturing), the percentage stood at 95 per cent (= [1,813+4,790+9,836+268+4,046] / [1,892+4,819+10,607+283+4,185]), while it was a little lower for commerce and services, i.e. 93 per cent (= [8,423+3,099+2,084] / [9,285+3,194+2,170]). In commerce, there were slightly more who combined two different activities in the same sector. Table 2 is a similar matrix table for Shizuoka 46 years later. There are a couple of differences with Table 1, all arising from changes in the occupation categories. Commerce in table 2 includes services, while transport in table 1 is included in services. Also it is a little odd to see domestic service classified separately from personal service. However, a few re-classifications are made to table 1 to make the tertiary sector in the two tables cover the same occupational categories as much as possible. The two tables indicate that there were noticeable changes. First, the weight of the primary sector in the workforce declined. It was 57 per cent in 1925 (= [449,305+20,926] / 830,967). Second, specialisation took place in secondary and tertiary employment. The ratio of subsidiary to principal workers in the secondary sector was 0.27 (= [136+45,582] /
10 Tōkei-in, Kai no kuni genzai ninbetsu aratame-chō (Tokyo: Tōkei-in, 1882), and Shizuoka-ken, Taishō 14-nen kokusei chōsa narabini shokugyō chōsa hōkoku (Shizuoka: Shizuoka-ken, 1928). Yamanashi prefecture was formerly called Kai no kuni (province of Kai).

6
[1,695+166,351]), while that in the tertiary sector stood as low as 0.12 (= [16,329+4,298+695+41] / [109,122+24,140+31,016+8,318]). To summarise the changes that took place to the sector-specific ratio of subsidiary to principal workers between 1879 and 1925: Secondary Tertiary 1879 0.83 1.12 1925 0.27 0.12 As far as tertiary employment is concerned, therefore, the ratios Takamatsu assumed are not very accurate; especially the ratio of 0.3 for the 1885-1904 period seems to have been grossly underestimated. Third, the decline in the supply of subsidiary labour from the primary sector (i.e. farming, forestry and fishery) to the tertiary sector (i.e. commerce, personal services, public administration, professionals and domestic service) is particularly noticeable. The proportion decreased to 55 per cent (= [7,424+3,802+267+27+249+39+3] / [16,329+4,298+695+41]). Fourth, however, that proportion still stood at 91 per cent for the secondary sector of manufacturing and mining (= [109+41,193+2+286] / [136+45,582]), suggesting that the main source of the supply of subsidiary labour was still from farming. Indeed, the proportion of principal workers in the primary sector having a subsidiary occupation in the secondary and tertiary sectors did not decline over the 46-year period: it was 18 per cent for Yamanashi in 1879 (= [54,687-20,258] / 194,338) and 15 per cent for Shizuoka in 1925 (= [226,222+5,088-157,525-4,296] / [449,305+20,926]). Having had those findings in mind, let us examine district-level variations in several indicators of by-employment, with the two prefectures in different time periods pooled, in relation to the proportion primary in the individual district (gun) as the aim of this exercise is to explore the relationship between by-employment and economic development. The proportion primary is defined as the weight of the farming sector in the district's workforce as represented by the total number of those having a principal occupation. Against this measure, we will set the following variables:
Proportion of all workers having a subsidiary occupation; Proportion of workers having a subsidiary occupation in the primary sector; Proportion of workers having a subsidiary occupation in the secondary sector; Proportion of workers having a subsidiary occupation in the tertiary sector (in this case, commerce, services and transport); and Ratio of subsidiary workers in commerce, services and transport to principal workers in sectors other than in the above categories.
All these variables are defined with respect to the total number of those having a principal occupation as the denominator. The scatter grams are set out in figures 2 through 6, in all of which economic development is measured from right to left on the

7
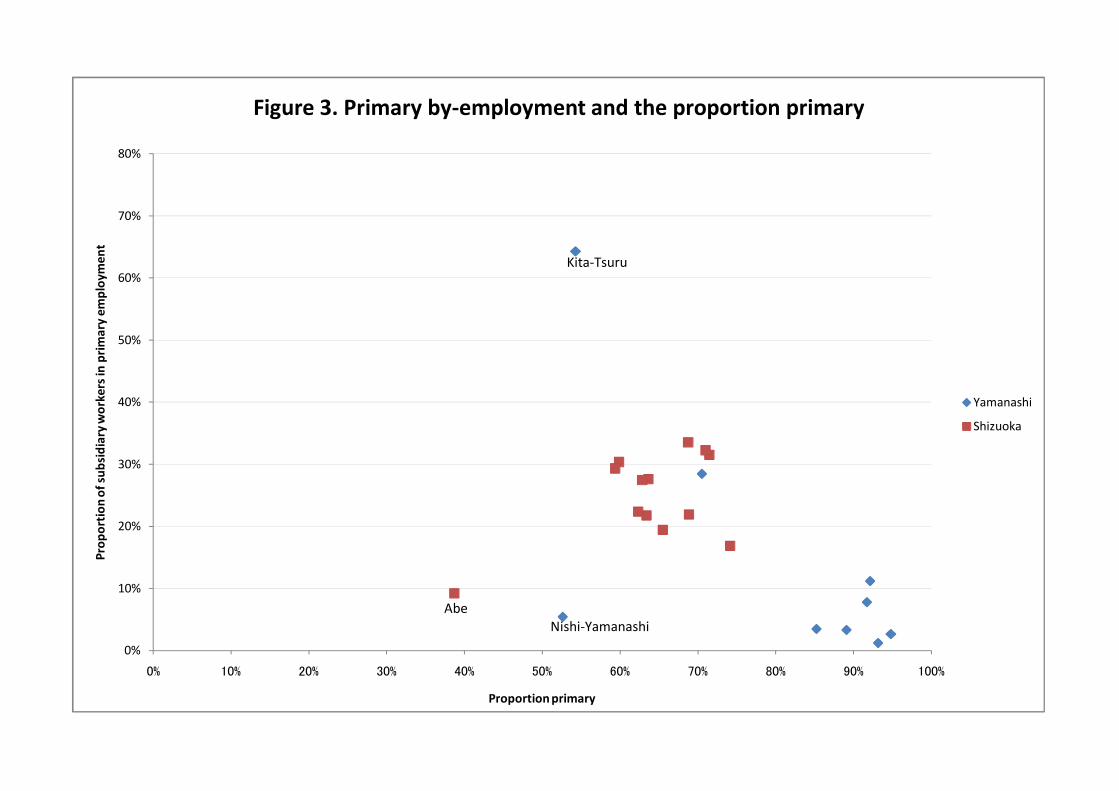
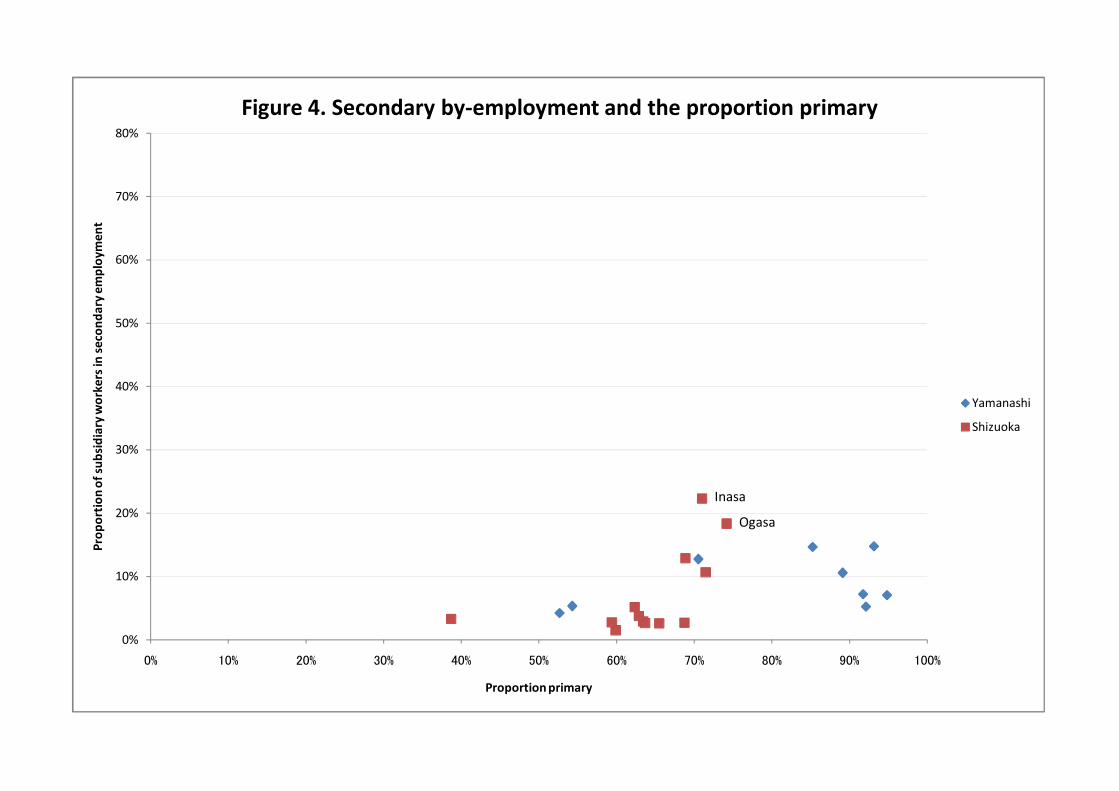
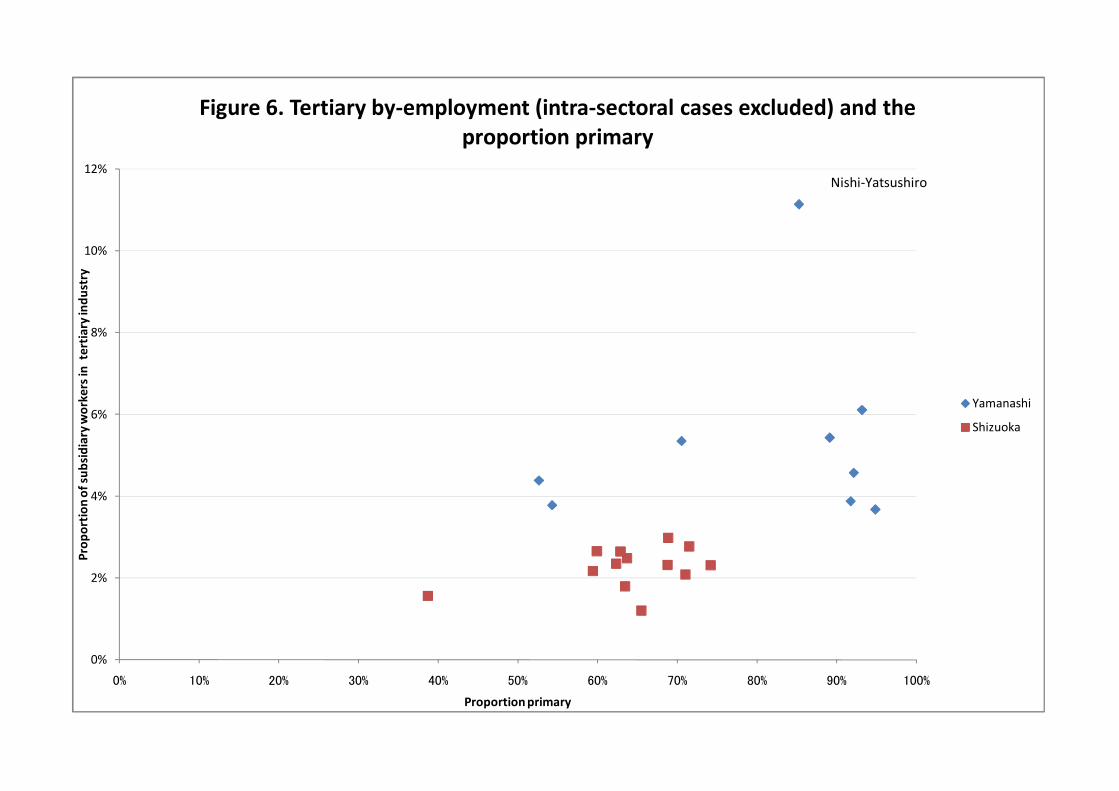
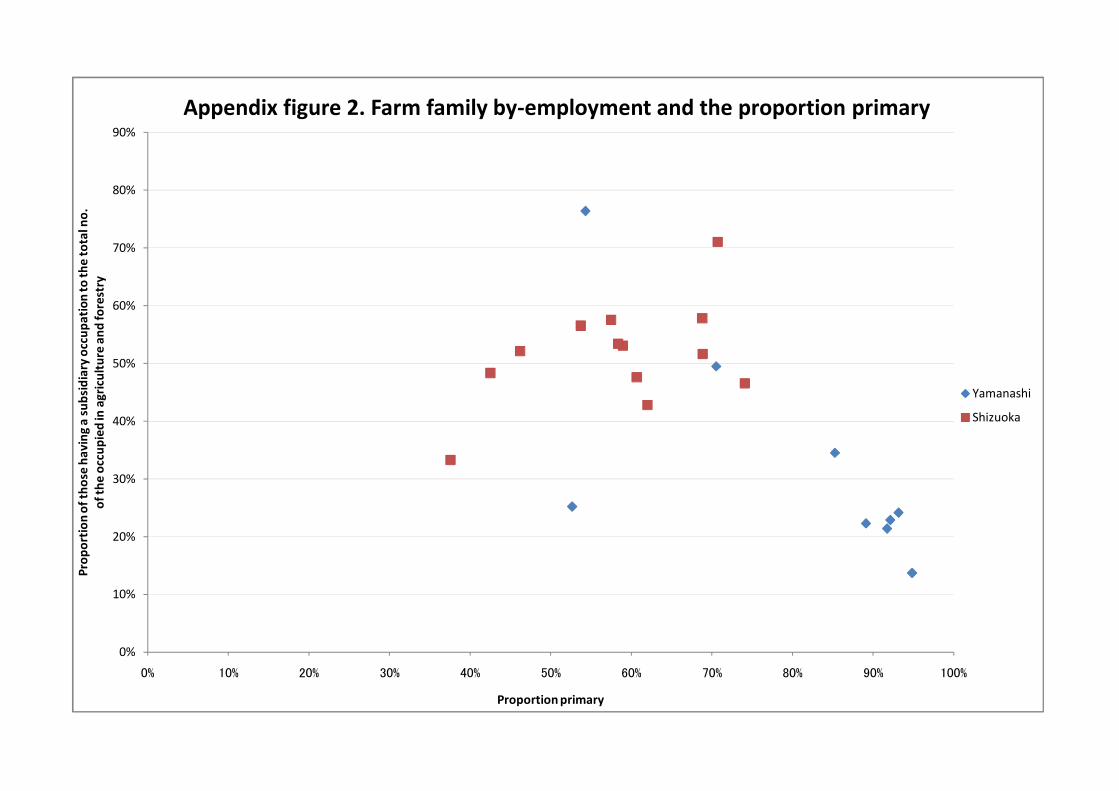
horizontal axis of the proportion primary. The first graph shows that the extent of by-employment increased when the proportion primary was high, but that it started declining when the proportion primary decreased further. Most if not all of Yamanashi’s 10 districts represent the first phase and Shizuoka’s 17 the second. Even if the definition of the variable to be explained is made with respect to the primary sector only, still the same inverse-U shaped pattern emerges (Appendix figures 1-2). And similar observations can be made in relation to figures 3 and 4. All this confirms our hypothesis of the inverse-U shaped relationship between rural by-employment and development. The inverse-U shaped pattern revealed for secondary by-employment (figure 4) may be contrasted with that for tertiary by-employment (figures 5-6). In the latter two graphs, the distinction of the first and second phases is much less articulated and the relationship appears to have been a monotonously declining one (in figure 6, cases in which both a principal and a subsidiary occupation are in the same tertiary sector are excluded from the definition of the extent of tertiary by-employment). And this contrast may have been associated with the changes we examined above: that the subsidiary-principal ratio declined faster in the tertiary sector of commerce, services and transport than in the secondary sector of manufacturing and mining between 1879 and 1925. Since the size of subsidiary workers was smaller in the tertiary than in the secondary sector, the overall pattern was, as shown in figure 2, not disturbed by this distinct pattern of tertiary by-employment. However, its monotonously declining pattern is also important as it seems to have been associated with urbanisation. Figure 7 shows the relationship with the degree of urbanisation, which is measured here by the district’s population density.11 It confirms that the relationship was a declining one although the shape of that scatter gram suggests that the degree of urbanisation was not a surrogate measure of the declining proportion of farming. 3. The tertiary sector in the national economy, 1885-1940 The above findings concerning tertiary by-employment provide us a new basis for the estimation of the numbers of subsidiary workers in the tertiary sector of the national economy. Since both proportion primary and population density are available annually
11 This is because data do not allow us to define the degree of urbanisation for individual districts of Yamanashi in relation to either city status or settlement size. There is no table showing where densely populated settlements were in each district (gun) in the 1879 census report. Area data are from the Yamanashi-ken tōkei-sho, 1883, and the Taishō 14-nen kokusei chōsa (op.cit. in n.10).

8
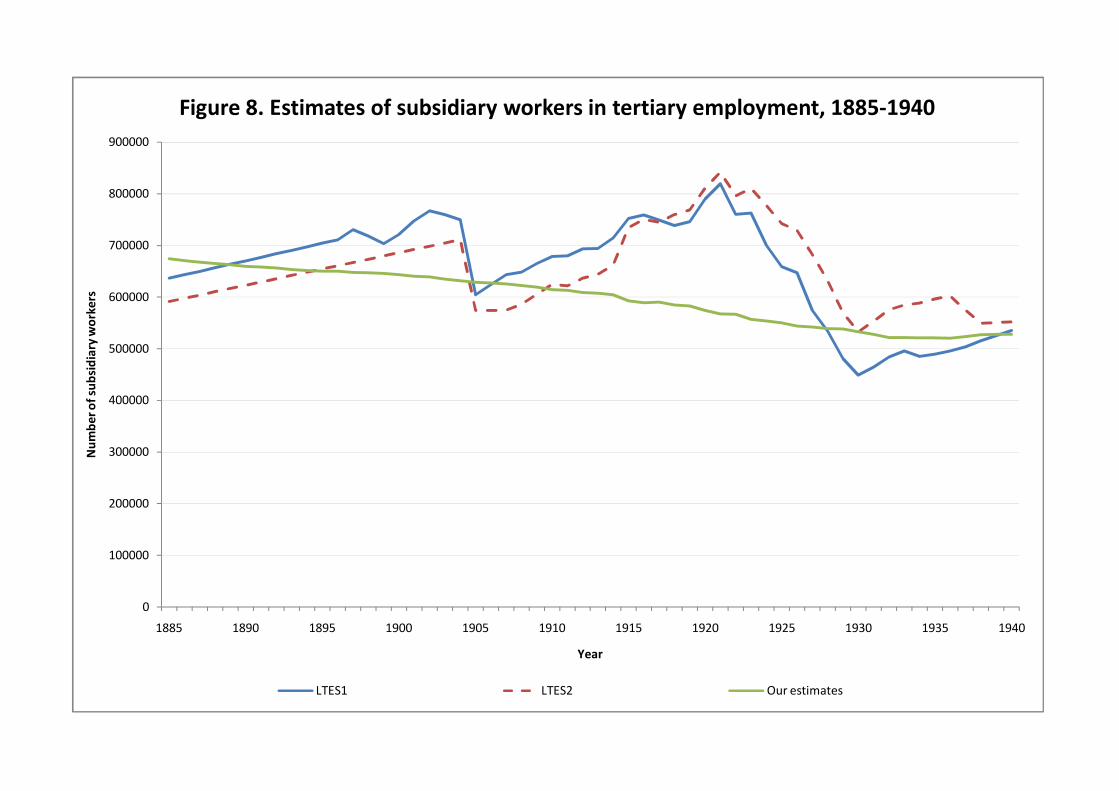
for the whole nation, we may regress the ratio of those having a subsidiary occupation in commerce, services and transport (including communication) to the number of those having a principal occupation in sectors other than the above categories, on the proportion primary and population density with Yamanashi and Shizuoka districts pooled.12 Table 3 shows the results with the dependent variable logistic-transformed. The fit is reasonably good. As expected, the extent of tertiary by-employment was negatively influenced by population density (a surrogate measure of urbanisation) and positively by the proportion primary, and both regression coefficients are statistically significant. Since the proportion primary was declining and the density of population rising over the entire period in question, it is predicted that the number of subsidiary workers in the tertiary sector declined monotonously. Given this robustness of the regression analysis, we may use the estimated equation to calculate the number of subsidiary workers in the tertiary sector annually for the period 1885-1940, by substituting national for district values of the proportion primary and population density.13 The result of this is presented in figure 8, which does show a monotonously declining graph. At the same time, it is worth noting that although it no longer looks like a zigzag line, its broad tendency is not entirely different from the Takamatsu estimates. The actual figures of the new estimates for seven benchmark years are set out in table 4, which enables us, by applying exactly the same method Takamatsu employed, to estimate incomes they earned (table 5) and the total NDP of the tertiary sector in corresponding years (table 6). According to our new estimates, the number of subsidiary workers in the tertiary sector was 670,000 in 1885, just 6 per cent larger than the Takamatsu estimate (it would be 14 per cent larger than that implied by the revised Umemura series). Rather unexpectedly, however, the largest difference between the old and new series is found for 1920. It is evident that Takamatsu overstated the number substantially for this census year. Estimated incomes they earned show virtually the same differences (table 5). Despite these non-negligible differences in the numbers of subsidiary workers and implied incomes earned by them, the two output estimates appear very similar. Table 6 indicates that the largest gap is found for the year 1920 but is only 2 per cent. 12 Intra-sectoral dual occupations, i.e. those having a principal and a subsidiary occupation in commerce and services, and those having a principal and a subsidiary occupation in transport and communication are excluded in the calculation of this extent of tertiary by-employment. This definition corresponds to figures 6 and 7. 13 National estimates of population density are from the Statistical Bureau’s website (http://www.stat.go.jp/data/chouki/zuhyou/02-01.xls), and the numbers of gainfully occupied persons from Umemura et al., Rōdōryoku (manpower).
9
This is because wage earnings by subsidiary labour are assumed to have been half the amount earned by the principal worker, so that the subsidiary wage portion in the sectoral NDP could not be large. Despite the bold and arbitrary assumptions made for LTES estimation, therefore, we should say that the Takamatsu estimates did not go wide of the mark. 4. Implications Although our output estimates of the tertiary sector have failed to replace the LTES series, findings derived from our exercise have some implications. First, it is important to realise that the LTES estimates are not affected because an income approach was adopted only for the tertiary sector, and also because when estimation was made, they tried, however arbitrarily, to take the existence of subsidiary workers into account. In other words, a lesson we may learn is that the failure to recognise the existence of by-employment would lead to a substantial underestimation of output and incomes in earlier phases of development when the extent of rural by-employment could have been substantial. The caution ought to be made particularly when the paucity of data forces us to take an income approach. Second, the regression equation estimated in table 3 may prove to be useful as an estimation tool, when an attempt will be made to estimate Japan’s regional output and income series for the same period of 1885-1940. Third, the findings have some implications for economic historians too. What this paper has revealed is that the evolution of rural by-employment took place in two stages—an expansion in an early stage, followed by a contraction. And it is likely that it was manufacturing, not commerce and services, which exhibited such an inverse-U shaped pattern. This lends support to the supposition that much of proto-industrial growth took the form of rural by-employment. It was a phase in which an expansion of industrial by-employment took place in the countryside with no contraction of the farm household sector. Of course, if the proto-industrialisation were associated with some form of de-urbanisation in the countryside as argued by Jan de Vries and Tom Smith, then even tertiary by-employment might have followed an inverse-U shaped path.14
Fourth, the exercise has an important implication for sectoral labour productivity analysis in the modern period. Scholars in the LTES group seldom ventured to do sectoral analysis of labour productivity and its changes over time, presumably because they knew that the widespread phenomena of rural by-employment would make such analysis difficult and misleading, especially for early
14 de Vries, European Urbanization, and Smith, ‘Pre-modern economic growth’.

10
years of development. However, Kazushi Ohkawa once turned his attention to that topic. He showed sectoral NDP per gainfully occupied person in 1885-89. His table reveals that labour productivity in industry was 2.5 times higher and that in service 5 times higher than labour productivity in agriculture, if current prices are used (in constant prices, the ratio becomes 1.5 and 6 respectively). Ohkawa offered no attempt to ‘explain in detail the wide differentials’ in such sectoral comparisons, saying that his concern was just ‘to examine the relative changes in subsequent years’, especially slower productivity increases and, hence, higher relative price rises in agriculture and services15. Important as such a statement may be, it is now evident that his table of sectoral labour productivity differentials in 1885-89 is misleading, since only the number of persons who were gainfully engaged in the said occupation as a principal occupation was counted in the denominator of the calculation. If measured in terms of man-hours, labour input in agriculture must have been lower, but higher in industry and services, than the sectoral table of the gainfully occupied in the LTES’s manpower volume suggested. By taking by-employment into account, therefore, we may be able to take a little more realistic step towards a better understanding of sectoral differentials in labour productivity in early phases of development.16
15 Ohkawa, ‘Production structure’, in Patterns, pp.40-43. Similar tabulations of sectoral productivity derived from sectoral NDP divided by the corresponding number of primary worker are found in Nakamura, Economic Growth, p.24, and Postwar Japanese Economy, p.159. 16 For changes in sectoral labour productivity differentials that may have taken place between the 1870s and 1960 , see Fukao and Saito, ‘Japan’s alternating phases’, figure 13.
11
Secondary works cited de Vries, J., European Urbanization 1500-1800 (Cambridge, Mass.: Harvard University
Press, 1984). Fukao, K. and O. Saito, ‘Japan’s alternating phases of growth and outlook for the future’,
paper presented at the Asia Pacific Seminar on World Economic Performance: Past, Present and Future, to mark the occasion of Angus Maddison’s 80th birthday, University of Queensland, December 2006 (http://hi-stat.ier.hit-u.ac.jp/research/discussion
/2006/pdf/D06-196.pdf). Nakamura, T., Economic Growth in Prewar Japan (New Haven: yale University Press,
1983). Nakamura, T., The Postwar Japanese Economy: Its development and Structure (Tokyo:
University of Tokyo Press). Nishikawa, N., ‘The economy of Chōshū on the eve of industrialization’, The Economic
Studies Quarterly, vol.38, no.4 (1987), pp.323-337. Ohkawa, K., N. Takamatsu and Y. Yamamoto, Kokumin shotoku (national income),
LTES 1 (Tokyo: Toyo Keizai Shimposha, 1974). Ohkawa, K. and M. Shinohara, eds, Patterns of Japanese Economic Development: A
Quantitative Appraisal (New Haven: Yale University Press, 1979). Saito, O., ‘‘Pre-modern economic growth revisited: Japan and the West’, LSE/GEHN
Working Paper Series no.16, 2005 (http://www.lse.ac.uk/ collections/economicHistory/GEHN
/GEHNPDF/WorkingPaper16-OS.pdf). Saito, O., ‘By-employment in changing occupational structures: Japan, 1840-1920’,
paper prepared for Session 32: The divergence of national occupational structures 1500 to 1940, The IEHA Congress, Helsinki, 2006 (http://www.helsinki.fi/iehc2006/papers1
/Saito.pdf). Smith, A., An Enquiry into the Nature and Causes of the Wealth of Nations, ed. R.H.
Campbell and A.S. Skinner (Oxford: Clarendon Press, 1976). Smith, T.C., ‘Farm family by-employments in preindustrial Japan’, Journal of Economic
History, vol.29, no.4 (1969); reprinted in his Native Sources of Japanese Industrialization, 1750-1920 (Berkeley: University of California Press, 1988).
Smith, T.C., ‘‘Pre-modern economic growth: Japan and the West’, Past and Present, no.60 (1973); reprinted in his Native Sources of Japanese Industrialization, 1750-1920 (Berkeley: University of California Press, 1988).
Umemura, M., et al., Rōdōryoku (manpower), LTES 2 (Tokyo: Toyo Keizai Shimposha, 1988).

Table 1. Principal-subsidiary occupational matrix: Yamanashi, 1879 (both sexes combined)
PrincipalFarming Food Constr Textiles Metal Other mfg Commerce Service Public service Other Total
& professionals194,338 779 2,448 18,280 503 4,233 7,833 2,163 3,132 839 234,548
SubsidiaryFarming 20,258 22 36 9,788 5 38 236 4 11 4 30,402Food 1,813 10 5 0 3 3 46 9 3 0 1,892Construction 4,790 1 7 1 0 1 17 0 0 2 4,819Textiles 9,836 4 0 327 0 415 20 0 1 4 10,607Metal 268 0 1 0 9 0 4 0 0 1 283Other mfg 4,046 3 17 38 1 30 43 3 3 1 4,185Commerce 8,423 62 40 18 12 40 587 53 30 20 9,285Service 3,099 17 2 11 0 3 50 7 4 1 3,194Public service & profes 2,084 10 6 3 0 1 16 5 43 2 2,170Other 70 0 2 2 0 4 8 1 0 1 88Total 54,687 129 116 10,188 30 535 1,027 82 95 36 66,925
Table 2. Principa-subsidiary occupational matrix: Shizuoka, 1925 (both sexes combined)
PrincipalFarming Fishery Mining Mfg Commerce Transport Public service Other Domestic Total
& professionals service449,305 20,926 1,695 166,351 109,122 24,140 31,016 20,094 8,318 830,967
SubsidiaryFarming 157,525 4,296 107 9,199 5,355 2,319 1,186 1,192 19 181,198Fishery 9,250 78 12 233 233 77 7 81 1 9,972Mining 109 2 3 6 11 4 1 0 0 136Manufacturing 41,193 286 5 1,628 2,029 112 119 204 6 45,582Commerce 7,424 249 19 2,338 5,357 424 335 182 1 16,329Transport 3,802 39 4 62 261 104 6 20 0 4,298Public service & profes 267 3 0 65 91 11 239 19 0 695Other 6,625 135 0 187 259 48 19 266 1 7,540Domestic service 27 0 0 2 9 0 1 0 2 41Total 226,222 5,088 150 13,720 13,605 3,099 1,913 1,964 30 265,791

Table 3. Regression results: Yamanashi and Shizuoka districts pooled
Dependent variable: Ratio of subsidiary workers in commerce, services and transport to principal workers in sectors other than in the above categoriesExplanatory variables: Population dencity -0.002305
(3.64)** % primary 1.508594
(2.84) * Intercept -4.096903
(9.58)**N 22
R2 (adjusted) 0.57
1) % primary is defined as of the gainfully occupied 2) t value in parentheses 3) Significance level: * 5%, ** 1%
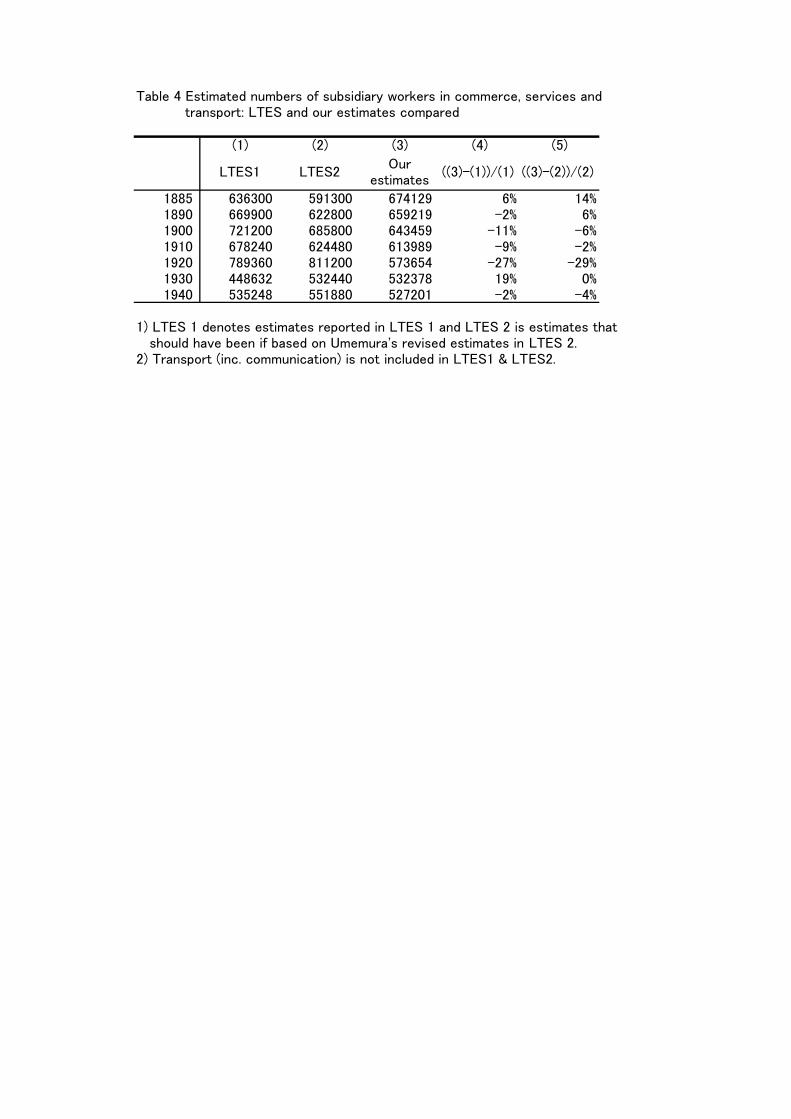
Table 4 Estimated numbers of subsidiary workers in commerce, services and transport: LTES and our estimates compared
(1) (2) (3) (4) (5)
LTES1 LTES2Our
estimates((3)-(1))/(1) ((3)-(2))/(2)
1885 636300 591300 674129 6% 14%1890 669900 622800 659219 -2% 6%1900 721200 685800 643459 -11% -6%1910 678240 624480 613989 -9% -2%1920 789360 811200 573654 -27% -29%1930 448632 532440 532378 19% 0%1940 535248 551880 527201 -2% -4%
1) LTES 1 denotes estimates reported in LTES 1 and LTES 2 is estimates that should have been if based on Umemura's revised estimates in LTES 2.2) Transport (inc. communication) is not included in LTES1 & LTES2.

Table 5 Estimated incomes earned by subsidiary workers in commerce, services and transpor(Millions of yen)
(1) (2) (3)
LTES1 Our estimate ((2)-(1))/(1)
1885 28.0 29.7 6%1890 29.0 28.5 -2%1900 61.0 54.4 -11%1910 76.0 68.8 -9%1920 272.0 197.7 -27%1930 154.0 182.7 19%1940 257.0 253.1 -2%
Transport (inc. communication) is not included in LTES1.

Table 6. Estimated values of NDP in commerce, services and transport (Millions of yen)
(1) (2) (3)
LTES1 Our estimate ((2)-(1))/(1)
1885 226 228 1%1890 276 276 0%1900 625 619 -1%1910 926 919 -1%1920 3590 3516 -2%1930 3593 3622 1%1940 6870 6866 0%
Transport (inc. communication) is not included in LTES1.

0
100000
200000
300000
400000
500000
600000
700000
800000
900000
1885 1890 1895 1900 1905 1910 1915 1920 1925 1930 1935 1940
Num
ber o
f sub
sidiary workers
Year
Figure 1. LTES estimates of subsidiary workers in tertiary employment
LTES1 LTES2

0%
10%
20%
30%
40%
50%
60%
70%
80%
0% 10% 20% 30% 40% 50% 60% 70% 80% 90% 100%
Prop
ortion
subsidiary
Proportion primary
Figure 2. By‐employment and the proportion primary
Yamanashi
Shizuoka
Kita‐Tsuru
Minami‐Tsuru
Nishi‐Yatsushiro
Nishi‐Yamanashi
0%
10%
20%
30%
40%
50%
60%
70%
80%
0% 10% 20% 30% 40% 50% 60% 70% 80% 90% 100%
Prop
ortion
of sub
sidiary workers in
primary em
ploy
men
t
Proportion primary
Figure 3. Primary by‐employment and the proportion primary
Yamanashi
Shizuoka
Kita‐Tsuru
Nishi‐YamanashiAbe
0%
10%
20%
30%
40%
50%
60%
70%
80%
0% 10% 20% 30% 40% 50% 60% 70% 80% 90% 100%
Prop
ortion
of sub
sidiary workers in
secon
dary employ
men
t
Proportion primary
Figure 4. Secondary by‐employment and the proportion primary
Yamanashi
Shizuoka
Inasa
Ogasa

90%
Figure 5. Tertiary by‐employment and the proportion primary
70%
80%
ustry
50%
60%
rs in
tertiary indu
40%
50%
ubsidiary worker
Yamanashi
Shizuoka
20%
30%
Prop
ortion
of su
10% Nishi‐Yatsushiro
0%
0% 10% 20% 30% 40% 50% 60% 70% 80% 90% 100%
Proprotion primary
0%
2%
4%
6%
8%
10%
12%
0% 10% 20% 30% 40% 50% 60% 70% 80% 90% 100%
Prop
ortion
of sub
sidiary workers in
tertiary indu
stry
Proportion primary
Figure 6. Tertiary by‐employment (intra‐sectoral cases excluded) and the proportion primary
Yamanashi
Shizuoka
Nishi‐Yatsushiro

0%
2%
4%
6%
8%
10%
12%
0 100 200 300 400 500 600 700
Prop
rotion
of sub
sidiary workers in
tertiary indu
stry
Population density
Figure 7. Tertiary by‐employment (intra‐sectoral cases excluded) and population density
Yamanashi
Shizuoka
Hamana
Nishi‐Yatsushiro
0
100000
200000
300000
400000
500000
600000
700000
800000
900000
1885 1890 1895 1900 1905 1910 1915 1920 1925 1930 1935 1940
Num
ber o
f sub
sidiary workers
Year
Figure 8. Estimates of subsidiary workers in tertiary employment, 1885‐1940
LTES1 LTES2 Our estimates

0%
10%
20%
30%
40%
50%
60%
70%
80%
90%
0% 10% 20% 30% 40% 50% 60% 70% 80% 90% 100%
Prop
ortion
of tho
se having a subsidiary occup
ation to th
e total no.
of th
e occupied
in th
e prim
ary sector
Proportion primary
Appendix figure 1. Primary‐sector by‐employment and the proportion primary
Yamanashi
Shizuoka
0%
10%
20%
30%
40%
50%
60%
70%
80%
90%
0% 10% 20% 30% 40% 50% 60% 70% 80% 90% 100%
Prop
ortion
of tho
se having a subsidiary occup
ation to th
e total no.
of th
e occupied
in agriculture and
forestry
Proportion primary
Appendix figure 2. Farm family by‐employment and the proportion primary
Yamanashi
Shizuoka