Untitled - Montgomery County, Maryland
15
Transcript of Untitled - Montgomery County, Maryland
Montgomery County Quarterly Economic Indicators September 2012
1
The purpose of this report is to keep policy makers apprised of changes in the national and local economies that
the Montgomery County Department of Finance believes may impact current and/or future revenues and expenditures.
This report is also available through the Internet on the Montgomery County Web Page: http://www.montgomerycountymd.gov For questions regarding this report, please contact: David Platt Chief Economist Montgomery County Department of Finance 255 Rockville Pike, Suite L-15 Rockville, Maryland 20850 Phone: (240) 777-8866 Fax: (240) 777-8954 Email: [email protected]
Montgomery County Quarterly Economic Indicators September 2012
2
NATIONAL ECONOMY
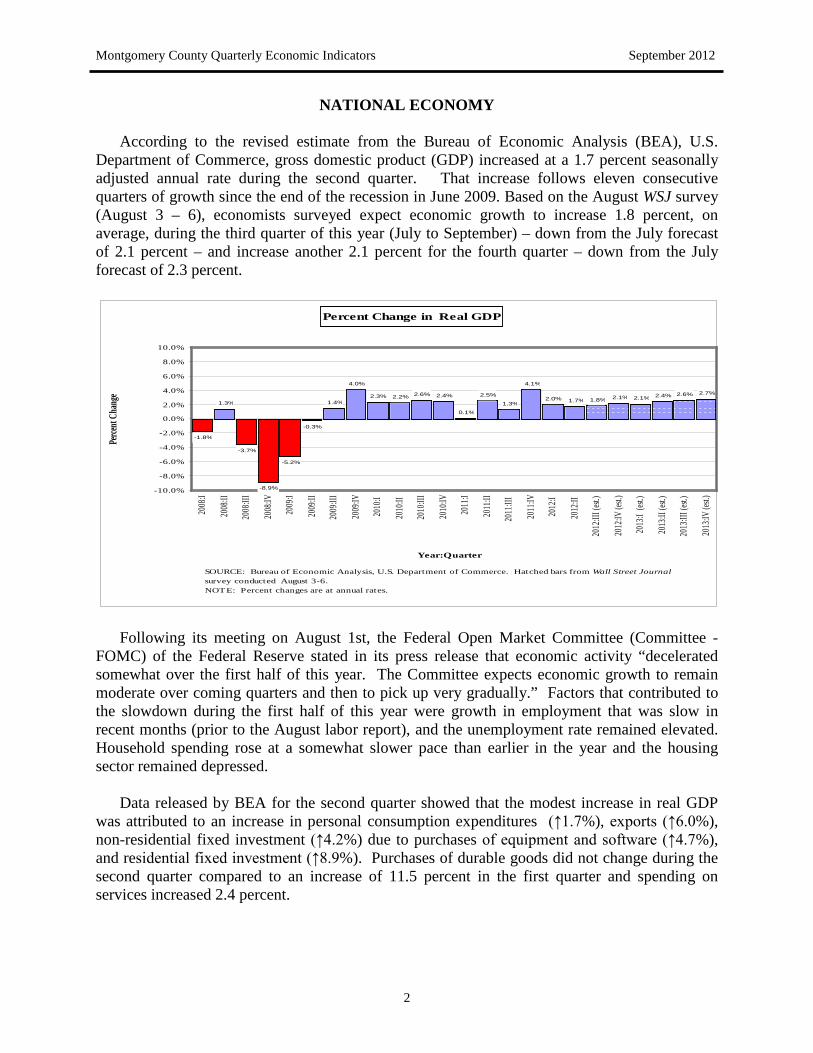
According to the revised estimate from the Bureau of Economic Analysis (BEA), U.S. Department of Commerce, gross domestic product (GDP) increased at a 1.7 percent seasonally adjusted annual rate during the second quarter. That increase follows eleven consecutive quarters of growth since the end of the recession in June 2009. Based on the August WSJ survey (August 3 – 6), economists surveyed expect economic growth to increase 1.8 percent, on average, during the third quarter of this year (July to September) – down from the July forecast of 2.1 percent – and increase another 2.1 percent for the fourth quarter – down from the July forecast of 2.3 percent.
Percent Change in Real GDP
-1.8%
1.3%
-3.7%
-8.9%
-5.2%
-0.3%
1.4%2.2% 2.6% 2.4%
0.1%
2.5%
1.3%
4.1%
2.0% 1.7% 1.8% 2.1% 2.1% 2.4% 2.6% 2.7%
4.0%
2.3%
-10.0%
-8.0%
-6.0%
-4.0%
-2.0%
0.0%
2.0%
4.0%
6.0%
8.0%
10.0%
2008
:I
2008
:II
2008
:III
2008
:IV
2009
:I
2009
:II
2009
:III
2009
:IV
2010
:I
2010
:II
2010
:III
2010
:IV
2011
:I
2011
:II
2011
:III
2011
:IV
2012
:I
2012
:II
2012
:III (
est.)
2012
:IV (e
st.)
2013
:I (es
t.)
2013
:II (e
st.)
2013
:III (
est.)
2013
:IV (e
st.)
Year:Quarter
Perce
nt Ch
ange
SOURCE: Bureau of Economic Analysis, U.S. Department of Commerce. Hatched bars from Wall Street Journal survey conducted August 3-6.NOTE: Percent changes are at annual rates.
Following its meeting on August 1st, the Federal Open Market Committee (Committee -
FOMC) of the Federal Reserve stated in its press release that economic activity “decelerated somewhat over the first half of this year. The Committee expects economic growth to remain moderate over coming quarters and then to pick up very gradually.” Factors that contributed to the slowdown during the first half of this year were growth in employment that was slow in recent months (prior to the August labor report), and the unemployment rate remained elevated. Household spending rose at a somewhat slower pace than earlier in the year and the housing sector remained depressed.
Data released by BEA for the second quarter showed that the modest increase in real GDP
was attributed to an increase in personal consumption expenditures (↑1.7%), exports (↑6.0%), non-residential fixed investment (↑4.2%) due to purchases of equipment and software (↑4.7%), and residential fixed investment (↑8.9%). Purchases of durable goods did not change during the second quarter compared to an increase of 11.5 percent in the first quarter and spending on services increased 2.4 percent.
Montgomery County Quarterly Economic Indicators September 2012
3
Real final sales of domestic product, which measures aggregate demand and is GDP less the change in real private inventories, increased 2.0 percent during the second quarter compared 2.4 percent during the first quarter. Real final sales are a good measure of future production. If the growth rate in real final sales exceeds the growth rate for GDP over an extended period of time, it indicates strong demand and an expansion of the national economy. However, during the second quarter ending in June, the percent change in real final sales of domestic product was lower than the percent change in real GDP. Therefore, based on this relationship, the economy may not experience strong demand in the near term. In fact, the FOMC stated in its press release that “the Committee expects economic growth to remain moderate over coming quarters.”
According to economic analysts, business spending usually increases before consumer
spending as the economy expands. Spending on equipment and software increased at a seasonally adjusted annual rate of 4.7 percent during the second quarter. During the first half of this year, business spending increased 5.1 percent at a seasonally adjusted annual rate. Consumer spending as measured by personal consumption expenditures (PCE) increased by 1.7 percent at a seasonally adjusted annual rate during the second quarter and 2.1 percent during the first half of this year. That difference suggests that business spending rather than consumer spending was the economic driver during the first half of this year.
The quarterly increase in residential construction (↑8.9%) was the fifth consecutive quarterly increase. While residential construction improved since April of last year, the real private residential investment at $359.7 billion during the second quarter was 54 percent below the peak of $783.5 billion during the fourth quarter of 2005 – the peak of the national housing boom.
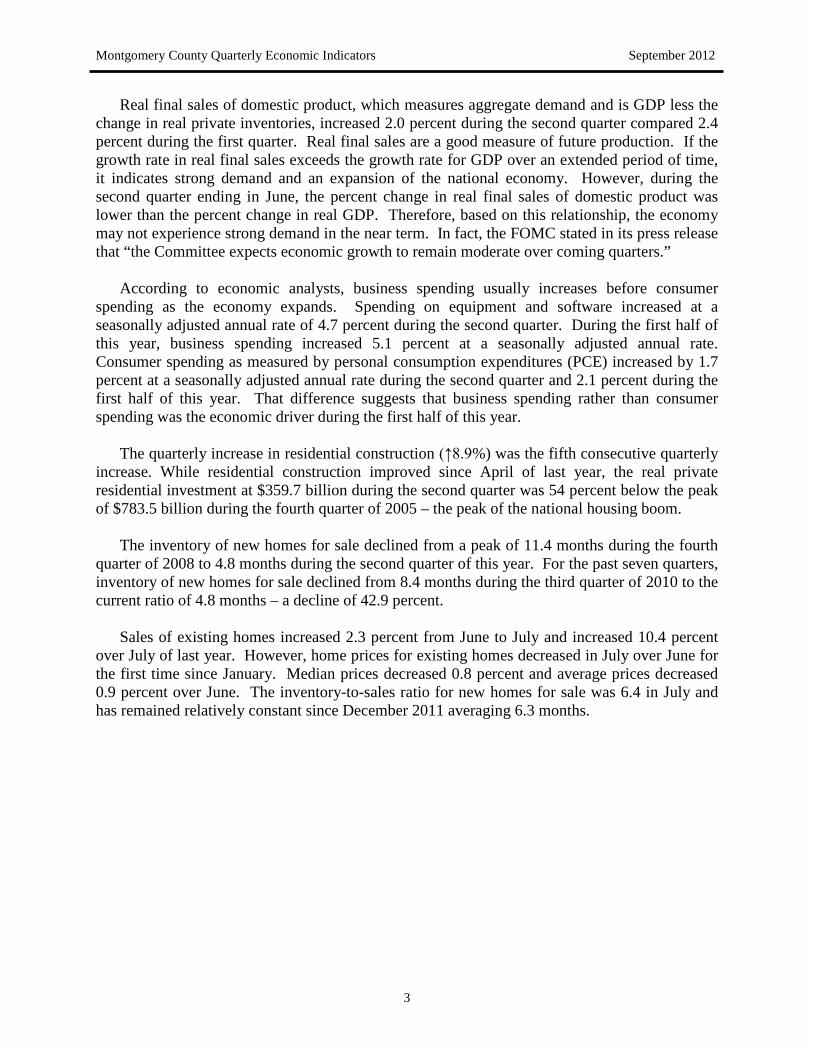
The inventory of new homes for sale declined from a peak of 11.4 months during the fourth
quarter of 2008 to 4.8 months during the second quarter of this year. For the past seven quarters, inventory of new homes for sale declined from 8.4 months during the third quarter of 2010 to the current ratio of 4.8 months – a decline of 42.9 percent.
Sales of existing homes increased 2.3 percent from June to July and increased 10.4 percent
over July of last year. However, home prices for existing homes decreased in July over June for the first time since January. Median prices decreased 0.8 percent and average prices decreased 0.9 percent over June. The inventory-to-sales ratio for new homes for sale was 6.4 in July and has remained relatively constant since December 2011 averaging 6.3 months.
Montgomery County Quarterly Economic Indicators September 2012
4
Average Quarterly Inventory to Sales Ratio New Home Sales
9.810.6 10.9 11.4 11.2
9.5
7.7 7.7 7.8 7.9 8.47.8 7.5
6.6 6.55.7
5.0 4.8
0.0
2.0
4.0
6.0
8.0
10.0
12.0
2008
:I
2008
:II
2008
:III
2008
:IV
2009
:I
2009
:II
2009
:III
2009
:IV
2010
:I
2010
:II
2010
:III
2011
:IV
2011
:I
2011
:II
2011
:III
2011
:IV
2012
:I
2012
:II
Quarter
Ratio
SOURCES: U.S. Census Bureau and U.S. Department of Housing and Urban Development Montgomery County Department of Finance
Because of the weak economic outlook and volatility in the stock market attributed mainly to
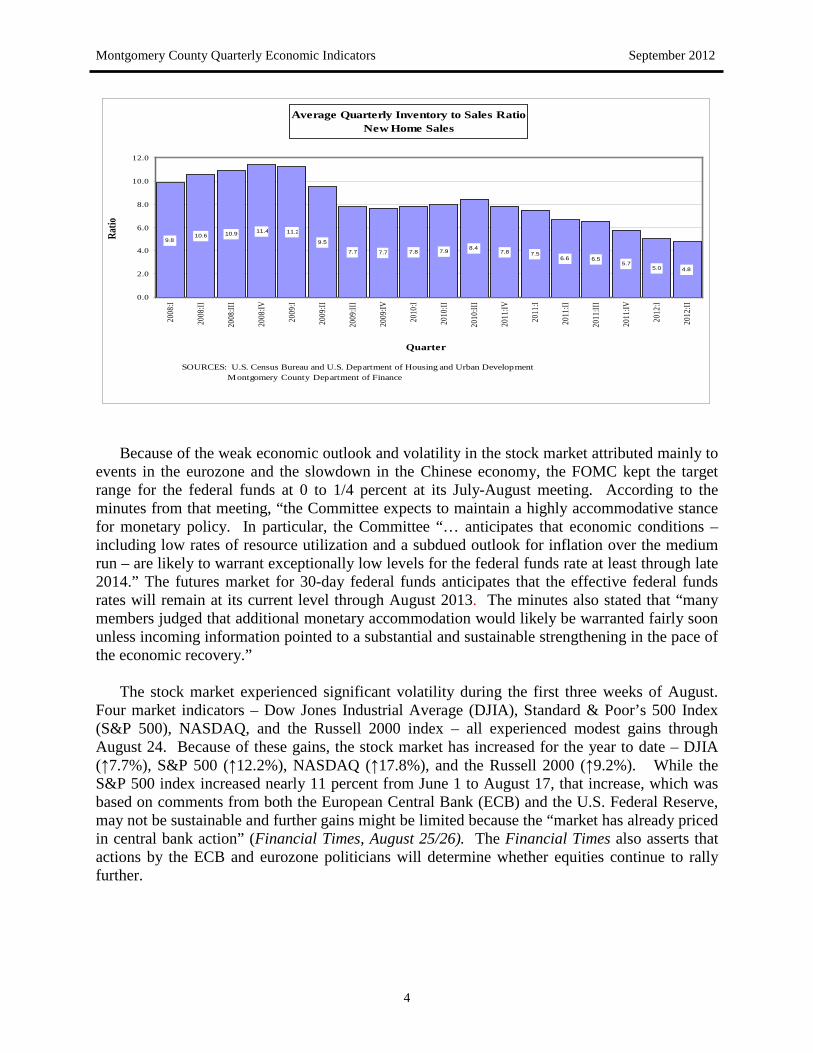
events in the eurozone and the slowdown in the Chinese economy, the FOMC kept the target range for the federal funds at 0 to 1/4 percent at its July-August meeting. According to the minutes from that meeting, “the Committee expects to maintain a highly accommodative stance for monetary policy. In particular, the Committee “… anticipates that economic conditions – including low rates of resource utilization and a subdued outlook for inflation over the medium run – are likely to warrant exceptionally low levels for the federal funds rate at least through late 2014.” The futures market for 30-day federal funds anticipates that the effective federal funds rates will remain at its current level through August 2013. The minutes also stated that “many members judged that additional monetary accommodation would likely be warranted fairly soon unless incoming information pointed to a substantial and sustainable strengthening in the pace of the economic recovery.”
The stock market experienced significant volatility during the first three weeks of August.
Four market indicators – Dow Jones Industrial Average (DJIA), Standard & Poor’s 500 Index (S&P 500), NASDAQ, and the Russell 2000 index – all experienced modest gains through August 24. Because of these gains, the stock market has increased for the year to date – DJIA (↑7.7%), S&P 500 (↑12.2%), NASDAQ (↑17.8%), and the Russell 2000 (↑9.2%). While the S&P 500 index increased nearly 11 percent from June 1 to August 17, that increase, which was based on comments from both the European Central Bank (ECB) and the U.S. Federal Reserve, may not be sustainable and further gains might be limited because the “market has already priced in central bank action” (Financial Times, August 25/26). The Financial Times also asserts that actions by the ECB and eurozone politicians will determine whether equities continue to rally further.
Montgomery County Quarterly Economic Indicators September 2012
5
Effective Federal Funds Rate (solid bars) and Federal Funds Futures (hatched bars)
0.00%0.50%1.00%1.50%2.00%2.50%3.00%3.50%4.00%4.50%5.00%5.50%
Aug-
07Oc
t-07
Dec-
07Fe
b-08
Apr-0
8Ju
n-08
Aug-
08Oc
t-08
Dec-
08Fe
b-09
Apr-0
9Ju
n-09
Aug-
09Oc
t-09
Dec-
09Fe
b-10
Apr-1
0Ju
n-10
Aug-
10Oc
t-10
Dec-
10Fe
b-11
Apr-1
1Ju
n-11
Aug-
11Oc
t-11
Dec-
11Fe
b-12
Apr-1
2Ju
n-12
Aug-
12Oc
t-12
Dec-
12Fe
b-13
Apr-1
3Ju
n-13
Aug-
13
Date
Fed
Fund
s Rat
e
SOURCES: Federal Reserve Bank of St. Louis (solid bars) and the Chicago Board of Trade (hatched bars) as of August 26, 2012
The volatility in the stock market is reflected in the Chicago Board of Options Exchange’s
Market Volatility Index (VIX) known as the “fear index.” The index is one measure of the market’s expectation of stock volatility. On August 24, the index closed at 15.18 and well below the peak close after the Lehman Brothers bankruptcy – an intraday high of 89.53 on October 24, 2008 and one of the lowest levels this calendar year.
The question is whether the rally in the equity market since June has led to lower risk as
measured by the VIX or has the lower VIX led to a rally in the equity market. Certainly recent comments from the central bankers have lowered the stress about the eurozone crisis and created an environment for more risk taking by investors thereby fueling the recent rally in equities and bonds.
REGIONAL ECONOMY
According to the employment data from the Bureau of Labor Statistics, U.S. Department of
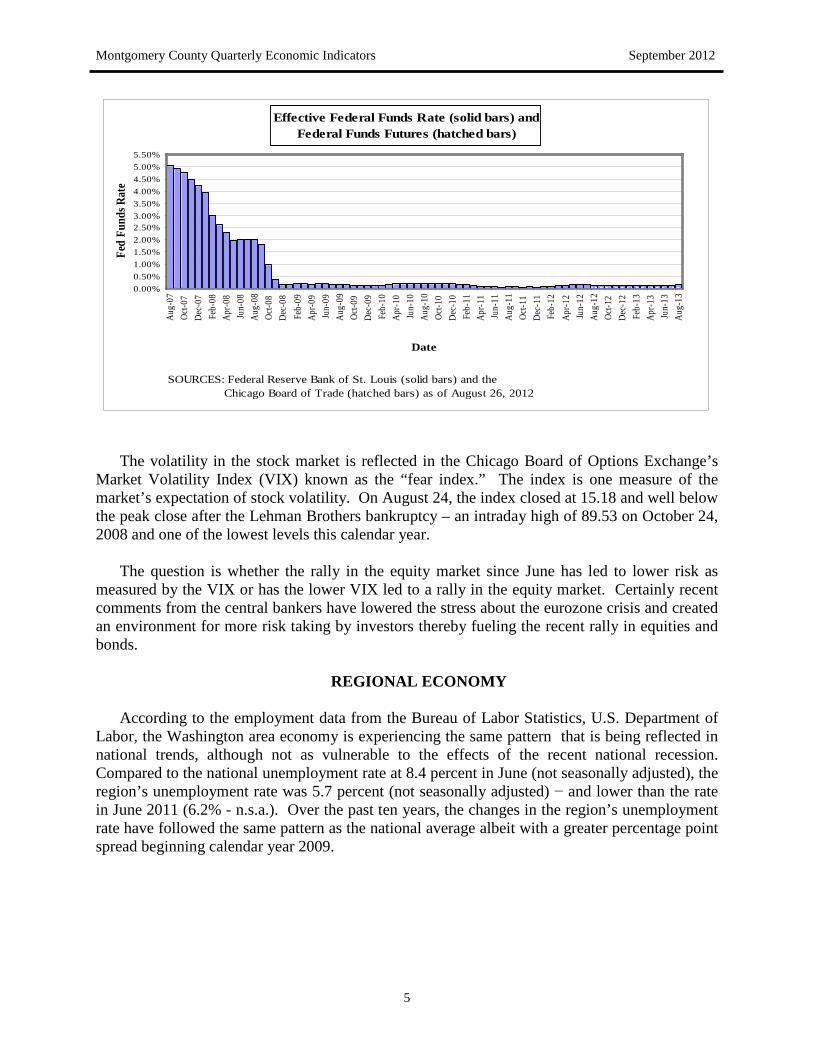
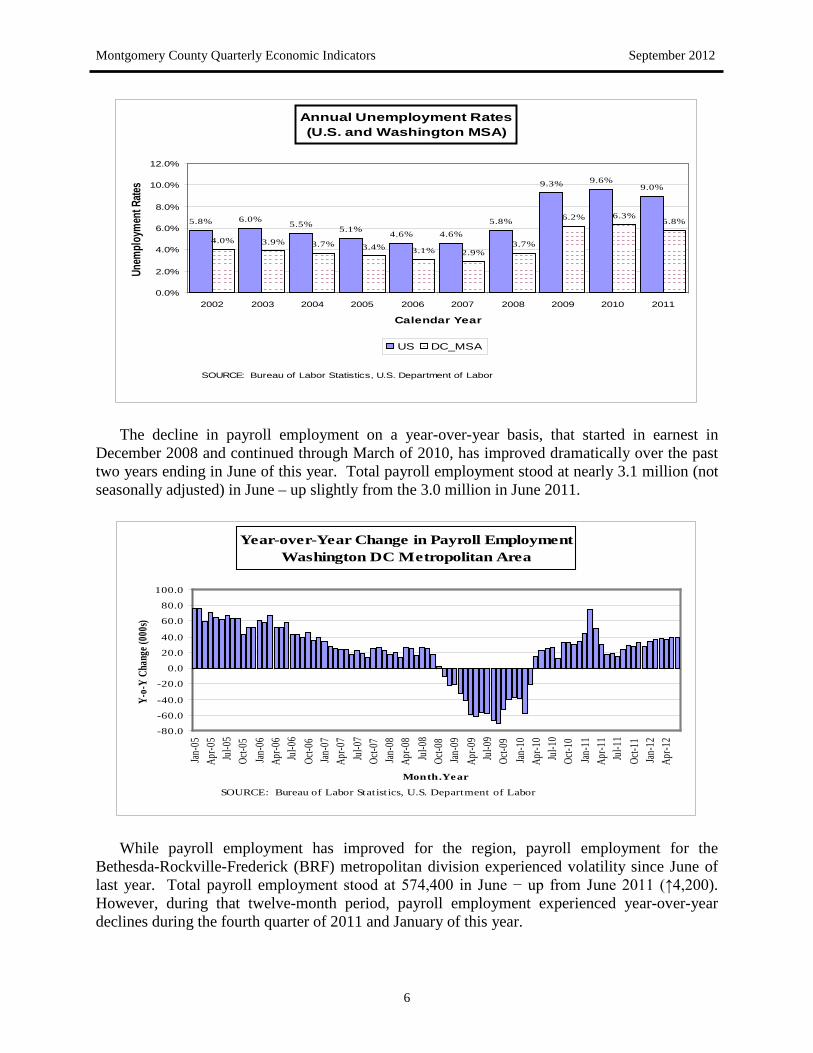
Labor, the Washington area economy is experiencing the same pattern that is being reflected in national trends, although not as vulnerable to the effects of the recent national recession. Compared to the national unemployment rate at 8.4 percent in June (not seasonally adjusted), the region’s unemployment rate was 5.7 percent (not seasonally adjusted) − and lower than the rate in June 2011 (6.2% - n.s.a.). Over the past ten years, the changes in the region’s unemployment rate have followed the same pattern as the national average albeit with a greater percentage point spread beginning calendar year 2009.
Montgomery County Quarterly Economic Indicators September 2012
6
Annual Unemployment Rates (U.S. and Washington MSA)
5.8% 6.0% 5.5% 5.1% 4.6% 4.6%5.8%
9.3% 9.6%9.0%
4.0% 3.9% 3.7% 3.4% 3.1% 2.9%3.7%
6.2% 6.3%5.8%
0.0%
2.0%
4.0%
6.0%
8.0%
10.0%
12.0%
2002 2003 2004 2005 2006 2007 2008 2009 2010 2011
Calendar Year
Unem
ploym
ent R
ates
US DC_MSA
SOURCE: Bureau of Labor Statistics, U.S. Department of Labor
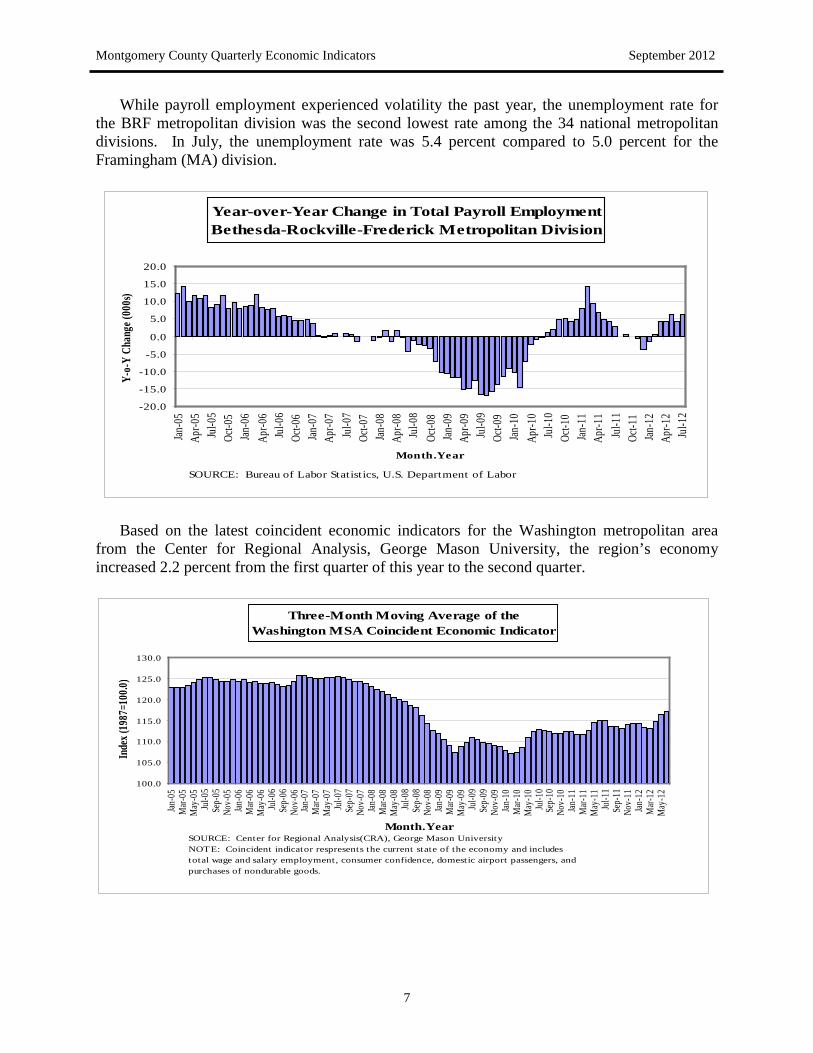
The decline in payroll employment on a year-over-year basis, that started in earnest in
December 2008 and continued through March of 2010, has improved dramatically over the past two years ending in June of this year. Total payroll employment stood at nearly 3.1 million (not seasonally adjusted) in June – up slightly from the 3.0 million in June 2011.
Year-over-Year Change in Payroll Employment Washington DC Metropolitan Area
-80.0
-60.0
-40.0
-20.0
0.0
20.0
40.0
60.0
80.0
100.0
Jan-0
5Ap
r-05
Jul-0
5Oc
t-05
Jan-0
6Ap
r-06
Jul-0
6Oc
t-06
Jan-0
7Ap
r-07
Jul-0
7Oc
t-07
Jan-0
8Ap
r-08
Jul-0
8Oc
t-08
Jan-0
9Ap
r-09
Jul-0
9Oc
t-09
Jan-1
0Ap
r-10
Jul-1
0Oc
t-10
Jan-1
1Ap
r-11
Jul-1
1Oc
t-11
Jan-1
2Ap
r-12
Month.Year
Y-o-
Y Ch
ange
(000
s)
SOURCE: Bureau of Labor Statistics, U.S. Department of Labor
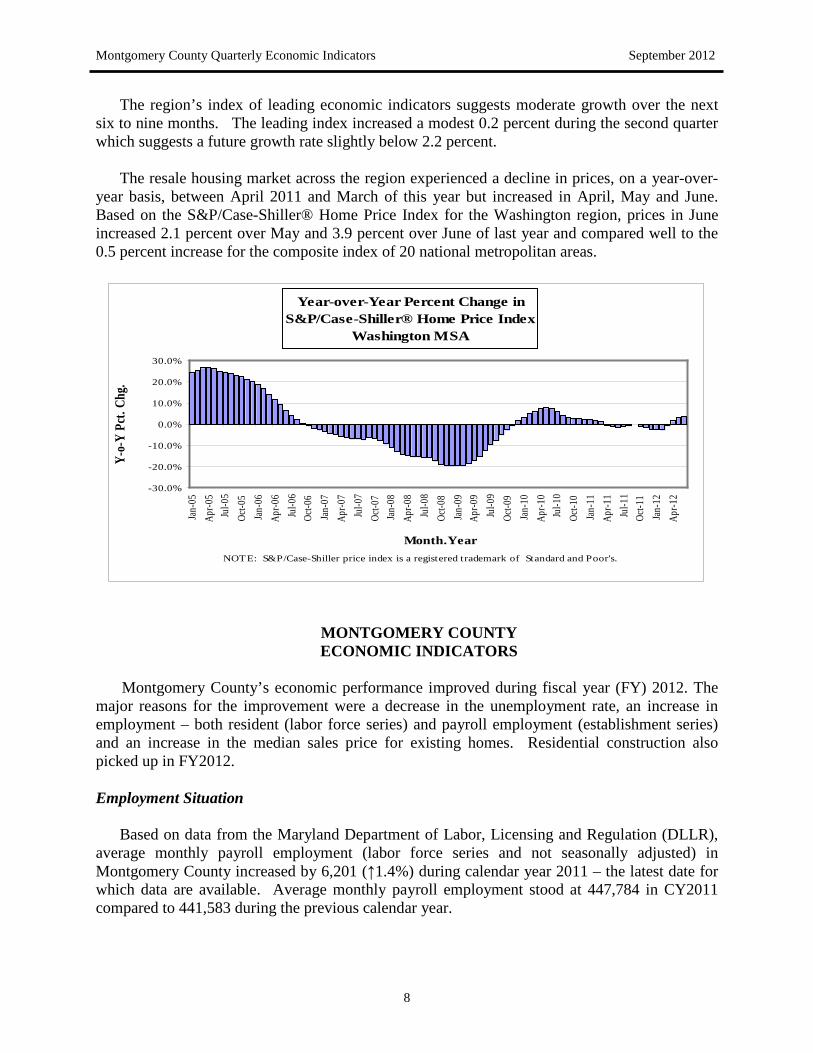
While payroll employment has improved for the region, payroll employment for the
Bethesda-Rockville-Frederick (BRF) metropolitan division experienced volatility since June of last year. Total payroll employment stood at 574,400 in June − up from June 2011 (↑4,200). However, during that twelve-month period, payroll employment experienced year-over-year declines during the fourth quarter of 2011 and January of this year.
Montgomery County Quarterly Economic Indicators September 2012
7
While payroll employment experienced volatility the past year, the unemployment rate for the BRF metropolitan division was the second lowest rate among the 34 national metropolitan divisions. In July, the unemployment rate was 5.4 percent compared to 5.0 percent for the Framingham (MA) division.
Year-over-Year Change in Total Payroll Employment Bethesda-Rockville-Frederick Metropolitan Division
-20.0
-15.0
-10.0
-5.0
0.0
5.0
10.0
15.0
20.0
Jan-0
5Ap
r-05
Jul-0
5Oc
t-05
Jan-0
6Ap
r-06
Jul-0
6Oc
t-06
Jan-0
7Ap
r-07
Jul-0
7Oc
t-07
Jan-0
8Ap
r-08
Jul-0
8Oc
t-08
Jan-0
9Ap
r-09
Jul-0
9Oc
t-09
Jan-1
0Ap
r-10
Jul-1
0Oc
t-10
Jan-1
1Ap
r-11
Jul-1
1Oc
t-11
Jan-1
2Ap
r-12
Jul-1
2
Month.Year
Y-o-
Y Ch
ange
(000
s)
SOURCE: Bureau of Labor Statistics, U.S. Department of Labor
Based on the latest coincident economic indicators for the Washington metropolitan area from the Center for Regional Analysis, George Mason University, the region’s economy increased 2.2 percent from the first quarter of this year to the second quarter.
Three-Month Moving Average of the Washington MSA Coincident Economic Indicator
100.0
105.0
110.0
115.0
120.0
125.0
130.0
Jan-0
5M
ar-05
May
-05
Jul-0
5Se
p-05
Nov-
05Jan
-06
Mar-
06M
ay-0
6Ju
l-06
Sep-
06No
v-06
Jan-0
7M
ar-07
May
-07
Jul-0
7Se
p-07
Nov-
07Jan
-08
Mar-
08M
ay-0
8Ju
l-08
Sep-
08No
v-08
Jan-0
9M
ar-09
May
-09
Jul-0
9Se
p-09
Nov-
09Jan
-10
Mar-
10M
ay-1
0Ju
l-10
Sep-
10No
v-10
Jan-1
1M
ar-11
May
-11
Jul-1
1Se
p-11
Nov-
11Jan
-12
Mar-
12M
ay-1
2
Month.Year
Inde
x (19
87=1
00.0)
SOURCE: Center for Regional Analysis(CRA), George Mason UniversityNOTE: Coincident indicator respresents the current state of the economy and includes total wage and salary employment, consumer confidence, domestic airport passengers, and purchases of nondurable goods.
Montgomery County Quarterly Economic Indicators September 2012
8
The region’s index of leading economic indicators suggests moderate growth over the next six to nine months. The leading index increased a modest 0.2 percent during the second quarter which suggests a future growth rate slightly below 2.2 percent.
The resale housing market across the region experienced a decline in prices, on a year-over-
year basis, between April 2011 and March of this year but increased in April, May and June. Based on the S&P/Case-Shiller® Home Price Index for the Washington region, prices in June increased 2.1 percent over May and 3.9 percent over June of last year and compared well to the 0.5 percent increase for the composite index of 20 national metropolitan areas.
Year-over-Year Percent Change in S&P/Case-Shiller® Home Price Index
Washington MSA
-30.0%
-20.0%
-10.0%
0.0%
10.0%
20.0%
30.0%
Jan-
05Ap
r-05
Jul-0
5Oc
t-05
Jan-
06Ap
r-06
Jul-0
6Oc
t-06
Jan-
07Ap
r-07
Jul-0
7Oc
t-07
Jan-
08Ap
r-08
Jul-0
8Oc
t-08
Jan-
09Ap
r-09
Jul-0
9Oc
t-09
Jan-
10Ap
r-10
Jul-1
0Oc
t-10
Jan-
11Ap
r-11
Jul-1
1Oc
t-11
Jan-
12Ap
r-12
Month.Year
Y-o-
Y Pc
t. Ch
g.
NOTE: S&P/Case-Shiller price index is a registered trademark of Standard and Poor's.
MONTGOMERY COUNTY ECONOMIC INDICATORS
Montgomery County’s economic performance improved during fiscal year (FY) 2012. The
major reasons for the improvement were a decrease in the unemployment rate, an increase in employment – both resident (labor force series) and payroll employment (establishment series) and an increase in the median sales price for existing homes. Residential construction also picked up in FY2012. Employment Situation
Based on data from the Maryland Department of Labor, Licensing and Regulation (DLLR), average monthly payroll employment (labor force series and not seasonally adjusted) in Montgomery County increased by 6,201 (↑1.4%) during calendar year 2011 – the latest date for which data are available. Average monthly payroll employment stood at 447,784 in CY2011 compared to 441,583 during the previous calendar year.
Montgomery County Quarterly Economic Indicators September 2012
9
However, the County’s total payroll employment, as derived by the Department of Finance incorporating the establishment series from the Bureau of Labor Statistics (BLS), U.S. Department of Labor, for the Bethesda-Rockville-Frederick metropolitan division increased by a monthly average of 2,200 jobs (↑0.5%) during FY2012. Total payroll employment stood at a monthly average of 469,700 jobs during the fiscal year compared to a monthly average of 467,500 in fiscal year 2011. The discrepancy between the series is attributed to the sources of payroll data. The DLLR series is derived from the unemployment insurance program while the BLS series is derived from a survey of establishments.
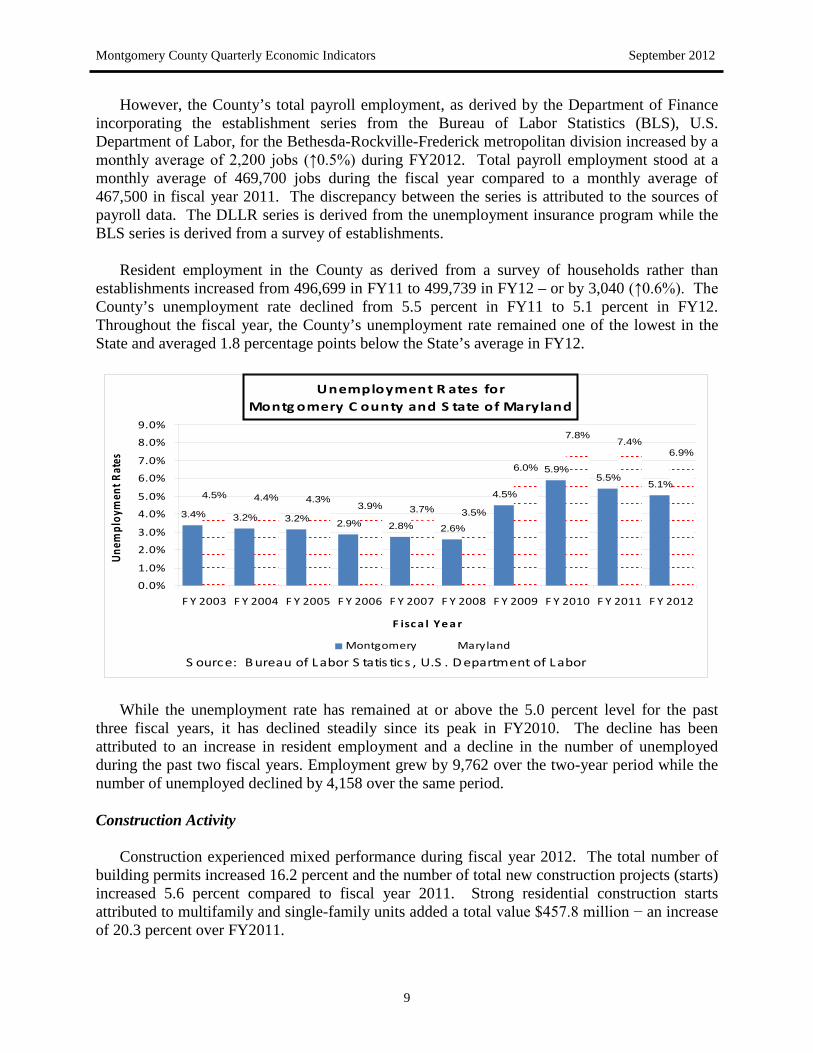
Resident employment in the County as derived from a survey of households rather than
establishments increased from 496,699 in FY11 to 499,739 in FY12 – or by 3,040 (↑0.6%). The County’s unemployment rate declined from 5.5 percent in FY11 to 5.1 percent in FY12. Throughout the fiscal year, the County’s unemployment rate remained one of the lowest in the State and averaged 1.8 percentage points below the State’s average in FY12.
Unemployment R ates for Montg omery C ounty and S tate of Maryland
3.4% 3.2% 3.2% 2.9% 2.8% 2.6%
4.5%
5.9%5.5%
5.1%4.5% 4.4% 4.3%
3.9% 3.7% 3.5%
6.0%
7.8%7.4%
6.9%
0.0%
1.0%
2.0%
3.0%
4.0%
5.0%
6.0%
7.0%
8.0%
9.0%
F Y 2003 F Y 2004 F Y 2005 F Y 2006 F Y 2007 F Y 2008 F Y 2009 F Y 2010 F Y 2011 F Y 2012
F isc a l Yea r
Unem
ploy
men
t Rat
es
Montgomery Maryland
S ource: B ureau of Labor S tatis tics , U.S . D epartment of Labor
While the unemployment rate has remained at or above the 5.0 percent level for the past
three fiscal years, it has declined steadily since its peak in FY2010. The decline has been attributed to an increase in resident employment and a decline in the number of unemployed during the past two fiscal years. Employment grew by 9,762 over the two-year period while the number of unemployed declined by 4,158 over the same period. Construction Activity
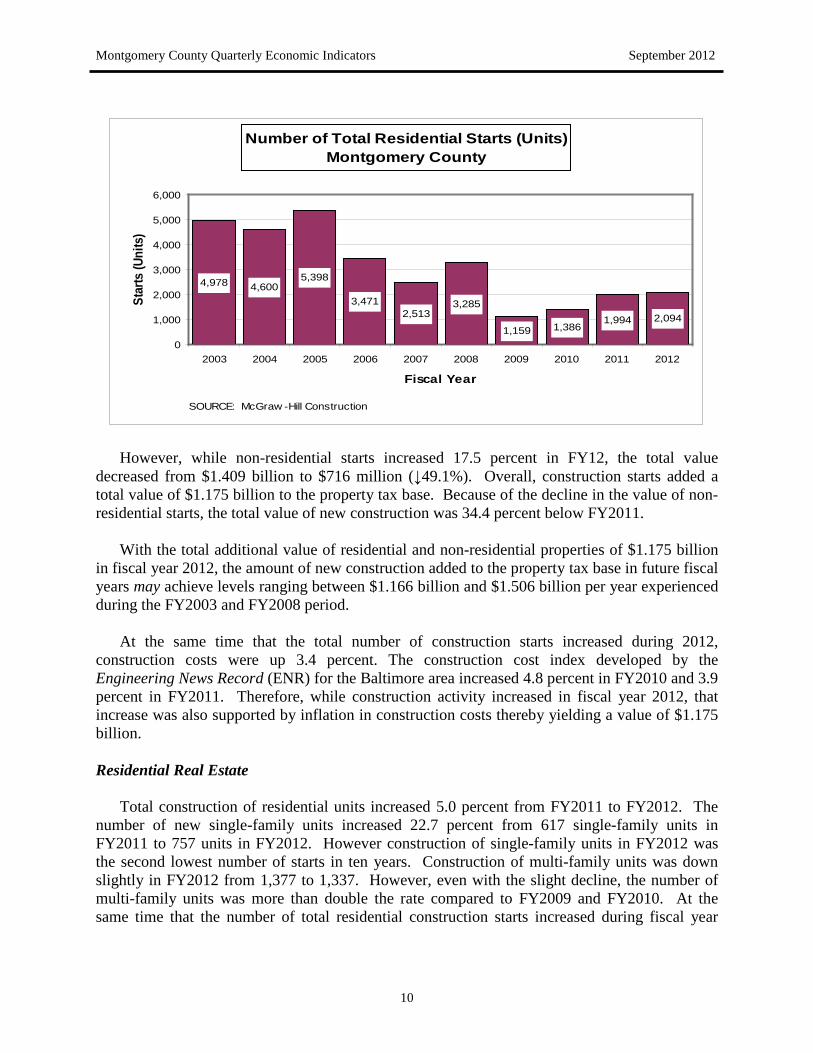
Construction experienced mixed performance during fiscal year 2012. The total number of building permits increased 16.2 percent and the number of total new construction projects (starts) increased 5.6 percent compared to fiscal year 2011. Strong residential construction starts attributed to multifamily and single-family units added a total value $457.8 million − an increase of 20.3 percent over FY2011.
Montgomery County Quarterly Economic Indicators September 2012
10
Number of Total Residential Starts (Units) Montgomery County
4,978 4,6005,398
3,4712,513
3,285
1,159 1,3861,994 2,094
0
1,000
2,000
3,000
4,000
5,000
6,000
2003 2004 2005 2006 2007 2008 2009 2010 2011 2012
Fiscal Year
Star
ts (U
nits
)
SOURCE: McGraw -Hill Construction
However, while non-residential starts increased 17.5 percent in FY12, the total value
decreased from $1.409 billion to $716 million (↓49.1%). Overall, construction starts added a total value of $1.175 billion to the property tax base. Because of the decline in the value of non-residential starts, the total value of new construction was 34.4 percent below FY2011.
With the total additional value of residential and non-residential properties of $1.175 billion
in fiscal year 2012, the amount of new construction added to the property tax base in future fiscal years may achieve levels ranging between $1.166 billion and $1.506 billion per year experienced during the FY2003 and FY2008 period.
At the same time that the total number of construction starts increased during 2012,
construction costs were up 3.4 percent. The construction cost index developed by the Engineering News Record (ENR) for the Baltimore area increased 4.8 percent in FY2010 and 3.9 percent in FY2011. Therefore, while construction activity increased in fiscal year 2012, that increase was also supported by inflation in construction costs thereby yielding a value of $1.175 billion. Residential Real Estate
Total construction of residential units increased 5.0 percent from FY2011 to FY2012. The
number of new single-family units increased 22.7 percent from 617 single-family units in FY2011 to 757 units in FY2012. However construction of single-family units in FY2012 was the second lowest number of starts in ten years. Construction of multi-family units was down slightly in FY2012 from 1,377 to 1,337. However, even with the slight decline, the number of multi-family units was more than double the rate compared to FY2009 and FY2010. At the same time that the number of total residential construction starts increased during fiscal year
Montgomery County Quarterly Economic Indicators September 2012
11
2012, the number of permitted units increased from 2,095 units in fiscal year 2011 to 2,277 units in fiscal year 2012 (↑8.7%) suggesting continued improvement in residential construction.
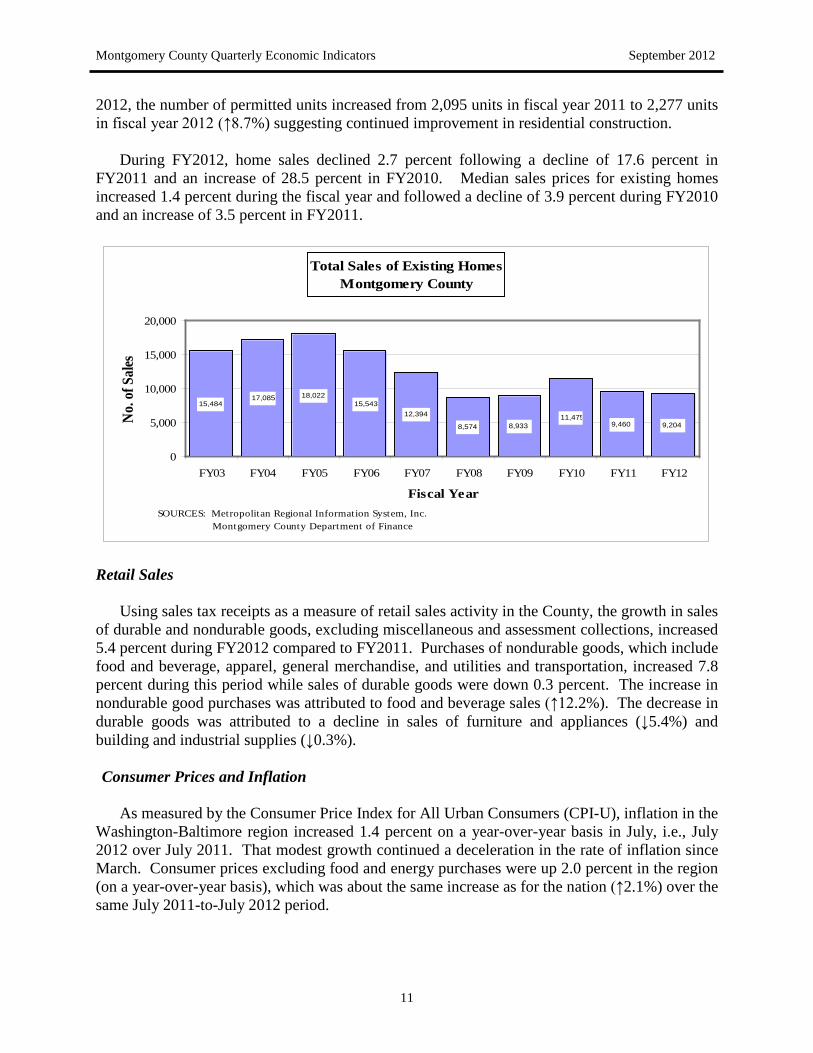
During FY2012, home sales declined 2.7 percent following a decline of 17.6 percent in FY2011 and an increase of 28.5 percent in FY2010. Median sales prices for existing homes increased 1.4 percent during the fiscal year and followed a decline of 3.9 percent during FY2010 and an increase of 3.5 percent in FY2011.
Total Sales of Existing Homes Montgomery County
15,48417,085 18,022
15,54312,394
8,574 8,93311,475
9,460 9,204
0
5,000
10,000
15,000
20,000
FY03 FY04 FY05 FY06 FY07 FY08 FY09 FY10 FY11 FY12
Fiscal Year
No.
of S
ales
SOURCES: Metropolitan Regional Information System, Inc. Montgomery County Department of Finance
Retail Sales
Using sales tax receipts as a measure of retail sales activity in the County, the growth in sales of durable and nondurable goods, excluding miscellaneous and assessment collections, increased 5.4 percent during FY2012 compared to FY2011. Purchases of nondurable goods, which include food and beverage, apparel, general merchandise, and utilities and transportation, increased 7.8 percent during this period while sales of durable goods were down 0.3 percent. The increase in nondurable good purchases was attributed to food and beverage sales (↑12.2%). The decrease in durable goods was attributed to a decline in sales of furniture and appliances (↓5.4%) and building and industrial supplies (↓0.3%). Consumer Prices and Inflation
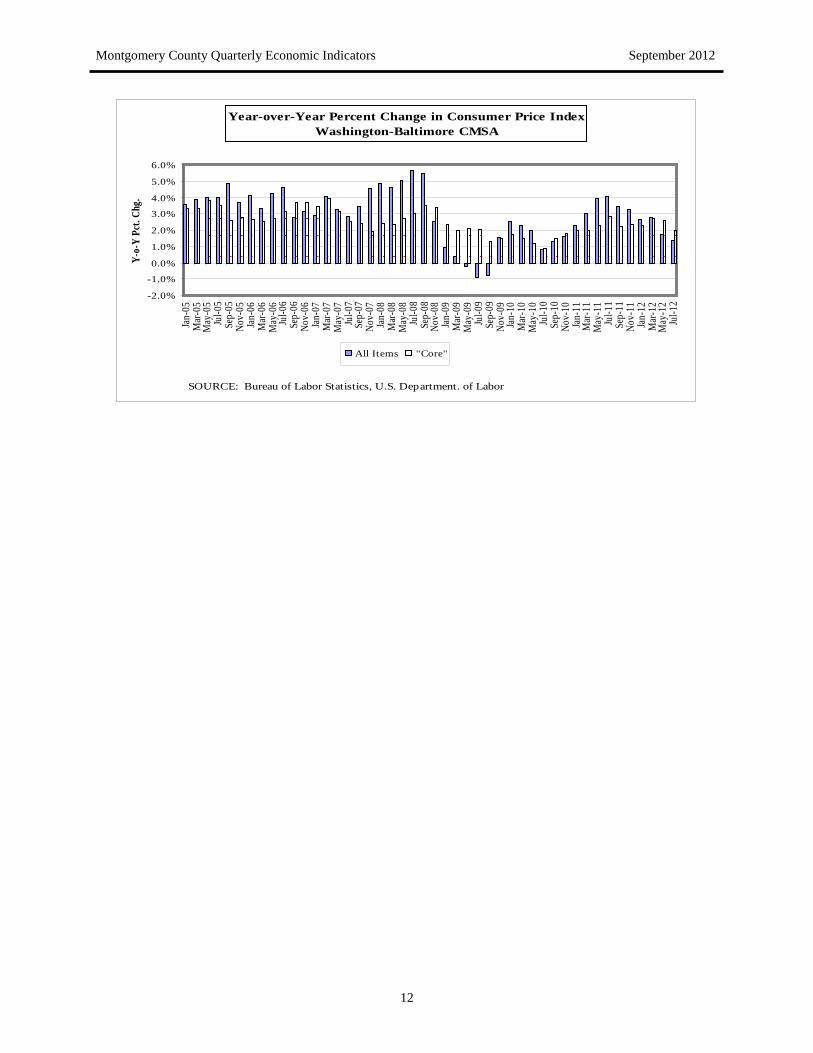
As measured by the Consumer Price Index for All Urban Consumers (CPI-U), inflation in the Washington-Baltimore region increased 1.4 percent on a year-over-year basis in July, i.e., July 2012 over July 2011. That modest growth continued a deceleration in the rate of inflation since March. Consumer prices excluding food and energy purchases were up 2.0 percent in the region (on a year-over-year basis), which was about the same increase as for the nation (↑2.1%) over the same July 2011-to-July 2012 period.
Montgomery County Quarterly Economic Indicators September 2012
12
Year-over-Year Percent Change in Consumer Price Index Washington-Baltimore CMSA
-2.0%
-1.0%
0.0%
1.0%
2.0%
3.0%
4.0%
5.0%
6.0%
Jan-
05M
ar-0
5M
ay-0
5Ju
l-05
Sep-
05No
v-05
Jan-
06M
ar-0
6M
ay-0
6Ju
l-06
Sep-
06No
v-06
Jan-
07M
ar-0
7M
ay-0
7Ju
l-07
Sep-
07No
v-07
Jan-
08M
ar-0
8M
ay-0
8Ju
l-08
Sep-
08No
v-08
Jan-
09M
ar-0
9M
ay-0
9Ju
l-09
Sep-
09No
v-09
Jan-
10M
ar-1
0M
ay-1
0Ju
l-10
Sep-
10No
v-10
Jan-
11M
ar-1
1M
ay-1
1Ju
l-11
Sep-
11No
v-11
Jan-
12M
ar-1
2M
ay-1
2Ju
l-12
Y-o-
Y Pc
t. Ch
g.
All Items "Core"
SOURCE: Bureau of Labor Statistics, U.S. Department. of Labor
Montgomery County Quarterly Economic Indicators September 2012
13
CONCLUSION
While the County’s economy improved during FY2012, the results are mixed. Although the average monthly unemployment rate declined in FY2012 to 5.1 percent, it remained elevated. Employment measured either by the survey of establishments or households increased in FY2012 but not at rates to drive the unemployment rate below 5 percent. Residential construction improved with the construction of single-family homes up 27.7 percent and construction of multi-family units above 1,330 for the second year in a row. However, sales of existing homes declined for the second year in a row. If sales do not begin to increase, there is a risk of excess capacity in the residential real estate market.
Montgomery County Quarterly Economic Indicators September 2012
14
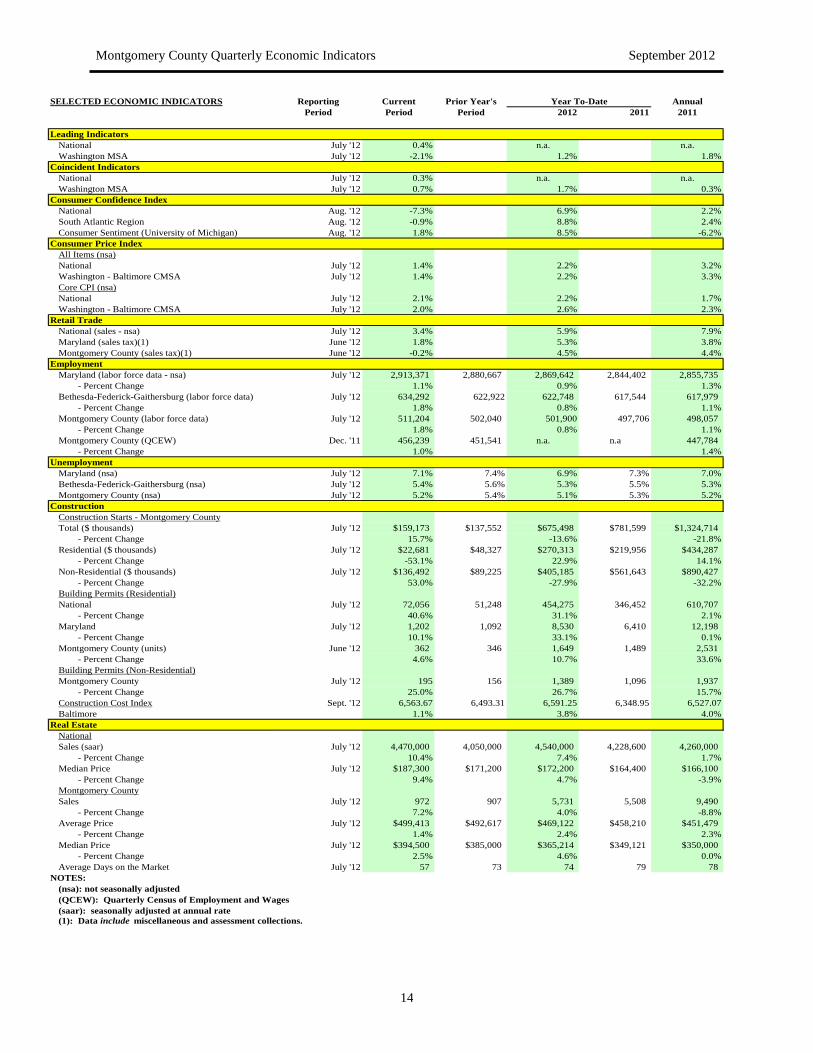
SELECTED ECONOMIC INDICATORS Reporting Current Prior Year's Year To-Date AnnualPeriod Period Period 2012 2011 2011
Leading IndicatorsNational July '12 0.4% n.a. n.a.Washington MSA July '12 -2.1% 1.2% 1.8%
Coincident IndicatorsNational July '12 0.3% n.a. n.a.Washington MSA July '12 0.7% 1.7% 0.3%
Consumer Confidence IndexNational Aug. '12 -7.3% 6.9% 2.2%South Atlantic Region Aug. '12 -0.9% 8.8% 2.4%Consumer Sentiment (University of Michigan) Aug. '12 1.8% 8.5% -6.2%
Consumer Price IndexAll Items (nsa)National July '12 1.4% 2.2% 3.2%Washington - Baltimore CMSA July '12 1.4% 2.2% 3.3%Core CPI (nsa)National July '12 2.1% 2.2% 1.7%Washington - Baltimore CMSA July '12 2.0% 2.6% 2.3%
Retail TradeNational (sales - nsa) July '12 3.4% 5.9% 7.9%Maryland (sales tax)(1) June '12 1.8% 5.3% 3.8%Montgomery County (sales tax)(1) June '12 -0.2% 4.5% 4.4%
EmploymentMaryland (labor force data - nsa) July '12 2,913,371 2,880,667 2,869,642 2,844,402 2,855,735 - Percent Change 1.1% 0.9% 1.3%Bethesda-Federick-Gaithersburg (labor force data) July '12 634,292 622,922 622,748 617,544 617,979 - Percent Change 1.8% 0.8% 1.1%Montgomery County (labor force data) July '12 511,204 502,040 501,900 497,706 498,057 - Percent Change 1.8% 0.8% 1.1%Montgomery County (QCEW) Dec. '11 456,239 451,541 n.a. n.a 447,784 - Percent Change 1.0% 1.4%
UnemploymentMaryland (nsa) July '12 7.1% 7.4% 6.9% 7.3% 7.0%Bethesda-Federick-Gaithersburg (nsa) July '12 5.4% 5.6% 5.3% 5.5% 5.3%Montgomery County (nsa) July '12 5.2% 5.4% 5.1% 5.3% 5.2%
ConstructionConstruction Starts - Montgomery CountyTotal ($ thousands) July '12 $159,173 $137,552 $675,498 $781,599 $1,324,714 - Percent Change 15.7% -13.6% -21.8%Residential ($ thousands) July '12 $22,681 $48,327 $270,313 $219,956 $434,287 - Percent Change -53.1% 22.9% 14.1%Non-Residential ($ thousands) July '12 $136,492 $89,225 $405,185 $561,643 $890,427 - Percent Change 53.0% -27.9% -32.2%Building Permits (Residential)National July '12 72,056 51,248 454,275 346,452 610,707 - Percent Change 40.6% 31.1% 2.1%Maryland July '12 1,202 1,092 8,530 6,410 12,198 - Percent Change 10.1% 33.1% 0.1%Montgomery County (units) June '12 362 346 1,649 1,489 2,531 - Percent Change 4.6% 10.7% 33.6%Building Permits (Non-Residential)Montgomery County July '12 195 156 1,389 1,096 1,937 - Percent Change 25.0% 26.7% 15.7%Construction Cost Index Sept. '12 6,563.67 6,493.31 6,591.25 6,348.95 6,527.07Baltimore 1.1% 3.8% 4.0%
Real EstateNationalSales (saar) July '12 4,470,000 4,050,000 4,540,000 4,228,600 4,260,000 - Percent Change 10.4% 7.4% 1.7%Median Price July '12 $187,300 $171,200 $172,200 $164,400 $166,100 - Percent Change 9.4% 4.7% -3.9%Montgomery CountySales July '12 972 907 5,731 5,508 9,490 - Percent Change 7.2% 4.0% -8.8%Average Price July '12 $499,413 $492,617 $469,122 $458,210 $451,479 - Percent Change 1.4% 2.4% 2.3%Median Price July '12 $394,500 $385,000 $365,214 $349,121 $350,000 - Percent Change 2.5% 4.6% 0.0%Average Days on the Market July '12 57 73 74 79 78
NOTES:(nsa): not seasonally adjusted(QCEW): Quarterly Census of Employment and Wages(saar): seasonally adjusted at annual rate(1): Data include miscellaneous and assessment collections.