Untargeted Metabolic Quantitative Trait Loci Analyses ... · PDF fileUntargeted Metabolic...
13
Untargeted Metabolic Quantitative Trait Loci Analyses Reveal a Relationship between Primary Metabolism and Potato Tuber Quality 1[W][OA] Natalia Carreno-Quintero 2 , Animesh Acharjee 2 , Chris Maliepaard, Christian W.B. Bachem, Roland Mumm, Harro Bouwmeester*, Richard G.F. Visser, and Joost J.B. Keurentjes Laboratory of Plant Physiology (N.C.-Q., H.B., J.J.B.K.), Wageningen University & Research centre Plant Breeding (A.A., C.M., C.W.B.B., R.G.F.V.), and Laboratory of Genetics (J.J.B.K.), Wageningen University, 6708 PB Wageningen, The Netherlands; Plant Research International, Wageningen University & Research centre, 6708 PB Wageningen, The Netherlands (R.M.); and Centre for BioSystems Genomics, 6700 AB Wageningen, The Netherlands (N.C.-Q., R.M., H.B., R.G.F.V., J.J.B.K.) Recent advances in -omics technologies such as transcriptomics, metabolomics, and proteomics along with genotypic profiling have permitted dissection of the genetics of complex traits represented by molecular phenotypes in nonmodel species. To identify the genetic factors underlying variation in primary metabolism in potato (Solanum tuberosum), we have profiled primary metabolite content in a diploid potato mapping population, derived from crosses between S. tuberosum and wild relatives, using gas chromatography-time of flight-mass spectrometry. In total, 139 polar metabolites were detected, of which we identified metabolite quantitative trait loci for approximately 72% of the detected compounds. In order to obtain an insight into the relationships between metabolic traits and classical phenotypic traits, we also analyzed statistical associations between them. The combined analysis of genetic information through quantitative trait locus coincidence and the application of statistical learning methods provide information on putative indicators associated with the alterations in metabolic networks that affect complex phenotypic traits. The variation observed in phenotypic trait values in plants is often of quantitative nature, and it remains challenging to unravel the genetic basis of these traits. Quantitative trait locus (QTL) mapping is currently the most commonly used approach to dissect the genetic factors underlying complex traits. The goal of QTL mapping is to identify genomic regions associated with a specific complex phenotype by statistical analysis of the associations between genetic markers and phenotypic variation (Doerge, 2002). Recently, advances in high- throughput analysis and analytical detection methods have facilitated more integrated approaches to measure global phenotypic variation at the molecular level. Me- tabolite profiling is a rapidly evolving technology that has significantly increased the possibilities of performing high-throughput analysis of hundreds to thousands of compounds in a range of plants, including complex crop species. Metabolite composition is of great importance in crop plants, as a number of important traits such as biotic and abiotic stress resistance, postharvest processing, and nutritional value are largely dependent on the metabolic content (Fernie and Schauer, 2009). In potato (Solanum tuberosum) breeding, metabolo- mic studies have progressively increased in impor- tance, as many potato tuber traits such as content and quality of starch, chipping quality, flesh color, taste, and glycoalkaloid content have been shown to be linked to a wide range of metabolites (Coffin et al., 1987; Dobson et al., 2008). As a result, tuber quality can be assessed by assaying a range of metabolites. Gas chromatography-time of flight-mass spectrometry (GC-TOF-MS) has been shown to be useful for the rapid and highly sensitive detection of a large fraction of plant metabolites covering the central pathways of primary metabolism (Roessner et al., 2000; Lisec et al., 2006). In potato, untargeted metabolomic approaches by GC-MS have been successfully applied to assess changes in metabolites under different conditions (Roessner et al., 2000; Urbanczyk-Wochniak et al., 2005), to evaluate the metabolic response to various genetic modifications (Roessner et al., 2001; Szopa et al., 2001; Davies et al., 2005), and to explore the 1 This work was supported by the Centre for BioSystems Ge- nomics, an initiative under the auspices of the Netherlands Ge- nomics Initiative. 2 These authors contributed equally to the article. * Corresponding author; e-mail [email protected]. The author responsible for distribution of materials integral to the findings presented in this article in accordance with the policy described in the Instructions for Authors (www.plantphysiol.org) is: Harro Bouwmeester ([email protected]). [W] The online version of this article contains Web-only data. [OA] Open Access articles can be viewed online without a sub- scription. www.plantphysiol.org/cgi/doi/10.1104/pp.111.188441 1306 Plant Physiology Ò , March 2012, Vol. 158, pp. 1306–1318, www.plantphysiol.org Ó 2012 American Society of Plant Biologists. All Rights Reserved. www.plantphysiol.org on May 6, 2018 - Published by Downloaded from Copyright © 2012 American Society of Plant Biologists. All rights reserved.
Transcript of Untargeted Metabolic Quantitative Trait Loci Analyses ... · PDF fileUntargeted Metabolic...

Untargeted Metabolic Quantitative Trait Loci AnalysesReveal a Relationship between Primary Metabolismand Potato Tuber Quality1[W][OA]
Natalia Carreno-Quintero2, Animesh Acharjee2, Chris Maliepaard, Christian W.B. Bachem, Roland Mumm,Harro Bouwmeester*, Richard G.F. Visser, and Joost J.B. Keurentjes
Laboratory of Plant Physiology (N.C.-Q., H.B., J.J.B.K.), Wageningen University & Research centre PlantBreeding (A.A., C.M., C.W.B.B., R.G.F.V.), and Laboratory of Genetics (J.J.B.K.), Wageningen University, 6708PB Wageningen, The Netherlands; Plant Research International, Wageningen University & Research centre,6708 PB Wageningen, The Netherlands (R.M.); and Centre for BioSystems Genomics, 6700 AB Wageningen,The Netherlands (N.C.-Q., R.M., H.B., R.G.F.V.,J.J.B.K.)
Recent advances in -omics technologies such as transcriptomics, metabolomics, and proteomics along with genotypic profilinghave permitted dissection of the genetics of complex traits represented by molecular phenotypes in nonmodel species. Toidentify the genetic factors underlying variation in primary metabolism in potato (Solanum tuberosum), we have profiledprimary metabolite content in a diploid potato mapping population, derived from crosses between S. tuberosum and wildrelatives, using gas chromatography-time of flight-mass spectrometry. In total, 139 polar metabolites were detected, of whichwe identified metabolite quantitative trait loci for approximately 72% of the detected compounds. In order to obtain an insightinto the relationships between metabolic traits and classical phenotypic traits, we also analyzed statistical associations betweenthem. The combined analysis of genetic information through quantitative trait locus coincidence and the application ofstatistical learning methods provide information on putative indicators associated with the alterations in metabolic networksthat affect complex phenotypic traits.
The variation observed in phenotypic trait values inplants is often of quantitative nature, and it remainschallenging to unravel the genetic basis of these traits.Quantitative trait locus (QTL) mapping is currently themost commonly used approach to dissect the geneticfactors underlying complex traits. The goal of QTLmapping is to identify genomic regions associated witha specific complex phenotype by statistical analysis of theassociations between genetic markers and phenotypicvariation (Doerge, 2002). Recently, advances in high-throughput analysis and analytical detection methodshave facilitated more integrated approaches to measureglobal phenotypic variation at the molecular level. Me-tabolite profiling is a rapidly evolving technology that
has significantly increased the possibilities of performinghigh-throughput analysis of hundreds to thousands ofcompounds in a range of plants, including complex cropspecies. Metabolite composition is of great importance incrop plants, as a number of important traits such as bioticand abiotic stress resistance, postharvest processing, andnutritional value are largely dependent on the metaboliccontent (Fernie and Schauer, 2009).
In potato (Solanum tuberosum) breeding, metabolo-mic studies have progressively increased in impor-tance, as many potato tuber traits such as content andquality of starch, chipping quality, flesh color, taste,and glycoalkaloid content have been shown to belinked to a wide range of metabolites (Coffin et al.,1987; Dobson et al., 2008). As a result, tuber quality canbe assessed by assaying a range of metabolites. Gaschromatography-time of flight-mass spectrometry(GC-TOF-MS) has been shown to be useful for therapid and highly sensitive detection of a large fractionof plant metabolites covering the central pathways ofprimary metabolism (Roessner et al., 2000; Lisec et al.,2006). In potato, untargeted metabolomic approachesby GC-MS have been successfully applied to assesschanges in metabolites under different conditions(Roessner et al., 2000; Urbanczyk-Wochniak et al.,2005), to evaluate the metabolic response to variousgenetic modifications (Roessner et al., 2001; Szopaet al., 2001; Davies et al., 2005), and to explore the
1 This work was supported by the Centre for BioSystems Ge-nomics, an initiative under the auspices of the Netherlands Ge-nomics Initiative.
2 These authors contributed equally to the article.* Corresponding author; e-mail [email protected] author responsible for distribution of materials integral to the
findings presented in this article in accordance with the policydescribed in the Instructions for Authors (www.plantphysiol.org) is:Harro Bouwmeester ([email protected]).
[W] The online version of this article contains Web-only data.[OA] Open Access articles can be viewed online without a sub-
scription.www.plantphysiol.org/cgi/doi/10.1104/pp.111.188441
1306 Plant Physiology�, March 2012, Vol. 158, pp. 1306–1318, www.plantphysiol.org � 2012 American Society of Plant Biologists. All Rights Reserved. www.plantphysiol.orgon May 6, 2018 - Published by Downloaded from
Copyright © 2012 American Society of Plant Biologists. All rights reserved.

phytochemical diversity among potato cultivars andlandraces (Dobson et al., 2008, 2009). Additionally, me-tabolite profiling has been applied to monitor changesduring key stages in the tuber life cycle (Davies, 2007).Untargeted approaches have thus generated a substan-tial amount of data providing important informationconcerning compositional metabolite changes upon per-turbation and phytochemical diversity in potato. How-ever, so far, these studies have focused on applicationsof metabolite profiling as an evaluation and compara-tive tool. Technological developments and improveddata-processing techniques now also allow the use ofmetabolite profiling to obtain further insight into thegenetic factors controlling metabolic traits (Keurentjes,2009). Exploration of the genetic factors underlyingmetabolite variation in mapping populations is partic-ularly advantageous. The genetic variation betweenrelated individuals in a segregating mapping popula-tion can be exploited to locate the genomic regionsinvolved in the regulation of the observed metabolitevariation (Keurentjes et al., 2006).Here, we report on the metabolic profiling of a
segregating diploid potato population (C 3 E). Thispopulation is highly heterozygous and has been ana-lyzed in a number of studies to investigate the geneticarchitecture of quantitative traits (van Eck et al., 1994;Werij et al., 2007; Kloosterman et al., 2010; Wolterset al., 2010). For a number of traits, candidate genesand their allelic variants have been identified fromthese studies, including tuber flesh color and cookingtype (Kloosterman et al., 2010), tuber shape (van Ecket al., 1994), carotenoid biosynthesis (Wolters et al.,2010), and Met content (Kloosterman et al., 2010).In this study, we have used the C 3 E population to
explore the genetic basis of primary metabolites. Tothis end, untargeted GC-TOF-MS metabolic profilingwas carried out on a core set of individuals of the C3 Epopulation. In order to investigate the variation in thedetected metabolite levels in individuals of the popu-lation, we applied a genetical genomics approach(Jansen and Nap, 2001). QTL analysis of metabolitelevels resulted in the identification of genomic regionsassociated with the metabolic variation. In addition,we performed a parallel QTL analysis for starch- andcold sweetening-related traits, and genetically inferredlinks were established between these phenotypic traitsand primary metabolites. We further applied multi-variate analysis to the combined data sets of starch-related traits and metabolic profiles to determine thepredictive power of metabolites on a given phenotypictrait. For this, we used a Random Forest (RF; Breiman,2001) approach to find significant associations be-tween phenotypic and metabolic traits independentof genetic information. Putative predictors were testedand confirmed in an independent collection of potatocultivars.Our results show the value of combining biochem-
ical profiling with genetic information to identifyassociations between metabolites and phenotypes.This approach reveals previously unknown links be-
tween phenotypic traits and metabolism and thusfacilitates the discovery of biomarkers for agronomi-cally important traits.
RESULTS
Metabolite Profiling
In order to assess the content and variation of polarprimary metabolites present in the C 3 E diploidpotato population, untargeted GC-TOF-MS-based me-tabolite profiling was performed. The GC-TOF-MSmethod was applied to the polar aqueous methanolextracts of dormant tubers of 97 genotypes and theparental clones of the C 3 E population. After pro-cessing of the raw data, 139 representative masseswere obtained, consisting of reconstituted mass spec-tra (see “Materials and Methods”). The distribution oftrait values for the detected compounds across all thegenotypes was wide, with coefficients of variationhigher than 50% for the majority of metabolites(approximately 52%; Fig. 1). This large variation canin part be explained by the segregation of geneticfactors and therefore is amenable to genetic mappingapproaches.
The 139 representative masses were putatively iden-tified by comparing the mass spectra with those ofauthentic reference standards and mass spectral data-bases (National Institute of Standards and Technology[NIST08]; Golm metabolome database [http://gmd.mpimp-golm.mpg.de/]). Supplemental Table S1 liststhe derived identification (i.e. putative metabolites).Further inspection of the spectra and retention indicesof these fragments allowed amore accurate annotation
Figure 1. Histogram of the distribution of metabolic variation. Datashown are based on the percentage of Coefficient of Variation (CV%)across the C 3 E population for the 139 representative masses. Thedistribution shows that the majority of metabolites have a CV higherthan 50%, indicating a high level of variability.
Metabolic QTLs Related to Potato Primary Metabolism
Plant Physiol. Vol. 158, 2012 1307 www.plantphysiol.orgon May 6, 2018 - Published by Downloaded from
Copyright © 2012 American Society of Plant Biologists. All rights reserved.

of 58 of them (Table I). Using all samples, we per-formed a hierarchical cluster analysis using Pearsoncorrelations on the processed data for the abundance ofthe 139 representative masses. Figure 2 shows thedegree of correlation among the detected compounds.The majority of the compounds were identified asamino acids, organic acids, or carbohydrates (Table I;Supplemental Table S1). The annotation of a number ofcompounds could not be verified by further inspectionof the spectra and retention indices. However, weincluded these unknown compounds in the clusteranalysis to investigate the degree of association withidentified metabolites. Compounds from the sameclass, such as amino acids or carbohydrates, generallyclustered together. The correlation coefficients withinthe identified amino acids ranged between 0.6 and 0.9(Fig. 2), and two metabolites were considered to behighly correlated if the absolute correlation coefficienthad a value of 0.6 or greater. Such high correlationshave been reported before in potato between aminoacids (Roessner et al., 2001; Dobson et al., 2008). It hasbeen suggested that this correlation may reflect themechanism of general amino acid control in plants(Halford et al., 2004). Interestingly, within the aminoacid cluster, the branched amino acids Ile, Leu, and Valclustered separately from the aromatic amino acids Tyr,Phe, and Trp, as was also reported in earlier metabo-lomics studies in different potato cultivars (Roessneret al., 2001; Noctor et al., 2002; Dobson et al., 2008).Amino acids that are biosynthetically linked, such asSer, Gly, and Thr, also show a strong correlation (Fig. 2).This suggests that much of the variation in amino acidcontent is genetically controlled by just a few masterregulators. However, this was not the case for all re-lated amino acids. The Pearson correlation coefficientsamong g-aminobutyric acid (GABA), Glu, and Prowere less than 0.2, although they are closely linkedbiosynthetically as members of the Glu family. Otheramino acids, such as Glu and Asn, show weakcorrelations (less than 0.4) with the major cluster ofamino acids. This could suggest that the geneticregulation of these biosynthetic routes occurs inde-pendently from that of the main cluster of aminoacids. In addition, most of the detected carbohy-drates, such as Man and Fru, also form a cluster (Fig.2). In contrast, Suc clusters with a group of organic
acids rather than with the other carbohydrates. Theclustering of organic acids, however, is less distinct,and this is likely due to the diverse biochemicalorigins of these compounds.
Identification of Metabolic QTLs
To determine if the variation observed in metabo-lite levels could indeed be explained by allelic differ-ences in genetic factors, we performed metabolicquantitative trait locus (mQTL) analysis on the met-abolic profiles. The software package MetaNetworkwas used to map the metabolite variation. MetaNet-work applications (Fu et al., 2007) were designedfrom data collected from recombinant inbreed lines;hence, in order to adjust the software applications to across-pollinated species like potato, we used twoseparate linkage maps: one for the female parentC and one for the male parent E. Overall, the varia-tion in abundance of approximately 72% of themetabolites could be mapped in at least one of thetwo linkage maps. In total, we found 187 mQTLsfor 121 metabolites, of which 58 could be putativelyannotated. A complete list and a description of thedetected mQTLs are given in Supplemental Tables S2and S3.
C-Parent Map
Forty-five significant mQTLs were detected in thismap for 39 masses representing unique metabolites.For 33 metabolites, only one QTL was identified, and amaximum of two QTLs were found for six differentmetabolites (identified as galactiric acid and five un-known metabolites [nos. 012, 034, 044, 078, and 081]).The largest number of mQTLs on a single chromosomewas 11 for chromosome 8, where mQTLs were detec-ted for Asn, Tyr, and other, unidentified metabolites.The mQTL for Tyr on chromosome 8 was also detectedin a previous study on the same population (Werijet al., 2007). On chromosome 5, we found eight mQTLsfor Glu, Man, Trp, and a number of unknown com-pounds. On chromosomes 3, 6, and 10, no significantmQTLs were detected. Figure 3A shows the QTLprofiles of all the metabolites mapped to the C-parentmap in a heat map.
Table I. Metabolites putatively identified from the polar phase of methanol extract from potato tubers
List of metabolites that were putatively identified based upon the similarity of mass spectra and the retention indices published in the literature.Compounds that were detected in more than one derivatized form are listed only once.
Compound Class Metabolites
Amino acid Ala, Asn, Gln, Gly, Asp, Glu, Ile, Leu, Met, Phe, Pro, Ser, Thr, Trp, Tyr, Val, Lys, pyro-Glu, b-Ala, GABAOrganic acid 2-Piperidinecarboxylic acid (pipecolic acid), ascorbic acid, butanoic acid, citric acid, quinic acid, fumaric acid,
glyceric acid, malic acid, phosphoric acid, succinic acid, dehydro-L-(+)-ascorbic acid dimer, lactic acid,threonic acid
SugarSugar alcoholAmino alcoholOther
Allose, Fru, galactiric acid, galactinol, Man, Suc, glucopyranoseMyoinositolEthanolamineCalystegine B2, 5-aminocarboxy-4,6-dihydroxypyrimidine, allantoin
Carreno-Quintero et al.
1308 Plant Physiol. Vol. 158, 2012 www.plantphysiol.orgon May 6, 2018 - Published by Downloaded from
Copyright © 2012 American Society of Plant Biologists. All rights reserved.

E-Parent Map
In this map, 160 significant mQTLs were detected for85 representative masses (Fig. 3B). For 33 masses, onlyone QTL was detected, and a maximum of six mQTLswas detected for one metabolite (identified as quinicacid). The highest number of mQTLs on a singlechromosome was 71 on chromosome 5. This chromo-some also contributed the most to the total explainedvariation of all detected mQTLs. A single genomicregion, spanning three adjacent markers, accounted forthe highest density of detectedmQTLs (34). This regionis known to be involved in plant maturity (van Eck andJacobsen, 1996; Collins et al., 1999; Oberhagemannet al., 1999) and as such exerts many pleiotropic effects
on development-related traits. The majority of com-pounds mapping to this region were classified asamino acids, organic acids, and carbohydrates. This isnot unexpected, as rapid changes in primary metabo-lism are known to occur during the later stages ofmaturation. Interestingly, similar to observations in theC-parent map, some amino acids that are biochemi-cally related shared an mQTL at the plant maturitylocus (e.g. Gly and Thr). Other amino acids, like Phe,Lys, Val, and Met, also mapped to the plant maturityregion. Some of the identified compounds mapping tothis region also showed significant mQTLs on otherchromosomes, both in the C and the E maps. Forexample, four more mQTLs were detected for L-Thr, onchromosomes 1, 2, and 10 in the E-parent map and
Figure 2. Correlation matrix and cluster analysis of detected polar metabolites. Pearson correlation between metabolites isindicated by color intensity. A total of 58 out of the 139 metabolites could be identified based upon spectral libraries andretention indices. Metabolites belonging to the same biochemical class (color coded) tend to cluster together.
Metabolic QTLs Related to Potato Primary Metabolism
Plant Physiol. Vol. 158, 2012 1309 www.plantphysiol.orgon May 6, 2018 - Published by Downloaded from
Copyright © 2012 American Society of Plant Biologists. All rights reserved.
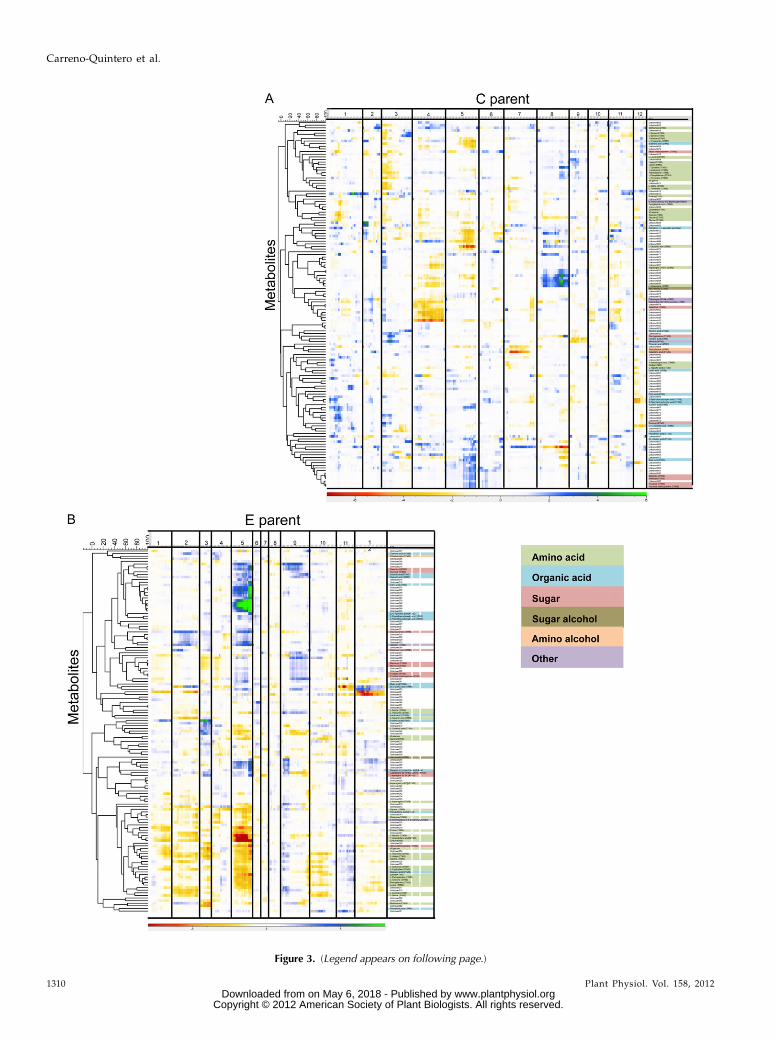
Figure 3. (Legend appears on following page.)
Carreno-Quintero et al.
1310 Plant Physiol. Vol. 158, 2012 www.plantphysiol.orgon May 6, 2018 - Published by Downloaded from
Copyright © 2012 American Society of Plant Biologists. All rights reserved.

chromosome 7 in the C-parent map. For Met, anothermQTL was detected on chromosome 2 of the C parent,and for Val, one additional mQTL was detected onchromosome 3 of the E parent, indicating complexregulation of these traits.
Association between Phenotypic and Metabolic Traits
Traits of agronomic importance in potato, such asstarch and cold sweetening, are expected to be associ-ated with primary metabolites. To investigate this rela-tionship in more detail, we carried out a parallel QTLanalysis for phenotypic starch- and cold sweetening-related traits determined for this population for twoyears of harvest: 2002 and 2003 (Supplemental Table S5;J.S. Werij, H.F. van Eck, C.W.B. Bachem, and R.G.F.Visser, unpublished data). Having mapped both meta-bolic and phenotypic QTLs to the two parental maps,we investigated the level of coregulation of these twosets of traits by determining colocalizing QTLs. Asexpected, a substantial number of the phenotypic traitsmapped to the plant maturity locus at chromosome 5.However, a number of significant QTLs for essentialmetabolites were also detected outside this region,indicating a possible regulation independent of thedevelopmental stage; therefore, these mQTLs are ofparticular interest.From a total of 26 phenotypic traits, nine showed
QTLs colocalizing with mQTLs outside the plant ma-turity region on chromosome 5 (Supplemental TableS4). Five phenotypic traits mapped to the C map, ofwhich three mapped to the same position on chromo-some 8: specific gravity of starch (also mapping tochromosome 10 in the E-parent map) and discolor-ation of tuber flesh after cooking at 5 and 30 min. Thisposition coincided with mQTLs for two unknowncompounds (nos. 044 and 081). A fourth trait, starchgrain particle size, mapped to a different region ofchromosome 8 on the C map that colocalized withmQTLs for amino acids, organic acids, and carbohy-drates. Chip color difference between reconditioningand harvest mapped to chromosome 6 on the C-parentmap and chromosomes 3 and 9 on the E-parent map,but only the latter two regions colocalized with alimited number of mQTLs.Two traits, chip color after harvest and chip color
difference between storage and harvest, mapped to chro-mosomes 9 and 3 of the E-parent map. These positionscoincidewith genomic regionswheremQTLs for succinicacid, fumaric acid, butanoic acid, and unknown com-pound 044 were detected.The strongest association, however, was detected
between starch phosphorylation and a number of me-tabolites. Starch phosphorylation maps to positions on
chromosomes 2 and 9 of the E-parent map in bothharvest years 2002 and 2003. The detection of identicalQTLs in independent experiments suggests a strongand robust genetic control, although a third QTL onchromosome 5 was detected in the 2003 harvest thatwas only suggestive in 2002. This QTL colocalizes withmQTLs for Ala, butanoic acid, b-Ala, GABA, succinicacid, pyro-Glu, Phe, Gln, Tyr, Trp, and seven unknowncompounds (nos. 011, 027, 033, 048, 061, 068, and 069).The QTL for starch phosphorylation on chromosome2 colocalizes with mQTLs for Ser, Thr, Asp, GABA, Gln,and four unknown metabolites (nos. 015, 027, 041, and043). The QTL on chromosome 9 colocalizes with amQTL for galactinol.
RFAnalysis Reveals a Link between Primary Metabolitesand Starch Phosphorylation
To further investigate the strength of the colocaliza-tions, we focused on the phenotypic trait starch phos-phorylation (i.e. the degree of phosphorylation permilligram of starch). Potato starch is characterized by arelatively high content of phosphate groups comparedwith, for example, cereal starches (Rooke et al., 1949;Hizukuri et al., 1970). This level of phosphate groupsinfluences the viscosity and the chemical properties ofstarch and therefore is important for the different usesof potato starch for food and industrial applications.Among the evaluated starch-related traits, the mea-surements for starch phosphorylation in 2002 and 2003showed the highest correlation coefficient (r2 = 0.8;Supplemental Table S6), indicating a general highreproducibility of the expression of this trait. Theobservation that two to three QTLs could be mappedin each year together with a high broad sense herita-bility (0.5) further indicates that a substantial part ofthe trait variation can be attributed to genetic factors.In addition, a number of colocalizing mQTLs wereidentified (see above) that suggest links between starchphosphorylation and metabolic processes. To rank theassociations between starch phosphorylation and the139 representative masses, we used a multivariate RFregression approach (Breiman, 2001). The starch phos-phorylation measurements of the two years were usedseparately, as a response variable regressed against the139 representative masses over all population individ-uals and significantly associated metabolites wererecorded.
Using starch phosphorylation measurements of the2002 harvest and all of the detected compounds, theRF model explained 16% of the variance at a permu-tation threshold of a = 0.001. Twelve metabolites weresignificantly associated with phosphate content at thisthreshold (Table II). Univariate correlation analyses
Figure 3. Heat map of mQTL profiles of the detected compounds in the C 3 E population. A, Using the genetic map of the Cparent. B, Using the genetic map of the E parent. Metabolites are clustered according to 210log(p) values across significantlyassociated markers. Vertical lines indicate chromosomal borders. Colors indicate the sign of the additive effect and thesignificance of the mQTL.
Metabolic QTLs Related to Potato Primary Metabolism
Plant Physiol. Vol. 158, 2012 1311 www.plantphysiol.orgon May 6, 2018 - Published by Downloaded from
Copyright © 2012 American Society of Plant Biologists. All rights reserved.

between these significant metabolites and starch phos-phorylation yielded absolute r2 values ranging be-tween 0.07 and 0.26 (of which two have a negativePearson correlation value). For the 2003 harvest, the RFmodel explained 33% of the variance at a permutationthreshold of a = 0.001. In this case, eight metaboliteswere found to be significantly associated with starchphosphorylation (Table II). The correlations rangedfrom 0.12 to 0.39 (of which one has a negative Pearsoncorrelation value). Interestingly, all the significantlycontributing metabolites from the 2003 model werealso identified using the 2002 data, again illustratingthe high reproducibility between the two years. Fromthese eight compounds, seven showed colocalizingQTLs with at least one of the starch phosphorylationQTLs: b-Ala, GABA, L-Asp, Ala, butanoic acid, un-known 027, and unknown 033 (Supplemental Table S4).
As a third independent line of investigation, weperformed RF regression on a subset of cultivars froma potato collection available in our laboratory (year ofharvest 2007). All 214 cultivars of this collection wereanalyzed for starch phosphorylation, and from these,30 cultivars were selected covering the whole distri-bution range of this trait (Supplemental Fig. S1) These30 cultivars were analyzed for metabolite content withthe same analytical procedure used for the C 3 Epopulation. RF regression was performed using thestarch phosphorylation measurements and the metab-olites detected in this set of cultivars (data not shown).The resulting RF model explained 30% of the variationin starch phosphorylation, and nine compounds werefound to contribute significantly at a permutationthreshold of a = 0.001 (Table II). The univariate corre-lations between these significant compounds and
starch phosphorylation ranged between 0.09 and 0.41(of which four have a negative Pearson correlationvalue).
A comparison of the significant predictive com-pounds after RF analysis in the two sets of potatomaterial (i.e. C 3 E [2002 and 2003] and cultivarcollection) revealed one compound in common, b-Ala.In the C 3 E population, b-Ala showed a positivecorrelation with starch phosphorylation in both years.This positive trend was also observed in the selectedcultivar set (Supplemental Fig. S2). Because a robustmetabolic predictor of a phenotypic feature is prefer-ably valid across different potato sources, we considerb-Ala as a reliable metabolite significantly linkedto the level of phosphorylation of starch in potatotubers.
DISCUSSION
The use of an untargeted metabolomics approachpermits a quantitative assessment of a wide range ofmetabolites and allows the detection of known andunknown metabolites. Untargeted metabolomics ap-proaches have been successfully applied to experimen-tal plant populations to uncover loci controlling thevariation of metabolites (Overy et al., 2005; Keurentjeset al., 2006; Morreel et al., 2006; Schauer et al., 2006;Tieman et al., 2006; Lisec et al., 2008; Rowe et al., 2008).
In this study, we used untargeted GC-TOF-MS me-tabolite profiling to assess the quantitative variation inpolar metabolites present in dormant tubers of adiploid potato population. The observed variation inthis population enabled us to locate genomic regions
Table II. List of associated metabolites ranked after RF and significance permutation tests
The first column shows the putative annotation of the representative mass. The second column shows whether a colocalizing mQTL with starchphosphorylation was detected. The values in the remaining columns indicate ranking order after RF analysis. Compounds with two numbersrepresent the same compound with different trimethylsilyl (TMS) groups (derivatization groups).
Metabolite Putative IdentificationColocalizing Starch Phosphorylation
QTL C 3 E Population
Rank of Metabolites
2002 Harvest 2003 Harvest Potato Cultivars
b-Ala (2TMS) Yes 1 1 7g-Aminobutyric acid (2TMS), (3TMS) Yes 2, 10 2Ala (2TMS) Yes 3 4Gly (2TMS) 4Unknown 027 Yes 5 7Glyceric acid (3TMS) 6Unknown 033 Yes 7 6d3-Ala 8 8Unknown 044 9Lys (3TMS), (4TMS) 3, 5L-Asp (3TMS) Yes 11 3Butanoic acid (2TMS) Yes 12 5Unknown 082 1Putrescine (4TMS) 2Unknown 083 4Myoinositol (6TMS) 6Glucopyranose (5TMS) 8Unknown 084 9
Carreno-Quintero et al.
1312 Plant Physiol. Vol. 158, 2012 www.plantphysiol.orgon May 6, 2018 - Published by Downloaded from
Copyright © 2012 American Society of Plant Biologists. All rights reserved.

involved in the regulation of a range of polar primarymetabolites. Primary metabolites, consisting mainly ofcarbohydrates, amino acids, and organic acids, havean essential role in plant growth and development. Inpotato, carbohydrates are important for a number ofagronomic traits related to tuber quality, such as starchcontent and cold sweetening. In this study, the samegenetic material was used to detect QTLs for starch-and cold sweetening-related traits and metabolictraits.We investigated the associations between pheno-
typic and metabolic traits through QTL colocalization,correlation analysis, and RF analyses. The detection ofa QTL identifies the existence of at least one polymor-phic locus that is contributing to the variation ob-served for a given trait (Causse et al., 2004). WhenQTLs for two different traits colocalize, this mightindicate the existence of a common regulator thatcontrols the variation of both traits. This is of specialvalue in the search of candidate genes for traits withcomplex modes of inheritance or for which most ofthe genetic basis is unknown. However, it cannot beexcluded that colocalizing genomic regions containgenes that are closely linked but are involved indifferent biological processes. Due to the limited res-olution of QTL mapping and a finite number ofmarkers, colocalization of (unrelated) QTLs is inevita-ble when large data sets are involved (Lisec et al.,2008). Therefore, we performed independent statisticaltests to confirm true positive associations betweenmetabolites and phenotypes. In addition, we havevalidated putative metabolic biomarkers in an inde-pendent set of potato varieties. Our stringent selectioncriteria resulted in the determination of a strong rela-tionship between potato starch phosphorylation andprimarymetabolism. Furthermore, our analyses resultedin the identification of b-Ala as an important predictorfor the degree of phosphorylation of starch in potatotubers.
Mapping of Metabolic Variation in Potato Tubers
Mapping populations are very suitable to identifyloci controlling the variation of a given trait. In thisstudy, we aimed to explore the variation of metabolicand phenotypic traits present in dormant potato tu-bers. Our results show that we could assign genomicregions involved in metabolite variation for approxi-mately 72% of the detected metabolites.The abundances of metabolites that share an mQTL,
especially for major loci of qualitative traits, are ex-pected to correlate because they cosegregate in amapping population. For instance, L-Leu and Lysshare an mQTL on chromosome 9 and are positivelycorrelated. Metabolites sharing an mQTL often belongto the same biochemical pathway. For example, Pheand Tyr share a common biosynthetic pathway andhence are found to be coregulated. Alternatively,colocating QTLs can be the result of closely linkedindependent regulators (Lisec et al., 2008). In the case
of a shared regulator, a direct, or even causal, relation-ship can be expected between traits, whereas in thelatter case, the two traits are independently controlled.This distinction should be reflected in correlationanalysis with higher values expected for coregulatedtraits. In contrast, high correlation values betweentraits can also be expected when environmental factorsthat affect multiple traits simultaneously are in play.The resulting decrease in signal-to-noise ratio wouldbe reflected in low heritabilities and QTL detectionpower. Therefore, we have applied independent linesof investigation, including genetic, correlation, andRF analyses, to reliably identify biologically meaning-ful relationships between metabolites and complexphenotypes.
In targeted studies, QTLs were found for some of themetabolites that were also detected in our analyses. Ina previous study, an mQTL for Tyr was detected onchromosome 8 in the C-parent map (Werij et al., 2007).This amino acid has been reported to be associatedwith the level of enzymatic discoloration (Corsiniet al., 1992), although other studies have reportedotherwise (Mondy and Munshi, 1993). In agreementwith the results of Werij et al. (2007), we did not findoverlapping QTLs for Tyr and enzymatic discolor-ation. In addition, we confirmed the QTL detected byWerij et al. (2007) and also detected two more QTLs forTyr at chromosomes 5 and 11 of the E-parent map. Thisdifference is likely explained by differences in theanalytical techniques used in the two studies. Addi-tionally, revisions in the linkage map that was used inour study may have influenced the power of detectionof QTLs.
Another interesting metabolite that was also map-ped in previous studies is Met. The level of this aminoacid is important for the nutritional value of potato.Moreover, it is the precursor of metabolites importantto potato flavor (e.g. methional), and attempts havebeen made to enhance the Met content to improveflavor (Di et al., 2003; Dancs et al., 2008). In earlier workon the C 3 E population, two QTLs, on chromosomes3 and 5, were detected underlying the variation of thisamino acid content in tubers (Kloosterman et al., 2010).In agreement with that study, we detected QTLs forMetthat mapped on chromosomes 3 and 5 of the E-parentmap and an additional QTL on chromosome 2 of theC-parent map.
The significant mQTLs detected in both parentalmaps were unequally distributed over the genome,indicating hot and cold spots for metabolite regula-tion. Awell-known locus involved in plant maturity islocated at chromosome 5, where a major QTL for thistrait has been detected in the C 3 E population (vanEck and Jacobsen, 1996). Plant maturity has beenshown to be closely linked to a number of traits,including resistance and developmental traits (Collinset al., 1999; Oberhagemann et al., 1999; Bormann et al.,2004), although the underlying genetic factor has notbeen identified thus far. Products of primary metabo-lism, such as carbohydrates and amino acids, are
Metabolic QTLs Related to Potato Primary Metabolism
Plant Physiol. Vol. 158, 2012 1313 www.plantphysiol.orgon May 6, 2018 - Published by Downloaded from
Copyright © 2012 American Society of Plant Biologists. All rights reserved.

expected to influence the degree of plant maturity andvice versa. Therefore, we anticipated that a largenumber of metabolic traits would show an associationwith the plant maturity region on chromosome 5. None-theless, a substantial number of mQTLs for amino acids,organic acids, and carbohydrates have not been reportedbefore and were identified outside this region. Thisfinding highlights the importance of other genomicregions in the regulation of primary metabolite accumu-lation despite the pleiotropic effects displayed by theplant maturity region.
In addition, a number of mQTLs mapped to multi-ple positions, which indicates complex regulation.Among the multiple loci detected for these metabo-lites, at least one mapped to the plant maturity region.This raises the question of whether metabolites areunder developmental control or whether developmentis under metabolic control. In this study many metab-olites map to the maturity locus in addition to multipleother loci. Plant maturity, however, maps only to asingle locus and this may indicate that the metabolismis at least partly under developmental control oranother factor upstream.
Putative Predictors of Starch Phosphorylation
QTL colocalizations can be useful to identify me-tabolites involved in the regulation of phenotypictraits. This is of special importance for traits for whichthe genetic basis is unknown, providing a valuabletool to search for candidate genes. However, oneshould be cautious when making such assumptions,because two different traits that share the same regu-latory region are not necessarily involved in the samemolecular or biological process. In a specific genomicregion, genes might be present that are linked but thathave different enzymatic functions. The phenotypictraits evaluated in this study are known to be related tocarbohydrate metabolism; consequently, metabolitesinvolved in this pathway are likely to be linked tothese traits. Nevertheless, QTL colocalizations candisclose unknown associations and moreover identifycandidate predictors of trait variation (Lisec et al.,2008).
One of the aims of this study was to test to whatextent phenotypic and metabolic QTLs colocalize inorder to identify metabolites associated with pheno-typic features. We focused on starch phosphorylationas a phenotypic case study. Potato starch has a partic-ularly high content of phosphate groups in compari-son with other plant species. The degradation of starchis dependent on reversible phosphorylation of theglucans at the surface of the starch granule (Zeemanet al., 2010), and although a direct link between thecontent of phosphate groups and starch degradationhas not been found, it has been shown that alterationsin the starch-phosphorylating enzymes lead to anexcess of starch accumulation in the plant (Casparet al., 1991; Zeeman and Rees, 1999; Yu et al., 2001).In potato, the high phosphate content of starch affects
the viscosity and formation of stable starch pastes(Wiesenborn et al., 1994; Viksø-Nielsen et al., 2001),which is important for the diversified uses of starch inindustry.
Here, we show that a number of amino acid mQTLscolocalize with trait QTLs for starch phosphorylation.To measure the strength of the genetically inferredlinks between the detected metabolic and phenotypicQTL colocalizations, we examined the associationsand predictive power of the metabolite data for starchphosphorylation using RF regression analysis.
The application of multivariate statistical methodsto assess associations between metabolites and pheno-typic traits has been successfully applied in a numberof studies. An approach using canonical correlationanalysis to test the predictive power of metaboliccomposition for biomass traits in Arabidopsis revealeda number of metabolites related to biomass andgrowth (Meyer et al., 2007). In potato, a partial least-squares analysis was used to discover metabolites thatfunction as predictors for susceptibility to black spotbruising and chip quality (Steinfath et al., 2010). Thevalidity of these results was tested in a collection ofpotato cultivars and in a set of individuals of a segre-gating population where metabolic and phenotypicinformation obtained from a first environment wasused to predict phenotypic properties from the meta-bolic data obtained from a second environment. Thoseresults demonstrate the application of multivariatedata analysis and the value of independent validationto discover a small set of metabolites that can be usedas biomarkers for a phenotypic trait of interest.
We used RF analyses to predict starch phosphory-lation from a GC-MS data set. A similar approach wasused to predict flesh color and enzymatic discolorationfrom transcriptomics and liquid chromatography-MSdata sets (Acharjee et al., 2011). This study resulted inthe successful identification of associated genes andmetabolites, of which some were known to be in-volved in the regulation of the traits under study.Correspondingly, in our study, the application of RFregression resulted in a list of highly ranked metabo-lites representing the most important compoundsassociated with starch phosphorylation. Inspectionof the annotation of these included a number ofunknown metabolites and, more interestingly, a fewamino acids for which we also detected mQTLs coin-ciding with starch phosphorylation QTLs. Amongthese relevant metabolites, b-Ala was of particularinterest because it consistently ranked in the topmetabolites in the different potato materials used forthe analysis.
Starch phosphorylation is mainly driven by theaction of two glucan-water dikinases (i.e. glucan waterdikinase [GWD] and phosphoglucan water dikinase[PWD]). These enzymes are critical in the transfer ofphosphate groups within amylopectin (Smith et al.,2005; Zeeman et al., 2010). Analysis of Arabidopsis(Arabidopsis thaliana) mutants also showed that GWDis required for phosphorylation (Yu et al., 2001). The
Carreno-Quintero et al.
1314 Plant Physiol. Vol. 158, 2012 www.plantphysiol.orgon May 6, 2018 - Published by Downloaded from
Copyright © 2012 American Society of Plant Biologists. All rights reserved.

sex1 (loss of GWD activity) and pwd (loss of PWDactivity) mutants lead to excess- and reduced-starchcontent phenotypes, respectively. Interestingly, trans-genic potato plants with reduced GWD expressionalso displayed a starch-excess phenotype (Lorberthet al., 1998). In our results, the amino acid b-Ala washighly ranked after RF analysis for both sets of potatomaterial (i.e. the C 3 E segregating population [2002and 2003] and the set of potato cultivars). What ismore, an mQTL for b-Ala was detected in the C 3 Epopulation colocalizing with a phenotypic QTL forstarch phosphorylation measurements of 2003 and asuggestive QTL in 2002.It is known that GWD follows a dikinase-type
reaction catalyzing the transfer of the b-phosphate ofATP to either the C6 or C3 position of the glucosylresidue (Ritte et al., 2002). In this type of reaction, theformation of an autophosphorylated intermediate pre-cedes the transfer of the phosphate to the glucosylresidues. The autophosphorylation of this GWD inter-mediate depends on a conserved His residue that,when replaced by Ala, results in a mutant phenotypewithout phosphorylating activity (Mikkelsen et al.,2004). Ala isomers were further suggested as phos-phate carriers when reacting with cyclotriphosphate toform orthophosphate derivatives in high-pH condi-tions (Tsuhako et al., 1985). These studies suggest arole for Ala in phosphorylation reactions, althoughfurther research is needed to confirm these relation-ships. b-Ala, as a substrate for pantothenate (vitaminB5) biosynthesis, is the only naturally occurringb-amino acid in plants (Chakauya et al., 2006). Little isknown about the formation of b-Ala in plants, while inbacteria, b-Ala is synthesized from the decarboxylationof L-Asp in a reaction catalyzed by Asp decarboxylase(Chakauya et al., 2006). Interestingly, we observed ashared mQTL for b-Ala and L-Asp, suggesting commongenetic regulation through shared biosynthetic path-ways.After a dormant phase, potatoes develop from a sink
to a source organ that will subsequently support thegrowth and development of the new sprout. Owing toa higher content of phosphate groups, starch may bemore easily mobilized and converted into resourcesfor the growing sprout. Vitamin B5 is used in thesynthesis of CoA, an acyl carrier protein. CoA isrequired in many central metabolic processes, and itis essential in the conversion of pyruvate to acetyl-CoAto enter the tricarboxylic acid cycle (Chakauya et al.,2006). In addition, CoA is fundamental in the biosyn-thesis of fatty acids, polyketides, depsipeptides, andpeptides (Kleinkauf, 2000). b-Ala constitutes an im-portant part in the biosynthesis pathway of vitamin B5,and the presence of this amino acid may be indicativefor the formation of many essential metabolites forplant development; furthermore, it may act as anindicator of the mobilization of storage resources. Inthis study, we identified b-Ala associated with starchphosphorylation as well as a number of other metab-olites for which it also might be predictive. Our
approach has been shown to be instrumental in gen-erating hypotheses about functional relationships be-tween metabolites and phenotypes. In addition, it mayhelp for a gradual understanding of metabolic pro-cesses contributing to the observed phenotypic fea-tures of interest.
Our data here demonstrate the benefits of the appliedmethods for a broad untargeted metabolomics approachin potato. In this study,we combined genetic informationthrough mQTL and phenotypic QTL analysis and non-genetic information through the regression of trait valuesto predict phenotypic traits from metabolomics analysis.We identified candidate metabolites that can be infor-mative for phenotypic traits of interest.
Advances in metabolomics have opened up the wayto high-throughput approaches, allowing the analysisof variation of a large number of samples in a reason-able amount of time. In addition, advanced statisticalmethods enable us to explore and monitor differentprofiling techniques in nonmodel species. Amultilevelintegrative approach to study organisms as a system ofgenetic, proteomic, and metabolic events may enableus to achieve a higher level of understanding of theinteractions occurring in a biological system of inter-est. In potato, although this field is still in its infancy,some examples have already shown the advantages ofsuch approaches to identify, and hypothesize about,the components in biologically relevant pathways(Acharjee et al., 2011). Furthermore, the genome se-quence of potato (Potato Genome Sequencing Consor-tium, 2011) has now revealed genes specific to thishighly heterozygous crop, bringing a platform thatwill ultimately facilitate the elucidation of the geneticbasis of complex traits of high importance in breedingfor tuber quality.
MATERIALS AND METHODS
Plant Material
The C 3 E Population
The diploid population (C3 E) consisting of a total of 251 individuals was
obtained from a cross between two heterozygous diploid potato clones,
USW5337.3 (coded C: Solanum phureja 3 Solanum tuberosum) and 77.2102.37
(coded E: Solanum vernei 3 S. tuberosum). This population has been of special
use to study the inheritance and genetic mapping of traits related to tuber
quality (i.e. tuber shape, tuber size, eye depth, flesh color, among others). The
development and characteristics of the population and the parental lines are
described in detail (Celis-Gamboa, 2002;Werij et al., 2011). For starch- and cold
sweetening-related traits, the values for the parental lines lie very close to each
other centered on these normally distributed traits (data not shown), demon-
strating the large amount of transgression present in this population. In
addition, the female and male parents show very similar plant maturity
phenotypes, with the female C showing a slightly earlier maturity phenotype
than the male E.
A subset of 97 genotypes of this population was grown in two subsequent
years (2002 and 2003) during the normal potato growing season (April–
September) in Wageningen, The Netherlands. For each genotype, tubers were
collected from three plants. Harvested tubers were either used for phenotypic
analysis or mechanically peeled and immediately frozen in liquid nitrogen
before being ground into fine powder and stored at 280�C.Phenotypic analyses for 26 starch- and cold sweetening-related traits were
performed for both years of harvest (Supplemental Table S5). Metabolite
profiling was carried out on the ground material of tubers of the 2003 harvest.
Metabolic QTLs Related to Potato Primary Metabolism
Plant Physiol. Vol. 158, 2012 1315 www.plantphysiol.orgon May 6, 2018 - Published by Downloaded from
Copyright © 2012 American Society of Plant Biologists. All rights reserved.

Potato Cultivars
Potato cultivars used for independent confirmation and further statistical
analysis were part of the potato collection available at Wageningen University
& Research centre Plant Breeding. This collection consists of 221 tetraploid
potato cultivars that were provided by Dutch breeding companies and gene
banks. Phosphate measurements were carried out for 214 potato cultivars. In
accordance with the distribution of the trait values (Supplemental Fig. S2), we
selected 30 cultivars representing high, medium, and low phosphate contents.
Determination of Starch Phosphorylation
The degree of phosphorylation of starch was determined in a colorimetric
assay. A total of 20 mg of starch was mixed with 250 mL of 70% HClO4 and
incubated at 250�C for 25 min. Then, 50 mL of 30% hydrogen peroxide (w/v)
was added and incubated for another 5 min. After cooling, 2 mL of water was
added to reach a final concentration of HClO4 of 8.75% (w/v).
The color reagent consisted of 0.75% (w/v) (NH4)6Mo7O240.4H2O, 3% (w/v)
FeSO40.7H2O, and 0.75% SDS (w/v) dissolved in 0.375 M H2SO4. A total of 100
mL of the sample extract, or a standard solution, was mixed with 200 mL of the
color reagent solution on a microtiter plate and incubated for 10 min at room
temperature. The absorbance was measured at 750 nm in a microplate reader
using 8.75% HClO4 as a blank. A calibration curve of PO4 dissolved in HClO4
(0–500 mM) was used to determine the phosphate content.
Extraction and Derivatization of Potato TuberMetabolites for GC-MS Analysis
Relative metabolite content was determined as described (Weckwerth
et al., 2004) with modifications specific to the potato material. Briefly, polar
metabolite fractions were extracted from approximately 100 mg fresh weight
of tuber powder. A total of 1.4 mL of a single-phase solvent mixture of
methanol:chloroform:water (2.5:1:1) was added to the ground tuber powder in
a 2-mL Eppendorf tube. d3-Ala was used as a deuterated internal standard
and ribitol was used as a representative internal standard, and they were all
mixed in one solution. In the water phase, 25 mL of a solution containing the
aforementioned internal standard solution was added. After vortexing, the
closed tubes were sonicated for 15 min. After 5 min of centrifugation,
the supernatant was transferred into a new Eppendorf tube and 400 mL of water
was added. Themixture was thoroughlymixed by vortexing and centrifuged for
10 min at 21,000 rcf (relative centrifugal force). The methanol/water supernatant
(polar phase) was carefully transferred into a new Eppendorf tube. Aliquots of
the polar phase (100 mL) were dried by vacuum centrifugation for 12 to 16 h.
The dried samples were derivatized online as described by Lisec et al.
(2006) using a Combi PAL autosampler (CTC Analytics). First, 12.5 mL of
O-methylhydroxylamine hydrochloride (20 mg mL21 pyridine) was added to
the samples and incubated for 30 min at 40�C with agitation. Then, the samples
were derivatized with 17.5 mL of N-methyl-N-trimethylsilyltrifluoroacetamide
for 60 min. An alkane mixture (C9–C17 and C20–C34) was added to determine
the retention indices ofmetabolites. The derivatized samples were analyzed by a
GC-TOF-MS system consisting of an Optic 3 high-performance injector (ATAS)
and an Agilent 6890 gas chromatograph (Agilent Technologies) coupled to a
Pegasus III time-of-flight mass spectrometer (Leco Instruments).
Twomicroliters of each sample was introduced to the injector at 70�C using
a split flow of 19 mL min21.The injector was rapidly heated with 6�C s21 to
240�C. The chromatographic separation was performed using a VF-5ms
capillary column (Varian; 30 m 3 0.25 mm 3 0.25 mm) including a 10-m
guardian column with helium as carrier gas at a column flow rate of 1 mL
min21. The temperature was isothermal for 2 min at 70�C, followed by a 10�Cmin21 ramp to 310�C, and was held at this temperature for 5 min. The transfer
line temperature was set at 270�C. The column effluent was ionized by
electron impact at 70 eV. Mass spectra were acquired at 20 scans s21 within a
mass-to-charge ratio range of 50 to 600 at a source temperature of 200�C. Asolvent delay of 295 s was set. The detector voltage was set to 1,400 V.
GC-MS Data-Processing Methods
Data Preprocessing
Raw data were processed by ChromaTOF software 2.0 (Leco Instruments)
and MassLynx software (Waters), and further analysis was performed using
MetAlign software (Lommen, 2009) to extract and align the mass signals
(signal-to-noise ratio $ 2). Mass signals that were present in fewer than two
samples were discarded. Signal redundancy per metabolite was removed by
means of clustering, and mass spectra were reconstructed (Tikunov et al.,
2005, 2011). This resulted in 139 reconstructed polar metabolites (representa-
tive masses).
Compound Identification
The mass spectra of the representative masses were subjected to tentative
identification by matching to the NIST08 and Wiley spectral libraries and by
comparison with retention indices calculated using a series of alkanes and
fitted with a second-order polynomial function (Strehmel et al., 2008). Library
hits were manually curated, and a series of commercial standards were used
to check annotation. Compound identification is limited to the availability of
spectra in the libraries used. The identities of the detected compounds are
listed in Supplemental Table S1.
Data Normalization and Multivariate Analysis
Mass intensity values of the representative masses were normalized using
isotope-labeled d3-Ala as an internal standard. Relative amounts of the
compounds were obtained by normalizing the intensity of individual masses
to the response of the internal standard. The ratio between the mass intensity
value of the putative compound and the d3-Ala internal standard was then
scaled by multiplying the resulting value by the average of the d3-Ala mass
intensity across all samples.
Normalized values were log transformed in GeneMaths XT version 2.12
software (www.applied-maths.com). These data were used for cluster analysis
using Pearson’s correlation coefficient and Unweighted Pair Group Method
with Arithmetic Mean (UPGMA) for hierarchical clustering.
Metabolic and Phenotypic QTL Analyses
Metabolite QTL analyses were performed using the software package
MetaNetwork (Keurentjes et al., 2006; Fu et al., 2007). MetaNetwork applies a
two-part model, and a P value is determined for each part of the model. In this
study, P values and QTL thresholds were determined as described (Keurentjes
et al., 2006). Since MetaNetwork is not designed for cross-pollinated species,
two separate linkage maps were used in our analysis: one for the female
parent C and one for the male parent E. The number of markers specific to the
C-parent map is 218 and that for the E-parent map is 178, with an average
spacing between markers of 6.1 and 3.9 centimorgan, respectively. The
significance QTL threshold value was estimated by MetaNetwork. Empirical
thresholds for significant mQTLs were calculated separately for both parental
maps: C-parent map, 210log(p) = 3.43 (P = 0.00037); E-parent map, 210log(p) =
3.19 (P = 0.00065).
Phenotypic measurements containing missing data cannot be analyzed by
MetaNetwork; hence, QTL analyses for phenotypic data were performed
using the software package MapQTL version 6.0. QTL log of the odds
thresholds were calculated per trait using a permutation test (n = 10,000)
provided in MapQTL.
Broad sense heritability was estimated for starch phosphorylation mea-
surements over the two years (2002 and 2003) according to the formula H2 =
VG/(VG + VE + VG3E), whereVG is the variance among genotypes and VE is the
year variation. One phosphate content measurement per year was used in a
mixed model to calculate variance components for genotypes, years, and
residual (= genotype 3 year).
RF
RF (Breiman, 2001) was used for regression of the phenotypic trait starch
phosphorylation on the GC-TOF-MS signals. RF constructs a predictive model
for the response using all predictors but quantifies the importance of each,
here the metabolites, in explaining the variation present in the starch phos-
phorylation. RF by itself does not provide significance levels of individual
metabolites and does not perform a variable selection to choose a possible
subset of associated metabolites. Therefore, we included a permutation test to
indicate the significance of the association of a metabolite with a trait. In each
of 1,000 permutations of the trait values, we estimated the variance explained
by the RF model (R2) and the variable importance of each metabolite in terms
of the decrease in node impurities (Breiman, 2001). We ordered node purity
Carreno-Quintero et al.
1316 Plant Physiol. Vol. 158, 2012 www.plantphysiol.orgon May 6, 2018 - Published by Downloaded from
Copyright © 2012 American Society of Plant Biologists. All rights reserved.

values from the permuted data sets and took the 95th percentile from the
distribution of impurity values as the significance threshold of the individual
metabolites. The same procedure was done for R2 values of the model: the
95th percentile was taken as a significance threshold for the RF model. RF
regression of starch phosphorylation on metabolite values was conducted
using the “randomForest” package of the R statistical software. R2 in RF is not
just a measure of goodness of fit of the data at hand but is determined on left-
out samples (the “out-of-bag” samples), so it should be interpreted as a
measure for predictive quality (here considered as prediction R2) of the RF on
independent samples that have the same properties as the in-bag samples
(Breiman, 2001).
Supplemental Data
The following materials are available in the online version of this article.
Supplemental Figure S1. Frequency distribution of phosphate content in
potato collection.
Supplemental Figure S2. Correlation between beta-alanine and phosphate
content.
Supplemental Table S1. Polar metabolites detected in dormant tubers by
GC-TOF-MS analysis.
Supplemental Table S2.Metabolic QTL results of untargeted GC-TOF-MS
metabolite profiling for C-parent linkage map.
Supplemental Table S3.Metabolic QTL results of untargeted GC-TOF-MS
metabolite profiling for E-parent linkage map.
Supplemental Table S4. List of metabolic QTLs and phenotypic QTLs
colocalizations outside plant maturity region.
Supplemental Table S5. List of starch and cold sweetening related traits of
the C x E population.
Supplemental Table S6. Correlation values between starch related traits in
two years of harvest.
ACKNOWLEDGMENTS
We gratefully acknowledge the technical and intellectual input of our
laboratory colleagues, Francel Verstappen, Anna Undas, Desalegn Etalo, and
Benyamin Houshyani Hassanzadeh. We thank Aaron Velez-Ramirez for help
in the preparation of the figures. We also thank Thierry Delatte for valuable
comments and suggestions on the “Discussion.”
Received October 4, 2011; accepted December 26, 2011; published January 5,
2012.
LITERATURE CITED
Acharjee A, Kloosterman B, de Vos RCH, Werij JS, Bachem CWB, Visser
RGF, Maliepaard C (2011) Data integration and network reconstruction
with -omics data using Random Forest regression in potato. Anal Chim
Acta 705: 56–63
Bormann CA, Rickert AM, Ruiz RA, Paal J, Lubeck J, Strahwald J, Buhr
K, Gebhardt C (2004) Tagging quantitative trait loci for maturity-
corrected late blight resistance in tetraploid potato with PCR-based
candidate gene markers. Mol Plant Microbe Interact 17: 1126–1138
Breiman L (2001) Random Forests. Mach Learn 45: 5–32
Caspar T, Lin T-P, Kakefuda G, Benbow L, Preiss J, Somerville C (1991)
Mutants of Arabidopsis with altered regulation of starch degradation.
Plant Physiol 95: 1181–1188
Causse M, Duffe P, Gomez MC, Buret M, Damidaux R, Zamir D, Gur A,
Chevalier C, Lemaire-Chamley M, Rothan C (2004) A genetic map of
candidate genes and QTLs involved in tomato fruit size and composi-
tion. J Exp Bot 55: 1671–1685
Celis-Gamboa BC (2002) The life cycle of the potato (Solanum tuberosum L.):
from crop physiology to genetics. PhD thesis. Wageningen University,
Wageningen, The Netherlands
Chakauya E, Coxon KM, Whitney HM, Ashurst JL, Abell C, Smith AG
(2006) Pantothenate biosynthesis in higher plants: advances and chal-
lenges. Physiol Plant 126: 319–329
Coffin RH, Yada RY, Parkin KL, Grodzinski B, Stanley DW (1987) Effect of
low temperature storage on sugar concentrations and chip color of
certain processing potato cultivars and selections. J Food Sci 52: 639–645
Collins A, Milbourne D, Ramsay L, Meyer R, Chatot-Balandras C,
Oberhagemann P, De Jong W, Gebhardt C, Bonnel E, Waugh R
(1999) QTL for field resistance to late blight in potato are strongly
correlated with maturity and vigour. Mol Breed 5: 387–398
Corsini D, Pavek J, Dean B (1992) Differences in free and protein-bound
tyrosine among potato genotypes and the relationship to internal
blackspot resistance. Am J Potato Res 69: 423–435
Dancs G, Kondrak M, Banfalvi Z (2008) The effects of enhanced methi-
onine synthesis on amino acid and anthocyanin content of potato tubers.
BMC Plant Biol 8: 65
Davies HV (2007) Metabolomics: applications in functional biodiversity
analysis in potato. Acta Hortic 745: 471–484
Davies HV, Shepherd LVT, Burrell MM, Carrari F, Urbanczyk-Wochniak
E, Leisse A, Hancock RD, Taylor M, Viola R, Ross H, et al (2005)
Modulation of fructokinase activity of potato (Solanum tuberosum)
results in substantial shifts in tuber metabolism. Plant Cell Physiol 46:
1103–1115
Di R, Kim J, Martin MN, Leustek T, Jhoo J, Ho C-T, Tumer NE (2003)
Enhancement of the primary flavor compound methional in potato by
increasing the level of soluble methionine. J Agric Food Chem 51: 5695–5702
Dobson G, Shepherd T, Verrall SR, Conner S, McNicol JW, Ramsay G,
Shepherd LVT, Davies HV, Stewart D (2008) Phytochemical diversity
in tubers of potato cultivars and landraces using a GC-MS metabolomics
approach. J Agric Food Chem 56: 10280–10291
Dobson G, Shepherd T, Verrall SR, Griffiths WD, Ramsay G, McNicol JW,
Davies HV, Stewart D (2009) A metabolomics study of cultivated potato
(Solanum tuberosum) groups Andigena, Phureja, Stenotomum, and
Tuberosum using gas chromatography-mass spectrometry. J Agric Food
Chem 58: 1214–1223
Doerge RW (2002) Mapping and analysis of quantitative trait loci in
experimental populations. Nat Rev Genet 3: 43–52
Fernie AR, Schauer N (2009) Metabolomics-assisted breeding: a viable
option for crop improvement? Trends Genet 25: 39–48
Fu J, Swertz MA, Keurentjes JJB, Jansen RC (2007) MetaNetwork: a
computational protocol for the genetic study of metabolic networks. Nat
Protoc 2: 685–694
Halford NG, Hey S, Jhurreea D, Laurie S, McKibbin RS, Zhang Y, Paul
MJ (2004) Highly conserved protein kinases involved in the regulation
of carbon and amino acid metabolism. J Exp Bot 55: 35–42
Hizukuri S, Tabata S, Kagoshima, Nikuni Z (1970) Studies on starch
phosphate. Part 1. Estimation of glucose-6-phosphate residues in starch
and the presence of other bound phosphate(s). Starch-Starke 22: 338–343
Jansen RC, Nap JP (2001) Genetical genomics: the added value from
segregation. Trends Genet 17: 388–391
Keurentjes JJB (2009) Genetical metabolomics: closing in on phenotypes.
Curr Opin Plant Biol 12: 223–230
Keurentjes JJB, Fu JY, de Vos CHR, Lommen A, Hall RD, Bino RJ, van der
Plas LHW, Jansen RC, Vreugdenhil D, Koornneef M (2006) The
genetics of plant metabolism. Nat Genet 38: 842–849
Kleinkauf H (2000) The role of 4#-phosphopantetheine in the biosynthesis
of fatty acids, polyketides and peptides. Biofactors 11: 91–92
Kloosterman B, Oortwijn M, uitdeWilligen J, America T, de Vos R, Visser
RG, Bachem CW (2010) From QTL to candidate gene: genetical ge-
nomics of simple and complex traits in potato using a pooling strategy.
BMC Genomics 11: 158
Lisec J, Meyer RC, Steinfath M, Redestig H, Becher M, Witucka-Wall H,
Fiehn O, Torjek O, Selbig J, Altmann T, et al (2008) Identification of
metabolic and biomass QTL in Arabidopsis thaliana in a parallel
analysis of RIL and IL populations. Plant J 53: 960–972
Lisec J, Schauer N, Kopka J, Willmitzer L, Fernie AR (2006) Gas chroma-
tography mass spectrometry-based metabolite profiling in plants. Nat
Protoc 1: 387–396
Lommen A (2009) MetAlign: interface-driven, versatile metabolomics tool
for hyphenated full-scan mass spectrometry data preprocessing. Anal
Chem 81: 3079–3086
Lorberth R, Ritte G, Willmitzer L, Kossmann J (1998) Inhibition of a
starch-granule-bound protein leads to modified starch and repression of
cold sweetening. Nat Biotechnol 16: 473–477
Metabolic QTLs Related to Potato Primary Metabolism
Plant Physiol. Vol. 158, 2012 1317 www.plantphysiol.orgon May 6, 2018 - Published by Downloaded from
Copyright © 2012 American Society of Plant Biologists. All rights reserved.

Meyer RC, Steinfath M, Lisec J, Becher M, Witucka-Wall H, Torjek O,
Fiehn O, Eckardt A, Willmitzer L, Selbig J, et al (2007) The metabolic
signature related to high plant growth rate in Arabidopsis thaliana. Proc
Natl Acad Sci USA 104: 4759–4764
Mikkelsen R, Baunsgaard L, Blennow A (2004) Functional characteriza-
tion of alpha-glucan,water dikinase, the starch phosphorylating en-
zyme. Biochem J 377: 525–532
Mondy NI, Munshi CB (1993) Effect of maturity and storage on ascorbic
acid and tyrosine concentrations and enzymic discoloration of potatoes.
J Agric Food Chem 41: 1868–1871
Morreel K, Goeminne G, Storme V, Sterck L, Ralph J, Coppieters W,
Breyne P, Steenackers M, Georges M, Messens E, et al (2006) Genetical
metabolomics of flavonoid biosynthesis in Populus: a case study. Plant J
47: 224–237
Noctor G, Novitskaya L, Lea PJ, Foyer CH (2002) Co-ordination of leaf
minor amino acid contents in crop species: significance and interpreta-
tion. J Exp Bot 53: 939–945
Oberhagemann P, Chatot-Balandras C, Schafer-Pregl R, Wegener D,
Palomino C, Salamini F, Bonnel E, Gebhardt C (1999) A genetic
analysis of quantitative resistance to late blight in potato: towards
marker-assisted selection. Mol Breed 5: 399–415
Overy SA, Walker HJ, Malone S, Howard TP, Baxter CJ, Sweetlove LJ,
Hill SA, Quick WP (2005) Application of metabolite profiling to the
identification of traits in a population of tomato introgression lines. J
Exp Bot 56: 287–296
Potato Genome Sequencing Consortium (2011) Genome sequence and
analysis of the tuber crop potato. Nature 475: 189–195
Ritte G, Lloyd JR, Eckermann N, Rottmann A, Kossmann J, Steup M
(2002) The starch-related R1 protein is an alpha-glucan, water dikinase.
Proc Natl Acad Sci USA 99: 7166–7171
Roessner U, Luedemann A, Brust D, Fiehn O, Linke T, Willmitzer L,
Fernie AR (2001) Metabolic profiling allows comprehensive phenotyp-
ing of genetically or environmentally modified plant systems. Plant Cell
13: 11–29
Roessner U, Wagner C, Kopka J, Trethewey RN, Willmitzer L (2000)
Technical advance: simultaneous analysis of metabolites in potato tuber
by gas chromatography-mass spectrometry. Plant J 23: 131–142
Rooke HS, Lampitt LH, Jackson EM (1949) The phosphorus compounds of
wheat starch. Biochem J 45: 231–236
Rowe HC, Hansen BG, Halkier BA, Kliebenstein DJ (2008) Biochemical
networks and epistasis shape the Arabidopsis thaliana metabolome. Plant
Cell 20: 1199–1216
Schauer N, Semel Y, Roessner U, Gur A, Balbo I, Carrari F, Pleban T,
Perez-Melis A, Bruedigam C, Kopka J, et al (2006) Comprehensive
metabolic profiling and phenotyping of interspecific introgression lines
for tomato improvement. Nat Biotechnol 24: 447–454
Smith AM, Zeeman SC, Smith SM (2005) Starch degradation. Annu Rev
Plant Biol 56: 73–98
Steinfath M, Strehmel N, Peters R, Schauer N, Groth D, Hummel J, Steup
M, Selbig J, Kopka J, Geigenberger P, et al (2010) Discovering plant
metabolic biomarkers for phenotype prediction using an untargeted
approach. Plant Biotechnol J 8: 900–911
Strehmel N, Hummel J, Erban A, Strassburg K, Kopka J (2008) Retention
index thresholds for compound matching in GC-MS metabolite profil-
ing. J Chromatogr B Analyt Technol Biomed Life Sci 871: 182–190
Szopa J, Wrobel M, Matysiak-Kata I, Swiedrych A (2001) The metabolic
profile of the 14-3-3 repressed transgenic potato tubers. Plant Sci 161:
1075–1082
Tieman DM, Zeigler M, Schmelz EA, Taylor MG, Bliss P, Kirst M, Klee HJ
(2006) Identification of loci affecting flavour volatile emissions in tomato
fruits. J Exp Bot 57: 887–896
Tikunov YM, Laptenok S, Hall RD, Bovy A, de Vos RCH (October 15, 2011)
MSClust: a tool for unsupervisedmass spectra extraction of chromatography-
mass spectrometry ion-wise aligned data. Metabolomics http://dx.doi.org/
10.1007/s11306-011-0368-2
Tikunov Y, Lommen A, de Vos CHR, Verhoeven HA, Bino RJ, Hall RD,
Bovy AG (2005) A novel approach for nontargeted data analysis for
metabolomics: large-scale profiling of tomato fruit volatiles. Plant
Physiol 139: 1125–1137
Tsuhako M, Nakajima A, Miyajima T, Ohashi S, Nariai H, Motooka I
(1985) The reaction of cyclo-triphosphate with l-alpha-alanine or beta-
alanine. Bull Chem Soc Jpn 58: 3092–3098
Urbanczyk-Wochniak E, Baxter C, Kolbe A, Kopka J, Sweetlove LJ, Fernie
AR (2005) Profiling of diurnal patterns of metabolite and transcript
abundance in potato (Solanum tuberosum) leaves. Planta 221: 891–903
van Eck HJ, Jacobs JM, Stam P, Ton J, Stiekema WJ, Jacobsen E (1994)
Multiple alleles for tuber shape in diploid potato detected by qualitative
and quantitative genetic analysis using RFLPs. Genetics 137: 303–309
van Eck HJ, Jacobsen E (1996) Application of molecular markers in the
genetic analysis of quantitative traits. In PC Struik, J Hoogendoorn, JK
Kowenhoven, LJ Mastenbroek, LJ Turkensteen, A Veerman, J Vos eds,
Abstracts of Conference Papers, Posters and Demonstrations of the 13th
Triennial Conference of the EAPR. European Association for Potato
Research, Wageningen, The Netherlands, pp 130–131
Viksø-Nielsen A, Blennow A, Jørgensen K, Kristensen KH, Jensen A,
Møller BL (2001) Structural, physicochemical, and pasting properties of
starches from potato plants with repressed r1-gene. Biomacromolecules
2: 836–843
Weckwerth W, Wenzel K, Fiehn O (2004) Process for the integrated
extraction, identification and quantification of metabolites, proteins
and RNA to reveal their co-regulation in biochemical networks. Pro-
teomics 4: 78–83
Werij JS, Kloosterman B, Celis-Gamboa C, de Vos CH, America T, Visser
RG, Bachem CW (2007) Unravelling enzymatic discoloration in potato
through a combined approach of candidate genes, QTL, and expression
analysis. Theor Appl Genet 115: 245–252
Wiesenborn DP, Orr PH, Casper HH, Tacke BK (1994) Potato starch paste
behavior as related to some physical/chemical properties. J Food Sci 59:
644–648
Wolters A-M, Uitdewilligen JG, Kloosterman BA, Hutten RC, Visser RG, van
EckHJ (2010) Identification of alleles of carotenoid pathway genes important
for zeaxanthin accumulation in potato tubers. Plant Mol Biol 73: 659–671
Yu TS, Kofler H, Hausler RE, Hille D, Flugge UI, Zeeman SC, Smith AM,
Kossmann J, Lloyd J, Ritte G, et al (2001) The Arabidopsis sex1 mutant is
defective in the R1 protein, a general regulator of starch degradation in plants,
and not in the chloroplast hexose transporter. Plant Cell 13: 1907–1918
Zeeman SC, Kossmann J, Smith AM (2010) Starch: its metabolism, evo-
lution, and biotechnological modification in plants. Annu Rev Plant Biol
61: 209–234
Zeeman SC, Rees TA (1999) Changes in carbohydrate metabolism and
assimilate export in starch-excess mutants of Arabidopsis. Plant Cell
Environ 22: 1445–1453
Carreno-Quintero et al.
1318 Plant Physiol. Vol. 158, 2012 www.plantphysiol.orgon May 6, 2018 - Published by Downloaded from
Copyright © 2012 American Society of Plant Biologists. All rights reserved.