Unsupervised Learning - MIT OpenCourseWare · PDF fileHST.951J: Medical Decision Support...
35
HST.951J: Medical Decision Support Unsupervised Learning A review of clustering and other exploratory data analysis methods Harvard-MIT Division of Health Sciences and Technology HST.951J: Medical Decision Support
Transcript of Unsupervised Learning - MIT OpenCourseWare · PDF fileHST.951J: Medical Decision Support...

HST.951J: Medical Decision Support
Unsupervised Learning
A review of clustering and otherexploratory data analysis methods
Harvard-MIT Division of Health Sciences and Technology HST.951J: Medical Decision Support
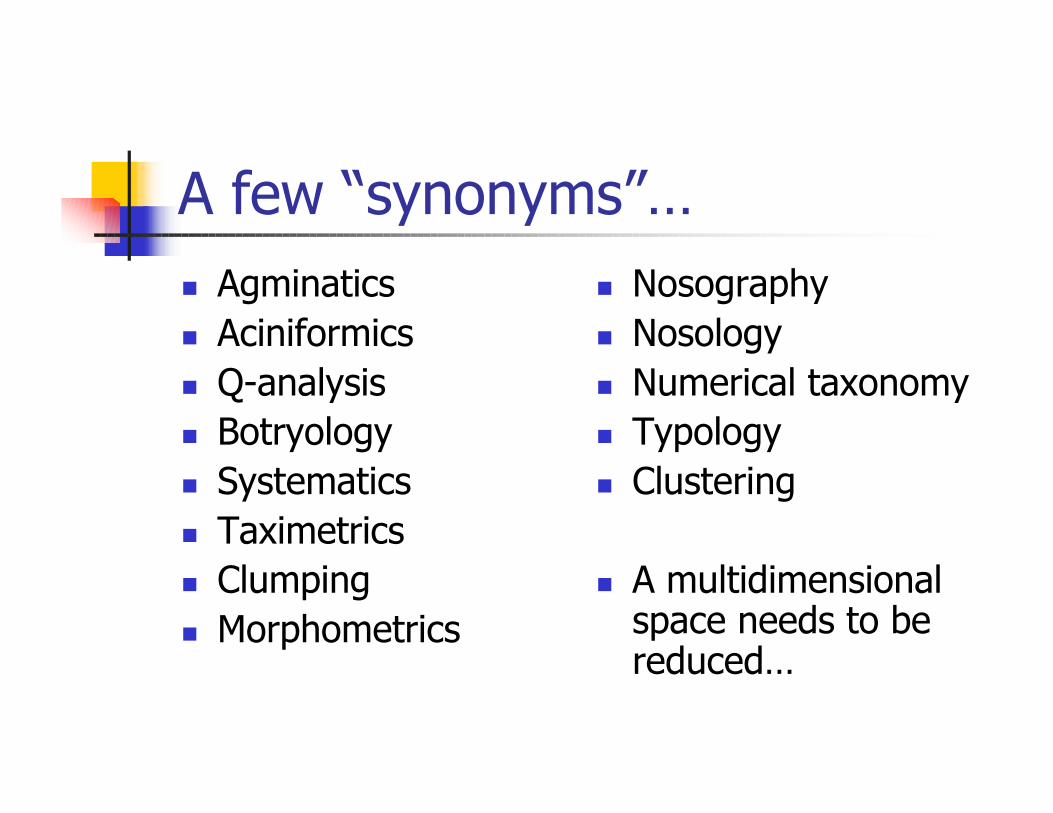
A few “synonyms”… n Agminatics n Nosography n Aciniformics n Nosology n Q-analysis n Numerical taxonomy n Botryology n Typology n Systematics n Clustering n Taximetrics n Clumping n A multidimensional n Morphometrics space needs to be
reduced…

What we are trying to do
Case 1
Case 2
-0.4-0.7
-0.8
-0.4
-0.90
-0.6
-0.4
-0.2 age test1
0.5
0.3 0.6
0.2 0.4
0.3
0.2 0.1
0.5 0.6
0.8 0.7
Predict this
Using these
We are trying to see whether there seems to exist patterns in the data…

Exploratory Data Analysis
n Hypothesis generation versus hypothesis testing…
n The goal is to visualize patterns and then interpret them
n Unsupervised: No GOLD STANDARD

See Khan et al. Nature Medicine, 7(6): 673 - 679.

Outline n Proximity
n Distance Metrics n Similarity Measures
n Clustering n Hierarchical Clustering
n Agglomerative
n K-means
n Multidimensional Scaling n Graphical Representations

Similarity between objects
Similarity Data
Percent “same” judgments for all pairs of successively presented aural signals of the International Morse Code (see Rothkopf, 1957).
Relation of Data to Spatial Representation
Obtained relation between Rothkopf’s original similarity data for the 36 Morse Code signals and the Euclidean distances in Shepard’s spatial solution.
Spatial Representation
Two-dimensional spatial solution for the 36 Morse Code signals obtained by Shepard (1963) on the basis of Rothkopf’s (1957) data.

or
Similarity Matrix
•Wavelet
•Hierarchical
Graphical
Representation
Raw
Data
l
Unsupervised Learning
Distance
Dimensionality Reduction
•MDS
Clustering
•Non-hierar.
“Validation”
•Interna
•Extermal

l Algorithms, similarity measures, and graphica representations
n Most algorithms are not necessarily linked to a particular metric or similarity measure
n Also not necessarily linked to a particular graphical representation
n There has been interest in this given high throughput gene expression technologies
n Old algorithms have been rediscovered and renamed

Metrics

1
1ÓÌÏÂ
=
rK r
Minkowski r-metric
d xik xij jk k
Manhattan K
ÂÏÌÓ
n d xik xij jk
n (city-block) =k 1
j 2
1 K
ÂÏÌÓ
dEuclidean xik xij jkn =k 1
¸˝˛
-=
¸˝˛
-=
¸˝˛
-=
i
2

Metric spaces
n Positivity dij > dii = 0 Reflexivity
n Symmetry dij = d ji n Triangle
jinequality dij £ dih + dhj
i h
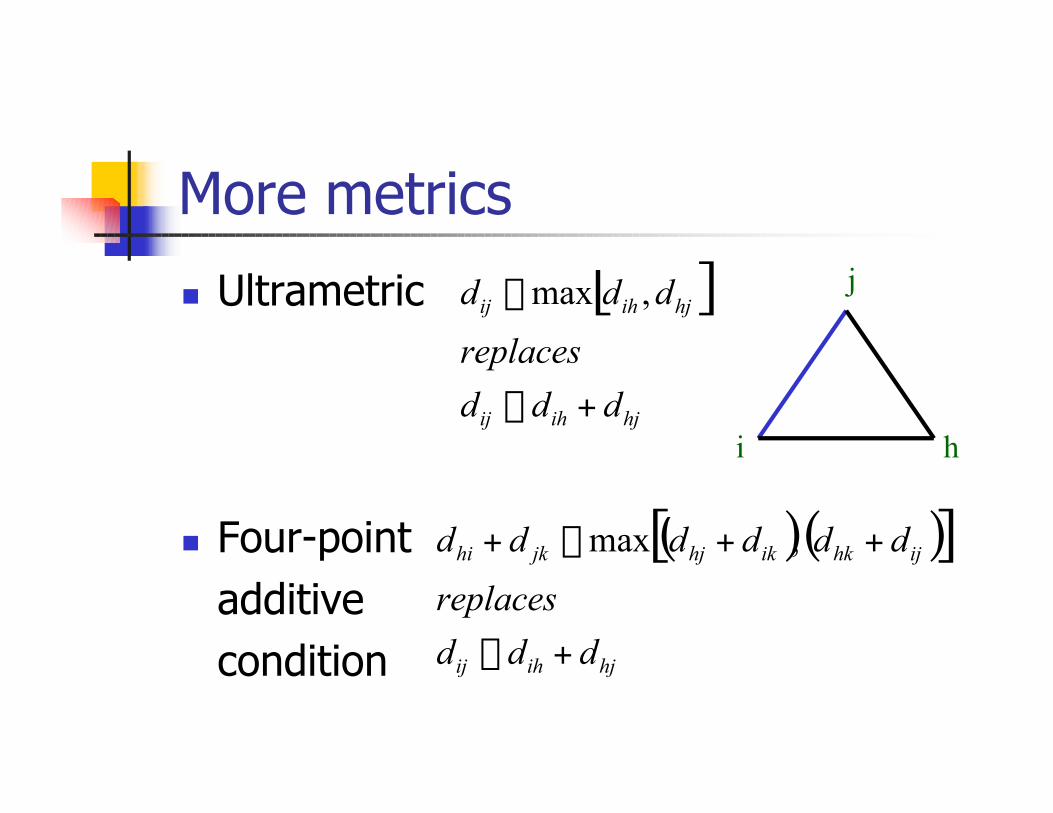
More metrics j
n Ultrametric dij £ max[dih , dhj ] replaces
dij £ dih + dhj
i h
n Four-point dhi + d £ max [(dhj + dik )( d + dij )]jk , hk
additive replaces
dij £ dih + dcondition hj

Similarity measures
n Similarity functionn For binary, “shared attributes”
it j, ( j ) =i s
i j it = [1,0,1]
0, ( j ) = 1 j =i s 2 ¥1 0
1

n d
Variations…
Fraction of attributes shared t i j
, ( j ) =i s d
n Tanimoto coefficient t i j it = [1,0,1]
i s , ( j ) = t t j = 0i i + j j - it j
01
, ( j) =i s 12 +1 -1
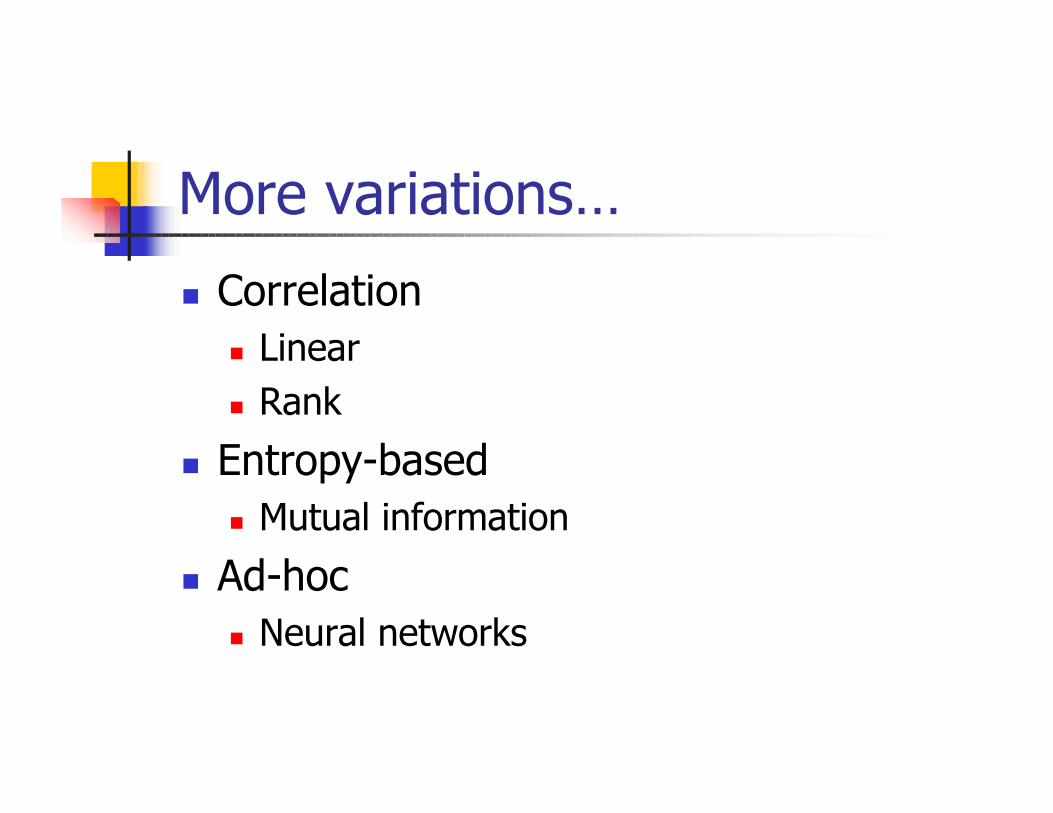
More variations…
n Correlationn Linear n Rank
n Entropy-based n Mutual information
n Ad-hoc n Neural networks

Clustering

Hierarchical Clustering
n Agglomerative Techniquen Successive “fusing” cases n Respect (or not) definitions of intra- and
/or inter-group proximity
n Visualization n Dendrogram, Tree, Venn diagram

Data Visualization

Linkages
n Single-linkage: proximity to the closest element in another cluster
n Complete-linkage: proximity to the most distant element
n Mean: proximity to the mean (centroid)

Graphical Representations

Hierarchical

Additive Trees
n Commonly the minimum spanning tree
n Nearest neighbor approach to hierarchical clustering
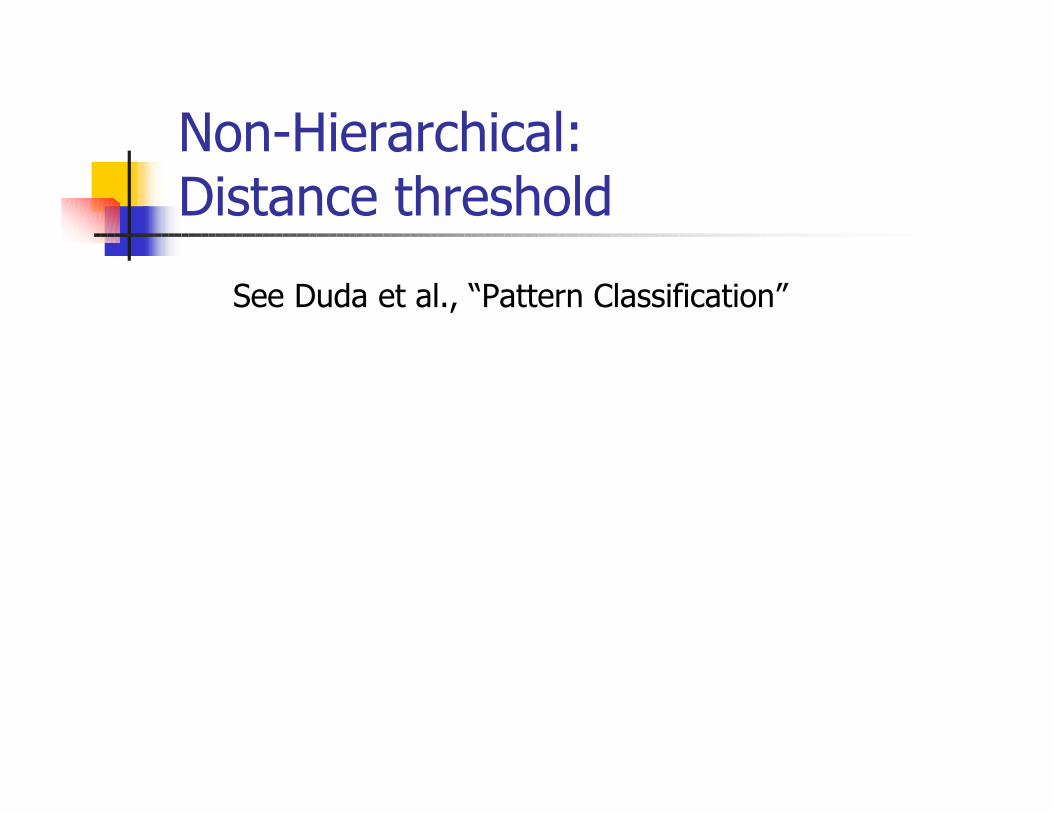
Non-Hierarchical: Distance threshold
See Duda et al., “Pattern Classification”
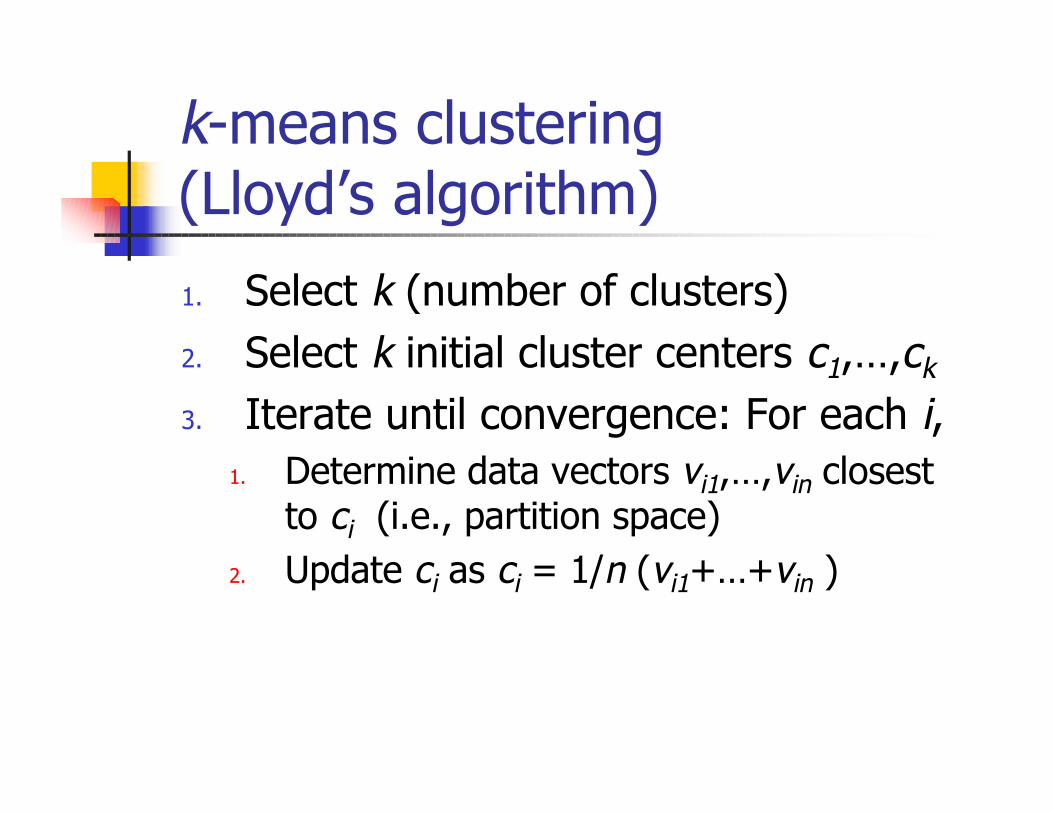
k-means clustering (Lloyd’s algorithm)
1. Select k (number of clusters)2. Select k initial cluster centers c1,…,ck
3. Iterate until convergence: For each i,1. Determine data vectors vi1,…,vin closest
(i.e., partition space)to ci
2. Update ci as ci = 1/n (vi1+…+vin )

k-means clustering example
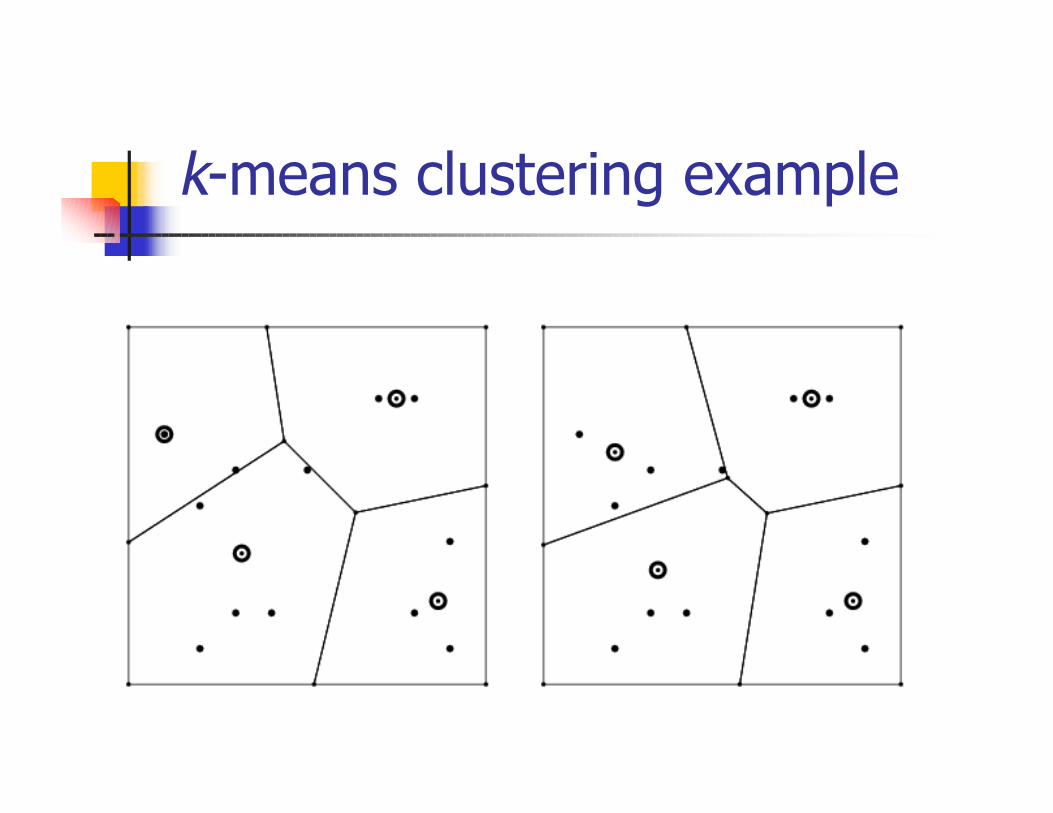
k-means clustering example

k-means clustering example

Common mistakes n Refer to dendrograms as meaning
“hierarchical clustering” in general n Misinterpretation of tree-like graphical
representations n Ill definition of clustering criterion
n Declare a clustering algorithm as “best”
n Expect classification model from clusters n Expect robust results with little/poor data

Dimensionality Reduction

Multidimensional Scaling
n Geometrical models
n Uncover structure or pattern in observed proximity matrix
n Objective is to determine both dimensionality d and the position of points in the d-dimensional space
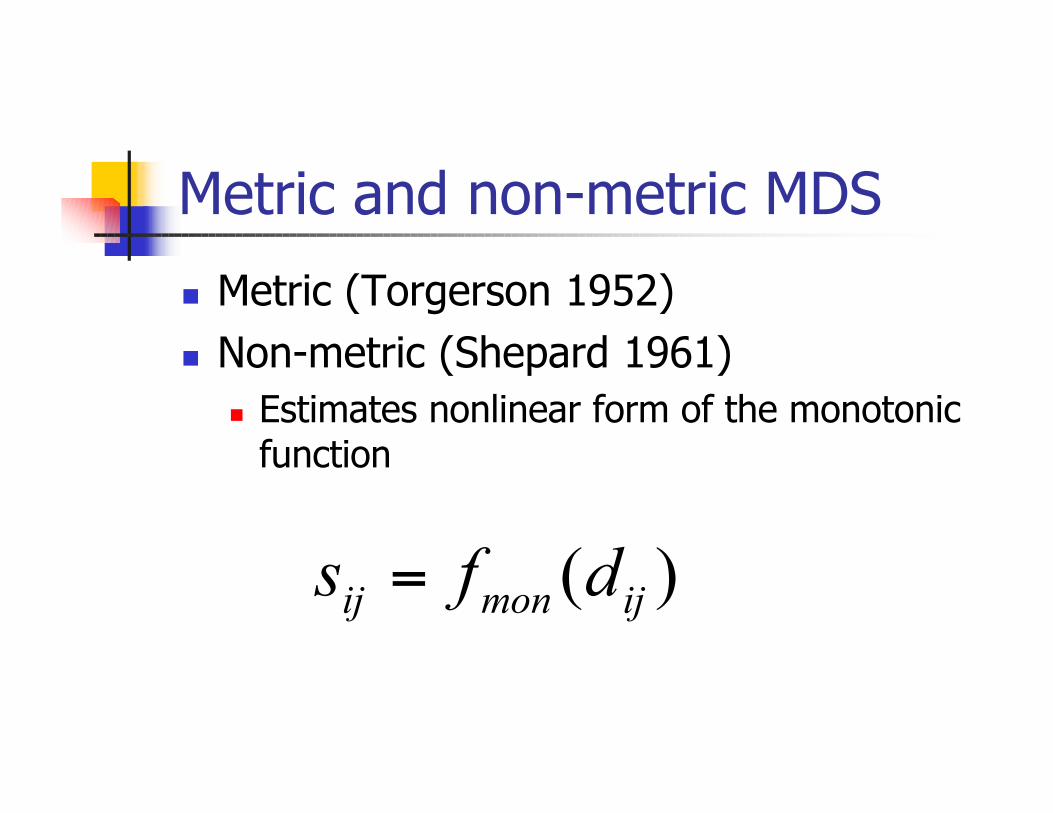
Metric and non-metric MDS
n Metric (Torgerson 1952)n Non-metric (Shepard 1961)
n Estimates nonlinear form of the monotonic function
sij = f (dij )mon
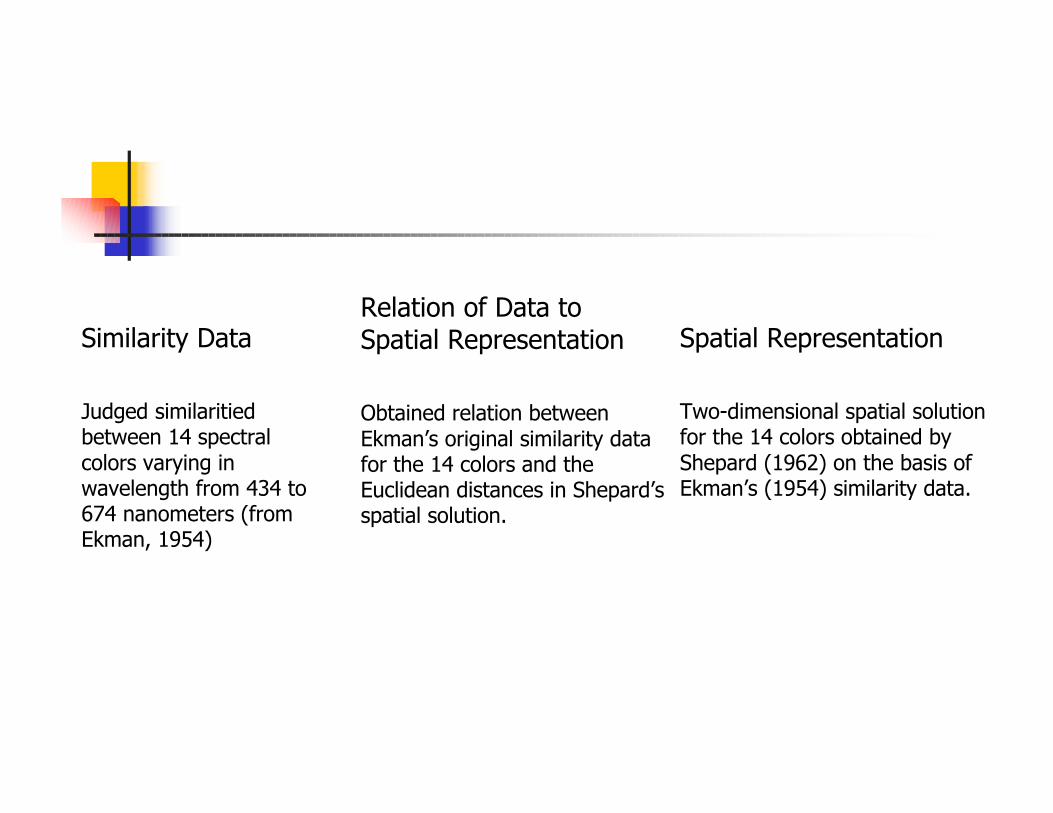
Similarity Data
Judged similaritied between 14 spectral colors varying in wavelength from 434 to 674 nanometers (from Ekman, 1954)
Relation of Data to Spatial Representation
Obtained relation between Ekman’s original similarity data for the 14 colors and the Euclidean distances in Shepard’s spatial solution.
Spatial Representation
Two-dimensional spatial solution for the 14 colors obtained by Shepard (1962) on the basis of Ekman’s (1954) similarity data.
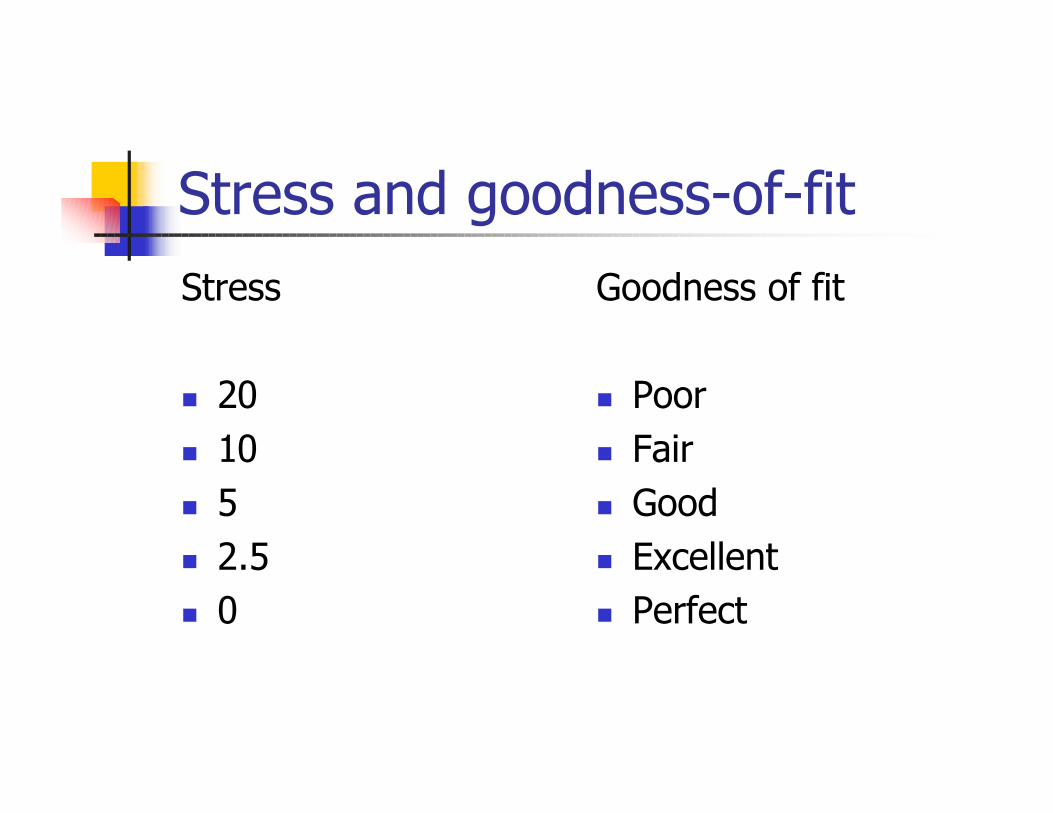
Stress and goodness-of-fit Stress Goodness of fit
n 20 n Poor n 10 n Fair n 5 n Good n 2.5 n Excellent n 0 n Perfect

References
n Reference books for this course (Duda and Hard, Hastie et al.)
n B. Everitt n J. Hartigan
n R. Shepard
n Sage books