Unsupervised Learning: K-means Clusteringi-systems.github.io/HSE545/machine learning all/05...
12
Unsupervised Learning: K-means Clustering by Prof. Seungchul Lee iSystems Design Lab http://isystems.unist.ac.kr/ UNIST Table of Contents I. 1. Supervised vs. Unsupervised Learning II. 2. K-means I. 2.1. (Iterative) Algorithm II. 2.2. Summary: K-means Algorithm III. 2.3. K-means Optimization Point of View (optional) III. 3. Python code IV. 4. Some Issues in K-means I. 4.1. K-means: Initialization issues II. 4.2. Choosing the Number of Clusters III. 4.3. K-means: Limitations 1. Supervised vs. Unsupervised Learning Supervised: building a model from labeled data Unsupervised: clustering from unlabeled data Supervised Learning
-
Upload
phungkhuong -
Category
Documents
-
view
223 -
download
1
Transcript of Unsupervised Learning: K-means Clusteringi-systems.github.io/HSE545/machine learning all/05...
Unsupervised Learning: K-meansClustering
by Prof. Seungchul Lee iSystems Design Lab http://isystems.unist.ac.kr/ UNIST
Table of Contents
I. 1. Supervised vs. Unsupervised LearningII. 2. K-means
I. 2.1. (Iterative) AlgorithmII. 2.2. Summary: K-means AlgorithmIII. 2.3. K-means Optimization Point of View (optional)
III. 3. Python codeIV. 4. Some Issues in K-means
I. 4.1. K-means: Initialization issuesII. 4.2. Choosing the Number of ClustersIII. 4.3. K-means: Limitations
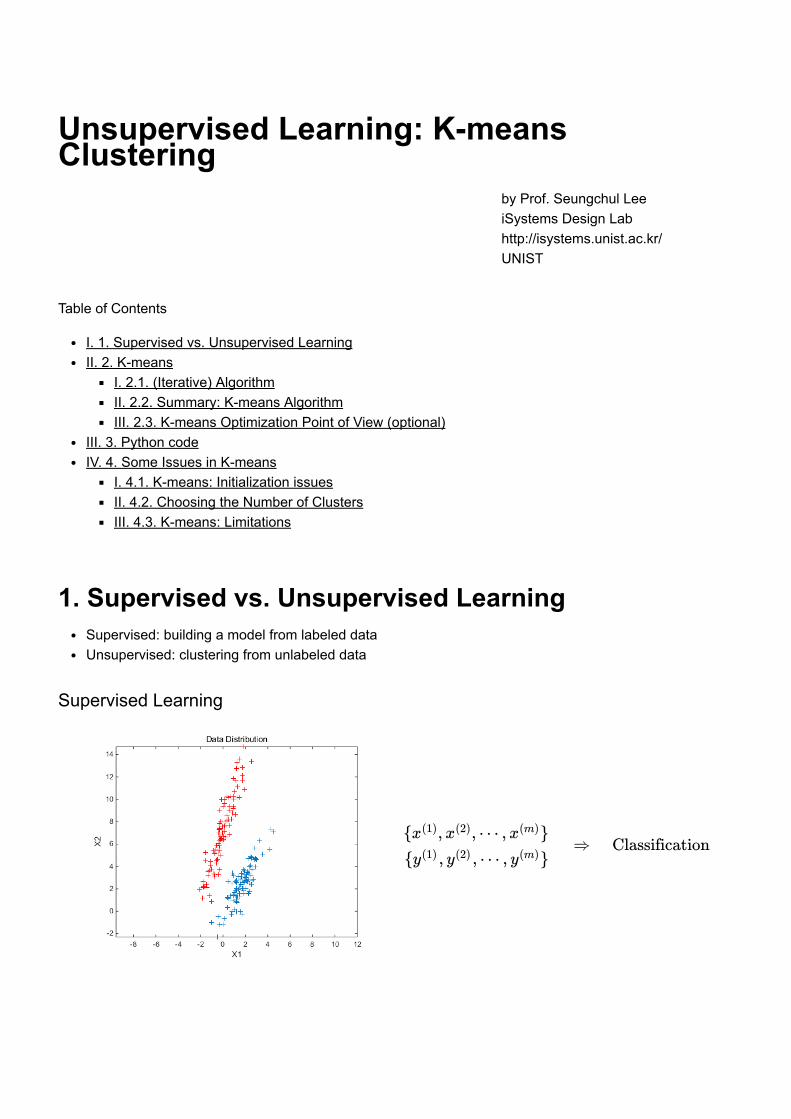
1. Supervised vs. Unsupervised LearningSupervised: building a model from labeled dataUnsupervised: clustering from unlabeled data
Supervised Learning
⇒ Classification{ , , ⋯ , }x(1) x(2) x(m)
{ , , ⋯ , }y(1) y(2) y(m)
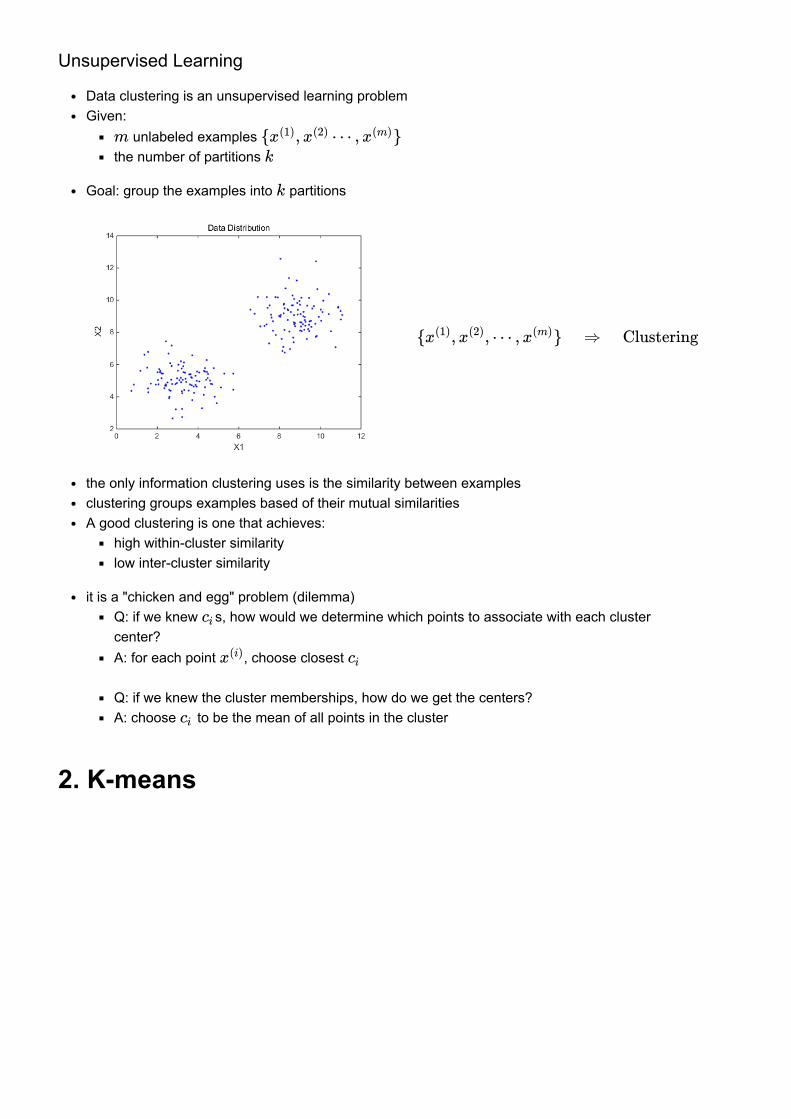
Unsupervised Learning
Data clustering is an unsupervised learning problemGiven:
unlabeled examples the number of partitions
Goal: group the examples into partitions
the only information clustering uses is the similarity between examplesclustering groups examples based of their mutual similaritiesA good clustering is one that achieves:
high within-cluster similaritylow inter-cluster similarity
it is a "chicken and egg" problem (dilemma)Q: if we knew s, how would we determine which points to associate with each clustercenter?A: for each point , choose closest Q: if we knew the cluster memberships, how do we get the centers?A: choose to be the mean of all points in the cluster
2. K-means
m { , ⋯ , }x(1) x(2) x(m)
k
k
{ , , ⋯ , } ⇒ Clusteringx(1) x(2) x(m)
ci
x(i) ci
ci
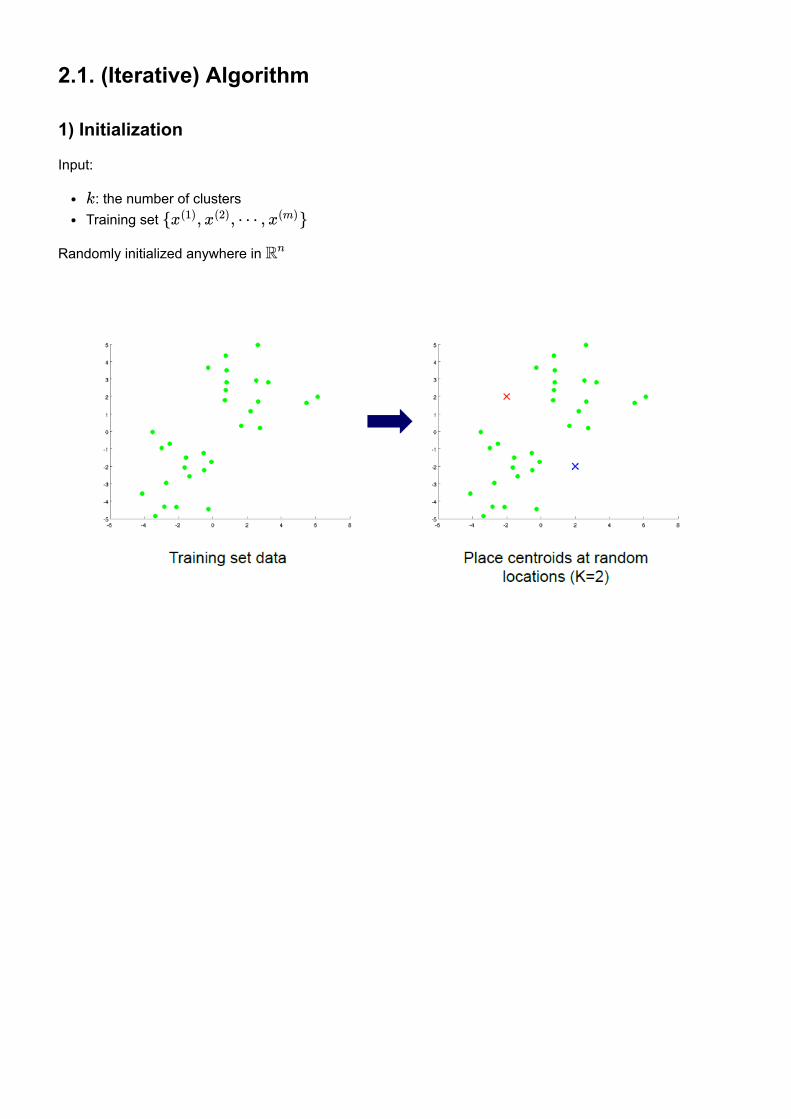
2.1. (Iterative) Algorithm 1) Initialization
Input:
: the number of clustersTraining set
Randomly initialized anywhere in
k
{ , , ⋯ , }x(1) x(2) x(m)
Rn
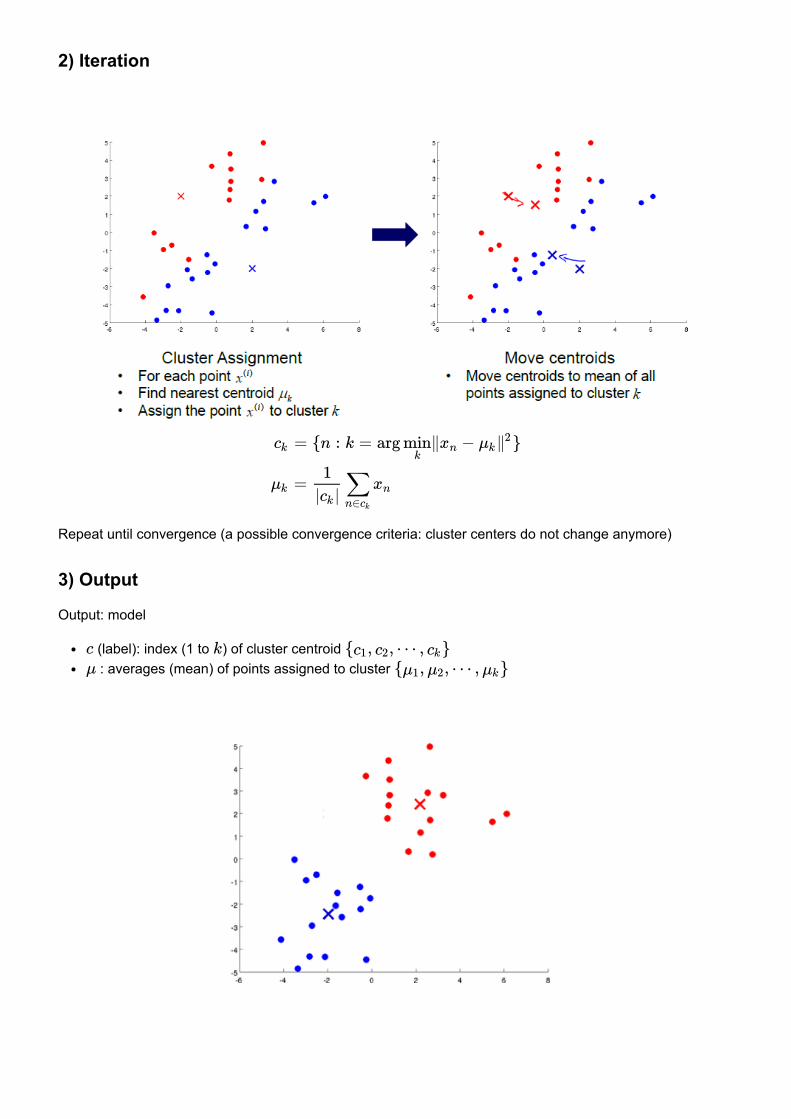
2) Iteration
Repeat until convergence (a possible convergence criteria: cluster centers do not change anymore)
3) Output
Output: model
(label): index (1 to ) of cluster centroid : averages (mean) of points assigned to cluster
ck
μk
= {n : k = arg ∥ − }mink
xn μk ∥2
=1
| |ck
∑n∈ck
xn
c k { , , ⋯ , }c1 c2 ck
μ { , , ⋯ , }μ1 μ2 μk
In [1]:
%%html <center><iframe src="./image_files/11 print.pdf#view=fit", width=700 height=500></iframe></center>
2.2. Summary: K-means AlgorithmRandomly initialize k cluster centroids , , ⋯ , ∈μ1 μ2 μk R
n
Repeat{
for i = 1 to m
:= index (from 1 to k) of cluster centroid closest to ci x(i)
for k = 1 to k
:= average (mean) of points assigned to cluster kμk
}
2.3. K-means Optimization Point of View (optional)= index of cluster to which example is currently assigned= cluster centroid ( )= cluster centroid of cluster to which example has been assigned
Optimization objective:
3. Python codeIn [2]:
import numpy as np import matplotlib.pyplot as plt
%matplotlib inline
ci (1, 2, ⋯ , k) x(i)
μk k ∈μk Rn
μcix(i)
J( , ⋯ , , , ⋯ , ) = ∥ −c1 cm μ1 μk
1
m∑i=1
m
x(i) μci∥2
J( , ⋯ , , , ⋯ , )min,⋯, , ,⋯,c1 cm μ1 μk
c1 cm μ1 μk
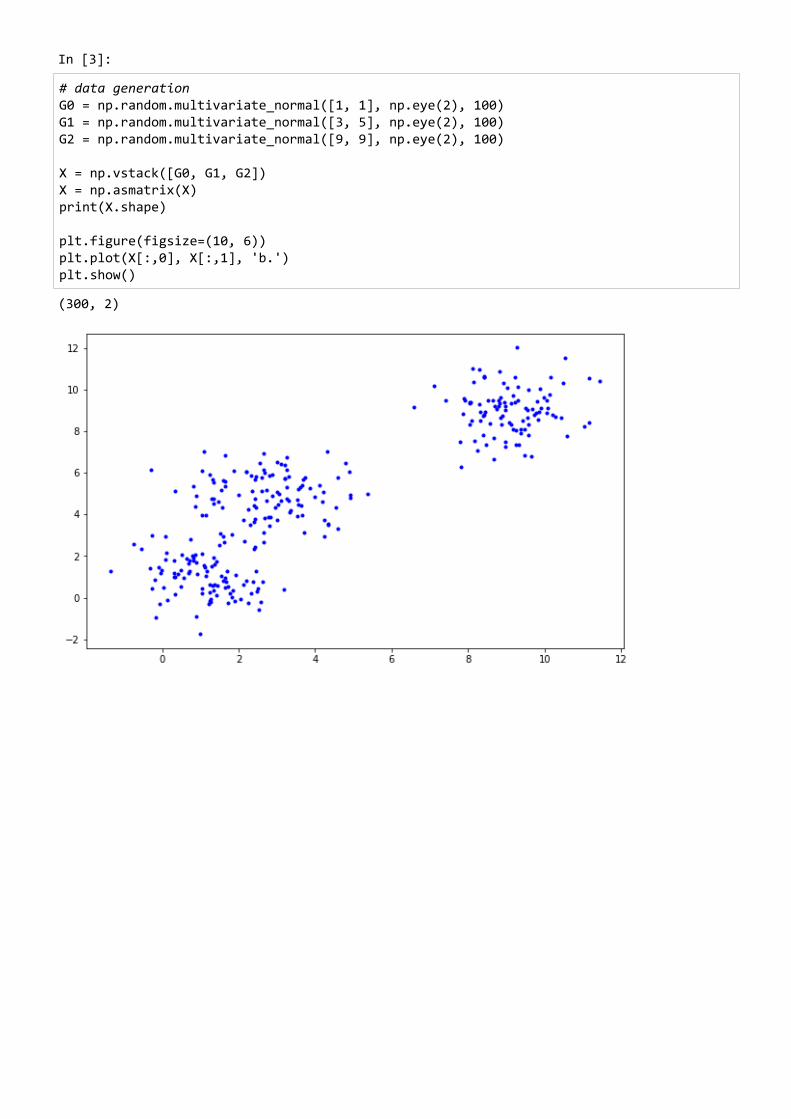
In [3]:
# data generation G0 = np.random.multivariate_normal([1, 1], np.eye(2), 100) G1 = np.random.multivariate_normal([3, 5], np.eye(2), 100) G2 = np.random.multivariate_normal([9, 9], np.eye(2), 100)
X = np.vstack([G0, G1, G2]) X = np.asmatrix(X) print(X.shape)
plt.figure(figsize=(10, 6)) plt.plot(X[:,0], X[:,1], 'b.') plt.show()
(300, 2)
In [4]:
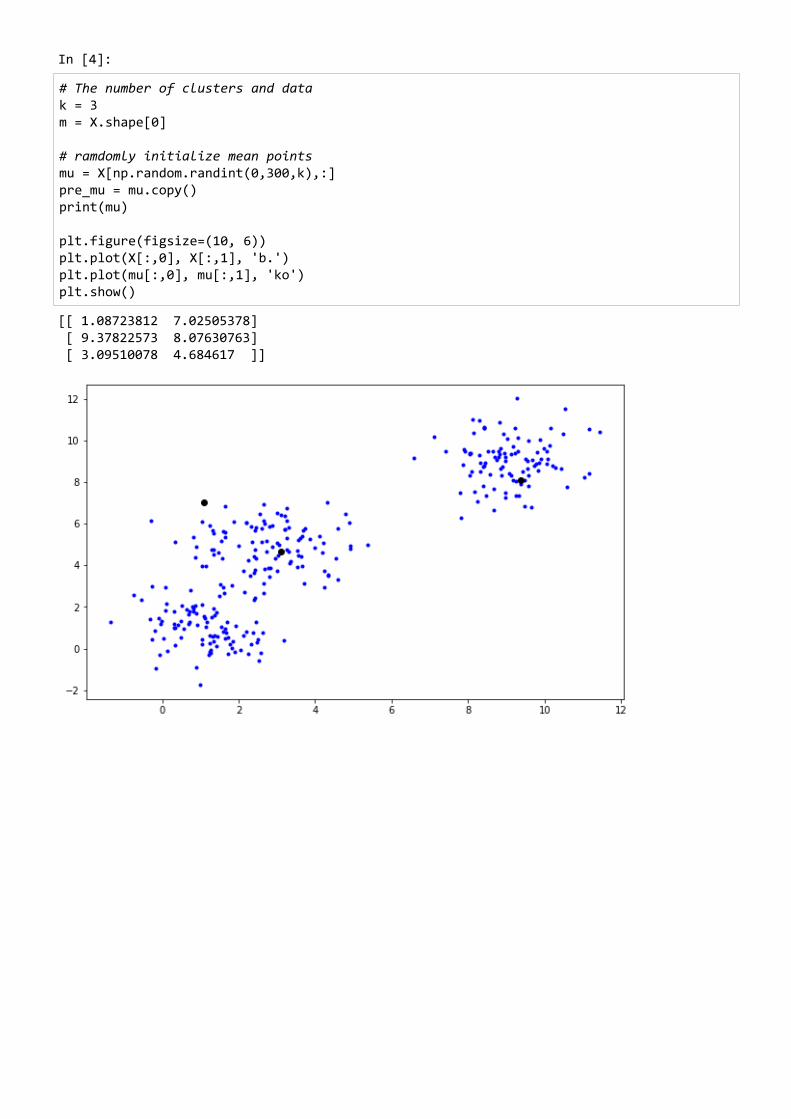
# The number of clusters and data k = 3 m = X.shape[0]
# ramdomly initialize mean points mu = X[np.random.randint(0,300,k),:] pre_mu = mu.copy() print(mu)
plt.figure(figsize=(10, 6)) plt.plot(X[:,0], X[:,1], 'b.') plt.plot(mu[:,0], mu[:,1], 'ko') plt.show()
[[ 1.08723812 7.02505378] [ 9.37822573 8.07630763] [ 3.09510078 4.684617 ]]
In [5]:
y = np.empty([m,1])
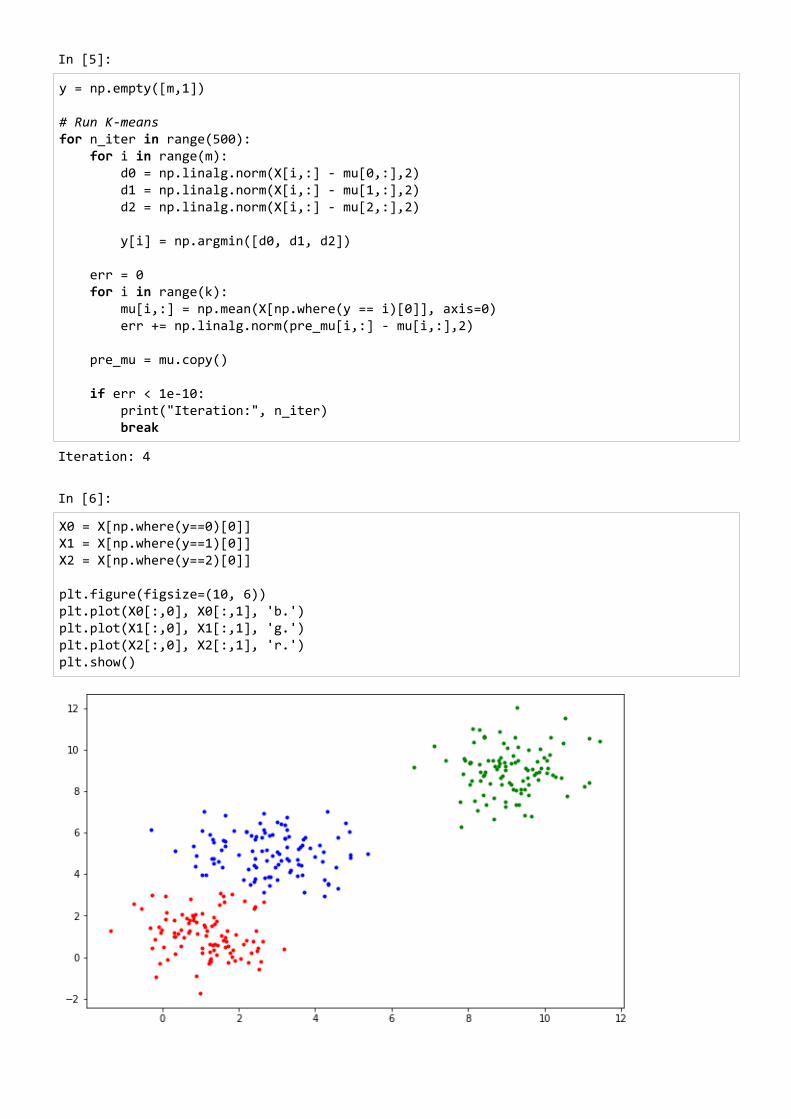
# Run K-means for n_iter in range(500): for i in range(m): d0 = np.linalg.norm(X[i,:] - mu[0,:],2) d1 = np.linalg.norm(X[i,:] - mu[1,:],2) d2 = np.linalg.norm(X[i,:] - mu[2,:],2)
y[i] = np.argmin([d0, d1, d2]) err = 0 for i in range(k): mu[i,:] = np.mean(X[np.where(y == i)[0]], axis=0) err += np.linalg.norm(pre_mu[i,:] - mu[i,:],2) pre_mu = mu.copy() if err < 1e-10: print("Iteration:", n_iter) break
Iteration: 4
In [6]:
X0 = X[np.where(y==0)[0]] X1 = X[np.where(y==1)[0]] X2 = X[np.where(y==2)[0]]
plt.figure(figsize=(10, 6)) plt.plot(X0[:,0], X0[:,1], 'b.') plt.plot(X1[:,0], X1[:,1], 'g.') plt.plot(X2[:,0], X2[:,1], 'r.') plt.show()
In [7]:
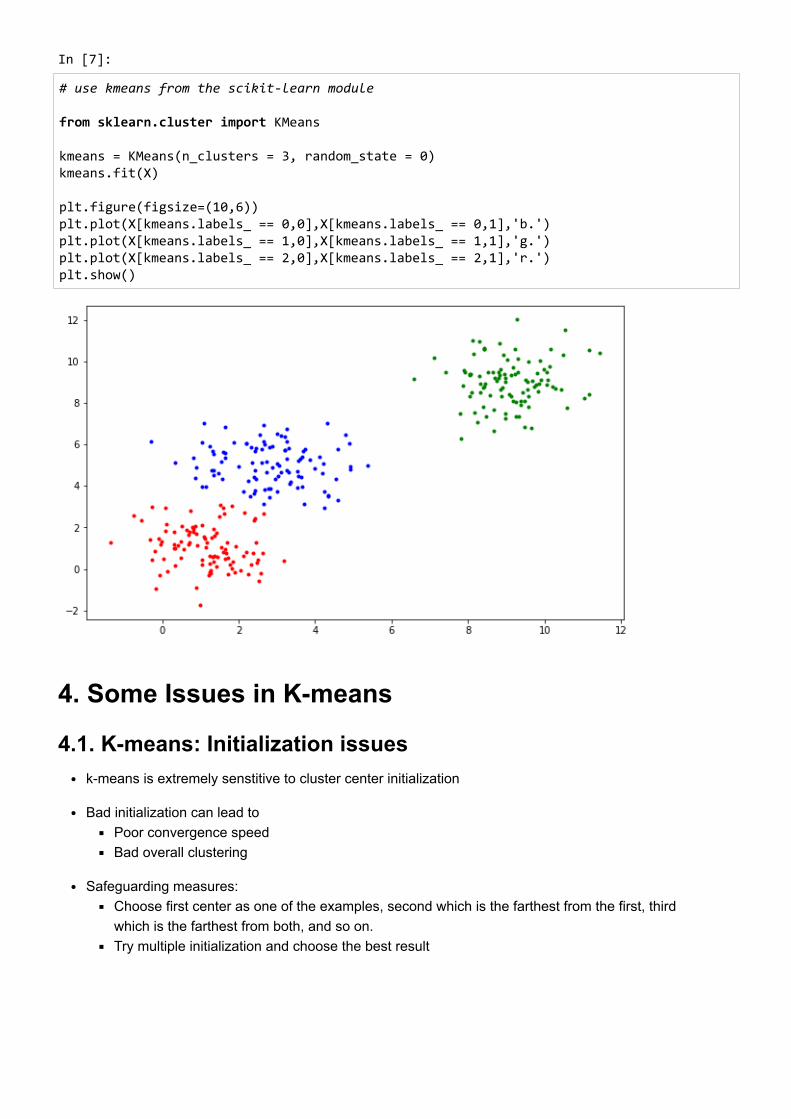
# use kmeans from the scikit-learn module
from sklearn.cluster import KMeans
kmeans = KMeans(n_clusters = 3, random_state = 0) kmeans.fit(X)
plt.figure(figsize=(10,6)) plt.plot(X[kmeans.labels_ == 0,0],X[kmeans.labels_ == 0,1],'b.') plt.plot(X[kmeans.labels_ == 1,0],X[kmeans.labels_ == 1,1],'g.') plt.plot(X[kmeans.labels_ == 2,0],X[kmeans.labels_ == 2,1],'r.') plt.show()
4. Some Issues in K-means
4.1. K-means: Initialization issuesk-means is extremely senstitive to cluster center initialization
Bad initialization can lead toPoor convergence speedBad overall clustering
Safeguarding measures:Choose first center as one of the examples, second which is the farthest from the first, thirdwhich is the farthest from both, and so on.Try multiple initialization and choose the best result
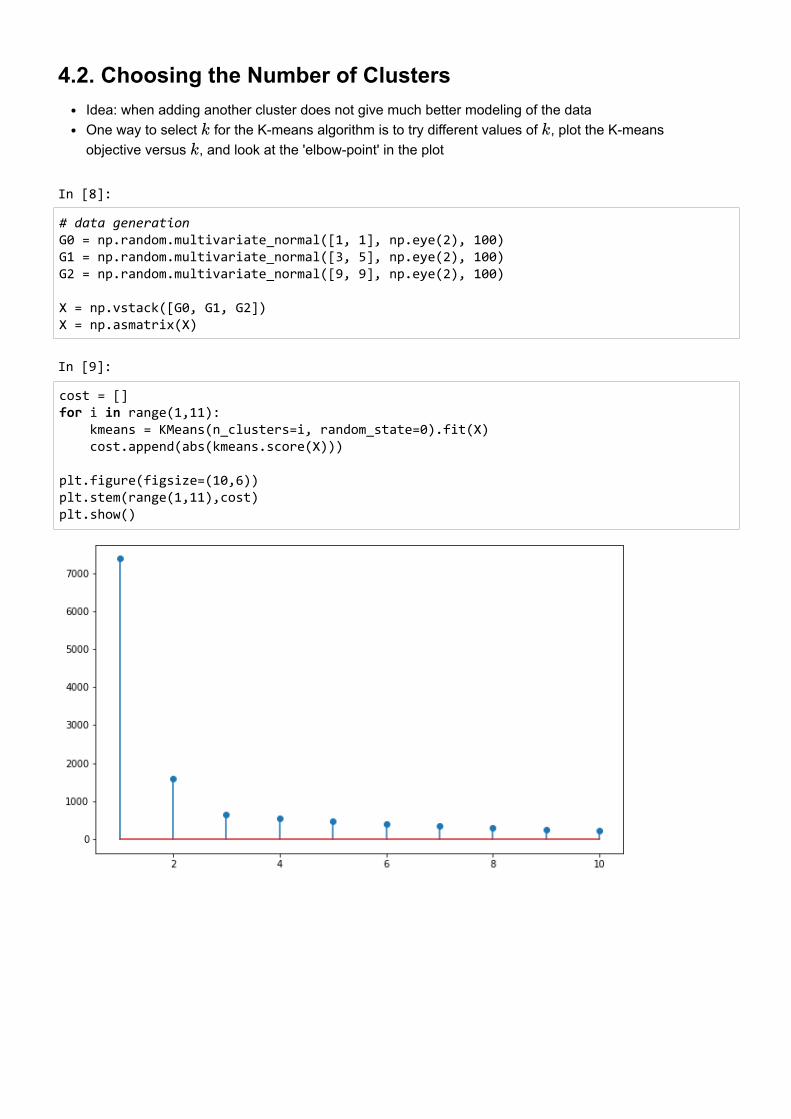
4.2. Choosing the Number of ClustersIdea: when adding another cluster does not give much better modeling of the dataOne way to select for the K-means algorithm is to try different values of , plot the K-meansobjective versus , and look at the 'elbow-point' in the plot
In [8]:
# data generation G0 = np.random.multivariate_normal([1, 1], np.eye(2), 100) G1 = np.random.multivariate_normal([3, 5], np.eye(2), 100) G2 = np.random.multivariate_normal([9, 9], np.eye(2), 100)
X = np.vstack([G0, G1, G2]) X = np.asmatrix(X)
In [9]:
cost = [] for i in range(1,11): kmeans = KMeans(n_clusters=i, random_state=0).fit(X) cost.append(abs(kmeans.score(X)))
plt.figure(figsize=(10,6)) plt.stem(range(1,11),cost) plt.show()
k k
k
4.3. K-means: LimitationsMake hard assignments of points to clusters
A point either completely belongs to a cluster or not belongs at allNo notion of a soft assignment (i.e., probability of being assigned to each cluster)Gaussian mixture model (we will study later) and Fuzzy K-means allow soft assignments
Sensitive to outlier examples (such example can affect the mean by a lot)K-medians algorithm is a more robust alternative for data with outliers
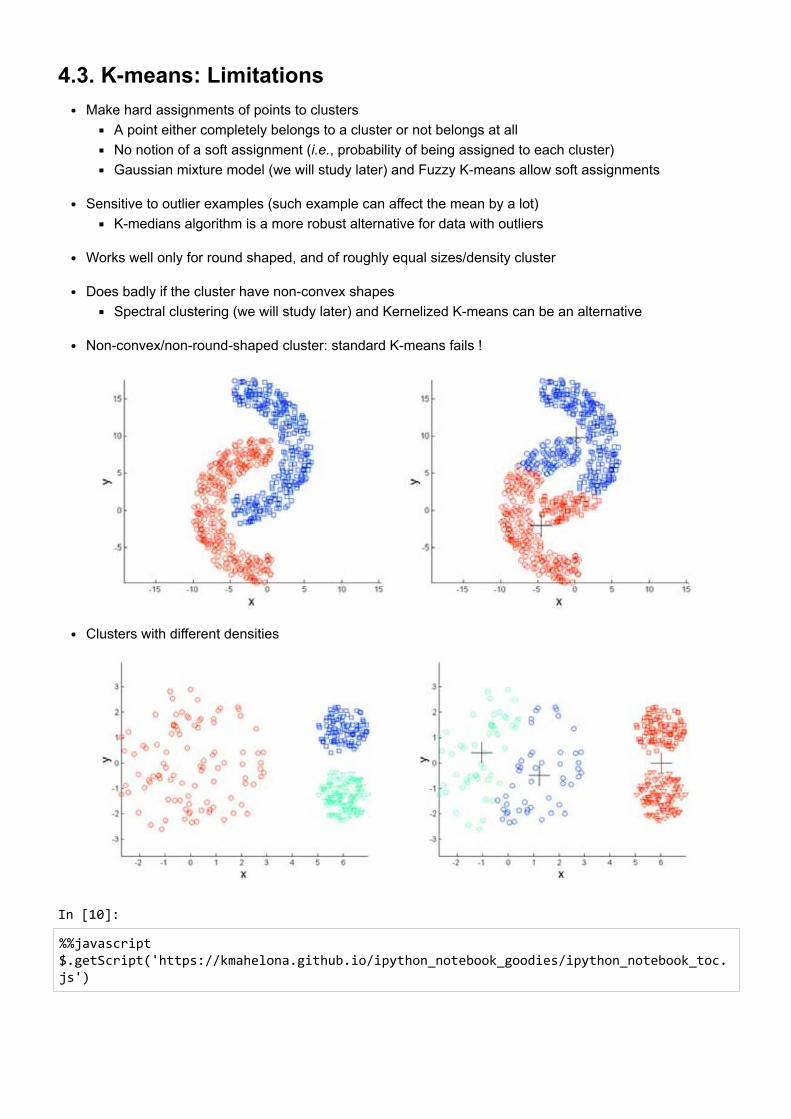
Works well only for round shaped, and of roughly equal sizes/density cluster
Does badly if the cluster have non-convex shapesSpectral clustering (we will study later) and Kernelized K-means can be an alternative
Non-convex/non-round-shaped cluster: standard K-means fails !
Clusters with different densities
In [10]:
%%javascript $.getScript('https://kmahelona.github.io/ipython_notebook_goodies/ipython_notebook_toc.js')