Unsupervised Intrusion Detection System€¦ · sidst vil en unsupervised intrusion detection...
118
Unsupervised Intrusion Detection System Aykut ¨ Oks¨ uz Kongens Lyngby 2007 IMM-M.Sc.-2007-20
-
Upload
vuongduong -
Category
Documents
-
view
218 -
download
0
Transcript of Unsupervised Intrusion Detection System€¦ · sidst vil en unsupervised intrusion detection...
Unsupervised Intrusion DetectionSystem
Aykut Oksuz
Kongens Lyngby 2007IMM-M.Sc.-2007-20

Technical University of DenmarkInformatics and Mathematical ModellingBuilding 321, DK-2800 Kongens Lyngby, DenmarkPhone +45 45253351, Fax +45 [email protected]
Abstract
This thesis evolves around Intrusion Detection System (IDS) and Neural Net-work (NN). Intrusion detection systems are gaining more and more territory inthe field of secure networks and new ideas and concepts regarding the intrusiondetection process keep surfacing.
One idea is to use a neural network algorithm for detecting intrusions. Theneural network algorithms have the ability to be trained and ’learn’ socalledpatterns in a given environment. This feature can be used in connection with anintrusion detection system, where the neural network algorithm can be trainedto detect intrusions by recognizing patterns of an intrusion.
This thesis outlines an investigation on the unsupervised neural network modelsand choice of one of them for evaluation and implementation. The thesis alsoincludes works on computer networks, providing a description and analysis ofthe structure of the computer network in order to generate network features. Adesign proposal for such a system is documented in this thesis together with animplementation of an unsupervised intrusion detection system.
Keywords: Intrusion Detection System, Neural Network, Unsupervised Learn-ing Algorithm, Pcap, Network Features.

ii
Resume
Dette eksamensprojekt omhandler Intrusion Detection Systemer (IDS) og Neu-rale Netværk (NN). Intrusion detection systemer er blevet mere og mere pop-ulære og der optsar hele tiden nye ideer og koncepter til intrusion detectionsystemer.
En mulig ide er at bruge et neuralt netværk for at opdage indbrud. Et neuraltnetværk kan blive trænet til at kunne ’lære’ mønstre i et bestemt miljø. Detteegenskab kan bruges i forbindelse med et intrusion detection system, hvor detneurale netværk kan trænes til at opdage indbrud ved at genkende mønstre, derkendetegner et indbrud
Dette eksamensprojekt omhandler en undersøgelse af unsupervised neuralt netvæksmodeller og hernæst valg af en for vurdering og implementering. Projektetinkluderer ogsa det arbejde der er forbundet med computernetværk, ved at udar-bejde en beskrivelse og analyse af computernetværk for at generere netværkfea-tures. Et designsforslag for sadan et system vil dokumenteres i projektet og tilsidst vil en unsupervised intrusion detection system implementeres og testes.
Nøgleord: Intrusion Detection System, Neural Netværk, Unsupervised Learn-ing Algorithm, Pcap, Netværk Features.

iv

Preface
This thesis was written at the Department of Informatics and MathematicalModelling (IMM), the Technical University of Denmark (DTU) in connectionwith acquiring the M.SC. degree in engineering. It was prepared during autumn2006 and winter 2007 and has been supervised by Professor Robin Sharp.
The thesis deals with topics like intrusion detections, neural networks, unsuper-vised learning algorithms and etc. The focus is on evaluating and implementingan intrusion detection system using an unsupervised learning algorithm.
I would like thank everyone who has has contributed in realising this thesis,especially Robin Sharp for his guidance and supervision.
Lyngby, February 2007
Aykut Oksuz

vi
Contents
Abstract i
Resume iii
Preface v
1 Introduction 1
1.1 The goal of this project . . . . . . . . . . . . . . . . . . . . . . . 1
1.2 The structure of the report . . . . . . . . . . . . . . . . . . . . . 3
1.3 Content of the CDROM . . . . . . . . . . . . . . . . . . . . . . . 4
2 Intrusion Detection System 5
2.1 Intrusion detection system - IDS . . . . . . . . . . . . . . . . . . 5
2.2 Network-Based IDSs . . . . . . . . . . . . . . . . . . . . . . . . . 6
2.3 Different types of IDSs . . . . . . . . . . . . . . . . . . . . . . . . 8
2.4 Summary and discussion . . . . . . . . . . . . . . . . . . . . . . . 12
viii CONTENTS
3 Intrusion detection using neural networks 13
3.1 What is a neural network? . . . . . . . . . . . . . . . . . . . . . . 13
3.2 Why use neural network for IDSs? . . . . . . . . . . . . . . . . . 15
3.3 Learning processes . . . . . . . . . . . . . . . . . . . . . . . . . . 15
3.4 Learning paradigms . . . . . . . . . . . . . . . . . . . . . . . . . 18
3.5 Summary and discussion . . . . . . . . . . . . . . . . . . . . . . . 21
4 Neural Network Algorithms 23
4.1 Cluster Detection - CD . . . . . . . . . . . . . . . . . . . . . . . 23
4.2 Self-Organizing Map - SOM . . . . . . . . . . . . . . . . . . . . . 26
4.3 Principal Component Analysis - PCA . . . . . . . . . . . . . . . 31
4.4 An Intrusion detection system with SOM . . . . . . . . . . . . . 33
4.5 Summary and discussion . . . . . . . . . . . . . . . . . . . . . . . 34
5 Network connections and features 37
5.1 Protocols in the Internet . . . . . . . . . . . . . . . . . . . . . . . 37
5.2 Sniffer tools . . . . . . . . . . . . . . . . . . . . . . . . . . . . . . 40
5.3 Feature construction . . . . . . . . . . . . . . . . . . . . . . . . . 44
5.4 Intrusion detection process with the given features . . . . . . . . 49
5.5 Scaling and transformation of the features . . . . . . . . . . . . . 50
5.6 Summary and discussion . . . . . . . . . . . . . . . . . . . . . . . 53
6 Specifications and requirements for the IDS 55
6.1 The purpose of the IDS . . . . . . . . . . . . . . . . . . . . . . . 55
CONTENTS ix
6.2 The overall system . . . . . . . . . . . . . . . . . . . . . . . . . . 56
6.3 Where to use the IDS . . . . . . . . . . . . . . . . . . . . . . . . 60
6.4 Summary and discussion . . . . . . . . . . . . . . . . . . . . . . . 61
7 Design of the IDS 63
7.1 Theoretical design . . . . . . . . . . . . . . . . . . . . . . . . . . 63
7.2 Design of the implementation . . . . . . . . . . . . . . . . . . . . 66
7.3 Summary and discussion . . . . . . . . . . . . . . . . . . . . . . . 69
8 Implementation 71
8.1 Development environment . . . . . . . . . . . . . . . . . . . . . . 71
8.2 Implementation of IDSnet . . . . . . . . . . . . . . . . . . . . . . 72
8.3 Implementation of the SOM algorithm . . . . . . . . . . . . . . . 72
8.4 Implementation of the SOM GUI . . . . . . . . . . . . . . . . . . 74
8.5 Summary and discussion . . . . . . . . . . . . . . . . . . . . . . . 74
9 Test of IDSnet with SOM 77
9.1 Test strategy . . . . . . . . . . . . . . . . . . . . . . . . . . . . . 77
9.2 Functionality test . . . . . . . . . . . . . . . . . . . . . . . . . . . 78
9.3 Efficiency test . . . . . . . . . . . . . . . . . . . . . . . . . . . . . 78
9.4 Summary and discussion . . . . . . . . . . . . . . . . . . . . . . . 84
10 Concluding remarks 85
10.1 The SOM algorithm . . . . . . . . . . . . . . . . . . . . . . . . . 85
x CONTENTS
10.2 Working with the IDSnet . . . . . . . . . . . . . . . . . . . . . . 86
10.3 Network features . . . . . . . . . . . . . . . . . . . . . . . . . . . 86
10.4 Remarks on project progress . . . . . . . . . . . . . . . . . . . . 87
A User manual 89
B Functional test 91
C A draft of the log file 97
D Source code of a simple sniffer using pcap 99
Bibliography 106
Chapter 1
Introduction
With the rapid expansion of computer networks the security issues are not tobe compromised. The importance of the security measures grows bigger asthe protection of data (e.g., company data and research data) and the protec-tion against computer related malicious code or intrusion attacks (virus, worm,trojan horse etc.) are becoming more and more frequent for almost everyoneworking with computers. Today it is unlikely to find a company, an institutionor a private home computer that is not protected against the steadily growingthreat from networks (e.g., the Internet). Intrusion events could cost companiesgreat amount of money and time. It could also happen that their precious datacould end in the wrong hands, leading to wasted time and effort. There areseveral proposals to how to enhance security and this project is about one ofthem.
1.1 The goal of this project
The aim of this project is to make a research on unsupervised neural networkmodels. Roughly, neural networks are specified with many small processorsworking simultaneously on the same task. It has the ability to ’learn’ fromtraining data and use its ’knowledge’ to compare patterns in a data set. Espe-cially the unsupervised networks, which do not need categorized training data
2 Introduction
set, are more interesting as they are more self-administrative and can learn newpatterns within the data set without any interference from outside (i.e., an ad-ministrator).The project also concerns a certain method for protecting computer networks.The intrusion detection system (IDS) is one way of protecting a computer net-work. This kind of technology enables users of a network to be aware of theincoming threats from the Internet by observing and analyzing network traffic.During these processes the IDS will gather information from the network traf-fic, which will be used to determine whether the traffic holds suspicious content.Upon suspicious behavior in the network traffic, the IDS program can be set towarn its administrator either by mail or SMS, and in most cases write out to logfiles, which the administrator can read and discover possible intrusion. The IDSdoes not prevent an intrusion like a firewall which closes ports entirely. The IDSlets the traffic flow but sees the traffic and detects intrusion without really doinganything about it. The rest is up to the administrator or the security policy.Many IDSs are based on some form of pattern recognition, where patterns ofintrusions are known to the IDS and the IDS can perform comparison with thepatterns of the network traffic in order spot intrusions. A pattern is a certainbehavior that characterizes an intrusion. It could be anything from a value toa graphical representation. In order to compare these patterns, the IDS mustknow them beforehand so the comparison is possible and then intrusions can bedetected. But it is a hard process defining all kind of intrusions and some ofthem are really unknown until they have taken place.The goal of this project is to develop a system, that does not need any knowledgebeforehand but can be trained to detect unknown patterns in network traffic.This unknown pattern does not necessarily need to be an intrusion, it could be anew normal behavior in the network that is just unknown to the system. But theaim is to detect any kind of new and unknown behaviors and later by examininglog files determine whether the new patterns indicate intrusions or not. This ishere where the unsupervised neural network comes in. A network of this typeis capable of detecting any kind of behavior. The behaviors that the networkhas been trained with is normally representing normal network traffic withoutany intrusions. And while testing network traffic, the network will distinguishnormal data from unknown data and these unknown data are suspicious andpotential intrusions. This project is also about finding a neural network model,that is best suitable for tasks like intrusion detection.The product of this project is a system which implements an unsupervised neu-ral network. The network can be trained and tested while users can follow up onthe process through a graphical user interface. In order to prove the efficiencyof the system some tests will be carried out after the implementation.
1.2 The structure of the report 3
1.2 The structure of the report
The structure of the report is as follows
Chapter 2. Deals with the concept of intrusion detection systems. It will alsocover the different types of IDSs, and explain what a network-based IDSis and how it operates.
Chapter 3. Is about neural networks. An introduction to the concept of neuralnetwork together with the different learning procedures will be covered inthis chapter.
Chapter 4. This chapter is about the different types of unsupervised neuralnetwork models, that can be used with the intrusion detection. The modelsare described and one of them will be chosen based on its qualities.
Chapter 5. Deals with network connection and features. It will also cover sub-jects like how network traffic can be sniffed, features are constructed andprocessed in order to make them suitable for the neural network algorithm.
Chapter 6. A specification of the IDS with the chosen neural network modelwill be described in this chapter.
Chapter 7. This chapter will cover an overall design of the IDS regarding theimplementation.
Chapter 8. Deals with the implementation of the IDS.
Chapter 9. this chapter will present result of functional and efficiency test ofthe implemented IDS.
Chapter 10. Will cover concluding remarks on the IDS and the project as awhole.
Appendix A. User manual to the developed IDS program.
Appendix B. Functional test of the IDS program.
Appendix C. A draft of the log file the developed IDS program computes.
Appendix D. The code of a simple packet sniffer.

4 Introduction
1.3 Content of the CDROM
In the attached CDROM, the source code of the developed system is available.The program is also compiled and ready to be run. The execution file is in patch/IDSnet/idsnet/idsnet and can be executed from a command shell by writing[bash]# ./idsnet. Furthermore, there is a documentation of the implementedsystem in path /IDSnet/html/index.html.
Chapter 2
Intrusion Detection System
This chapter starts with an introduction to the concept of intrusion detectionsystem. Consequently we will look at the different variants of available IDStechniques and at the end specify what kind of properties we would like to haveregarding the unsupervised IDS we want to build.
2.1 Intrusion detection system - IDS
Generally speaking, an intrusion detection system is a tool for detecting abnor-mal behaviors in a system. An abnormal pattern covers many definitions butin general it is likely described as unwanted, malicious and/or misuse activityoccurring within a system. The two main techniques of intrusion detection arecalled misuse detection1 and anomaly detection.
• Misuse detection systems [16] use patterns of known attacks or weak spotsof the system to match and identify intrusions. For instance, if someonetries to guess a password, a signature rule for this kind of behavior couldbe that ’too many failed login attempts within some time’ and this event
1Some articles [10] refers to it as signature-based intrusion
6 Intrusion Detection System
would result in an alert. Misuse detection is not effective against unknownattacks that have no matched rules or patterns yet.
• Anomaly detection [16] flags observed activities that deviate significantlyfrom the established normal usage profiles as anomalies, that is, possibleintrusions. For instance a profile of a user may contain the averagedfrequencies of some system commands in his or her logging sessions. Andfor a logging session that is being monitored if it has significantly loweror higher frequencies an anomaly alert will be raised. Anomaly detectionis an effective technique for detecting novel or unknown attacks since itdoes no require knowledge about intrusion attacks. But at the same timeit tends to raise more alerts than misuse detection because whatever eventhappens in a session, normal or abnormal behavior, if its frequencies aresignificantly different from the averaged frequencies of the user it will raisean alert.
The two general techniques described are two different ways of spotting intru-sions. As mentioned intrusion detections can be deployed on different areas, likewithin a computer to spot users attempting to gain access to which they haveno access right, or monitoring network traffic to detect other kind of intrusionslike worms, trojan horses or to take control of a host by yielding an illegal rootshell, etc.As for this project we will concentrate our efforts on one type of intrusion de-tection, that is Network-Based IDS. Our interests lie in investigating differentpotential algorithms and later on using this knowledge to develop an automatedand unsupervised approach for building an IDS.
2.2 Network-Based IDSs
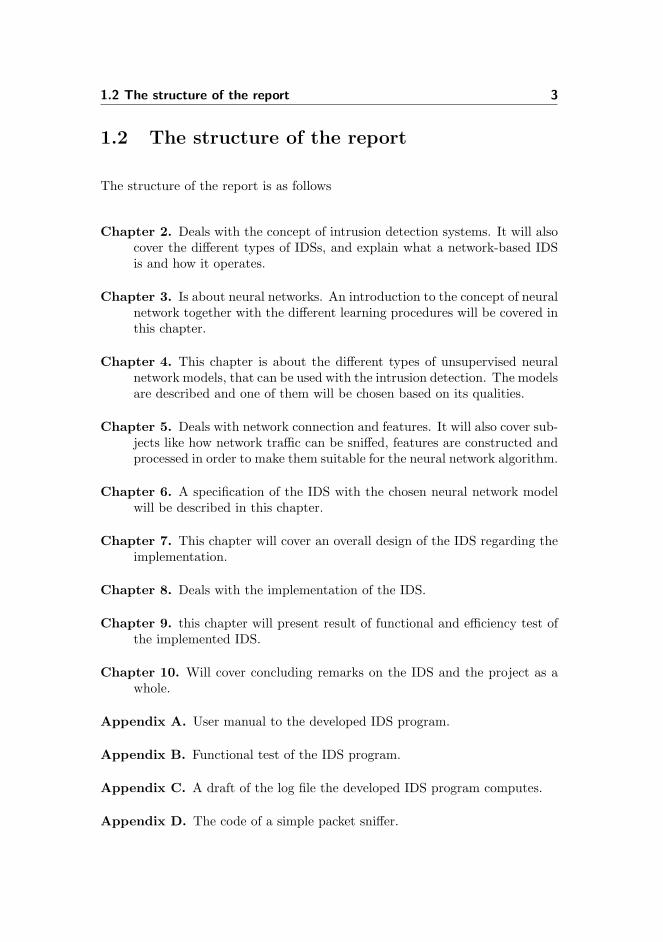
In a computer network there are a lot of data exchanges between computerswithin a local network and between a computer and another network (e.g. theInternet), see figure 2.1. The IDS systems can be deployed in different ares ofa network having different detection tasks. Being connected to a large networklike the Internet plunges the computers into a world where the risk of gettingin touch with harmful network traffic activity is relatively high. Several secu-rity precautions can be taken, like deploying antivirus, firewall, access controletc. in order to prevent such activities from intruding upon your computer ornetwork. They all concentrate on different aspects of how to protect and se-cure a computer/network. Some well-known methods of IDS systems are basedon either comparing patterns of network traffic to saved patterns of networkactivities of known attacks [16] or statistical methods used to measure how ab-
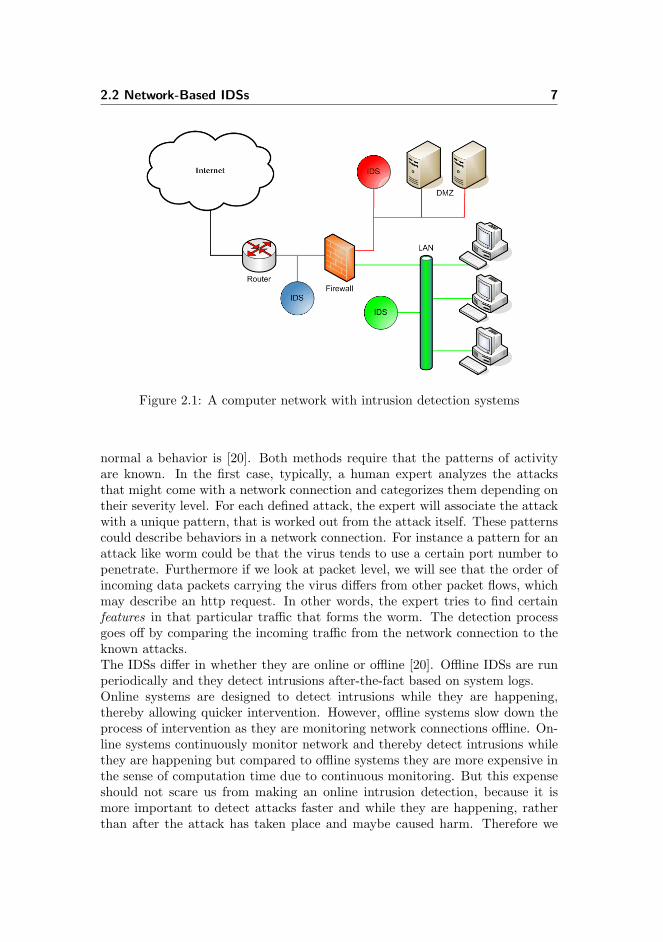
2.2 Network-Based IDSs 7
Figure 2.1: A computer network with intrusion detection systems
normal a behavior is [20]. Both methods require that the patterns of activityare known. In the first case, typically, a human expert analyzes the attacksthat might come with a network connection and categorizes them depending ontheir severity level. For each defined attack, the expert will associate the attackwith a unique pattern, that is worked out from the attack itself. These patternscould describe behaviors in a network connection. For instance a pattern for anattack like worm could be that the virus tends to use a certain port number topenetrate. Furthermore if we look at packet level, we will see that the order ofincoming data packets carrying the virus differs from other packet flows, whichmay describe an http request. In other words, the expert tries to find certainfeatures in that particular traffic that forms the worm. The detection processgoes off by comparing the incoming traffic from the network connection to theknown attacks.The IDSs differ in whether they are online or offline [20]. Offline IDSs are runperiodically and they detect intrusions after-the-fact based on system logs.Online systems are designed to detect intrusions while they are happening,thereby allowing quicker intervention. However, offline systems slow down theprocess of intervention as they are monitoring network connections offline. On-line systems continuously monitor network and thereby detect intrusions whilethey are happening but compared to offline systems they are more expensive inthe sense of computation time due to continuous monitoring. But this expenseshould not scare us from making an online intrusion detection, because it ismore important to detect attacks faster and while they are happening, ratherthan after the attack has taken place and maybe caused harm. Therefore we
8 Intrusion Detection System
choose to make an online intrusion detection system.
2.3 Different types of IDSs
Generally an IDS can be used in three different ways:
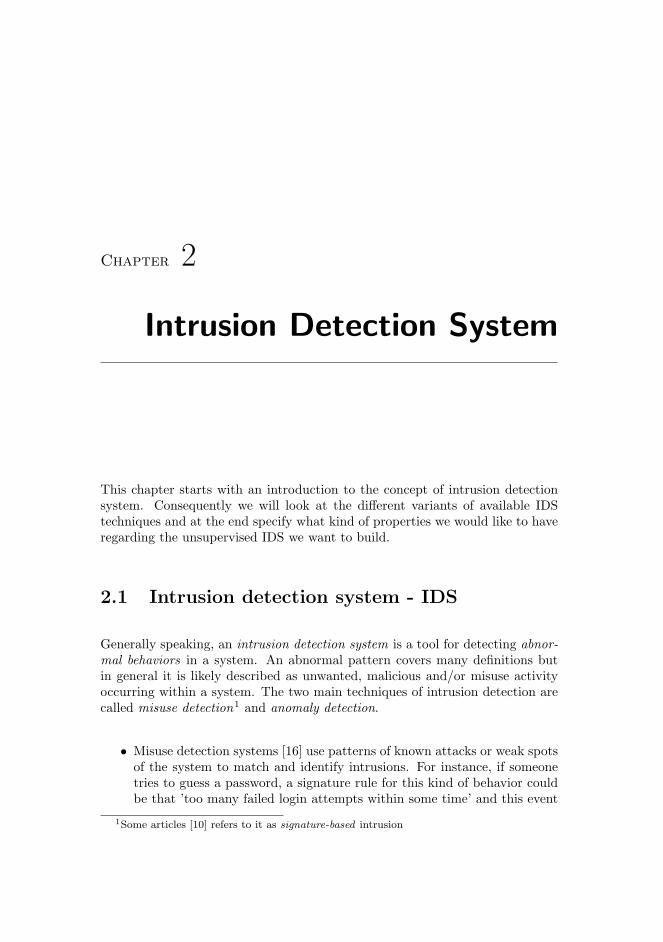
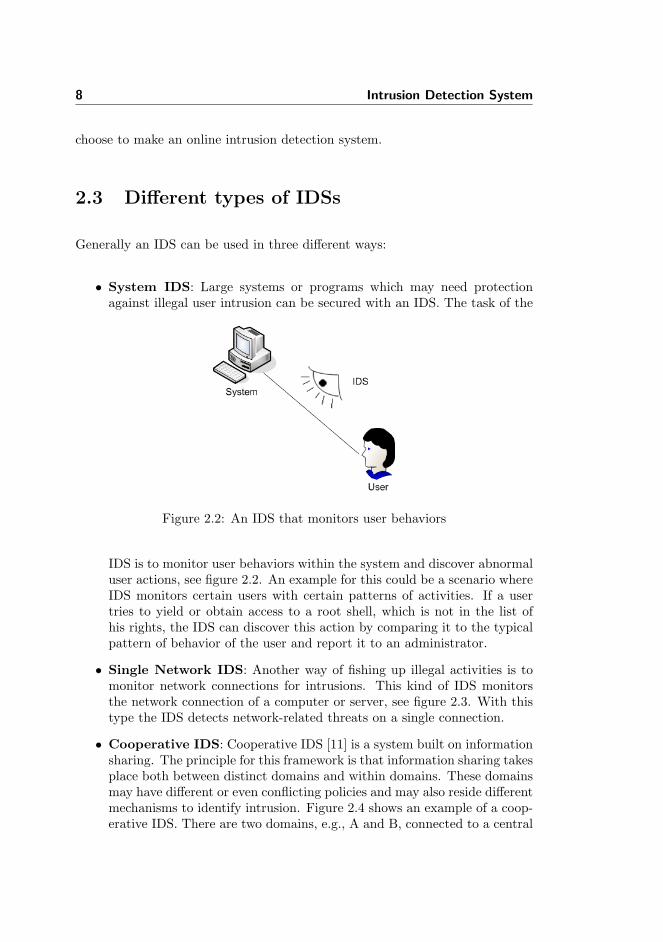
• System IDS: Large systems or programs which may need protectionagainst illegal user intrusion can be secured with an IDS. The task of the
Figure 2.2: An IDS that monitors user behaviors
IDS is to monitor user behaviors within the system and discover abnormaluser actions, see figure 2.2. An example for this could be a scenario whereIDS monitors certain users with certain patterns of activities. If a usertries to yield or obtain access to a root shell, which is not in the list ofhis rights, the IDS can discover this action by comparing it to the typicalpattern of behavior of the user and report it to an administrator.
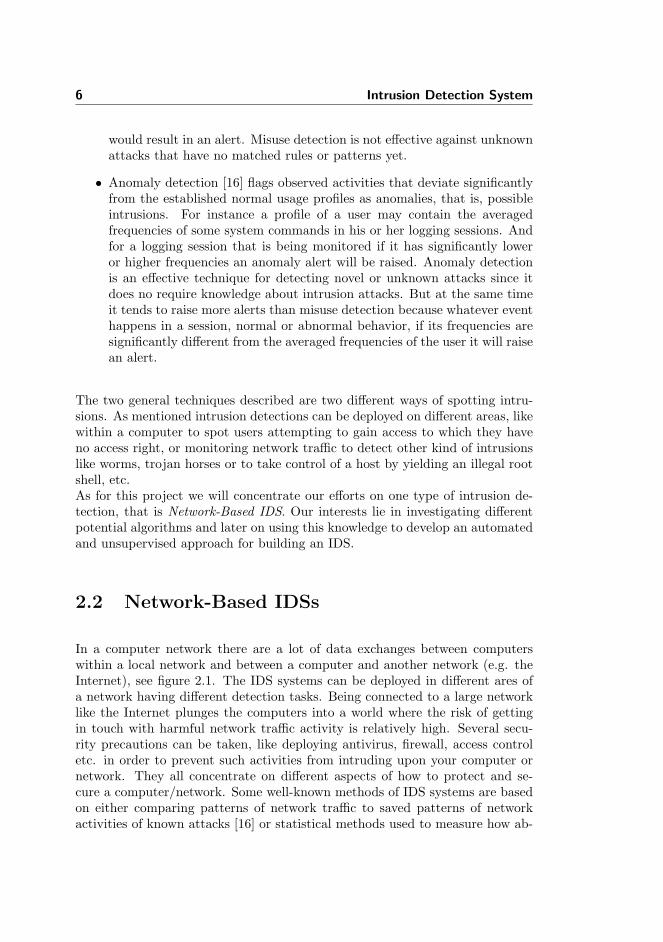
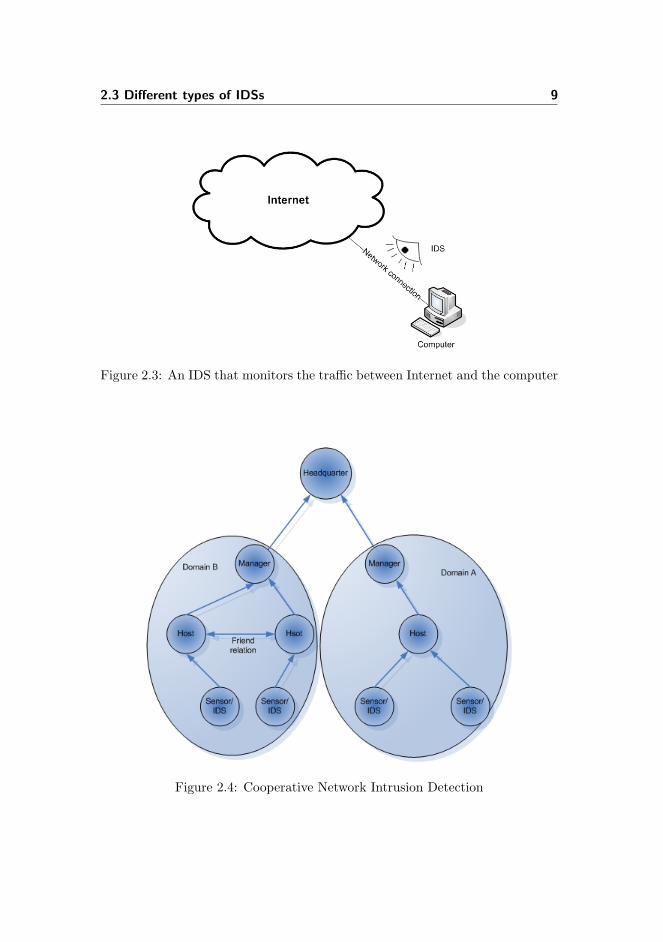
• Single Network IDS: Another way of fishing up illegal activities is tomonitor network connections for intrusions. This kind of IDS monitorsthe network connection of a computer or server, see figure 2.3. With thistype the IDS detects network-related threats on a single connection.
• Cooperative IDS: Cooperative IDS [11] is a system built on informationsharing. The principle for this framework is that information sharing takesplace both between distinct domains and within domains. These domainsmay have different or even conflicting policies and may also reside differentmechanisms to identify intrusion. Figure 2.4 shows an example of a coop-erative IDS. There are two domains, e.g., A and B, connected to a central
2.3 Different types of IDSs 9
Figure 2.3: An IDS that monitors the traffic between Internet and the computer
Figure 2.4: Cooperative Network Intrusion Detection

10 Intrusion Detection System
management system, called headquarter. Within these domains there aremanagers that receive their data from the hosts. The hosts receive theirdata from sensors/IDSs, which collect their data from outside, i.e., net-work connections. The collected data travels bottom-up but the hostsand managers do not necessarily need to receive all collected data. Thedata will be filtered according to the policies of the hosts and managers.Hosts can also send requests or information between themselves withoutcontrolling each other. This kind of connection between two hosts is calledfriend relationship.
The above listed different types of intrusion detection operate in almost thesame way. The difference lies in the tasks (the task to detect user intrusion,network-related intrusion etc.) of the IDSs. Our project is based on monitoringa single network connection. In the following section we will give an answer tothe question of where exactly we intend to use the IDS.
2.3.1 Work on unsupervised IDSs
There are many articles [13][15][22][19][17] about unsupervised IDSs and newones keep coming, as the development in this field progresses and the need fora more automated and self-administrative IDS systems grows. This need ishighly connected to the development of the various and endless attacks relatedto network connections. Due to this reality, the researches on unsupervised IDSsystems are more popular than ever and there are many suggestions on howto make the ideal and optimal IDS system primarily based on unsupervisedlearning paradigm. Unfortunately there is no general solution for this problem.In the articles [19][13] and [18]2 different solutions are presented, implementedand tested in order to prove the efficiency of the algorithms. Especially theword efficiency rise to the surface over and over again due the aim of building asolution which does not only work, but also uses the least possible expenditure ofresources (such as time, CPU power, memory, etc.) The keyword for all of themis the unsupervised learning algorithm, but apart from that their solutions arevery different. They all claim, off course, that the solution they present is veryeffective and works just the way they want it. Which leads us to the dilemma ofwhich algorithm to choose. In the chapter 4 we will introduce some algorithms,by describing them and discuss their strengths and weaknesses.
2These works have been used as inspiration for this project and are just the tip of theiceberg in this particular research field
2.3 Different types of IDSs 11
2.3.2 The ideal algorithm for IDS
The choice of an algorithm is difficult depends on many factors and most likelythere is no unique solution. Before developing an unsupervised IDS system someconsiderations must be made:
• What is needed? What is the purpose of the IDS system? What isaimed to be detected? IDS systems detect what the developer desires.Mostly the purpose is to detect intrusions like worms, hacker attacks, andother malicious code appearing in a network connection. But this is notabsolute, in fact one can set up an IDS system to detect any activity bydefining them to the system. For example you could setup the systemsuch that it can detect unnecessary traffic, which is not harmful code butjust unwanted. It is up to the developer to make these decisions and fromthere form a strategy.
• Where is it needed? In what context is the IDS system going to beapplied? Physically, where is it going to be deployed? As seen in fig-ure 2.1 the IDS systems can be deployed in many different places in agiven network. There is a big difference in monitoring a single computerconnected to the Internet and a server also connected to the internet butthat handles many requests in short a time frame. It could be difficultand time-consuming to train some relatively good algorithms with hugeamount of data. Then you are unwillingly forced to choose another learn-ing algorithm that does not have the same skills but is significantly betterand faster to train the network.
• Data preprocessing/representation. How do you represent your data?Indeed, this is a very important part of the development when using tech-niques like neural network. The different neural network models requiredifferent data preprocessing and it applies to each one of them that thereis no standard technique for doing that. Furthermore, the preprocessingalso depends on the data to be used for the network. One has to findand pinpoint features in the data set in an appropriate way and use thesefeatures to train the network with. But finding features in a data set isnot an easy task. Tt requires careful analysis and great knowledge aboutthe data set and in some cases can be hard to find.
The above listed questions are of great importance to this project and canbe considered the core of the discussions and argumentations constituting thisproject. Later on in this project we will try to find answers to these questions inorder to clarify and use them on scientific basis to build an unsupervised IDS.This project, the evaluation and implementation sections in particular, does not
12 Intrusion Detection System
aim to develop an universal solution proposal to the intrusion detection systemsusing neural network. Given the purpose and a list of criteria we set our goal tobe a development of a specific unsupervised intrusion detection system that iscapable of monitoring a network connection traffic (see following chapters) andalerting if necessary.
2.4 Summary and discussion
With this chapter we have made an introduction to the concept of IDSs. Firstlya general definition of an IDS has been elaborated and the two standard tech-niques of IDSs were presented. The misuse and anomaly detection methodswhich are considered to be two main methods of the IDS were described to-gether with their strengths and weaknesses. In relation to this project we havepointed out that the aim is to develop an intrusion detection that goes underthe anomaly detection category.We continued with the description of network-based IDS, which relates to ourproject. We learned how network-based IDSs operate and how they detect in-trusions in a network connection.Network-based IDSs come in two different types, online and offline detection.In order to detect and avoid intrusions faster it is better to construct an onlineintrusion detection and detect intrusions while they take place. It has beenpointed out how important it is to detect intrusions in real time for allowingquicker intervention.Another field that characterizes an IDS is whether it is supervised or unsuper-vised. The differences have been presented and it has been decided to buildour an IDS based on unsupervised principles. That is due to the fact that anunsupervised IDS is more automated and does not need an expert to tell whatis intrusion and what is not.Finally we have listed some basic questions about the IDS we want to imple-ment. These questions will be answered in the following chapters.No doubt, that an IDS is an important brick in our wall of safety in the In-ternet. They are capable of detecting intrusion by examining network trafficand inform us whenever there is an unusual pattern that might be an intrusion.It is the very essence of the IDS that it can be taught, and it learns and actsin a way that is based on its knowledge. The unsupervised IDS we want tobuild is another proposal to how to make IDSs more automated and with leastintervention from experts.
Chapter 3
Intrusion detection usingneural networks
This chapter will cover an introduction to neural networks by introducing adefinition and description of the network. Categorically we will dig into to theessences of neural networks, presenting the core elements like learning processesand paradigms and eventually indicating why these are important to clarifybefore making a decision on which neural network to use. It will be clarifiedwhy a neural network is a good tool for developing IDSs.
3.1 What is a neural network?
The concept of neural networks (also referred to as artificial neural networks) ishighly inspired by the recognition mechanism of the human brain. The humanbrain is a complex, nonlinear and parallel computer, whereas the digital com-puter is entirely the opposite, it is a simple, linear and serial computer. Thecapability to organize neurons to perform computation is many times fasterthan a modern digital computer in existence today. Human vision [12] is a goodexample for understanding this difference.There is no universally accepted definition of neural network, but there aresome architectural and fundamental elements that are the same for all neural
14 Intrusion detection using neural networks
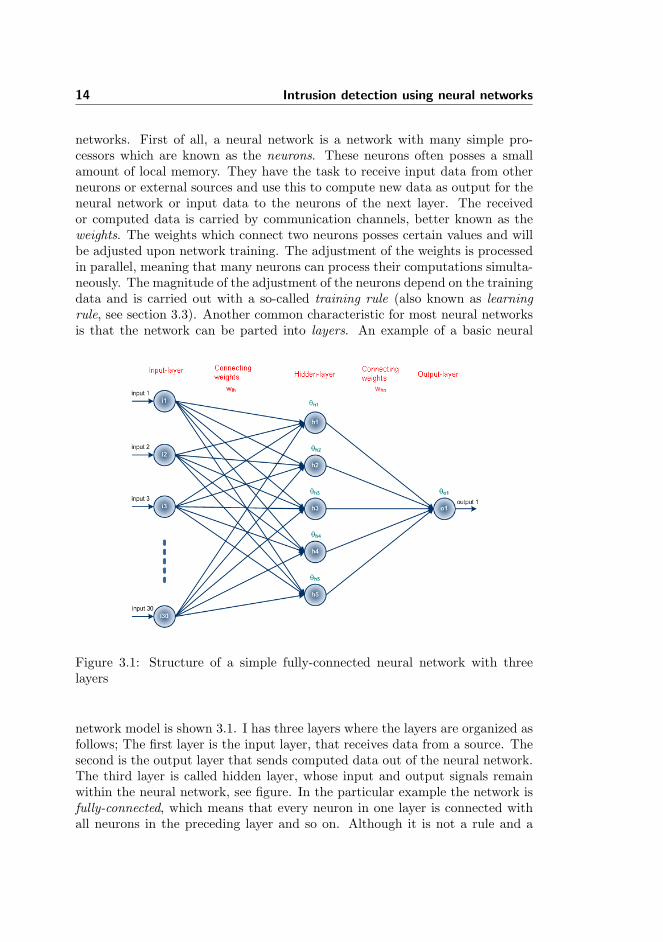
networks. First of all, a neural network is a network with many simple pro-cessors which are known as the neurons. These neurons often posses a smallamount of local memory. They have the task to receive input data from otherneurons or external sources and use this to compute new data as output for theneural network or input data to the neurons of the next layer. The receivedor computed data is carried by communication channels, better known as theweights. The weights which connect two neurons posses certain values and willbe adjusted upon network training. The adjustment of the weights is processedin parallel, meaning that many neurons can process their computations simulta-neously. The magnitude of the adjustment of the neurons depend on the trainingdata and is carried out with a so-called training rule (also known as learningrule, see section 3.3). Another common characteristic for most neural networksis that the network can be parted into layers. An example of a basic neural
Figure 3.1: Structure of a simple fully-connected neural network with threelayers
network model is shown 3.1. I has three layers where the layers are organized asfollows; The first layer is the input layer, that receives data from a source. Thesecond is the output layer that sends computed data out of the neural network.The third layer is called hidden layer, whose input and output signals remainwithin the neural network, see figure. In the particular example the network isfully-connected, which means that every neuron in one layer is connected withall neurons in the preceding layer and so on. Although it is not a rule and a
3.2 Why use neural network for IDSs? 15
neural network does not need to be fully-connected.Roughly, the overall task of a neural network is to predict or make approxi-mately correct results for a given condition. Neural networks are trained withtraining data and the elements (e.g., neurons and weights) of the network willbe adjusted on the basis of this training data. When further training does notchange the network significantly or a given criterion is fulfilled the network isready to produce results. Test data can be put into the network, be processedand the network will come up with a result.
3.2 Why use neural network for IDSs?
As described above neural networks posses unique properties, which do not onlymake them attractive but also a qualified tool. First of all, the intrusion de-tection systems operate by making results in the sense of predictions based onknown as well as unknown patterns. With the use of neural network models itis possible to comply with this process, since these models offer the option totrain a custom network and use it as some sort of a strainer for new incomingnetwork connection and thereby detect abnormal behaviors. Several neural net-work algorithms are capable of fulfilling this requirement and will be describedin chapter 4. Furthermore, when working with intrusion detections one will re-alize that the dimension of the data of a network connection is high. There aremany different protocols on different layers of the internet with different servicesand with destinations and sources and etc. A more detailed description of thenetwork connection is presented in chapter 5.The property of dimensionality reduction and data visualization in neural net-works can be very useful to reduce the many dimensions of a network connectionto 2-dimension. By doing so the features can be represented with 2-dimensionand easily visualized on a (X,Y) coordinate system. This will help to visuallydiscover connections which do not fall into the same category or group (clusters)with the trained and trusted ones.
3.3 Learning processes
Learning processes are important to the neural networks. These sets of rulesformulate how the weights of a network are to be adjusted. From a higherperspective these rules can be considered to be the mechanism that makes thenetworks learn from their environment and improve their performance accord-ingly. If networks are trained carefully, networks can exhibit some capability forgeneralization beyond the training data, for example how much is it going to
16 Intrusion detection using neural networks
rain the next year? Based on the rain behaviors for the passed 30 years a neuralnetwork, if trained with the proper learning algorithm, which is determined bythe analysis and preprocessing of the data, can produce a reasonable predictionon how much it is going to rain the next year. Another field, that is quitemore interesting and way more challenging, is the stock market. Undoubtedly,investors will be interested in knowing how the value of a stock is going to de-velop in the short and long term. Based on the former developments of the stockfor the passed years, a neural network model can be trained to predict when astock will yield the largest profit. But the stock market is a very complex fieldand it is doubtful that such a model will be invented.The definition of the learning process implies the following sequence of events:
1. The neural network is stimulated by an environment.
2. The neural network undergoes changes in its free parameters as a resultof the stimulation.
3. The network responds in a new way to the environment due to the changesthat occurred in its internal structure.[12]
There are numerous algorithms available and as one would expect there is nounique algorithm for designing a neural network model. The difference betweenthe algorithms lies in formulation of how to alter the weights of the neurons andin the relations of the neurons to their environment. In the following sectionssome of the learning processes will be described.
3.3.1 Hebbian Learning Rule
The Hebbian learning rule [12][14][9] is one of the oldest and most famous of alllearning rules and is relatively simple to be coded into a computer program. Itis described as a method for determining how to alter weights between neurons.The procedure for altering the weights is to observe two neurons, that are con-nected via the weight in particular. This weight is increased (or strengthened)if the two neurons are activated simultaneously and decreased (or weakened) ifthe neurons activate separately. In this sense, the Hebbian learning rule ensuresthat weights between neurons are adjusted in a way that represents the rela-tionship more precisely. As such, many learning rules can be considered to besomewhat Hebbian in nature.The simplest version of the Hebbian learning is described by
∆wkj = ηykxj (3.1)
3.3 Learning processes 17
where η is a positive constant that determines the rate of learning. The equa-tion 3.1 can be used in many neural networks as the update rule and as indicatedthere are many mathematical formulas to express the principal of Hebbian ruleand there are many versions.
3.3.2 Competitive Learning Rule
In neural networks with Hebbian learning output neurons can be activated si-multaneously. In competitive learning [12][14] only one single output neuroncan be activated. As the name of the learning implies the neurons undergo acompetition, where they compete among themselves to become active. In statis-tics competitive learning help discovering salient features that may be used toclassify a set of input patterns. There are some basic elements to the com-petitive learning. The weights are randomly distributed and therefore responddifferently to a given set of input patterns. There is a limitation imposed onthe strength of each neuron and a mechanism that allows neurons to competefor the right to respond to a given subset of inputs, such that only one outputneuron, or only one neuron per group, is active at a time. The winning neuronis called a winner-takes-all neuron.In order to become a winning neuron, the induced field vk of the neuron k fora specified input x must be the largest among all the neurons in the network.The output neuron yk of winning neuron k is set equal to 1 while the output ofthe neurons that lose the competition are set equal to 0. Thus we write
yk =
{1 if vk > vj for all j, j 6= k
0 otherwise(3.2)
where the induced local field vk is the combined action of all the forward andfeedback inputs to the neuron k. The update of the weights progresses as follows;let wkj denote the weight between neuron k and the input source j. Each neuronis allocated a fixed amount of weight which is distributed among the input nodes.We write ∑
j
wkj = 1 (3.3)
where all weights are positive. A neuron then learns by shifting weights from itsinactive to active input nodes. If a neuron does not respond to a given input,no learning takes place. On the other hand, if a neuron wins the competitioneach input node of that neuron gives up a proportion of its weight and thoseweights are distributed equally among the active input nodes. The update rulestating the change, ∆wkj applied to the weights can be written by
∆wkj =
{η(xj − wkj) if neuron k wins the competition0 if neuron k loses the competition
(3.4)
18 Intrusion detection using neural networks
where η is the learning-rate parameter. The overall effect of this update rule isto move the weight vector wk of winning neuron k toward the input x.
3.3.3 More learning rules
Beside the learning rules described above, there are several others, like the error-correction learning rule and the Boltzman learning rule [12]. The rules that havebeen described in this section are related to chapter 4, where several unsuper-vised neural network models will be described and analyzed. The learning rulesdescribed in this section are somehow included in those network models, forexample they appear in the model as the update rule or a part of the learningalgorithm.
3.4 Learning paradigms
In neural networks there are two different overall learning paradigms. The firstone is supervised learning, also known as learning with a teacher. The secondone is called unsupervised learning also referred to as the learning without ateacher [12][15]. This project concerns working with unsupervised models andthe reason for this will be elaborated in this section.
3.4.1 Supervised learning
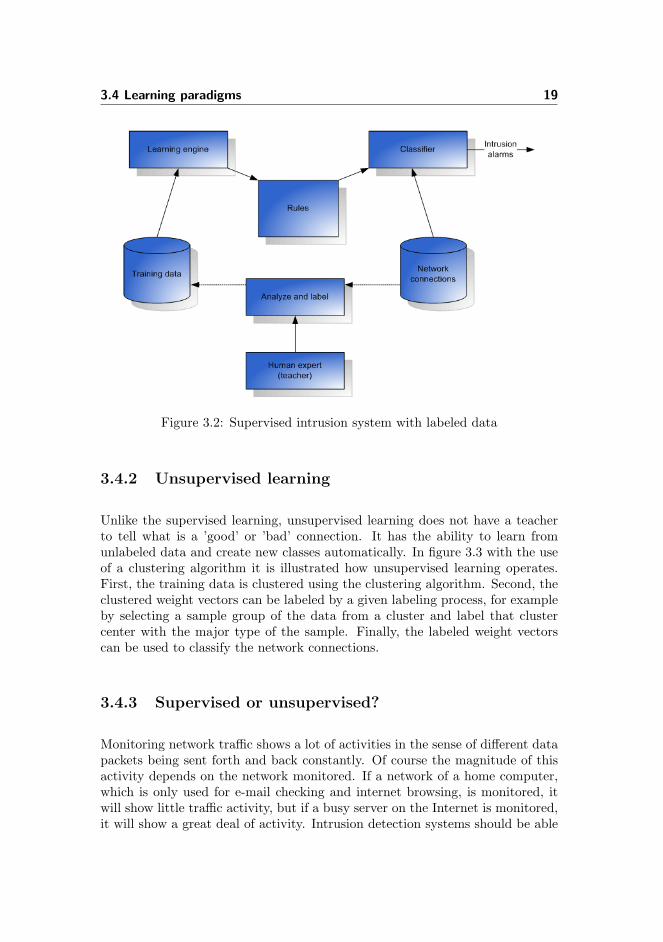
In conceptual terms the supervised learning can be seen as a teacher havingknowledge of the environment derived from input-output examples. The teacherprovide consultancy to the neural network telling it what is normal and abnormaltraffic pattern, in the sense of what is classified as malicious and non-malicious.Basically the supervised learning operates as depicted in figure 3.2.A portion of network connection is to be analyzed and labeled with the helpof the teacher. Afterwards the labeled training data is used by the learningalgorithm to generalize the rules. Finally the classifier uses the generated rulesto classify new network connections and gives alert if a connection is classifiedto be malicious.
3.4 Learning paradigms 19
Figure 3.2: Supervised intrusion system with labeled data
3.4.2 Unsupervised learning
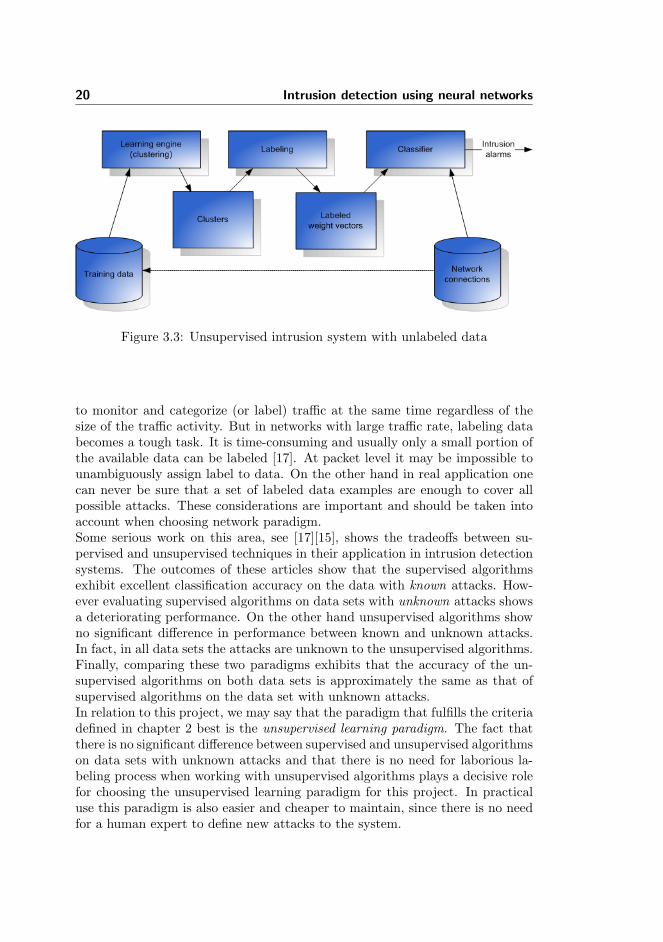
Unlike the supervised learning, unsupervised learning does not have a teacherto tell what is a ’good’ or ’bad’ connection. It has the ability to learn fromunlabeled data and create new classes automatically. In figure 3.3 with the useof a clustering algorithm it is illustrated how unsupervised learning operates.First, the training data is clustered using the clustering algorithm. Second, theclustered weight vectors can be labeled by a given labeling process, for exampleby selecting a sample group of the data from a cluster and label that clustercenter with the major type of the sample. Finally, the labeled weight vectorscan be used to classify the network connections.
3.4.3 Supervised or unsupervised?
Monitoring network traffic shows a lot of activities in the sense of different datapackets being sent forth and back constantly. Of course the magnitude of thisactivity depends on the network monitored. If a network of a home computer,which is only used for e-mail checking and internet browsing, is monitored, itwill show little traffic activity, but if a busy server on the Internet is monitored,it will show a great deal of activity. Intrusion detection systems should be able
20 Intrusion detection using neural networks
Figure 3.3: Unsupervised intrusion system with unlabeled data
to monitor and categorize (or label) traffic at the same time regardless of thesize of the traffic activity. But in networks with large traffic rate, labeling databecomes a tough task. It is time-consuming and usually only a small portion ofthe available data can be labeled [17]. At packet level it may be impossible tounambiguously assign label to data. On the other hand in real application onecan never be sure that a set of labeled data examples are enough to cover allpossible attacks. These considerations are important and should be taken intoaccount when choosing network paradigm.Some serious work on this area, see [17][15], shows the tradeoffs between su-pervised and unsupervised techniques in their application in intrusion detectionsystems. The outcomes of these articles show that the supervised algorithmsexhibit excellent classification accuracy on the data with known attacks. How-ever evaluating supervised algorithms on data sets with unknown attacks showsa deteriorating performance. On the other hand unsupervised algorithms showno significant difference in performance between known and unknown attacks.In fact, in all data sets the attacks are unknown to the unsupervised algorithms.Finally, comparing these two paradigms exhibits that the accuracy of the un-supervised algorithms on both data sets is approximately the same as that ofsupervised algorithms on the data set with unknown attacks.In relation to this project, we may say that the paradigm that fulfills the criteriadefined in chapter 2 best is the unsupervised learning paradigm. The fact thatthere is no significant difference between supervised and unsupervised algorithmson data sets with unknown attacks and that there is no need for laborious la-beling process when working with unsupervised algorithms plays a decisive rolefor choosing the unsupervised learning paradigm for this project. In practicaluse this paradigm is also easier and cheaper to maintain, since there is no needfor a human expert to define new attacks to the system.

3.5 Summary and discussion 21
3.5 Summary and discussion
In this chapter we have introduced the very basics of the the neural networks.It has been briefly pointed out what a neural network consists of and what itis capable of. Some examples of how and where the neural network principleis used have been listed in order to show the practical use of it and whichfields have benefit of this unique technique. In relation to this we have laiddown the foundations for some of the different learning processes, which are themost important part of a neural network. Under this section we have describedand discussed 3 learning processes which are basic for the design of the neuralnetwork. There are of course other learning processes, which are omitted herebut are available in [12]. The reason for doing that is simply because they donot form a potential design decision for the implementation of the intrusiondetection system. That is mostly because they are not used in unsupervisedmodels.One of the most important mark of this project is the network paradigm used tosolve the main problem. After an introduction of the 2 different paradigms, wehave discussed and argued why we found the unsupervised network paradigmto be more suitable for this project.We complete this discussion with some concluding remarks on the worth of theneural network. The unusual properties of the network, e.g. being almost thecomplete opposite of a serial computer paradigm, opens up new opportunitiesin the sense of solving tough tasks containing major amount of data. Thereforeneural network models are widely used in different both scientific, commercialand military fields and the development does not seem to end here. In the futurewith the development of new algorithms and improvements we will see more useof neural networks in different areas of our life.

22 Intrusion detection using neural networks
Chapter 4
Neural Network Algorithms
In this chapter the different algorithms in neural networks that are suitable forIDS systems (only the unsupervised ones) and may be a potential candidatefor later evaluation and implementation will be described. For every describedalgorithm there will be a simple example, showing how the algorithm operates.As an ending section for this chapter it will be discussed and pointed out, whichalgorithm is most qualified in the sense of building a unsupervised learningsystem with the given criteria.
4.1 Cluster Detection - CD
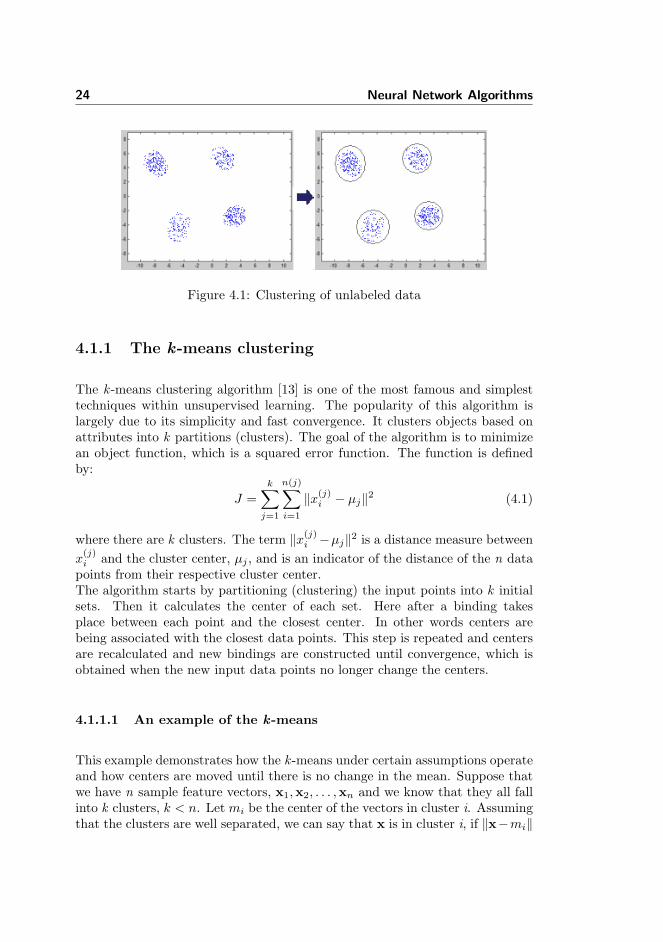
Clustering is an unsupervised learning technique which aim is to find structurein a collection of unlabeled data. It is being used in many fields such as datamining, knowledge discovery, pattern recognition and classification [13] and etc.The concept of clustering algorithms is to build a finite number of clusters,each one with its own center, according to a given data set, where each clusterrepresent a group of similiar1 objects. In figure 4.1 4 clusters can be observed,due to the way data is spread. Each cluster encapsulates a set of data and herethe similarities of the surrounded data is their distance to the cluster center.
1similar in the sense of position, distance, size, structure etc.
24 Neural Network Algorithms
Figure 4.1: Clustering of unlabeled data
4.1.1 The k-means clustering
The k -means clustering algorithm [13] is one of the most famous and simplesttechniques within unsupervised learning. The popularity of this algorithm islargely due to its simplicity and fast convergence. It clusters objects based onattributes into k partitions (clusters). The goal of the algorithm is to minimizean object function, which is a squared error function. The function is definedby:
J =k∑
j=1
n(j)∑i=1
‖x(j)i − µj‖2 (4.1)
where there are k clusters. The term ‖x(j)i −µj‖2 is a distance measure between
x(j)i and the cluster center, µj , and is an indicator of the distance of the n data
points from their respective cluster center.The algorithm starts by partitioning (clustering) the input points into k initialsets. Then it calculates the center of each set. Here after a binding takesplace between each point and the closest center. In other words centers arebeing associated with the closest data points. This step is repeated and centersare recalculated and new bindings are constructed until convergence, which isobtained when the new input data points no longer change the centers.
4.1.1.1 An example of the k-means
This example demonstrates how the k -means under certain assumptions operateand how centers are moved until there is no change in the mean. Suppose thatwe have n sample feature vectors, x1,x2, . . . ,xn and we know that they all fallinto k clusters, k < n. Let mi be the center of the vectors in cluster i. Assumingthat the clusters are well separated, we can say that x is in cluster i, if ‖x−mi‖
4.1 Cluster Detection - CD 25
is the minimum of all k distances. The procedure for finding k-means is asfollows:
• Make initial values for the centers m1,m2, . . . ,mk
• Repeat until there is no change in any center
– Use the estimated centers to classify the samples into clusters
– For i from 1 to k
∗ Replace mi with the center of all of the samples for cluster i
– End for
• End repeat
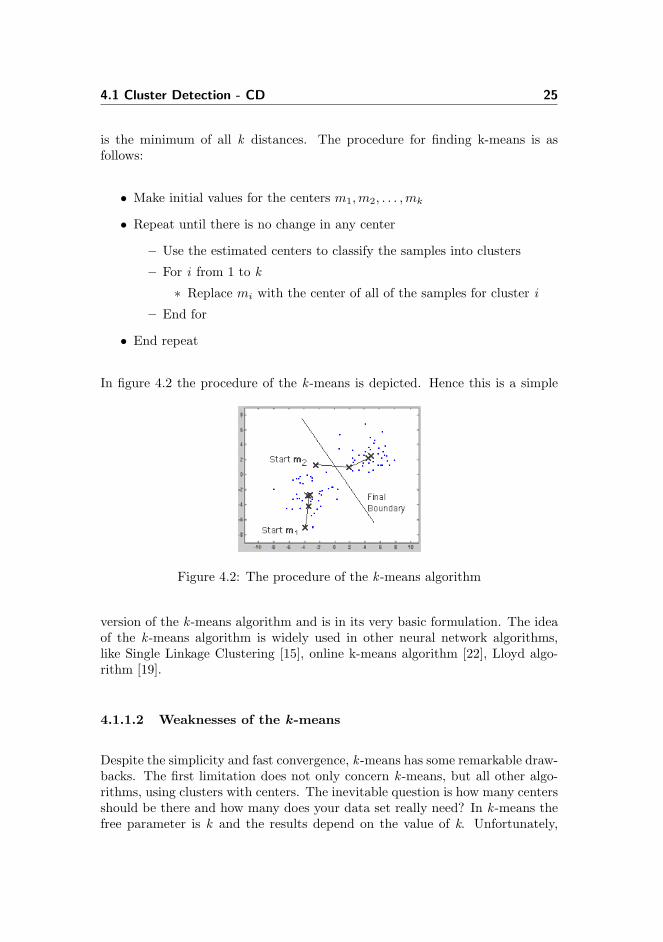
In figure 4.2 the procedure of the k -means is depicted. Hence this is a simple
Figure 4.2: The procedure of the k -means algorithm
version of the k -means algorithm and is in its very basic formulation. The ideaof the k -means algorithm is widely used in other neural network algorithms,like Single Linkage Clustering [15], online k-means algorithm [22], Lloyd algo-rithm [19].
4.1.1.2 Weaknesses of the k-means
Despite the simplicity and fast convergence, k -means has some remarkable draw-backs. The first limitation does not only concern k -means, but all other algo-rithms, using clusters with centers. The inevitable question is how many centersshould be there and how many does your data set really need? In k -means thefree parameter is k and the results depend on the value of k. Unfortunately,
26 Neural Network Algorithms
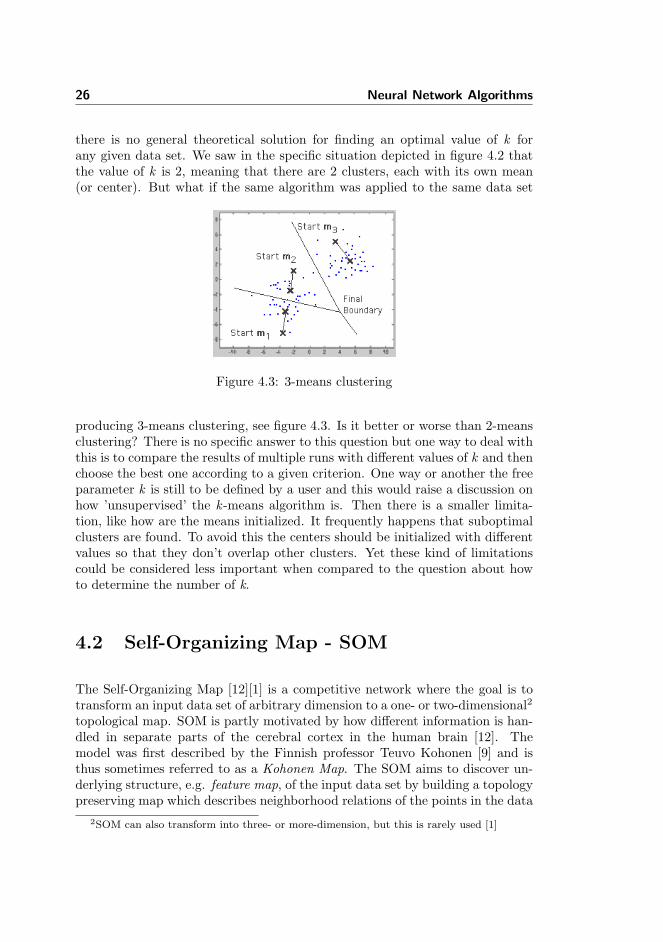
there is no general theoretical solution for finding an optimal value of k forany given data set. We saw in the specific situation depicted in figure 4.2 thatthe value of k is 2, meaning that there are 2 clusters, each with its own mean(or center). But what if the same algorithm was applied to the same data set
Figure 4.3: 3-means clustering
producing 3-means clustering, see figure 4.3. Is it better or worse than 2-meansclustering? There is no specific answer to this question but one way to deal withthis is to compare the results of multiple runs with different values of k and thenchoose the best one according to a given criterion. One way or another the freeparameter k is still to be defined by a user and this would raise a discussion onhow ’unsupervised’ the k -means algorithm is. Then there is a smaller limita-tion, like how are the means initialized. It frequently happens that suboptimalclusters are found. To avoid this the centers should be initialized with differentvalues so that they don’t overlap other clusters. Yet these kind of limitationscould be considered less important when compared to the question about howto determine the number of k.
4.2 Self-Organizing Map - SOM
The Self-Organizing Map [12][1] is a competitive network where the goal is totransform an input data set of arbitrary dimension to a one- or two-dimensional2
topological map. SOM is partly motivated by how different information is han-dled in separate parts of the cerebral cortex in the human brain [12]. Themodel was first described by the Finnish professor Teuvo Kohonen [9] and isthus sometimes referred to as a Kohonen Map. The SOM aims to discover un-derlying structure, e.g. feature map, of the input data set by building a topologypreserving map which describes neighborhood relations of the points in the data
2SOM can also transform into three- or more-dimension, but this is rarely used [1]
4.2 Self-Organizing Map - SOM 27
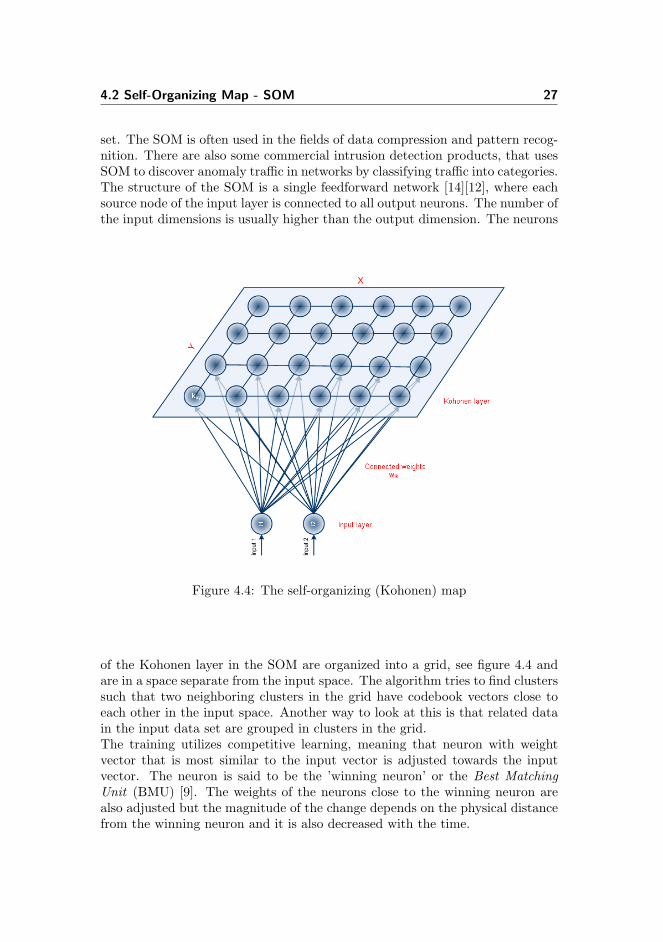
set. The SOM is often used in the fields of data compression and pattern recog-nition. There are also some commercial intrusion detection products, that usesSOM to discover anomaly traffic in networks by classifying traffic into categories.The structure of the SOM is a single feedforward network [14][12], where eachsource node of the input layer is connected to all output neurons. The number ofthe input dimensions is usually higher than the output dimension. The neurons
Figure 4.4: The self-organizing (Kohonen) map
of the Kohonen layer in the SOM are organized into a grid, see figure 4.4 andare in a space separate from the input space. The algorithm tries to find clusterssuch that two neighboring clusters in the grid have codebook vectors close toeach other in the input space. Another way to look at this is that related datain the input data set are grouped in clusters in the grid.The training utilizes competitive learning, meaning that neuron with weightvector that is most similar to the input vector is adjusted towards the inputvector. The neuron is said to be the ’winning neuron’ or the Best MatchingUnit (BMU) [9]. The weights of the neurons close to the winning neuron arealso adjusted but the magnitude of the change depends on the physical distancefrom the winning neuron and it is also decreased with the time.
28 Neural Network Algorithms
4.2.1 The learning algorithm of the SOM
There are some basic steps involved in the application of the SOM algorithm.Firstly the weights of the network should be initialized. This can be done byassigning them small values picked from a random number generator; in doingso, no prior order is imposed on the feature of map. The only restriction is thatthe weight vector, wj(0) should be different for j = 1, 2, . . . , l, where l is thenumber of neurons in the lattice. An alternative way of initializing the weightvector is to select from the available set of input vectors in a random manner.The key point is to keep the magnitude of the weights small, because the initialweights already give good approximation of the SOM weights. Next step is thesimilarity matching. With the use of the Euclidean minimum-distance criterion,the distance from the training data set to all weight vectors are computed andbased on these computations the BMU is found. The Euclidean formula is givenby
i(x) = arg minj‖x(n)−wj‖, j = 1, 2, . . . , l (4.2)
where i(x) identifies the best matching neuron to the input vector x. In wordsthis formula finds the weight vector most similar to the input vector, x. Thisprocess sums up the essence of the competition among the neurons. In thesense of network topology there is a mapping process involved with this compe-tition; A continuous input space of activation patterns is mapped onto a discreteoutput space of neurons by a process of competition among the neurons of thenetwork [12].After having found the winning neuron the next step of the learning process isthe updating. The weight vector of the winning neuron and the neurons closeto it in the SOM lattice are adjusted towards the input vector. The updateformula for the neuron j at time (i.e., number of iteration) n with weight vectorwj(n) is
wj(n + 1) = wj(n) + η(n)hj,i(x)(n)(x−wj(n)) (4.3)
where η(n) is the learning-rate parameter and hj,i(x)(n) is the time-varyingneighborhood function centered around the winning neuron i(x). A typicalchoice of hj,i(x) is the Gaussian function [17][12], which is given by the formula
hj,i(x)(n) = exp
(−
d2j,i
2σ2(n)
)(4.4)
where σ(n) is a width function and dj,i represents the distance between thewinning neuron i and its neighbor neuron j.The whole process is repeated for each input vector over and over for a numberof cycles until no noticeable changes in the feature map are observed or a certainnumber of epochs is reached.

4.2 Self-Organizing Map - SOM 29
Input vector (1,-1) (1,-1) (1,-1)Weight vector (2.2, -1.3) (-0.6, 1.9) (3.1, -2.7)Distance (1.237) (2.927) (2.749)
Table 4.1: Calculation of distances between input and weight vector
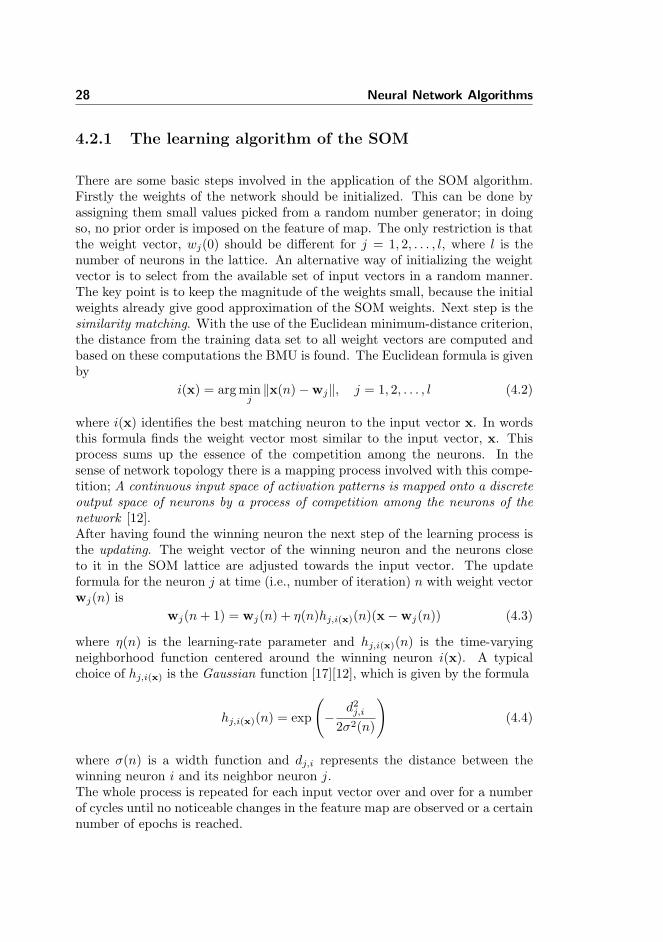
4.2.2 An example of the SOM
In this section we will present a simple example of how SOM operates.Assume that we have a network with two input neurons (neuron 1 and 2) anda Kohonen layer with 4 rows and 4 columns. Two input neurons and 4x4=16neurons in the Kohonen layer gives 32 connecting weights in the network. Theweights connecting the input and Kohonen layer neurons will be initialized torandom numbers. Let weights have initial values that lies in the interval [−π, π].There are two main processes during the training. Firstly, the distance betweenthe input vector and the weight vectors will be calculated in order to find awinning neuron. Off course, the winning neuron will be the one with the shortestdistance to the input vector. We use the Euclidean minimum-distance formula(formula 4.2) and get the results shown in table 4.1. To have an idea of how thecalculations are carried out and avoid messy calculations we use three weightsvectors with random values. The distance is calculated by
distance =√
(1− 2.2)2 + (−1− (−1.3))2 = 1.237
which is the distance between input vector (1,-1) and weight vector (2.2,-1.3).In table 4.1 we see that the weight vector with the shortest distance to theinput vector is the first one, which makes the neuron 1 in the Kohonen layerthe winning neuron. In figure 4.5 we can see how the values are located in thenetwork.Secondly, the weights are to be updated. For that we use formula 4.3 and belowis an example of how it is calculated. Updating weights of neuron 2 in theKohonen layer (neuron 2 has the position (1,2) in the Kohonen layer). Thewinning neuron has the position (1,1)
d =√
(1− 1)2 + (1− 2)2 = 1
h = exp(− 12
2 ∗ 0.22
)= 3.73 ∗ 10−6
w1,2 = −0.6 + 0.5 ∗ 3.73 ∗ 10−6 ∗ (1 + 0.6) = −0, 599997019
where w1,2 is the weight going from input neuron one to neuron 2 in the Kohonenlayer.
30 Neural Network Algorithms
Figure 4.5: Self-organizing map with calculated values
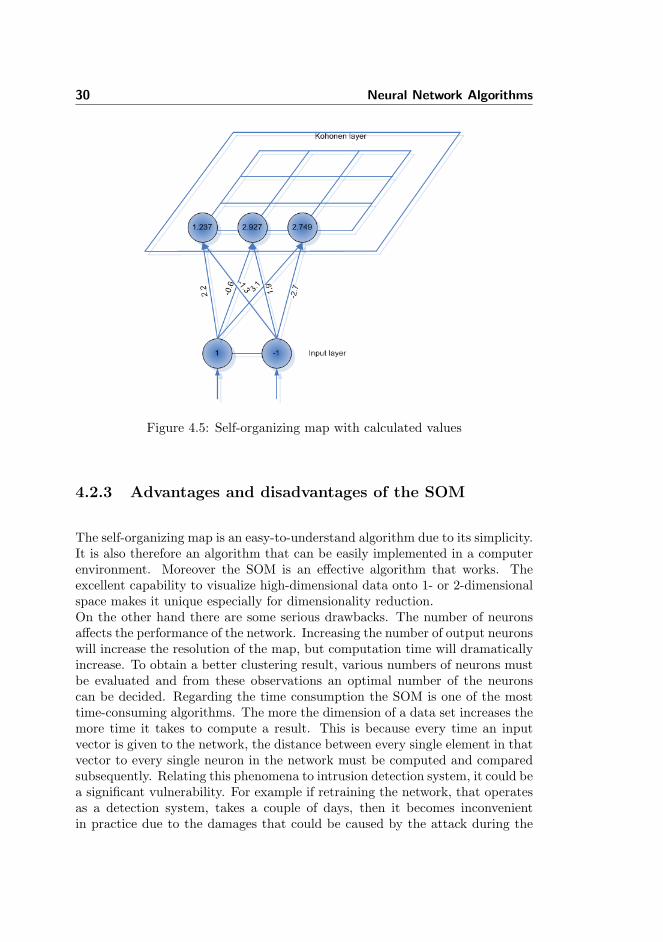
4.2.3 Advantages and disadvantages of the SOM
The self-organizing map is an easy-to-understand algorithm due to its simplicity.It is also therefore an algorithm that can be easily implemented in a computerenvironment. Moreover the SOM is an effective algorithm that works. Theexcellent capability to visualize high-dimensional data onto 1- or 2-dimensionalspace makes it unique especially for dimensionality reduction.On the other hand there are some serious drawbacks. The number of neuronsaffects the performance of the network. Increasing the number of output neuronswill increase the resolution of the map, but computation time will dramaticallyincrease. To obtain a better clustering result, various numbers of neurons mustbe evaluated and from these observations an optimal number of the neuronscan be decided. Regarding the time consumption the SOM is one of the mosttime-consuming algorithms. The more the dimension of a data set increases themore time it takes to compute a result. This is because every time an inputvector is given to the network, the distance between every single element in thatvector to every single neuron in the network must be computed and comparedsubsequently. Relating this phenomena to intrusion detection system, it could bea significant vulnerability. For example if retraining the network, that operatesas a detection system, takes a couple of days, then it becomes inconvenientin practice due to the damages that could be caused by the attack during the
4.3 Principal Component Analysis - PCA 31
retraining of the network. However the question about how big the dimensionof the data should be, must be answered and with proper data analysis andpreprocessing this problem can be avoided to some degree.
4.3 Principal Component Analysis - PCA
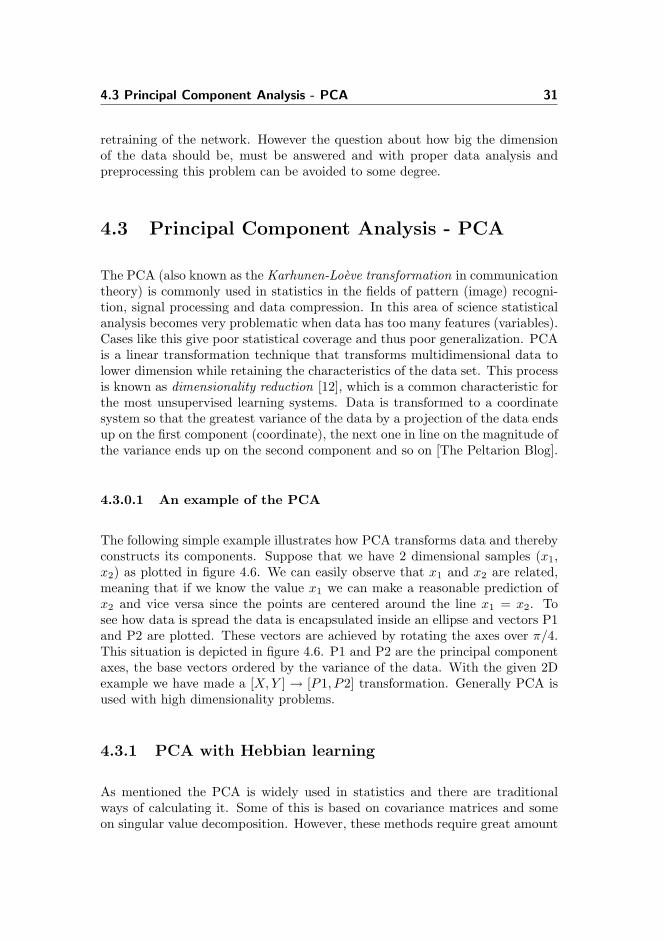
The PCA (also known as the Karhunen-Loeve transformation in communicationtheory) is commonly used in statistics in the fields of pattern (image) recogni-tion, signal processing and data compression. In this area of science statisticalanalysis becomes very problematic when data has too many features (variables).Cases like this give poor statistical coverage and thus poor generalization. PCAis a linear transformation technique that transforms multidimensional data tolower dimension while retaining the characteristics of the data set. This processis known as dimensionality reduction [12], which is a common characteristic forthe most unsupervised learning systems. Data is transformed to a coordinatesystem so that the greatest variance of the data by a projection of the data endsup on the first component (coordinate), the next one in line on the magnitude ofthe variance ends up on the second component and so on [The Peltarion Blog].
4.3.0.1 An example of the PCA
The following simple example illustrates how PCA transforms data and therebyconstructs its components. Suppose that we have 2 dimensional samples (x1,x2) as plotted in figure 4.6. We can easily observe that x1 and x2 are related,meaning that if we know the value x1 we can make a reasonable prediction ofx2 and vice versa since the points are centered around the line x1 = x2. Tosee how data is spread the data is encapsulated inside an ellipse and vectors P1and P2 are plotted. These vectors are achieved by rotating the axes over π/4.This situation is depicted in figure 4.6. P1 and P2 are the principal componentaxes, the base vectors ordered by the variance of the data. With the given 2Dexample we have made a [X, Y ] → [P1, P2] transformation. Generally PCA isused with high dimensionality problems.
4.3.1 PCA with Hebbian learning
As mentioned the PCA is widely used in statistics and there are traditionalways of calculating it. Some of this is based on covariance matrices and someon singular value decomposition. However, these methods require great amount
32 Neural Network Algorithms
Figure 4.6: Data encapsulated and components produced with PCA
of processing power and memory and are useless for larger data sets [12]. UsingHebbian Learning (see section 3.3.1) with the right choice of update rules is agood alternative for calculation. Hebbian in its basic form has the followingupdate rule:
wi(n + 1) = wi(n) + ηy(n)xi(n) i = 1, 2, . . . ,m (4.5)
where n denotes discrete time and η is the learning-rate parameter. The regularHebbian rule would make the weights grow uninhibitedly, which is unacceptableon physical ground [14] and will give unreasonable values. To solve this, ErkkiOja introduced what is called Oja’s rule that normalizes the weights so that theydon’t diverge. The normalized update rule will look like (the proof is omittedhere but can be found in [14][12]):
wi(n + 1) = wi(n) + ηy(n)[xi(n)− y(n)wi(n)] (4.6)
which is also know as the ’Oja learning rule’. This learning rule modifies theweight in the usual Hebbian sense since the first product term is the Hebbianrule, y(n)xi(n). The second negative term, −y(n)wi(n) is responsible for stabi-lization (normalization) of the weight vector.
4.3.2 Limitations of the PCA
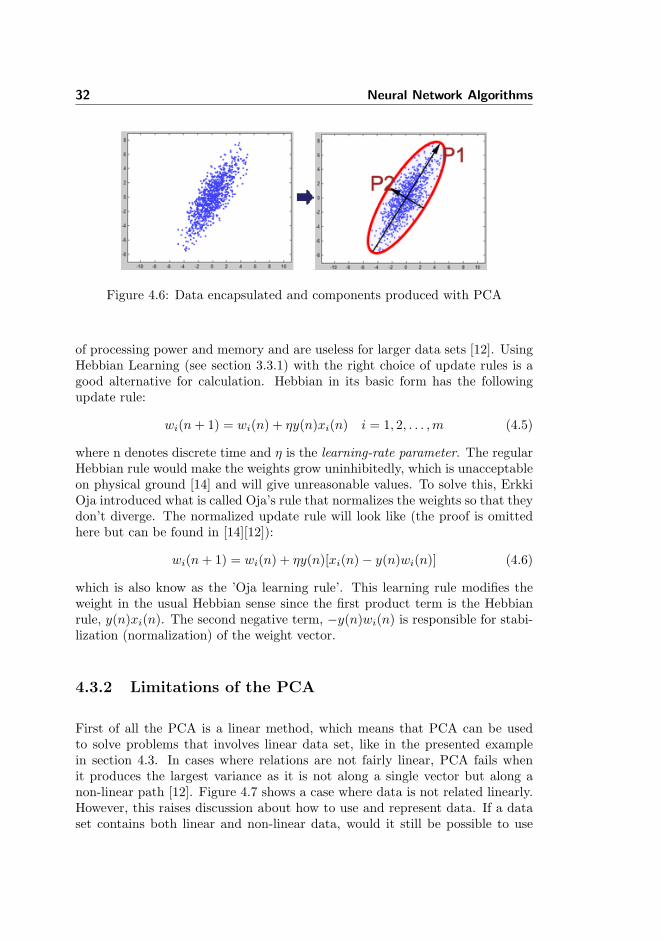
First of all the PCA is a linear method, which means that PCA can be usedto solve problems that involves linear data set, like in the presented examplein section 4.3. In cases where relations are not fairly linear, PCA fails whenit produces the largest variance as it is not along a single vector but along anon-linear path [12]. Figure 4.7 shows a case where data is not related linearly.However, this raises discussion about how to use and represent data. If a dataset contains both linear and non-linear data, would it still be possible to use
4.4 An Intrusion detection system with SOM 33
Figure 4.7: Non-linear data set.
PCA? The answer lies in the distribution and amount of linear and non-lineardata in the data set. If the amount of non-linear data is insignificant it is likelyto be omitted and linear data can be used to build a unsupervised network with.Depending on the analysis of dataset to be used, PCA can be suitable for datasets involving non-linear data.
4.4 An Intrusion detection system with SOM
So far we have gained insight in the various models of the unsupervised learningalgorithms. Furthermore in relation to the intrusion detection systems we havepointed out the advantages and disadvantages of the algorithms in question.Based on these considerations we can now point out an algorithm for evaluationand implementation. This choice is also inspired by the works and tests in thearticles of [15][22][18][17]. The Self-Organizing Map is chosen to be used as thelearning algorithm for the desired IDS. The choice is made according to thefollowing statements
Simple and easy-to-understand algorithm that works. We have analyzedthe good and bad sides of this algorithm and came to realize that it is ca-pable of dealing with large problems that require reckoning and comparingwithout any complexity. As for the IDS that we want to construct, weneed an algorithm that can manage to transform a high dimensional datasets into a 2-dimensional data set. The simplicity of the self-organizingmap makes it easy to implement and manage.
Topological clustering. The self-organizing map has the ability to constructa topological result. This feature will be useful during the training and
34 Neural Network Algorithms
test phase of the IDS in order to observe the validity of the result from thealgorithm and follow up on the clustering process to check whether samepatterns (e.i. features in this case) fall into the same cluster.
Unsupervised algorithm that works with nonlinear data set. As the traf-fic from a network connection can be a huge amount and is most likelyrepresenting nonlinear data, we will need an algorithm which is opera-tional regardless of the amount and the linearity of the data sets. Theself-organizing map has the ability to handle such data set. Another no-ticeable character of this algorithm is that it is unsupervised, which makesit capable of detecting intrusions without being introduced to it.
So, do these statements exclude the choice of another algorithm? The an-swer is no, because the other algorithms with certain conditions can also workas the learning algorithm for intrusion detection. Our choice is based on thespecifications and requirements for our IDS and therefore we decide to use theself-organizing map due to its properties listed in the statements from above.We can not tell for sure that the self-organizing map is the best choice. Theonly way of finding out its quality is to compare it with the other unsupervisedmodels covered in this chapter. A reliable way is to evaluate and implement somany models as possible, and then compare them on the efficiency. But sincewe are going to implement only one algorithm, we have tried to build our choicearound the properties and some of the articles listed in the beginning of thissection.
4.5 Summary and discussion
We have in this chapter described and analyzed some examples of unsupervisedlearning algorithms, that can be used to construct an intrusion detection systemwith. The algorithms in question are chosen due to the fact that they are themost known and widely-used ones when it comes to intrusion detection. Firstlywe have introduced the cluster detection, which is an overall model that involvesseveral techniques using the idea of clustering data. As an example to thismodel, the k -means was presented, which is a simple and popular algorithm inneural networks. In practical, using k -means in its simple and basic form isnot a convenient technique, therefore there are lot of enhancement possibilities,some of them can be found in the bibliography. Then we moved to the nextalgorithm, the self-organizing map, which aims to discover features within agiven data set and builds up its clusters accordingly. The principle behind SOMis easy to understand and consequently easy to implement. The challenge lies inthe process of data preprocessing, where a proper way of representing data must
4.5 Summary and discussion 35
be formulated. Finally, we have described the Principal Component Analysisalgorithm, which differs from the clustering algorithms. Here, the goal is notto cluster data on the basis of their similarities in the data set but to buildcomponents in order to represent data. We also saw that the PCA is a goodforerunner for linear data sets, but when it comes to non-linear data sets it runsinto problems and it becomes difficult to represent data.There are many other neural network algorithms which operates best in theirown field. The algorithms in this chapter are some of the good alternatives tosolve a problem of intrusion detection kind. Especially, the self organizing map,which looks for features in a given data set, can be useful since most intrusiondetection systems operate by recognizing and comparing patterns (i.e., features).In the next chapter we will investigate network traffic and aim to find featuresthat come with network connections.

36 Neural Network Algorithms
Chapter 5
Network connections andfeatures
In this chapter we will look into the structure of a network connection. Adescription of the content of IP packets (such as protocols, services etc.) andwhat kind of features the connection holds will be presented. Based on theseobservations we will work out a strategy for representing these features and usethem for the neural network chosen in the previous chapter. In order to do allthis a socalled ’sniffer’ will be needed. As the name implies, a sniffer is usedto sniff network traffic in a given environment. In this chapter we will look forways of sniffing network traffic and form a solution for how to use such snifferand how to process the outcomes of it.
5.1 Protocols in the Internet
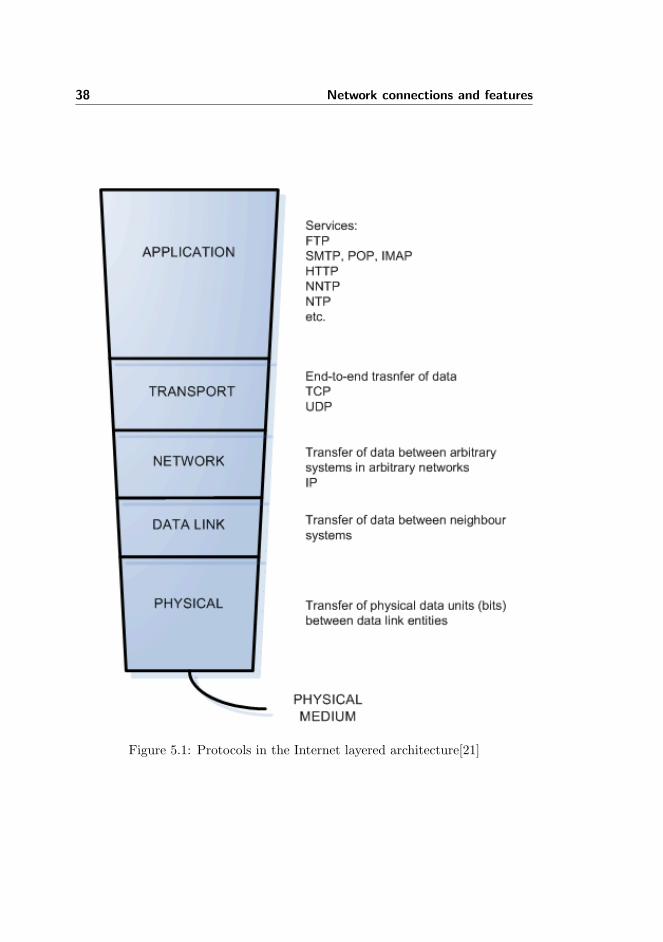
Communicating with the Internet happens by using different protocols. VariousInternet protocols are used in communication on the different levels of the In-ternet layered architecture, see figure 5.1. The protocols shown are the mostcommon ones implemented in each layer. A packet (i.e., IP packet, see fig-ure 5.2) travels top-down at the sender’s end. For example, a data packet (e.g.a http packet [21]) gets encapsulated in a TCP packet which then gets encapsu-
38 Network connections and features
Figure 5.1: Protocols in the Internet layered architecture[21]
5.1 Protocols in the Internet 39
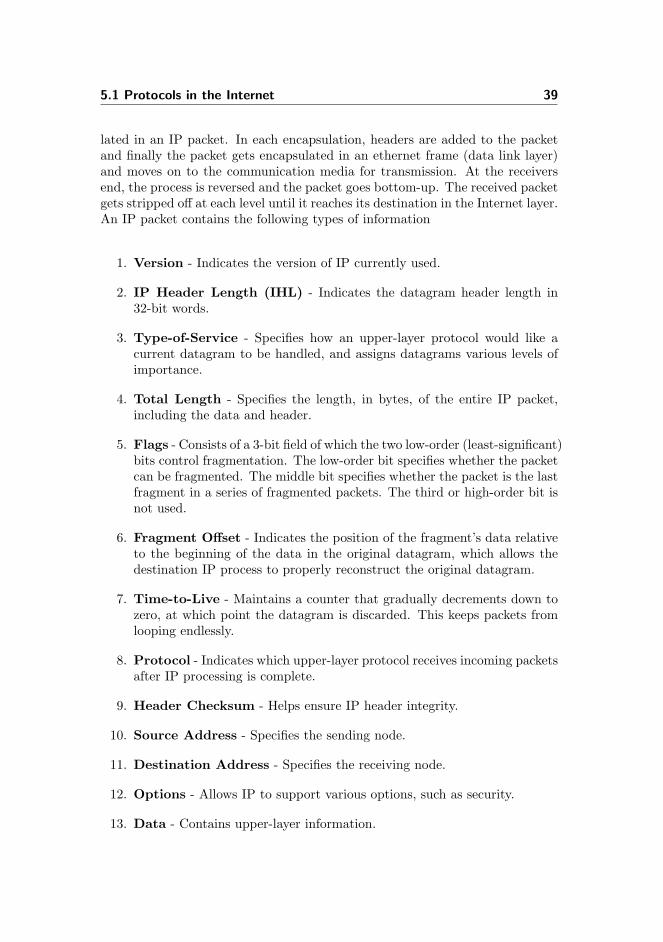
lated in an IP packet. In each encapsulation, headers are added to the packetand finally the packet gets encapsulated in an ethernet frame (data link layer)and moves on to the communication media for transmission. At the receiversend, the process is reversed and the packet goes bottom-up. The received packetgets stripped off at each level until it reaches its destination in the Internet layer.An IP packet contains the following types of information
1. Version - Indicates the version of IP currently used.
2. IP Header Length (IHL) - Indicates the datagram header length in32-bit words.
3. Type-of-Service - Specifies how an upper-layer protocol would like acurrent datagram to be handled, and assigns datagrams various levels ofimportance.
4. Total Length - Specifies the length, in bytes, of the entire IP packet,including the data and header.
5. Flags - Consists of a 3-bit field of which the two low-order (least-significant)bits control fragmentation. The low-order bit specifies whether the packetcan be fragmented. The middle bit specifies whether the packet is the lastfragment in a series of fragmented packets. The third or high-order bit isnot used.
6. Fragment Offset - Indicates the position of the fragment’s data relativeto the beginning of the data in the original datagram, which allows thedestination IP process to properly reconstruct the original datagram.
7. Time-to-Live - Maintains a counter that gradually decrements down tozero, at which point the datagram is discarded. This keeps packets fromlooping endlessly.
8. Protocol - Indicates which upper-layer protocol receives incoming packetsafter IP processing is complete.
9. Header Checksum - Helps ensure IP header integrity.
10. Source Address - Specifies the sending node.
11. Destination Address - Specifies the receiving node.
12. Options - Allows IP to support various options, such as security.
13. Data - Contains upper-layer information.
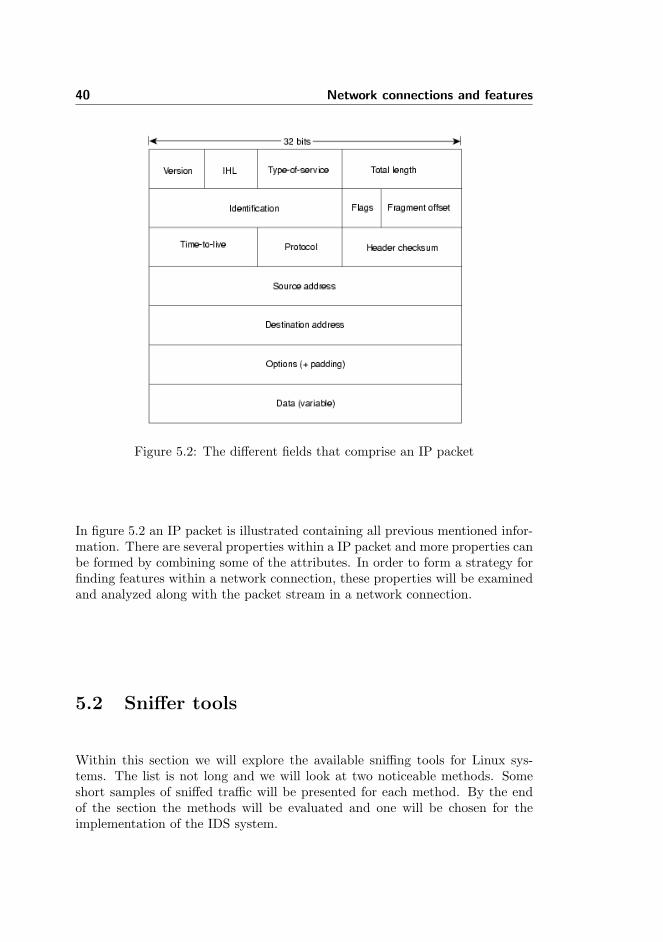
40 Network connections and features
Figure 5.2: The different fields that comprise an IP packet
In figure 5.2 an IP packet is illustrated containing all previous mentioned infor-mation. There are several properties within a IP packet and more properties canbe formed by combining some of the attributes. In order to form a strategy forfinding features within a network connection, these properties will be examinedand analyzed along with the packet stream in a network connection.
5.2 Sniffer tools
Within this section we will explore the available sniffing tools for Linux sys-tems. The list is not long and we will look at two noticeable methods. Someshort samples of sniffed traffic will be presented for each method. By the endof the section the methods will be evaluated and one will be chosen for theimplementation of the IDS system.
5.2 Sniffer tools 41
5.2.1 TCPDump
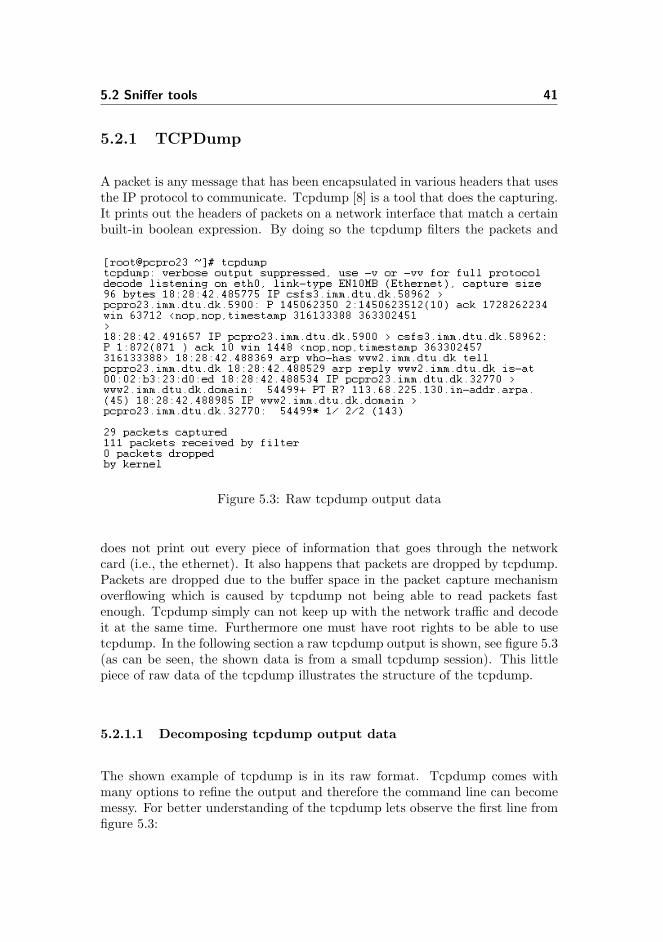
A packet is any message that has been encapsulated in various headers that usesthe IP protocol to communicate. Tcpdump [8] is a tool that does the capturing.It prints out the headers of packets on a network interface that match a certainbuilt-in boolean expression. By doing so the tcpdump filters the packets and
Figure 5.3: Raw tcpdump output data
does not print out every piece of information that goes through the networkcard (i.e., the ethernet). It also happens that packets are dropped by tcpdump.Packets are dropped due to the buffer space in the packet capture mechanismoverflowing which is caused by tcpdump not being able to read packets fastenough. Tcpdump simply can not keep up with the network traffic and decodeit at the same time. Furthermore one must have root rights to be able to usetcpdump. In the following section a raw tcpdump output is shown, see figure 5.3(as can be seen, the shown data is from a small tcpdump session). This littlepiece of raw data of the tcpdump illustrates the structure of the tcpdump.
5.2.1.1 Decomposing tcpdump output data
The shown example of tcpdump is in its raw format. Tcpdump comes withmany options to refine the output and therefore the command line can becomemessy. For better understanding of the tcpdump lets observe the first line fromfigure 5.3:
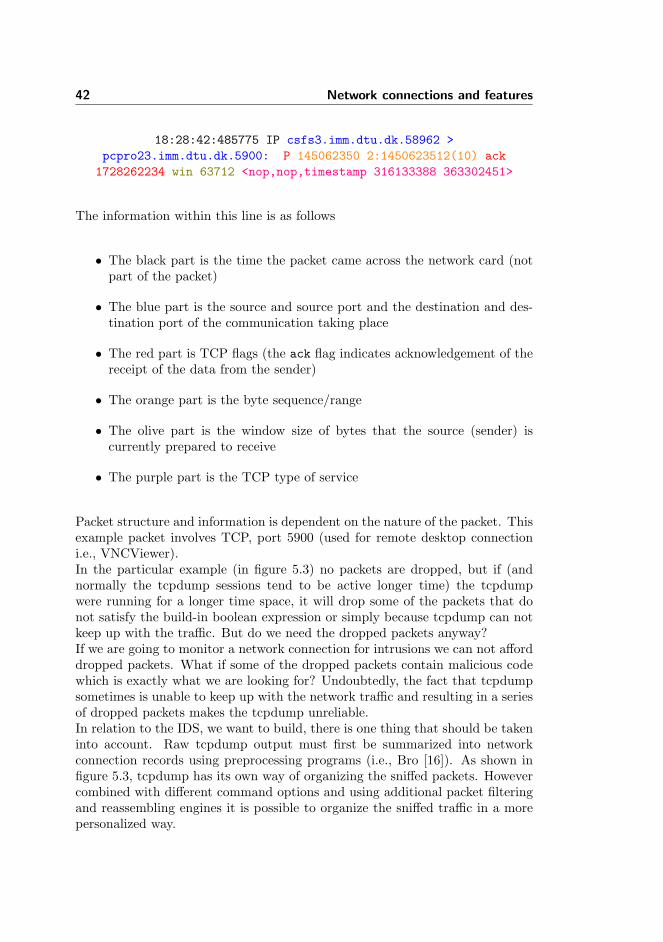
42 Network connections and features
18:28:42:485775 IP csfs3.imm.dtu.dk.58962 >pcpro23.imm.dtu.dk.5900: P 145062350 2:1450623512(10) ack1728262234 win 63712 <nop,nop,timestamp 316133388 363302451>
The information within this line is as follows
• The black part is the time the packet came across the network card (notpart of the packet)
• The blue part is the source and source port and the destination and des-tination port of the communication taking place
• The red part is TCP flags (the ack flag indicates acknowledgement of thereceipt of the data from the sender)
• The orange part is the byte sequence/range
• The olive part is the window size of bytes that the source (sender) iscurrently prepared to receive
• The purple part is the TCP type of service
Packet structure and information is dependent on the nature of the packet. Thisexample packet involves TCP, port 5900 (used for remote desktop connectioni.e., VNCViewer).In the particular example (in figure 5.3) no packets are dropped, but if (andnormally the tcpdump sessions tend to be active longer time) the tcpdumpwere running for a longer time space, it will drop some of the packets that donot satisfy the build-in boolean expression or simply because tcpdump can notkeep up with the traffic. But do we need the dropped packets anyway?If we are going to monitor a network connection for intrusions we can not afforddropped packets. What if some of the dropped packets contain malicious codewhich is exactly what we are looking for? Undoubtedly, the fact that tcpdumpsometimes is unable to keep up with the network traffic and resulting in a seriesof dropped packets makes the tcpdump unreliable.In relation to the IDS, we want to build, there is one thing that should be takeninto account. Raw tcpdump output must first be summarized into networkconnection records using preprocessing programs (i.e., Bro [16]). As shown infigure 5.3, tcpdump has its own way of organizing the sniffed packets. Howevercombined with different command options and using additional packet filteringand reassembling engines it is possible to organize the sniffed traffic in a morepersonalized way.
5.2 Sniffer tools 43
5.2.2 PCAP
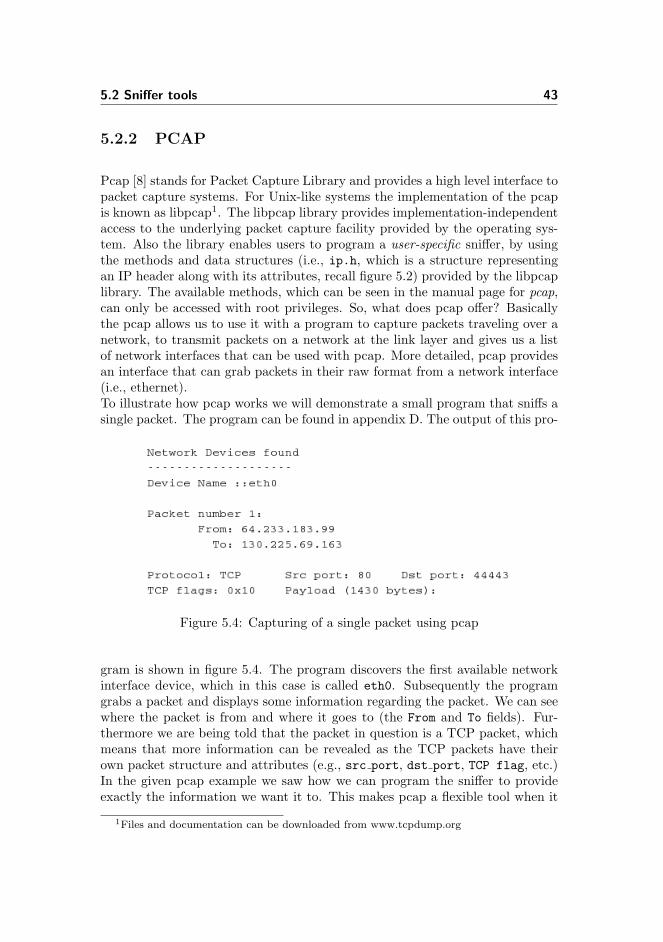
Pcap [8] stands for Packet Capture Library and provides a high level interface topacket capture systems. For Unix-like systems the implementation of the pcapis known as libpcap1. The libpcap library provides implementation-independentaccess to the underlying packet capture facility provided by the operating sys-tem. Also the library enables users to program a user-specific sniffer, by usingthe methods and data structures (i.e., ip.h, which is a structure representingan IP header along with its attributes, recall figure 5.2) provided by the libpcaplibrary. The available methods, which can be seen in the manual page for pcap,can only be accessed with root privileges. So, what does pcap offer? Basicallythe pcap allows us to use it with a program to capture packets traveling over anetwork, to transmit packets on a network at the link layer and gives us a listof network interfaces that can be used with pcap. More detailed, pcap providesan interface that can grab packets in their raw format from a network interface(i.e., ethernet).To illustrate how pcap works we will demonstrate a small program that sniffs asingle packet. The program can be found in appendix D. The output of this pro-
Figure 5.4: Capturing of a single packet using pcap
gram is shown in figure 5.4. The program discovers the first available networkinterface device, which in this case is called eth0. Subsequently the programgrabs a packet and displays some information regarding the packet. We can seewhere the packet is from and where it goes to (the From and To fields). Fur-thermore we are being told that the packet in question is a TCP packet, whichmeans that more information can be revealed as the TCP packets have theirown packet structure and attributes (e.g., src port, dst port, TCP flag, etc.)In the given pcap example we saw how we can program the sniffer to provideexactly the information we want it to. This makes pcap a flexible tool when it
1Files and documentation can be downloaded from www.tcpdump.org
44 Network connections and features
comes to the implementation of the IDS.
5.2.3 Using pcap as sniffer
Not surprisingly, we choose to use pcap as the sniffing tool for the IDS system.The reason behind this decision is related to the flexibility that comes withpcap so that we can implement our own specific sniffer device based on therequirements we have defined. During the implementation phase this will enableus to code the sniffer in a way that will be fully operational with the rest ofthe system (e.g., the GUI and neural network). By doing so there will be noneed for a preprocessing program to process traffic in order to obtain intrinsicfeatures of the packets. With pcap we are able to retrieve these features as soonas the packet is captured.During traffic sniffing, the sniffer should be set to promiscuous mode. Normallythe sniffer program will not capture all packets, unless you tell it to do so. Weare interested in capturing all packets to be sure that we do not miss any packetsthat might have an important value to be used in feature construction. Duringthe activation of the network interface in the implementation phase we will tellthe program to operate in promiscuous mode (this is done by giving the secondparameter of the method pcap live open() a true value).
5.3 Feature construction
Once the sniffer starts collecting the passing packets from the ethernet they willbe examined and processed in order to construct features. Lee and Stolfo [16]describe in their article a strategy for finding features within a network connec-tion from the attributes of packets through some procedures that could identifyan intrusion. Within this section we will shortly outline the principles behindfeature construction. The following section describes how features will be rep-resented for the IDS program.
5.3.1 Making general features
It is important to define features as generally as possible before presenting themto the self-organizing map algorithm. Some of the features Lee and Stolfo havedescribed in their article represent specific events and some of them are intendedto reveal attacks like SYN flood (a DoS attack, where a client sends several
5.3 Feature construction 45
packets (SYN) to a server, the server responds (SYN-ACK) and awaits confirmation(ACK) from the client, but the client never sends back confirmation [6]), whichis still possible but most unlikely nowadays. Newer TCP implementations donot take any effect from the SYN flood attack and this type of attacks (thatexploits bug in TCP implementation) are mostly historical. Our strategy fordefining features will differ from the one Lee and Stolfo uses. While they tendto define features for specific attacks (i.e., failed login, overflow, SYN floodetc.) we will try to define our features more generally. This has also somethingto do with the self-organizing map we have chosen for the IDS. The SOM is anunsupervised learning algorithm, which means that it does not know if someinput data set is malicious or not. It only knows the patterns of the data setand classifies data according to their patterns. Therefore by making generalfeatures we will cover a wide range of general network traffic patterns, so thatSOM can identify and distinguish these patterns by letting different patternsactivate different neurons. Also when using SOM every cluster in the maprepresents data sets that somehow are similar. The cluster becomes a generalrepresentation of these data sets. Therefore instead of having two almost-similarfeatures (i.e., failed logins and logged in, root shell and su, etc. [16])activating two different clusters, we will try to merge them into a more generalfeature and activate only one cluster. For example all login related features (i.e.,failed logins, logged in) will be merged into one single feature called logins.We will still use some of the features defined by Lee and Stolfo and in additiondefine some new features which are more general and collective.Before defining features we should be aware of defining dependent features thatwill be statistically inappropriate and affect the training and testing of the SOMalgorithm. The features should be independent of each other, meaning that afeature should not be built on other features.
5.3.2 Frequent episodes
We will use an automatic procedure for parsing socalled frequent episodes [16]and thereby construct features. Frequent episodes describe the study of thefrequent sequential patterns of network traffic in order to comprehend the tem-poral and statistical nature of the many attacks as well as the normal behaviors.This is why we use frequent episodes to represent the sequential traffic recordsin order to calculate values for the features. The generated frequent episodeswill be applied to data sets containing network traffic (i.e., IP packets). Theidea is to identify intrusion patterns through comparison with normal trafficdata. But before we can compare patterns we need to represent the featuresin an appropriate way so comparison is possible. One way of doing so, is toconvert the features into ’numbers’ such that ’similar’ features are mapped tocloser numbers. In this way feature comparison and intrusion identification is
46 Network connections and features
accomplished by comparing the numbers.
5.3.2.1 Procedure for parsing frequent episodes
The following procedure (the same procedure described in [16]) describes howfeatures are built by using different intrinsic features in a given time space:
• Assume F0 (e.g., dst host) is used as the reference feature, and the widthof the episode is w seconds.
• Add the following features that examine only the connections in the pastw seconds that share the same value in F0 as the current connection:
– A feature that computes the count of these connections;
– Let F1 be service, src dst, or dst host other than F0 (i.e., F1 is anessential feature). If the same F1 value (e.g., http) is in all the itemsets of the episode, add a feature that computes the percentage of theconnections that share the same F1 value as the current connection;otherwise, add a feature that computes the percentage of differentvalues of F1;
– Let V2 be a value (e.g., S0) of a feature F2 (e.g., flag) other thanF0 and F1 (i.e., V2 is a value of a nonessential feature). If V2 is inall the item sets of the episode, add a feature that computes thepercentage of connections that have the same V2 value; otherwise, ifF2 is a numerical feature, add a feature that computes the averageof the F2 values.
This procedure parses frequent episodes and computes values to represent tem-poral (because connections are measured in time windows and share the samereference feature value) features by using three operators, count, percent, andaverage. The difference between essential and nonessential features is that essen-tial features describe the anatomy of an intrusion, for example the same service(i.e., port) is targeted while the actual values (i.e., http) are not important sincethe same attack method can be applied to different targets (i.e., ftp). The val-ues of nonessential features indicate the invariant of an intrusion (i.e., flag =S0) because they summarize the connection behavior according to the networkprotocols.
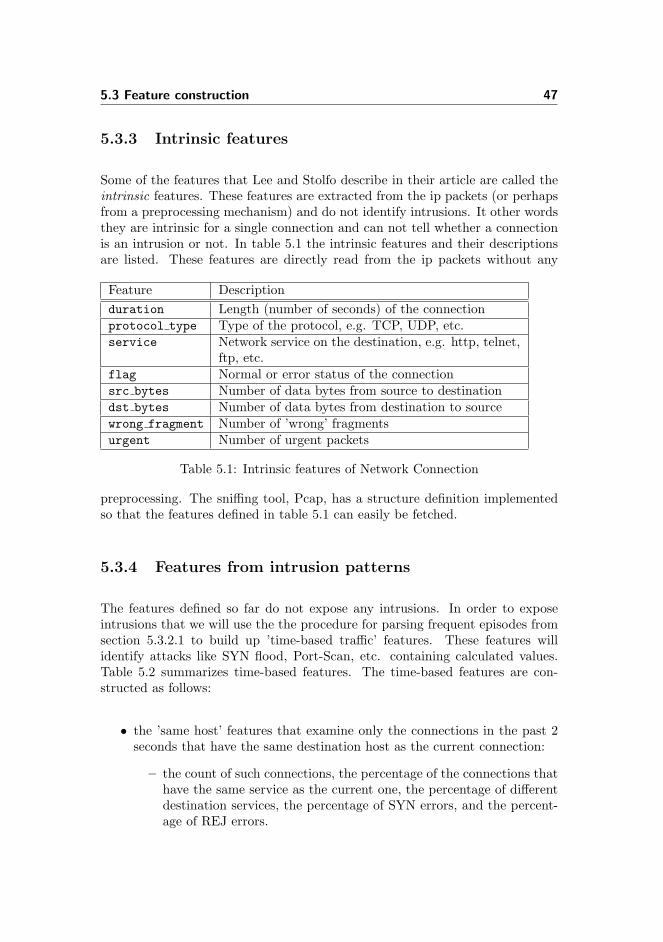
5.3 Feature construction 47
5.3.3 Intrinsic features
Some of the features that Lee and Stolfo describe in their article are called theintrinsic features. These features are extracted from the ip packets (or perhapsfrom a preprocessing mechanism) and do not identify intrusions. It other wordsthey are intrinsic for a single connection and can not tell whether a connectionis an intrusion or not. In table 5.1 the intrinsic features and their descriptionsare listed. These features are directly read from the ip packets without any
Feature Descriptionduration Length (number of seconds) of the connectionprotocol type Type of the protocol, e.g. TCP, UDP, etc.service Network service on the destination, e.g. http, telnet,
ftp, etc.flag Normal or error status of the connectionsrc bytes Number of data bytes from source to destinationdst bytes Number of data bytes from destination to sourcewrong fragment Number of ’wrong’ fragmentsurgent Number of urgent packets
Table 5.1: Intrinsic features of Network Connection
preprocessing. The sniffing tool, Pcap, has a structure definition implementedso that the features defined in table 5.1 can easily be fetched.
5.3.4 Features from intrusion patterns
The features defined so far do not expose any intrusions. In order to exposeintrusions that we will use the the procedure for parsing frequent episodes fromsection 5.3.2.1 to build up ’time-based traffic’ features. These features willidentify attacks like SYN flood, Port-Scan, etc. containing calculated values.Table 5.2 summarizes time-based features. The time-based features are con-structed as follows:
• the ’same host’ features that examine only the connections in the past 2seconds that have the same destination host as the current connection:
– the count of such connections, the percentage of the connections thathave the same service as the current one, the percentage of differentdestination services, the percentage of SYN errors, and the percent-age of REJ errors.
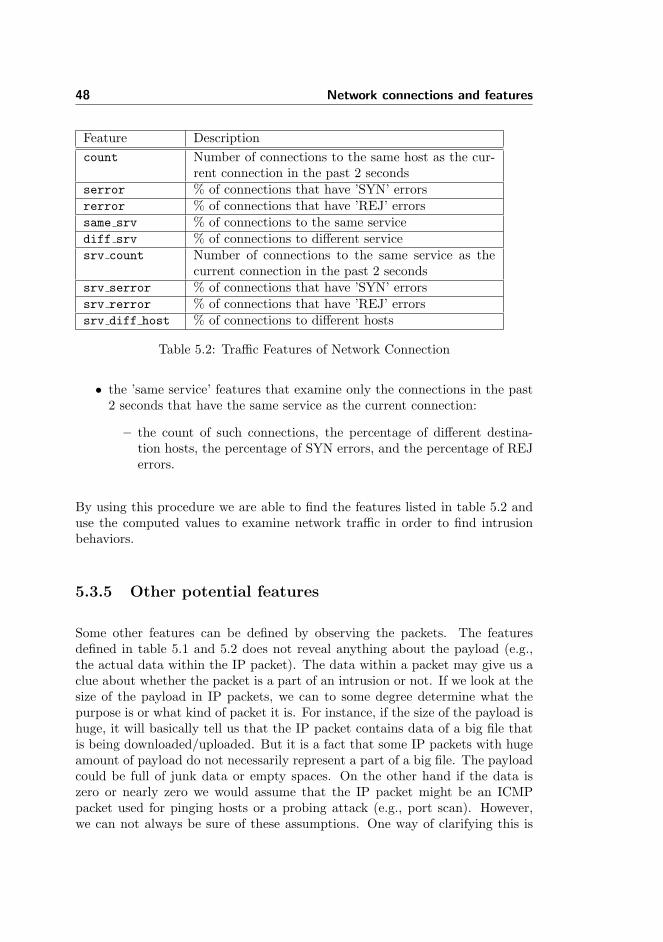
48 Network connections and features
Feature Descriptioncount Number of connections to the same host as the cur-
rent connection in the past 2 secondsserror % of connections that have ’SYN’ errorsrerror % of connections that have ’REJ’ errorssame srv % of connections to the same servicediff srv % of connections to different servicesrv count Number of connections to the same service as the
current connection in the past 2 secondssrv serror % of connections that have ’SYN’ errorssrv rerror % of connections that have ’REJ’ errorssrv diff host % of connections to different hosts
Table 5.2: Traffic Features of Network Connection
• the ’same service’ features that examine only the connections in the past2 seconds that have the same service as the current connection:
– the count of such connections, the percentage of different destina-tion hosts, the percentage of SYN errors, and the percentage of REJerrors.
By using this procedure we are able to find the features listed in table 5.2 anduse the computed values to examine network traffic in order to find intrusionbehaviors.
5.3.5 Other potential features
Some other features can be defined by observing the packets. The featuresdefined in table 5.1 and 5.2 does not reveal anything about the payload (e.g.,the actual data within the IP packet). The data within a packet may give us aclue about whether the packet is a part of an intrusion or not. If we look at thesize of the payload in IP packets, we can to some degree determine what thepurpose is or what kind of packet it is. For instance, if the size of the payload ishuge, it will basically tell us that the IP packet contains data of a big file thatis being downloaded/uploaded. But it is a fact that some IP packets with hugeamount of payload do not necessarily represent a part of a big file. The payloadcould be full of junk data or empty spaces. On the other hand if the data iszero or nearly zero we would assume that the IP packet might be an ICMPpacket used for pinging hosts or a probing attack (e.g., port scan). However,we can not always be sure of these assumptions. One way of clarifying this is
5.4 Intrusion detection process with the given features 49
to compress the payload and make the following rules.
• If the size of compressed payload is the same or nearly the same size ofuncompressed payload, it might be an indication of that the IP packetcarrying that payload is a part of big file being transmitted.
• If the size of the compressed payload differs remarkably from the uncom-pressed payload, it might be an indication of an IP packet containing junkdata.
This could be a feature called compressed payload, which is general (can beapplied to all packets and does not represent a specific event) and maybe helpdetecting probing attacks, as the probing attack send IP packets with very smallpayload and concentrate more on discovering services (e.g., port numbers) theycan break into.Another feature description that might be interesting is time of the day theIP packet is captured. Most of the attacks happen to take place during thenight. We could define a feature called time of day that records the clock anddate of the captured packet. This is another general feature that by itself doesnot detect an intrusion but combined with other features could give valuableinformation. Picture a scene where packets with small or no payload is detectedduring the night. Again, it does not mean that this is an intrusion but it issuspicious and there is a possibility of it being an intrusion.Using the same approach it is possible to define many general features that couldprovide valuable information and make it easier to detect intrusions.
5.4 Intrusion detection process with the givenfeatures
The defined features gives us a clue about behaviors in network traffic. As forthe SOM algorithm, it does not tell whether a packet or a series of packets isan intrusion but can provide information about all kind of behaviors includingintrusions. Assume that the algorithm is well-trained with normal and non-attack network traffic. For example, we start testing the algorithm with normaltraffic data including a probing (e.g., port scan attack) attack. As result weshould have a map where the normal traffic data is spread around certain pointsand attack traffic data is spread around other certain points in the map. TheIDSnet will provide log files about all traffic data that has been used for testingand in this log file we can read what kind of traffic data activates a point inthe map. If everything goes well, we should be able to read features values of a
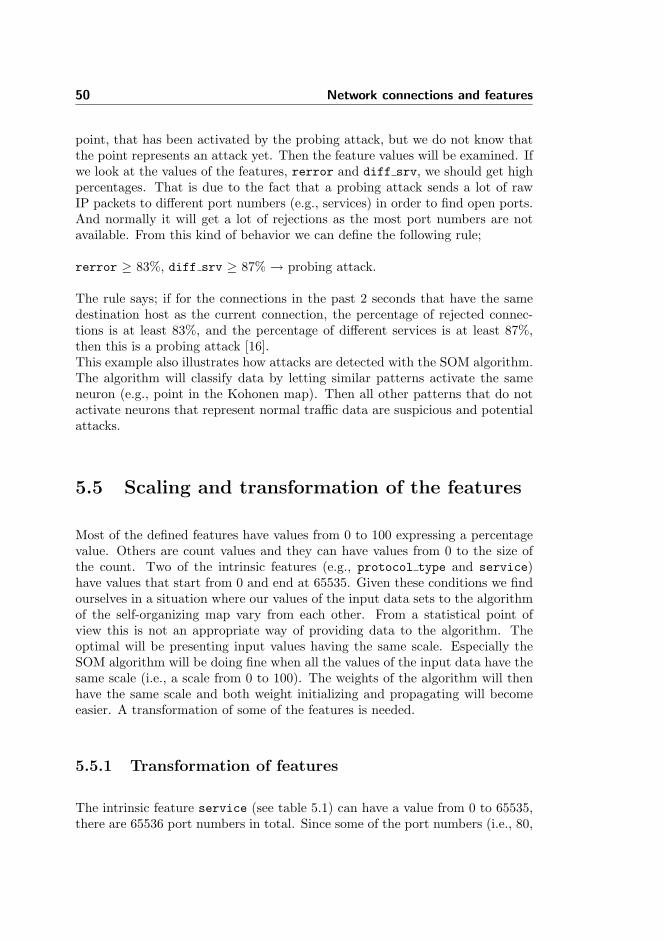
50 Network connections and features
point, that has been activated by the probing attack, but we do not know thatthe point represents an attack yet. Then the feature values will be examined. Ifwe look at the values of the features, rerror and diff srv, we should get highpercentages. That is due to the fact that a probing attack sends a lot of rawIP packets to different port numbers (e.g., services) in order to find open ports.And normally it will get a lot of rejections as the most port numbers are notavailable. From this kind of behavior we can define the following rule;
rerror ≥ 83%, diff srv ≥ 87% → probing attack.
The rule says; if for the connections in the past 2 seconds that have the samedestination host as the current connection, the percentage of rejected connec-tions is at least 83%, and the percentage of different services is at least 87%,then this is a probing attack [16].This example also illustrates how attacks are detected with the SOM algorithm.The algorithm will classify data by letting similar patterns activate the sameneuron (e.g., point in the Kohonen map). Then all other patterns that do notactivate neurons that represent normal traffic data are suspicious and potentialattacks.
5.5 Scaling and transformation of the features
Most of the defined features have values from 0 to 100 expressing a percentagevalue. Others are count values and they can have values from 0 to the size ofthe count. Two of the intrinsic features (e.g., protocol type and service)have values that start from 0 and end at 65535. Given these conditions we findourselves in a situation where our values of the input data sets to the algorithmof the self-organizing map vary from each other. From a statistical point ofview this is not an appropriate way of providing data to the algorithm. Theoptimal will be presenting input values having the same scale. Especially theSOM algorithm will be doing fine when all the values of the input data have thesame scale (i.e., a scale from 0 to 100). The weights of the algorithm will thenhave the same scale and both weight initializing and propagating will becomeeasier. A transformation of some of the features is needed.
5.5.1 Transformation of features
The intrinsic feature service (see table 5.1) can have a value from 0 to 65535,there are 65536 port numbers in total. Since some of the port numbers (i.e., 80,
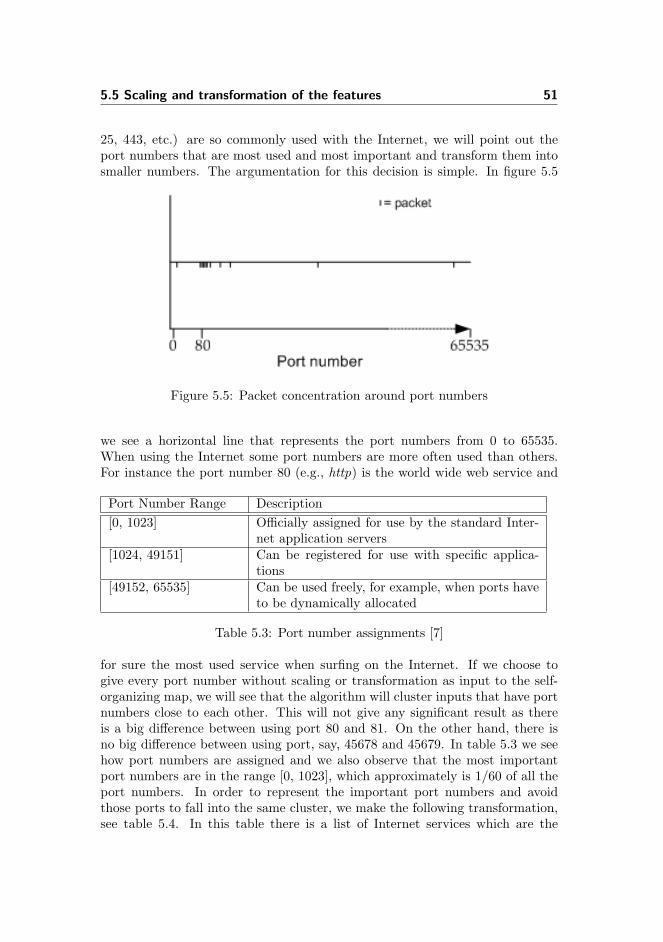
5.5 Scaling and transformation of the features 51
25, 443, etc.) are so commonly used with the Internet, we will point out theport numbers that are most used and most important and transform them intosmaller numbers. The argumentation for this decision is simple. In figure 5.5
Figure 5.5: Packet concentration around port numbers
we see a horizontal line that represents the port numbers from 0 to 65535.When using the Internet some port numbers are more often used than others.For instance the port number 80 (e.g., http) is the world wide web service and
Port Number Range Description[0, 1023] Officially assigned for use by the standard Inter-
net application servers[1024, 49151] Can be registered for use with specific applica-
tions[49152, 65535] Can be used freely, for example, when ports have
to be dynamically allocated
Table 5.3: Port number assignments [7]
for sure the most used service when surfing on the Internet. If we choose togive every port number without scaling or transformation as input to the self-organizing map, we will see that the algorithm will cluster inputs that have portnumbers close to each other. This will not give any significant result as thereis a big difference between using port 80 and 81. On the other hand, there isno big difference between using port, say, 45678 and 45679. In table 5.3 we seehow port numbers are assigned and we also observe that the most importantport numbers are in the range [0, 1023], which approximately is 1/60 of all theport numbers. In order to represent the important port numbers and avoidthose ports to fall into the same cluster, we make the following transformation,see table 5.4. In this table there is a list of Internet services which are the
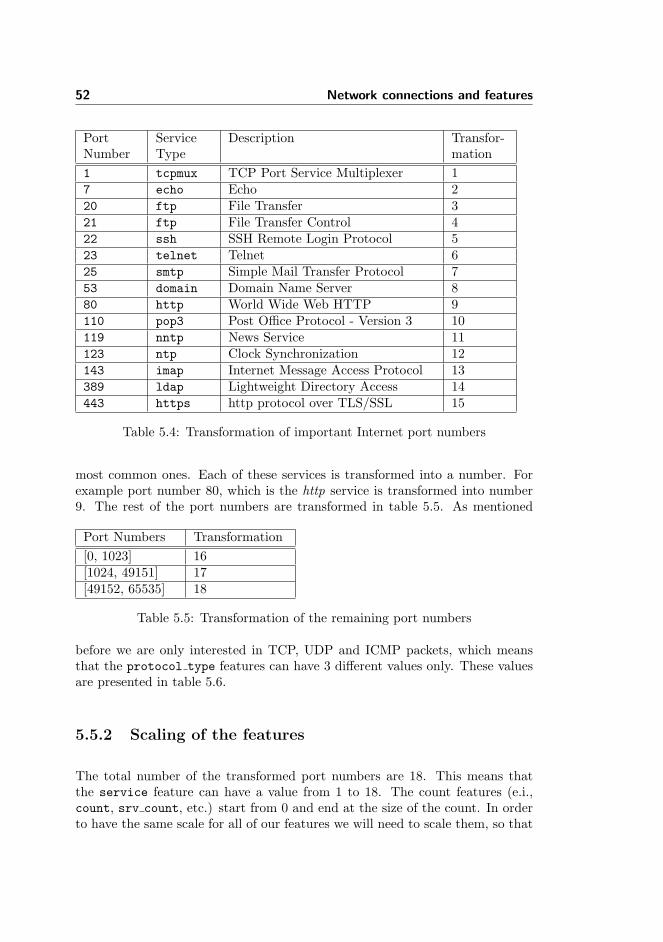
52 Network connections and features
PortNumber
ServiceType
Description Transfor-mation
1 tcpmux TCP Port Service Multiplexer 17 echo Echo 220 ftp File Transfer 321 ftp File Transfer Control 422 ssh SSH Remote Login Protocol 523 telnet Telnet 625 smtp Simple Mail Transfer Protocol 753 domain Domain Name Server 880 http World Wide Web HTTP 9110 pop3 Post Office Protocol - Version 3 10119 nntp News Service 11123 ntp Clock Synchronization 12143 imap Internet Message Access Protocol 13389 ldap Lightweight Directory Access 14443 https http protocol over TLS/SSL 15
Table 5.4: Transformation of important Internet port numbers
most common ones. Each of these services is transformed into a number. Forexample port number 80, which is the http service is transformed into number9. The rest of the port numbers are transformed in table 5.5. As mentioned
Port Numbers Transformation[0, 1023] 16[1024, 49151] 17[49152, 65535] 18
Table 5.5: Transformation of the remaining port numbers
before we are only interested in TCP, UDP and ICMP packets, which meansthat the protocol type features can have 3 different values only. These valuesare presented in table 5.6.
5.5.2 Scaling of the features
The total number of the transformed port numbers are 18. This means thatthe service feature can have a value from 1 to 18. The count features (e.i.,count, srv count, etc.) start from 0 and end at the size of the count. In orderto have the same scale for all of our features we will need to scale them, so that

5.6 Summary and discussion 53
Protocol type Feature valueICMP 1TCP 6UDP 17
Table 5.6: Feature values of the protocol types
every feature has a value within the interval [0, 100]. This is more or less due tothe fact that SOM does not label records, it operates and classifies better whenthere is a good variation in the input data set.There are several models for scaling values. Below is a list of these models andlater, it will be pointed out which method suits our features best.
• Linear scaling. Using the linear model (a ∗ x + b) features values can bescaled linearly
• Exponential scaling. Another way of scaling features values is exponen-tially (ex)
• Logarithm scaling. It is also possible to scale values by using the logarithmfunction (log(x) (base e))
The feature values that need to be scaled, will be scaled linearly.
5.6 Summary and discussion
We have covered maybe the most essential topics of the project in this chapter.The chapter gave an introduction to the very basics of Internet protocols andIP packets. These topics are also very important to understand as we are goingto construct an intrusion detection system that monitors network traffic.Afterwards, we presented the sniffer tools. This is also one of the essential partsof the project and we have gained insight to the potential sniffers and how theyoperate. There are not many different sniffer tools, but the available ones areenough. Pcap was chosen to be used because of its flexibility and the fact thatis implementation-dependent. TCPDump is not a bad candidate, it has manyoptions and the output can get more personalized with the use of some kind ofpreprocessing mechanism.Then we moved on to discuss feature construction. We have pointed out theimportance of making general features in order to give the SOM algorithm achance to discover all kind of behaviors. If the features were as specific as the
54 Network connections and features
ones in the article of Lee and Stolfo, we would not be sure of providing a goodand varying input data to the SOM, and thereby could not be sure of the out-come. Therefore we have tried to define our features as general as possible.Finally, the need of a scaling and transformation mechanism to the features inorder to represent the features in a certain interval was discussed. We set up amodel for transforming some of the features like the service feature that hasan upper-bound at 65535. The most important services were found and trans-formed into a smaller value together with the rest of the services in intervals.The scaling assures that all feature values end up in the same interval. It hasbeen decided to use a linear scaling so that features are scaled to a value from0 to 100.

Chapter 6
Specifications andrequirements for the IDS
The content of this chapter covers an introduction to the main problem of thisproject with regard to the development of the IDS, describing the purpose of itand introducing a specification of a prototype tool that is to be implementedand which is the product of this project. It will be pointed out what a such toolshould be capable of and based on these considerations a proper description ofthe desired IDS will be formulated. Furthermore, it will be elaborated whatkind of an IDS system we want to develop in the sense of where to apply theIDS. Since the tasks and data traffic depend on the location and the type of theIDS, we will specify an exact point to deploy the IDS.
6.1 The purpose of the IDS
The purpose of the IDS is to monitor network traffic, examine the IP packetsfrom these packets compute feature values that could be used to compare withother values in order to detect intrusions. The users can observe the result byplotting it in a matrix or coordinate system. Furthermore, the purpose of theIDS program is to provide a graphical user interface with the possibility of userinteraction where users will have access to the different functionalities and can
56 Specifications and requirements for the IDS
follow up on the process of training/testing.
6.2 The overall system
The IDS program consists of three parts:
The algorithm: Describes the neural network algorithm to be used in theprocess of intrusion detection. All calculations and computation will takeplace within the algorithm.
The packet sniffer: An implementation of a tool to sniff network traffic forpackets. It will collect all the packets (i.e., IP packets) that goes in andout, convert them to an appropriate object representation and presentthem to the algorithm.
The GUI: The graphical user interface will be the platform where users canactivate the sniffer, start training/testing the neural network algorithmand perform other GUI related operations. Furthermore the GUI will beindependent of the algorithm. This means that the GUI can be extendedwith other algorithms, which will make the whole system more flexibleand most important extendible.
In the following sections we will define specifications and requirements for thethree parts.
6.2.1 The algorithm
We have outlined in section 4.4 the reasons behind using the self-organizing mapas the learning algorithm for the IDS. It is a fact that the implementation of theSOM should be more or less painless and is an easy-to-implement algorithm.The two main functionalities of the SOM algorithm is the training (learning)and testing (detection). The testing operation should not be available before thetraining of the algorithm is complete. The training operation operates by takingpackets (which are processed, e.g., feature values are computed) and adjust theweights of the algorithm according to the packets. Once the algorithm hasreached the maximum number of epochs, it will stop adjusting weights andstart passing the packets to the test operation. For every incoming packet thetest operation will use the trained neural network to find a winning neuron,which will represent the packet and other packets alike in the Kohonen layer.
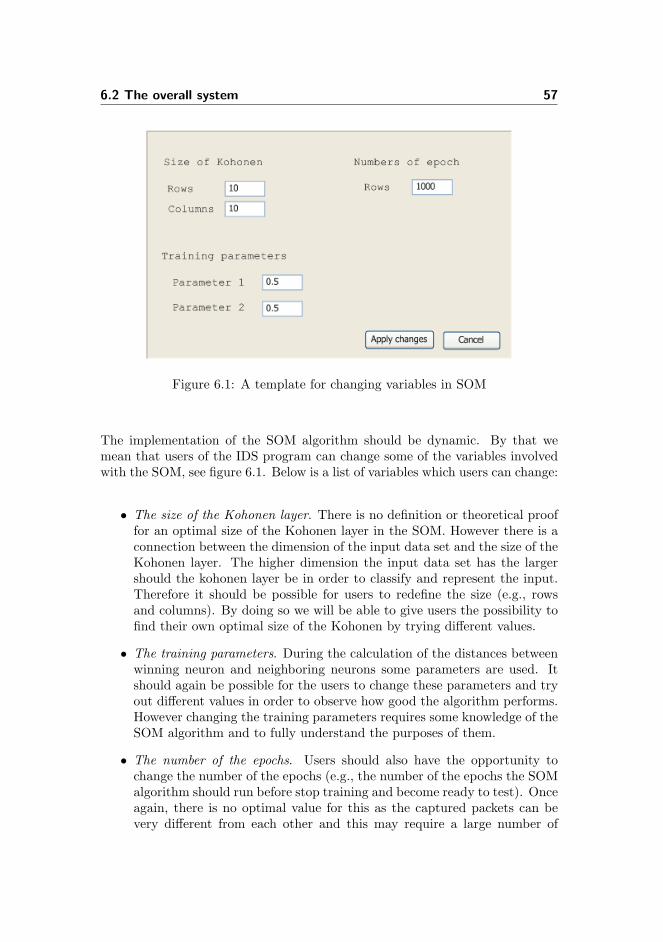
6.2 The overall system 57
Figure 6.1: A template for changing variables in SOM
The implementation of the SOM algorithm should be dynamic. By that wemean that users of the IDS program can change some of the variables involvedwith the SOM, see figure 6.1. Below is a list of variables which users can change:
• The size of the Kohonen layer. There is no definition or theoretical prooffor an optimal size of the Kohonen layer in the SOM. However there is aconnection between the dimension of the input data set and the size of theKohonen layer. The higher dimension the input data set has the largershould the kohonen layer be in order to classify and represent the input.Therefore it should be possible for users to redefine the size (e.g., rowsand columns). By doing so we will be able to give users the possibility tofind their own optimal size of the Kohonen by trying different values.
• The training parameters. During the calculation of the distances betweenwinning neuron and neighboring neurons some parameters are used. Itshould again be possible for the users to change these parameters and tryout different values in order to observe how good the algorithm performs.However changing the training parameters requires some knowledge of theSOM algorithm and to fully understand the purposes of them.
• The number of the epochs. Users should also have the opportunity tochange the number of the epochs (e.g., the number of the epochs the SOMalgorithm should run before stop training and become ready to test). Onceagain, there is no optimal value for this as the captured packets can bevery different from each other and this may require a large number of
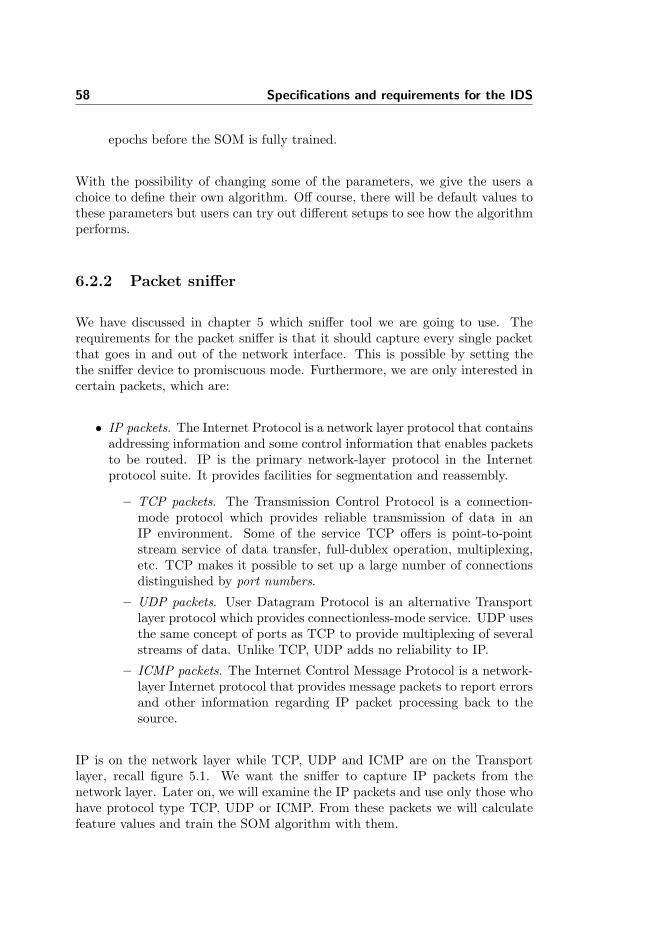
58 Specifications and requirements for the IDS
epochs before the SOM is fully trained.
With the possibility of changing some of the parameters, we give the users achoice to define their own algorithm. Off course, there will be default values tothese parameters but users can try out different setups to see how the algorithmperforms.
6.2.2 Packet sniffer
We have discussed in chapter 5 which sniffer tool we are going to use. Therequirements for the packet sniffer is that it should capture every single packetthat goes in and out of the network interface. This is possible by setting thethe sniffer device to promiscuous mode. Furthermore, we are only interested incertain packets, which are:
• IP packets. The Internet Protocol is a network layer protocol that containsaddressing information and some control information that enables packetsto be routed. IP is the primary network-layer protocol in the Internetprotocol suite. It provides facilities for segmentation and reassembly.
– TCP packets. The Transmission Control Protocol is a connection-mode protocol which provides reliable transmission of data in anIP environment. Some of the service TCP offers is point-to-pointstream service of data transfer, full-dublex operation, multiplexing,etc. TCP makes it possible to set up a large number of connectionsdistinguished by port numbers.
– UDP packets. User Datagram Protocol is an alternative Transportlayer protocol which provides connectionless-mode service. UDP usesthe same concept of ports as TCP to provide multiplexing of severalstreams of data. Unlike TCP, UDP adds no reliability to IP.
– ICMP packets. The Internet Control Message Protocol is a network-layer Internet protocol that provides message packets to report errorsand other information regarding IP packet processing back to thesource.
IP is on the network layer while TCP, UDP and ICMP are on the Transportlayer, recall figure 5.1. We want the sniffer to capture IP packets from thenetwork layer. Later on, we will examine the IP packets and use only those whohave protocol type TCP, UDP or ICMP. From these packets we will calculatefeature values and train the SOM algorithm with them.
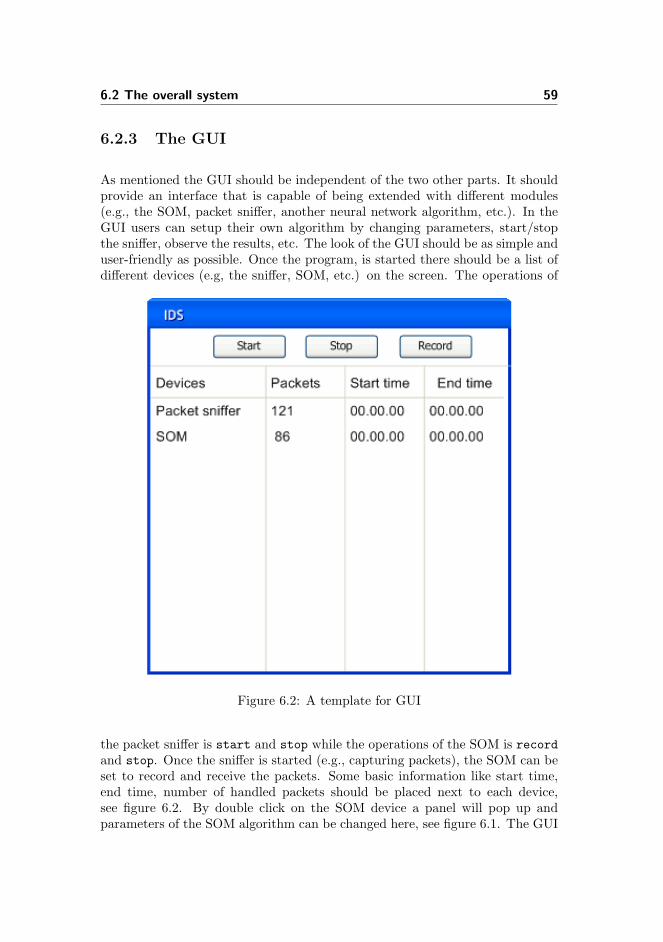
6.2 The overall system 59
6.2.3 The GUI
As mentioned the GUI should be independent of the two other parts. It shouldprovide an interface that is capable of being extended with different modules(e.g., the SOM, packet sniffer, another neural network algorithm, etc.). In theGUI users can setup their own algorithm by changing parameters, start/stopthe sniffer, observe the results, etc. The look of the GUI should be as simple anduser-friendly as possible. Once the program, is started there should be a list ofdifferent devices (e.g, the sniffer, SOM, etc.) on the screen. The operations of
Figure 6.2: A template for GUI
the packet sniffer is start and stop while the operations of the SOM is recordand stop. Once the sniffer is started (e.g., capturing packets), the SOM can beset to record and receive the packets. Some basic information like start time,end time, number of handled packets should be placed next to each device,see figure 6.2. By double click on the SOM device a panel will pop up andparameters of the SOM algorithm can be changed here, see figure 6.1. The GUI
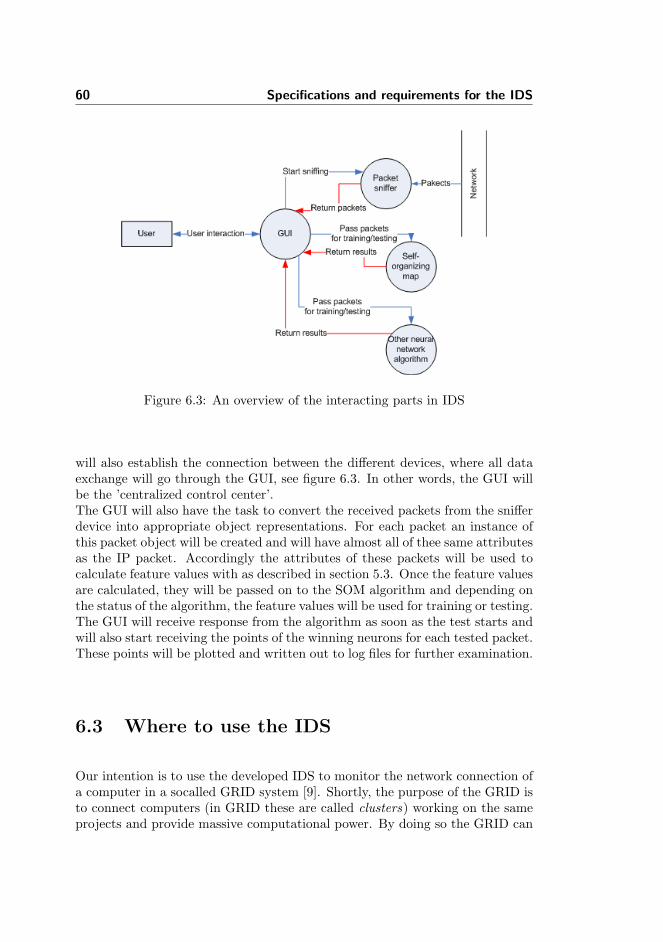
60 Specifications and requirements for the IDS
Figure 6.3: An overview of the interacting parts in IDS
will also establish the connection between the different devices, where all dataexchange will go through the GUI, see figure 6.3. In other words, the GUI willbe the ’centralized control center’.The GUI will also have the task to convert the received packets from the snifferdevice into appropriate object representations. For each packet an instance ofthis packet object will be created and will have almost all of thee same attributesas the IP packet. Accordingly the attributes of these packets will be used tocalculate feature values with as described in section 5.3. Once the feature valuesare calculated, they will be passed on to the SOM algorithm and depending onthe status of the algorithm, the feature values will be used for training or testing.The GUI will receive response from the algorithm as soon as the test starts andwill also start receiving the points of the winning neurons for each tested packet.These points will be plotted and written out to log files for further examination.
6.3 Where to use the IDS
Our intention is to use the developed IDS to monitor the network connection ofa computer in a socalled GRID system [9]. Shortly, the purpose of the GRID isto connect computers (in GRID these are called clusters) working on the sameprojects and provide massive computational power. By doing so the GRID can
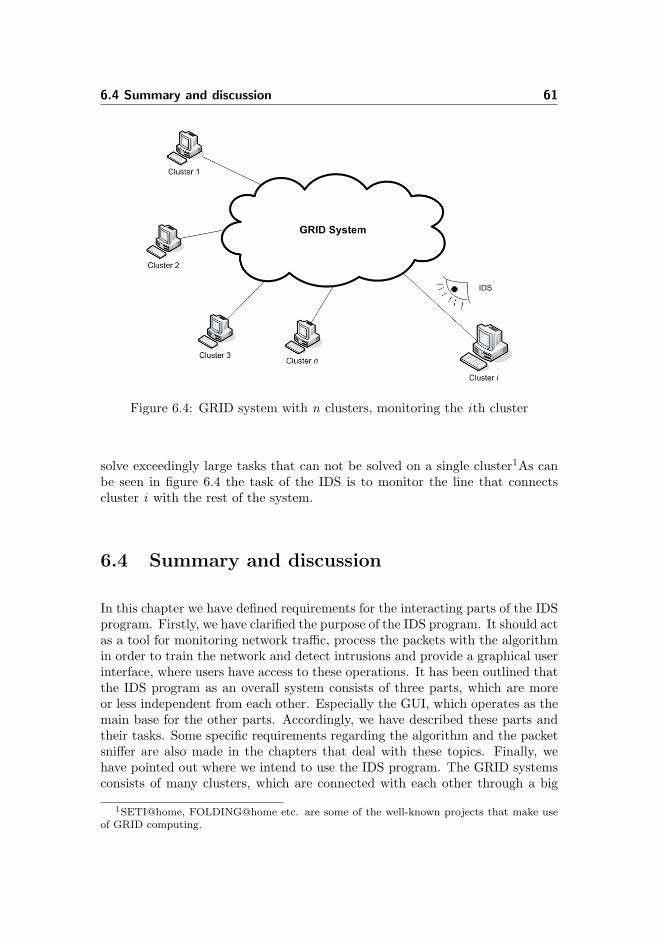
6.4 Summary and discussion 61
Figure 6.4: GRID system with n clusters, monitoring the ith cluster
solve exceedingly large tasks that can not be solved on a single cluster1As canbe seen in figure 6.4 the task of the IDS is to monitor the line that connectscluster i with the rest of the system.
6.4 Summary and discussion
In this chapter we have defined requirements for the interacting parts of the IDSprogram. Firstly, we have clarified the purpose of the IDS program. It should actas a tool for monitoring network traffic, process the packets with the algorithmin order to train the network and detect intrusions and provide a graphical userinterface, where users have access to these operations. It has been outlined thatthe IDS program as an overall system consists of three parts, which are moreor less independent from each other. Especially the GUI, which operates as themain base for the other parts. Accordingly, we have described these parts andtheir tasks. Some specific requirements regarding the algorithm and the packetsniffer are also made in the chapters that deal with these topics. Finally, wehave pointed out where we intend to use the IDS program. The GRID systemsconsists of many clusters, which are connected with each other through a big
1SETI@home, FOLDING@home etc. are some of the well-known projects that make useof GRID computing.

62 Specifications and requirements for the IDS
local area network or the Internet. In both cases clusters might be in dangerfor intrusions and need to be protected as well. Given these specifications andrequirements we are now able to design the IDS program.

Chapter 7
Design of the IDS
The design chapter includes decisions on the design of the IDS. Based on thespecifications made in the previous chapter, we will define an overall theoreticaldesign together with the design of the implementation of the system. Some of thedesign decisions in the sense of which tools to use, are madein previous chapters,like chapter 3, 4 and 6. Due to that we will briefly summarize these decisionsand concentrate more on making a design regarding the implementation.
7.1 Theoretical design
In this section we will present an overview of the theoretical design. Much ofthis design has been determined in terms of which concept to use in which areain previous chapters. In the following sections a summary of these decisions ispresented.
7.1.1 Type of the IDS
In chapter 6 three different types of IDS were introduced. From the beginningof this project it was defined in the problem description that the aim of the
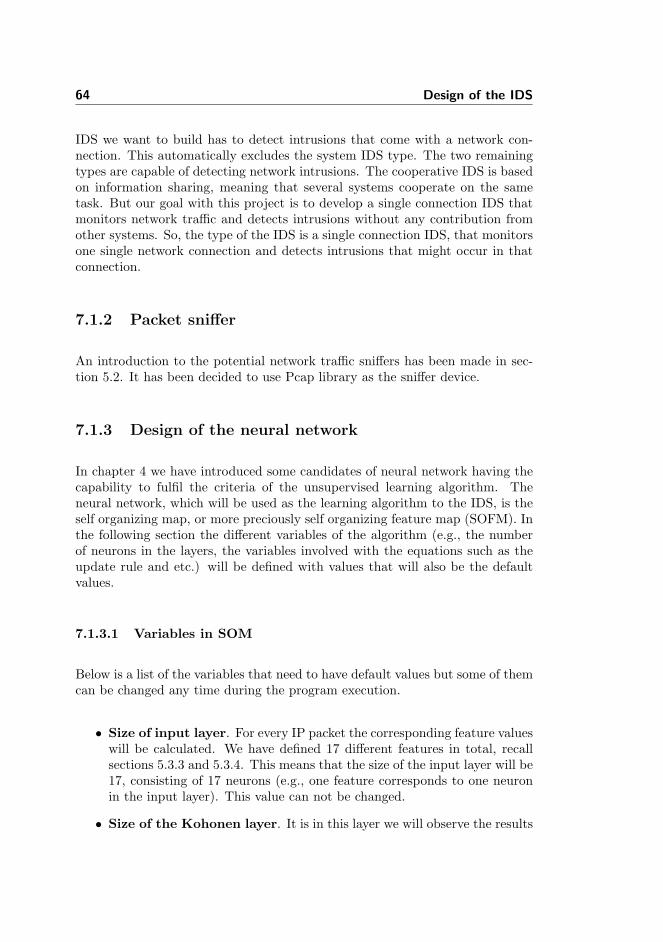
64 Design of the IDS
IDS we want to build has to detect intrusions that come with a network con-nection. This automatically excludes the system IDS type. The two remainingtypes are capable of detecting network intrusions. The cooperative IDS is basedon information sharing, meaning that several systems cooperate on the sametask. But our goal with this project is to develop a single connection IDS thatmonitors network traffic and detects intrusions without any contribution fromother systems. So, the type of the IDS is a single connection IDS, that monitorsone single network connection and detects intrusions that might occur in thatconnection.
7.1.2 Packet sniffer
An introduction to the potential network traffic sniffers has been made in sec-tion 5.2. It has been decided to use Pcap library as the sniffer device.
7.1.3 Design of the neural network
In chapter 4 we have introduced some candidates of neural network having thecapability to fulfil the criteria of the unsupervised learning algorithm. Theneural network, which will be used as the learning algorithm to the IDS, is theself organizing map, or more preciously self organizing feature map (SOFM). Inthe following section the different variables of the algorithm (e.g., the numberof neurons in the layers, the variables involved with the equations such as theupdate rule and etc.) will be defined with values that will also be the defaultvalues.
7.1.3.1 Variables in SOM
Below is a list of the variables that need to have default values but some of themcan be changed any time during the program execution.
• Size of input layer. For every IP packet the corresponding feature valueswill be calculated. We have defined 17 different features in total, recallsections 5.3.3 and 5.3.4. This means that the size of the input layer will be17, consisting of 17 neurons (e.g., one feature corresponds to one neuronin the input layer). This value can not be changed.
• Size of the Kohonen layer. It is in this layer we will observe the results
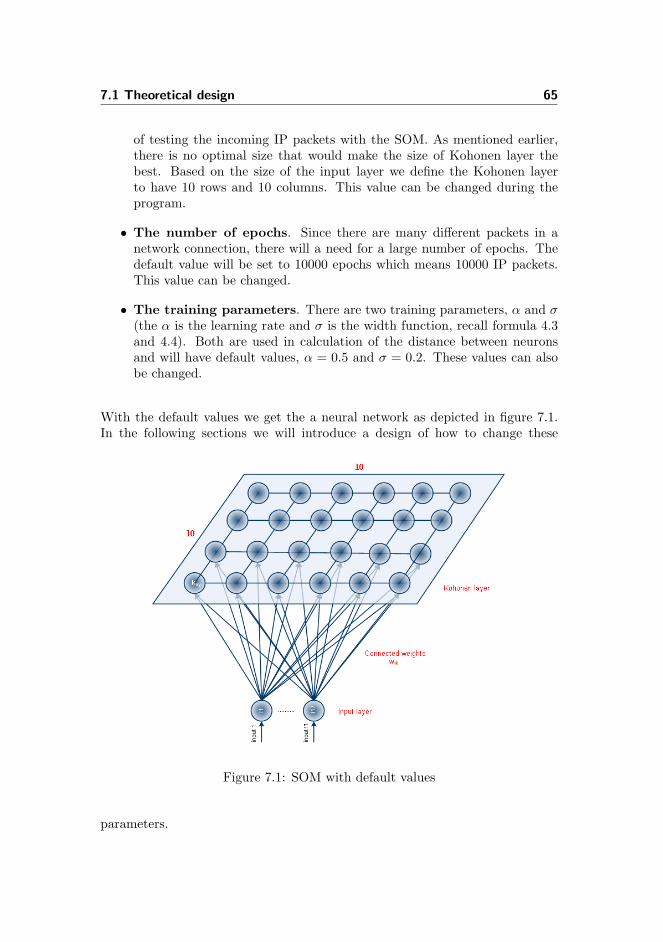
7.1 Theoretical design 65
of testing the incoming IP packets with the SOM. As mentioned earlier,there is no optimal size that would make the size of Kohonen layer thebest. Based on the size of the input layer we define the Kohonen layerto have 10 rows and 10 columns. This value can be changed during theprogram.
• The number of epochs. Since there are many different packets in anetwork connection, there will a need for a large number of epochs. Thedefault value will be set to 10000 epochs which means 10000 IP packets.This value can be changed.
• The training parameters. There are two training parameters, α and σ(the α is the learning rate and σ is the width function, recall formula 4.3and 4.4). Both are used in calculation of the distance between neuronsand will have default values, α = 0.5 and σ = 0.2. These values can alsobe changed.
With the default values we get the a neural network as depicted in figure 7.1.In the following sections we will introduce a design of how to change these
Figure 7.1: SOM with default values
parameters.
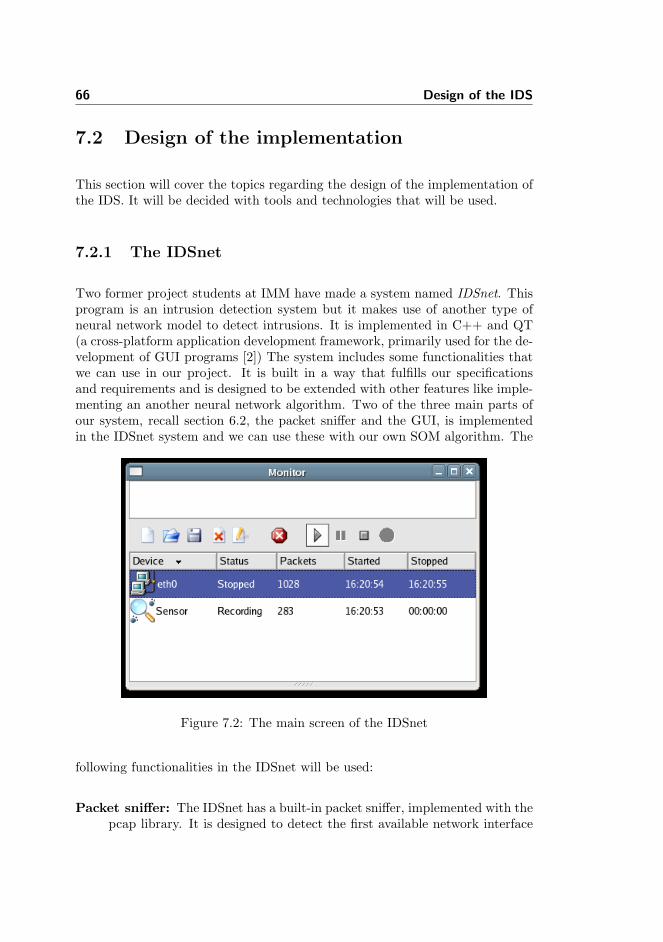
66 Design of the IDS
7.2 Design of the implementation
This section will cover the topics regarding the design of the implementation ofthe IDS. It will be decided with tools and technologies that will be used.
7.2.1 The IDSnet
Two former project students at IMM have made a system named IDSnet. Thisprogram is an intrusion detection system but it makes use of another type ofneural network model to detect intrusions. It is implemented in C++ and QT(a cross-platform application development framework, primarily used for the de-velopment of GUI programs [2]) The system includes some functionalities thatwe can use in our project. It is built in a way that fulfills our specificationsand requirements and is designed to be extended with other features like imple-menting an another neural network algorithm. Two of the three main parts ofour system, recall section 6.2, the packet sniffer and the GUI, is implementedin the IDSnet system and we can use these with our own SOM algorithm. The
Figure 7.2: The main screen of the IDSnet
following functionalities in the IDSnet will be used:
Packet sniffer: The IDSnet has a built-in packet sniffer, implemented with thepcap library. It is designed to detect the first available network interface
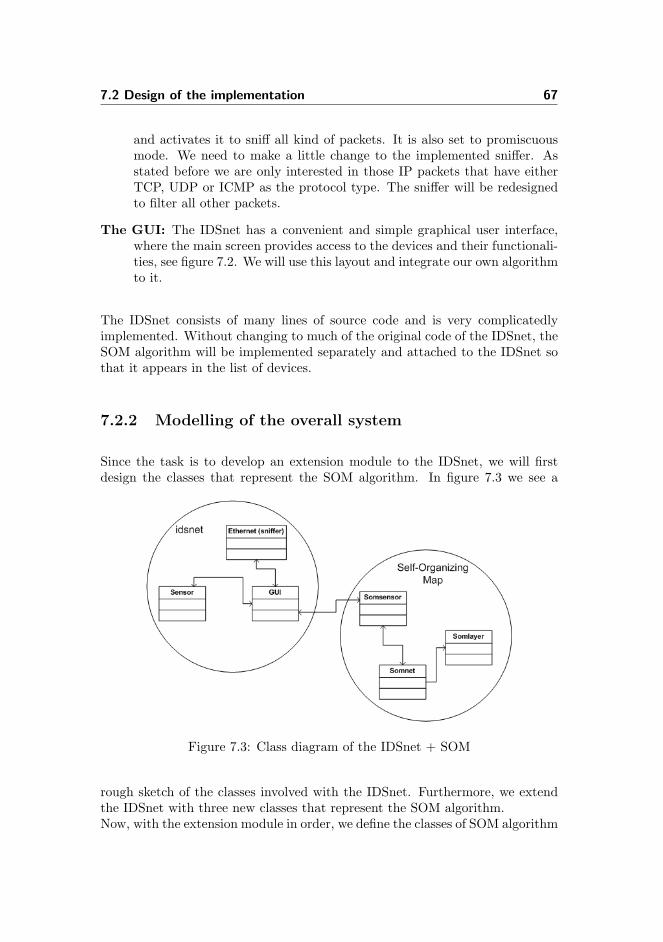
7.2 Design of the implementation 67
and activates it to sniff all kind of packets. It is also set to promiscuousmode. We need to make a little change to the implemented sniffer. Asstated before we are only interested in those IP packets that have eitherTCP, UDP or ICMP as the protocol type. The sniffer will be redesignedto filter all other packets.
The GUI: The IDSnet has a convenient and simple graphical user interface,where the main screen provides access to the devices and their functionali-ties, see figure 7.2. We will use this layout and integrate our own algorithmto it.
The IDSnet consists of many lines of source code and is very complicatedlyimplemented. Without changing to much of the original code of the IDSnet, theSOM algorithm will be implemented separately and attached to the IDSnet sothat it appears in the list of devices.
7.2.2 Modelling of the overall system
Since the task is to develop an extension module to the IDSnet, we will firstdesign the classes that represent the SOM algorithm. In figure 7.3 we see a
Figure 7.3: Class diagram of the IDSnet + SOM
rough sketch of the classes involved with the IDSnet. Furthermore, we extendthe IDSnet with three new classes that represent the SOM algorithm.Now, with the extension module in order, we define the classes of SOM algorithm
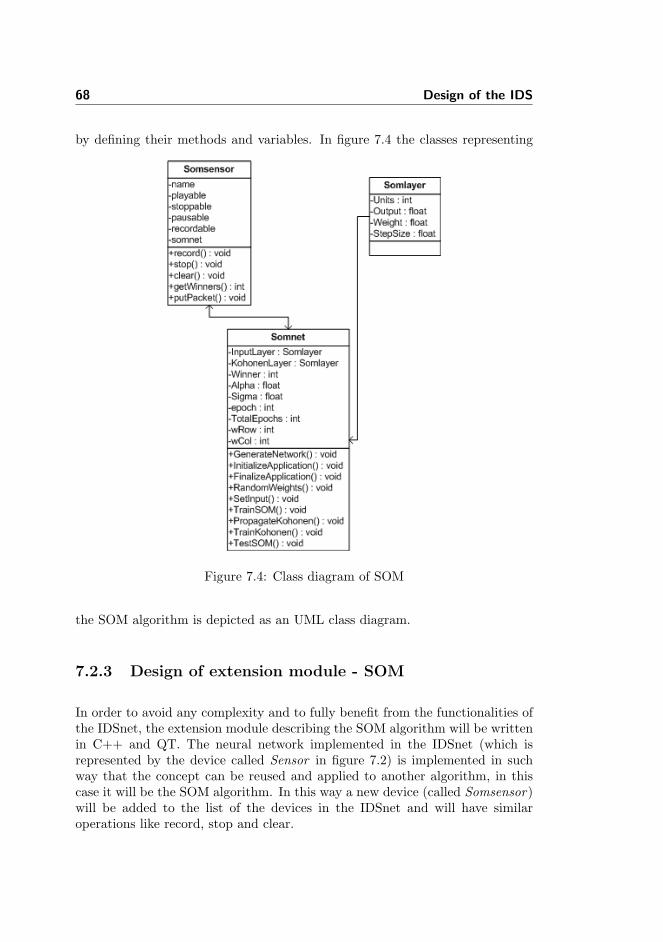
68 Design of the IDS
by defining their methods and variables. In figure 7.4 the classes representing
Figure 7.4: Class diagram of SOM
the SOM algorithm is depicted as an UML class diagram.
7.2.3 Design of extension module - SOM
In order to avoid any complexity and to fully benefit from the functionalities ofthe IDSnet, the extension module describing the SOM algorithm will be writtenin C++ and QT. The neural network implemented in the IDSnet (which isrepresented by the device called Sensor in figure 7.2) is implemented in suchway that the concept can be reused and applied to another algorithm, in thiscase it will be the SOM algorithm. In this way a new device (called Somsensor)will be added to the list of the devices in the IDSnet and will have similaroperations like record, stop and clear.
7.3 Summary and discussion 69
7.3 Summary and discussion
We have in this chapter proposed a design solution to an IDS program that op-erates with the self-organizing map algorithm. As mentioned in the introductionto this chapter, much of the design decisions regarding the theoretical aspect ofthe IDS are decided in previous chapters and we have made a summary of thesedecisions in this chapter. The design of the SOM algorithm involves definingsome default values to the parameters of the algorithm. The given default val-ues are not optimal but reasonable values to start training the algorithm. Userscan measure the efficiency of the SOM algorithm by trying different parametervalues.Later, we presented the intrusion detection system, called the IDSnet, which isa product of two students at IMM. The IDSnet is based on detecting intrusionsby finding socalled signatures in network traffic and analyzing these signatureswith the use of a neural network algorithm. The IDSnet provides an interfacewhich can be extended. Much of the functionalities in the IDSnet, especiallythe packet sniffer, can be reused with the SOM and this will save us some time.In relation to, this we have extended the class diagram the IDSnet with newclasses that will form the SOM algorithm and gave descriptions of these classeswith their methods and variables.The design proposals will be used as basis when we start the implementationof the SOM algorithm. Luckily, the IDSnet program is extendible but unfortu-nately, it is also a big project, which will take time to familiarize with.

70 Design of the IDS

Chapter 8
Implementation
It has been clarified in previous chapter (e.g., the design chapter) how to imple-ment the SOM algorithm as an extension to the IDSnet system. In this chapter,we will briefly outline how we have implemented the extension and attached tothe IDSnet. Since the packet sniffer and graphical user interface are providedby the IDSnet, we will in this chapter concentrate more on the implementationof the SOM algorithm. The other two parts will briefly be explained in termsof how they are implemented and how they operate.
8.1 Development environment
First of all we present the tools and their versions numbers, that have been usedin implementing the SOM algorithm.
Programming language : The standard C++ version 4.0.0 20050519
GUI language : QT version 4
Sniffer tool : Libpcap version 0.8.3
Development tool : KDevelop integrated development environment version3.2.0
72 Implementation
Operating system : Fedora Core version 4 kernel 2.6.11-1.1369 FC4smp
These tools are also used with the implementation of the IDSnet, but the versionnumbers the developers have used turned out to be older than the ones we haveused. This resulted in incompatibilities as we started to make the IDSnet fullyoperational with the new versions of the packages. Especially the C++ version4.0.0 caused some problems during compilation, as it turned out that version4.0.0 is more intolerant and strict1 compared to the older versions of C++. Butafter a while we got the IDSnet running and started off on our project.
8.2 Implementation of IDSnet
Without going too far into details of the implementation of IDSnet, we willbriefly outline how it works. IDSnet is a big project that has many features.The GUI forms a big part of the entire code. It operates as follows; The programstarts and the engine of the IDSnet discovers the first discovered ethernet deviceand use it to sniff packets. The neural network algorithm is also listed in thelist of devices. The algorithm is represented by the device called sensor. Doubleclick on the sensor a panel pops up giving the users the opportunity to setup thesensor. In this panel users can follow up on the process of intrusion detection.The IDSnet has an object representation describing the captured packets. Thismeans that every captured packet will create an instance of this object, copyingthe information into an appropriate header structure. It is designed to representTCP, UDP and ICMP packets and to have the attributes, that can be easilyaccessed and used during feature value calculation. More information on theIDSnet can be found in [5].
8.3 Implementation of the SOM algorithm
The class diagram of the SOM algorithm from the design chapter shows thestructure and relations of the classes. We have used the same organization andcreated three classes that represent the new device named Somsensor. Thisclass extends a namespace called Devices, which includes the packet sniffer anda neural network algorithm as well. It has record (records packets from thesniffer), stop and clear operations.The Somsensor device is automatically added to the list of devices in the IDSnet
1In terms of obeying the syntax rules, that former versions did not complain about
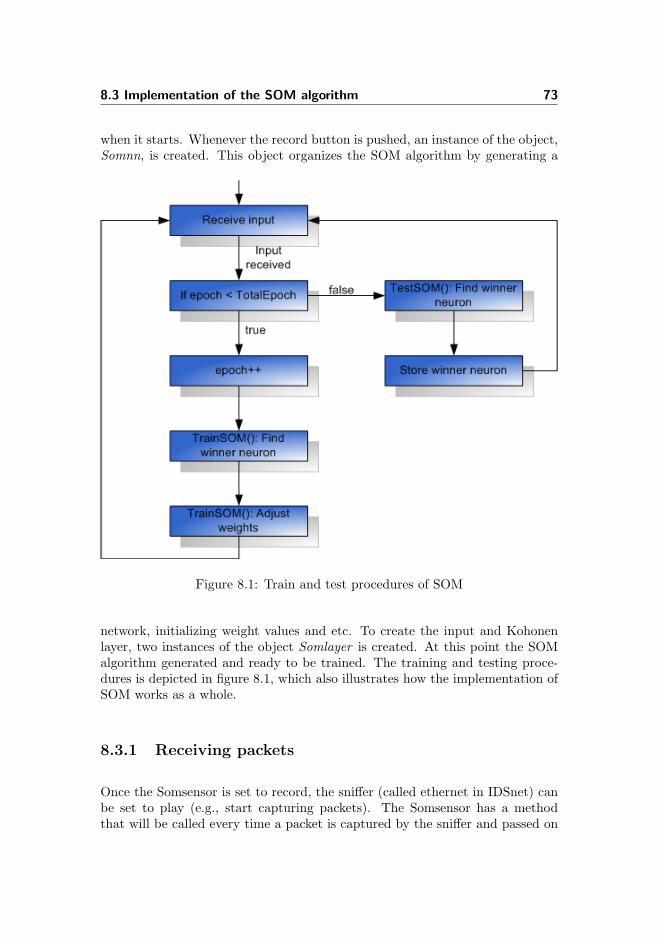
8.3 Implementation of the SOM algorithm 73
when it starts. Whenever the record button is pushed, an instance of the object,Somnn, is created. This object organizes the SOM algorithm by generating a
Figure 8.1: Train and test procedures of SOM
network, initializing weight values and etc. To create the input and Kohonenlayer, two instances of the object Somlayer is created. At this point the SOMalgorithm generated and ready to be trained. The training and testing proce-dures is depicted in figure 8.1, which also illustrates how the implementation ofSOM works as a whole.
8.3.1 Receiving packets
Once the Somsensor is set to record, the sniffer (called ethernet in IDSnet) canbe set to play (e.g., start capturing packets). The Somsensor has a methodthat will be called every time a packet is captured by the sniffer and passed on
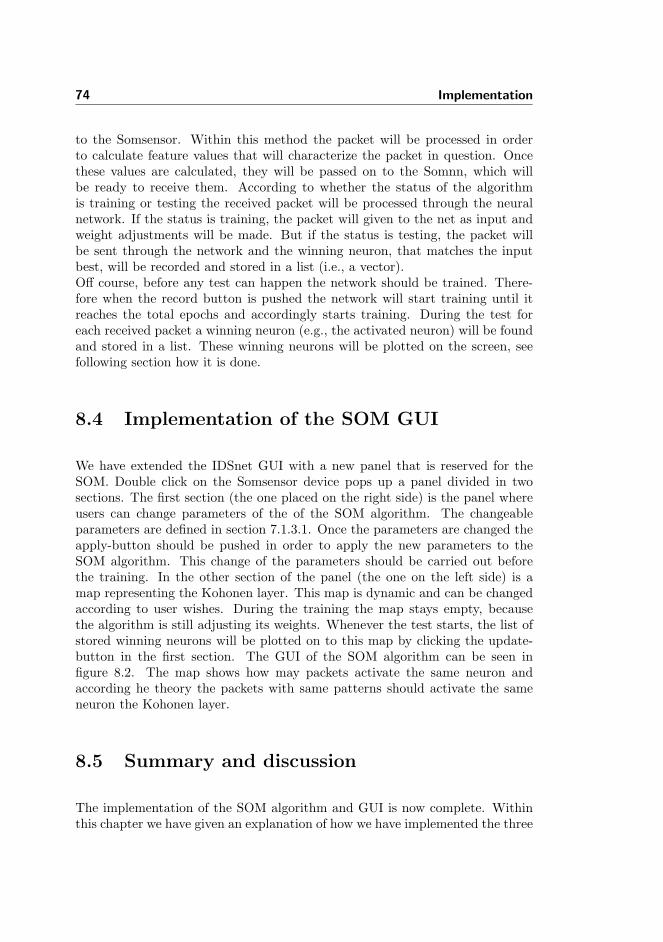
74 Implementation
to the Somsensor. Within this method the packet will be processed in orderto calculate feature values that will characterize the packet in question. Oncethese values are calculated, they will be passed on to the Somnn, which willbe ready to receive them. According to whether the status of the algorithmis training or testing the received packet will be processed through the neuralnetwork. If the status is training, the packet will given to the net as input andweight adjustments will be made. But if the status is testing, the packet willbe sent through the network and the winning neuron, that matches the inputbest, will be recorded and stored in a list (i.e., a vector).Off course, before any test can happen the network should be trained. There-fore when the record button is pushed the network will start training until itreaches the total epochs and accordingly starts training. During the test foreach received packet a winning neuron (e.g., the activated neuron) will be foundand stored in a list. These winning neurons will be plotted on the screen, seefollowing section how it is done.
8.4 Implementation of the SOM GUI
We have extended the IDSnet GUI with a new panel that is reserved for theSOM. Double click on the Somsensor device pops up a panel divided in twosections. The first section (the one placed on the right side) is the panel whereusers can change parameters of the of the SOM algorithm. The changeableparameters are defined in section 7.1.3.1. Once the parameters are changed theapply-button should be pushed in order to apply the new parameters to theSOM algorithm. This change of the parameters should be carried out beforethe training. In the other section of the panel (the one on the left side) is amap representing the Kohonen layer. This map is dynamic and can be changedaccording to user wishes. During the training the map stays empty, becausethe algorithm is still adjusting its weights. Whenever the test starts, the list ofstored winning neurons will be plotted on to this map by clicking the update-button in the first section. The GUI of the SOM algorithm can be seen infigure 8.2. The map shows how may packets activate the same neuron andaccording he theory the packets with same patterns should activate the sameneuron the Kohonen layer.
8.5 Summary and discussion
The implementation of the SOM algorithm and GUI is now complete. Withinthis chapter we have given an explanation of how we have implemented the three
8.5 Summary and discussion 75
Figure 8.2: The GUI of the SOM
parts without digging to much into the technical side. A brief introduction tothe implementation of the IDSnet was presented. A little note to this; as men-tioned a couple of times before getting familiar with the IDSnet project requiredmany hours of studying and editing. It is a complicated and huge project thatinvolves many theories and technologies and one has to know these theories asmuch as possible in order to extend the IDSnet program. Fortunately we havemanaged to gain enough knowledge about the IDSnet project and successfullyadded an extension. Once the knowledge was acquired it became easier and theimplementation of the classes of the SOM algorithm was realized.Roghly, we have described how we have implemented the algorithm and theGUI of the self-organizing map and in broad outline explained the ideas. TheIDSnet has been extended without any noticeable intervention to the originalcode and the original neural network and other parts of the IDSnet work fineas before. The IDSnet system has been a great tool to benefit from. It is openfor extensions and we have used this option to extend the IDSnet with a newneural network algorithm, a whole new feature to the system, which will makeit better and more flexible.During the implementation of the SOM it was intended to organize classes andobjects in the same way as in the IDSnet. We managed to realize this by copyingthe class and object structures whenever it was possible and ended up with anextension which does not violate with any concepts of the IDSnet system.

76 Implementation
Chapter 9
Test of IDSnet with SOM
In this chapter two areas of the implemented IDS will be tested. These areasare the functionality test and the efficiency test. For both cases an overall teststrategy will be formed that will aim for providing solid test result in order tomake any conclusions on our unsupervised intrusion detection system.
9.1 Test strategy
The first test, the functionality test, is a test where the system is looked at froma user’s view. Basic operations will be tested, primarily the GUI, to acknowl-edge that the program does what it is intended. The focus in this test will beon the SOM algorithm. It will be tested whether the implemented SOM deviceis fully operational with the IDSnet and that it can perform its task using thefacilities provided by the IDSnet. Furthermore the GUI of the SOM device willbe tested in order to confirm that the changes made in theOn the other test we will test the efficiency of the algorithm. The result ofthis test will give us an implication of how good and efficient the SOM algo-rithm works in connection with intrusion detection. This test will also give usa clue about whether the unsupervised algorithm has been a good choice or theimplementation of the algorithm is not complete. By this we mean that theimplementation of the SOM could need improvements, in terms of making the
78 Test of IDSnet with SOM
SOM more suitable to the task of intrusion detection. To achieve test resultsin this area we will use two data sets, where one of them is for training andwithout any intrusion and the other one is for testing having normal traffic datatogether with intrusions.
9.2 Functionality test
The functional test can be found in appendix B.
9.3 Efficiency test
With the efficiency test we aim to test the efficiency of the SOM algorithm interms of how well it performs in detecting intrusions. In order to do that twoscenarios will be described. But before the description of the scenarios we willintroduce a tool that will be used to create intrusion.
9.3.1 Nmap
Nmap [3] (Network Mapper) is a free and open source utility that is being usedfor network exploration and security auditing. It can perform scan on largenetworks and reveals what hosts are available, what services to those hosts areoffered, what operating system the host uses and etc. It is a sophisticated portscanner that sends raw IP packets to scan hosts.Altough Nmap is meant to be used for security reasons it is a common preludeto an intrusion attempt, a way of finding out if any vulnerable service is running.Hackers are easily tempted by the Nmap to quickly find out vulnerabilities on avictim host. Our intention is to use Nmap to perform port scan on a host, wherethe IDSnet program with SOM algorithm is running. The goal is to detect thisintrusion (e.g., port scan intrusion also known as PROBING) and see if the SOMalgorithm is capable of classifying the attack differently than normal traffic.
9.3.2 Description of the test
The test is carried out by collecting network traffic in two different data sets. Thefirst data set will consist of normal traffic. By normal we mean ordinary traffic
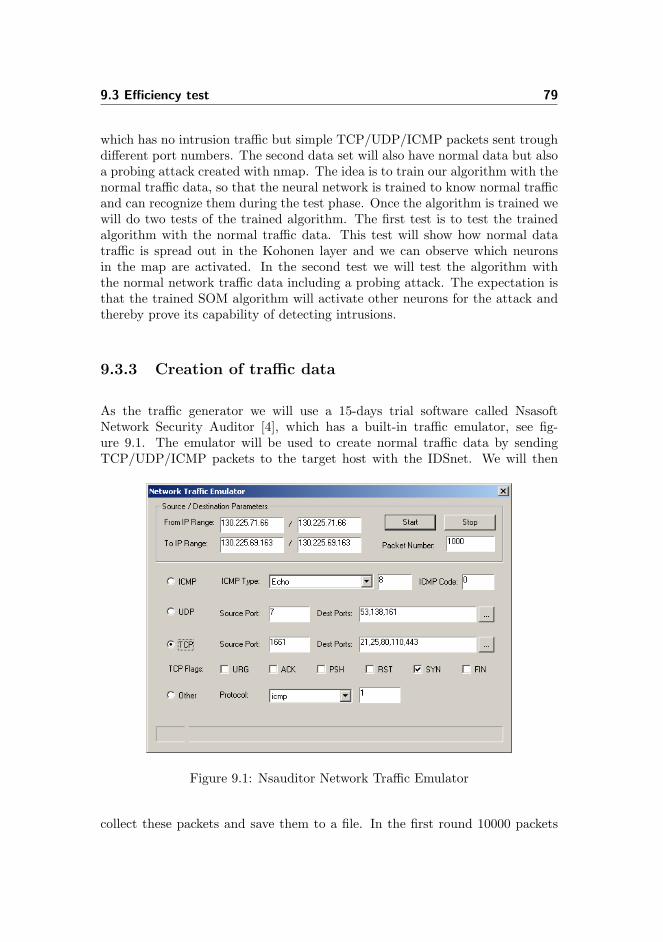
9.3 Efficiency test 79
which has no intrusion traffic but simple TCP/UDP/ICMP packets sent troughdifferent port numbers. The second data set will also have normal data but alsoa probing attack created with nmap. The idea is to train our algorithm with thenormal traffic data, so that the neural network is trained to know normal trafficand can recognize them during the test phase. Once the algorithm is trained wewill do two tests of the trained algorithm. The first test is to test the trainedalgorithm with the normal traffic data. This test will show how normal datatraffic is spread out in the Kohonen layer and we can observe which neuronsin the map are activated. In the second test we will test the algorithm withthe normal network traffic data including a probing attack. The expectation isthat the trained SOM algorithm will activate other neurons for the attack andthereby prove its capability of detecting intrusions.
9.3.3 Creation of traffic data
As the traffic generator we will use a 15-days trial software called NsasoftNetwork Security Auditor [4], which has a built-in traffic emulator, see fig-ure 9.1. The emulator will be used to create normal traffic data by sendingTCP/UDP/ICMP packets to the target host with the IDSnet. We will then
Figure 9.1: Nsauditor Network Traffic Emulator
collect these packets and save them to a file. In the first round 10000 packets
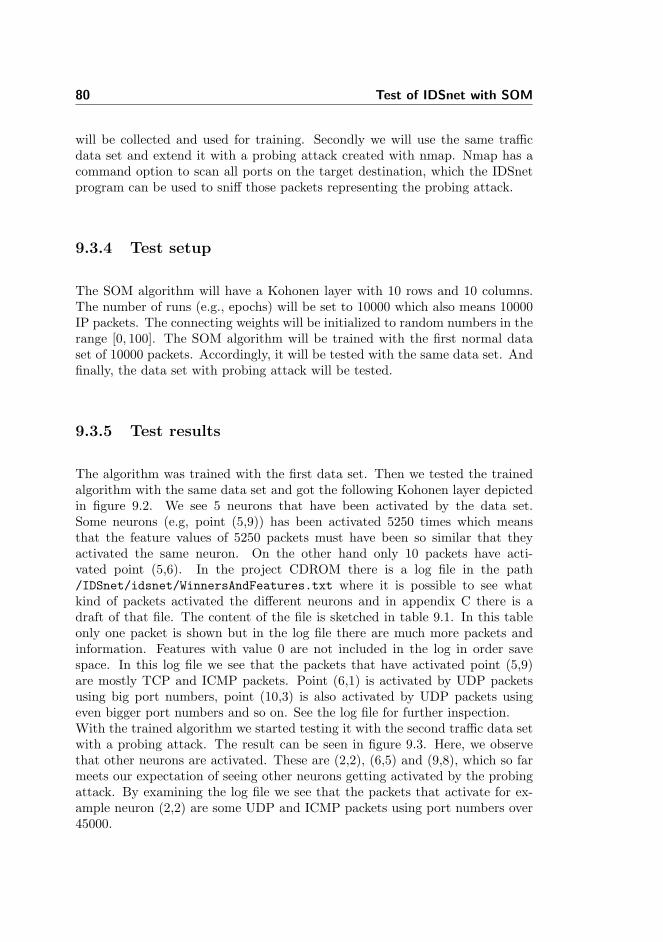
80 Test of IDSnet with SOM
will be collected and used for training. Secondly we will use the same trafficdata set and extend it with a probing attack created with nmap. Nmap has acommand option to scan all ports on the target destination, which the IDSnetprogram can be used to sniff those packets representing the probing attack.
9.3.4 Test setup
The SOM algorithm will have a Kohonen layer with 10 rows and 10 columns.The number of runs (e.g., epochs) will be set to 10000 which also means 10000IP packets. The connecting weights will be initialized to random numbers in therange [0, 100]. The SOM algorithm will be trained with the first normal dataset of 10000 packets. Accordingly, it will be tested with the same data set. Andfinally, the data set with probing attack will be tested.
9.3.5 Test results
The algorithm was trained with the first data set. Then we tested the trainedalgorithm with the same data set and got the following Kohonen layer depictedin figure 9.2. We see 5 neurons that have been activated by the data set.Some neurons (e.g, point (5,9)) has been activated 5250 times which meansthat the feature values of 5250 packets must have been so similar that theyactivated the same neuron. On the other hand only 10 packets have acti-vated point (5,6). In the project CDROM there is a log file in the path/IDSnet/idsnet/WinnersAndFeatures.txt where it is possible to see whatkind of packets activated the different neurons and in appendix C there is adraft of that file. The content of the file is sketched in table 9.1. In this tableonly one packet is shown but in the log file there are much more packets andinformation. Features with value 0 are not included in the log in order savespace. In this log file we see that the packets that have activated point (5,9)are mostly TCP and ICMP packets. Point (6,1) is activated by UDP packetsusing big port numbers, point (10,3) is also activated by UDP packets usingeven bigger port numbers and so on. See the log file for further inspection.With the trained algorithm we started testing it with the second traffic data setwith a probing attack. The result can be seen in figure 9.3. Here, we observethat other neurons are activated. These are (2,2), (6,5) and (9,8), which so farmeets our expectation of seeing other neurons getting activated by the probingattack. By examining the log file we see that the packets that activate for ex-ample neuron (2,2) are some UDP and ICMP packets using port numbers over45000.
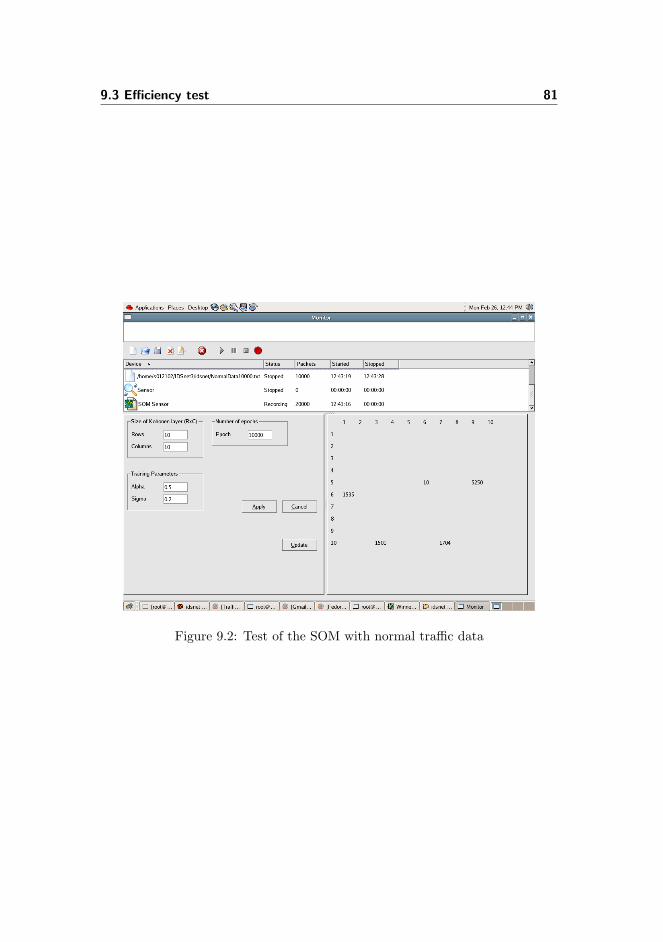
9.3 Efficiency test 81
Figure 9.2: Test of the SOM with normal traffic data
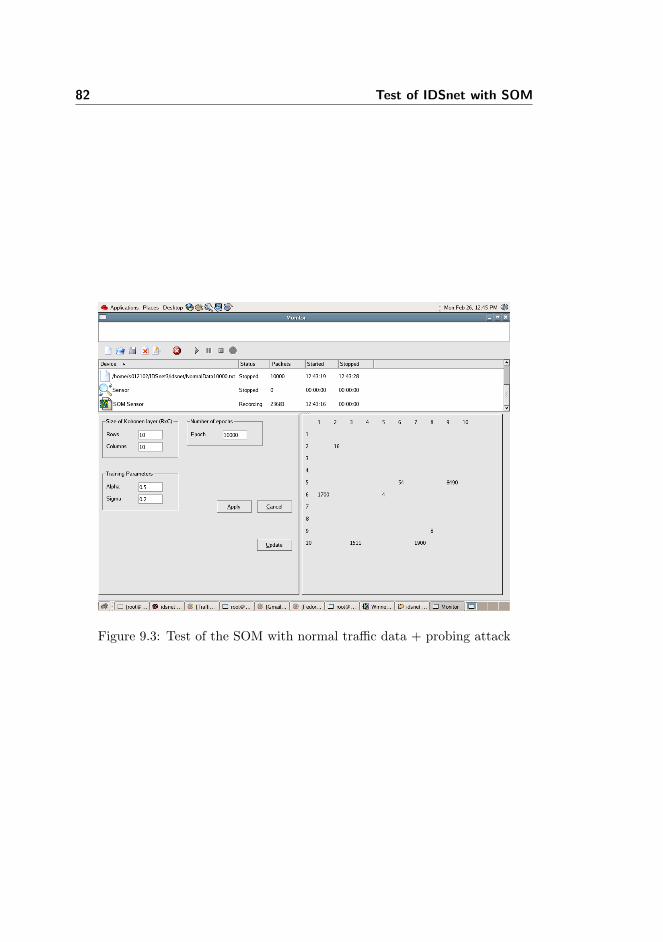
82 Test of IDSnet with SOM
Figure 9.3: Test of the SOM with normal traffic data + probing attack
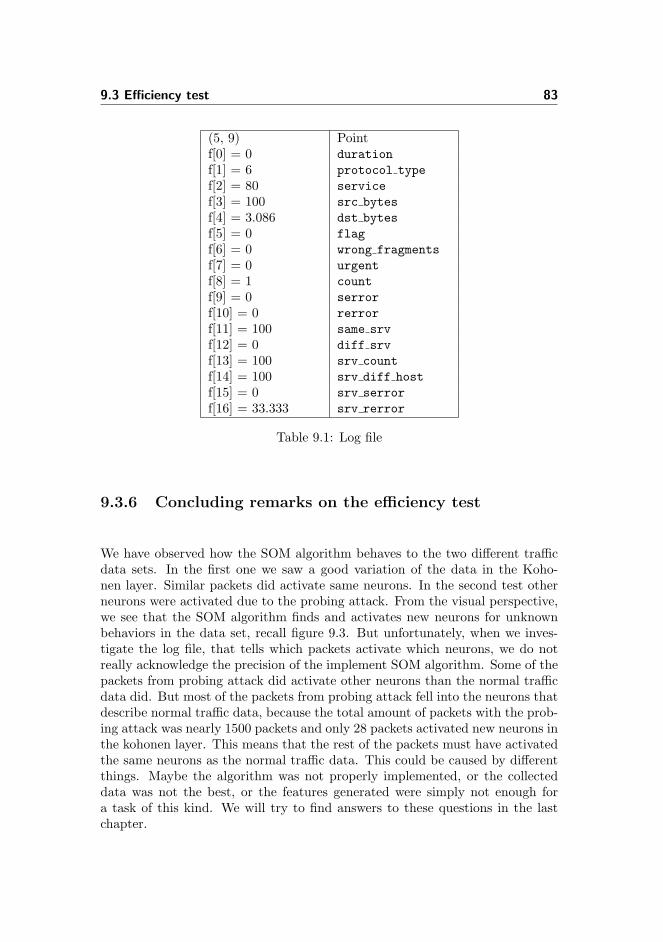
9.3 Efficiency test 83
(5, 9) Pointf[0] = 0 durationf[1] = 6 protocol typef[2] = 80 servicef[3] = 100 src bytesf[4] = 3.086 dst bytesf[5] = 0 flagf[6] = 0 wrong fragmentsf[7] = 0 urgentf[8] = 1 countf[9] = 0 serrorf[10] = 0 rerrorf[11] = 100 same srvf[12] = 0 diff srvf[13] = 100 srv countf[14] = 100 srv diff hostf[15] = 0 srv serrorf[16] = 33.333 srv rerror
Table 9.1: Log file
9.3.6 Concluding remarks on the efficiency test
We have observed how the SOM algorithm behaves to the two different trafficdata sets. In the first one we saw a good variation of the data in the Koho-nen layer. Similar packets did activate same neurons. In the second test otherneurons were activated due to the probing attack. From the visual perspective,we see that the SOM algorithm finds and activates new neurons for unknownbehaviors in the data set, recall figure 9.3. But unfortunately, when we inves-tigate the log file, that tells which packets activate which neurons, we do notreally acknowledge the precision of the implement SOM algorithm. Some of thepackets from probing attack did activate other neurons than the normal trafficdata did. But most of the packets from probing attack fell into the neurons thatdescribe normal traffic data, because the total amount of packets with the prob-ing attack was nearly 1500 packets and only 28 packets activated new neurons inthe kohonen layer. This means that the rest of the packets must have activatedthe same neurons as the normal traffic data. This could be caused by differentthings. Maybe the algorithm was not properly implemented, or the collecteddata was not the best, or the features generated were simply not enough fora task of this kind. We will try to find answers to these questions in the lastchapter.
84 Test of IDSnet with SOM
9.4 Summary and discussion
In this chapter we have made tests of the IDSnet program with the SOM algo-rithm. The first test was a functional test, that proved the (mostly graphical)functionalities of the SOM algorithm to be working well. The efficiency testaimed to show the precision of the SOM algorithm and how data is classified inthe Kohonen layer. The results showed that the algorithm somehow failed toclassify the probing attack as it classified the packets representing the probingattack together with the normal traffic data. However, on the visual plan wedid see that new behaviors were detected and to some degree the SOM couldidentify the probing attack. In order to fully understand how the implementedSOM algorithm works, the log file containing information about features valuesof the packets must be examined carefully. And in this file we see that mostof the packets of the probing attack were similar to the packets of normal traf-fic data. This is probably the reason for classifying packets of probing attacktogether with packets of normal traffic.
Chapter 10
Concluding remarks
In this chapter we will summarize the achievements we have obtained in thisproject describing them whether they have been successful or not.
10.1 The SOM algorithm
We have in this project investigated 3 different unsupervised neural networkalgorithms. Based on what we have read in various articles about these algo-rithms and the research we have made in chapter 4 we decided to implementthe self-organizing map as the learning algorithm. The implementation of thealgorithm was successful, however, the efficiency test did not really confirmedthe precision of the algorithm. We were able to observe how the SOM algorithmperformed during the test and could also see that it was capable of detectingnew behaviors. But during the test most of the intrusion packets activatedthe same neuron as the normal traffic, which shouldn’t happen. One reason-able explanation to this could be that the implemented SOM algorithm was notproperly implemented. With this we mean that the implemented algorithm maynot have been specified precisely to handle such a task. An investigation of theimplemented algorithm could maybe reveal the need for enhancements in theimplementation. But we have a strong feeling that the problem lies with the
86 Concluding remarks
features (see following sections). As conclusion to the choice of the SOM algo-rithm we may say that it has been a reasonable choice, which was mostly basedon the articles and the properties that came with the SOM. Surely, this choicecould have been more justified if we had implemented the other algorithms aswell and compared their efficiencies.
10.2 Working with the IDSnet
We have been given an intrusion detection system program called IDSnet, whichis a project prepared by former students at IMM. The good thing about thisprogram was that it had implemented a packet sniffer and could construct fea-tures from those packets, which we needed for the preparation of our project.But the IDSnet program was very difficult getting familiar with due to its com-plexity and many lines of code. Unfortunately, the familiarization process costus many days and we had hard time extending the IDSnet. Making the pro-gram run did also caused us troubles. Finding the right packages and installingthem took long time. Once the packages were installed we discovered some bugsin the code. We didn’t expect such problems when we started working on thecode, but we kept working on it and tried to solve the problems as they startedappearing. The motive power for continuing working on the IDSnet was thepreimplemented tools that we could use for our project and to end up with anIDSnet program, that would have two different neural networks implementedthat could be used for intrusion detection. As conclusion, we did extend the ID-Snet program with a new neural network algorithm but unfortunately it seemsthat it still needs some work.
10.3 Network features
The network features we have defined in this project was aimed to be as generalas possible. We have defined 17 features in total and they all are identicalto some of the features defined by Lee and Stolfo [16]. The features definedin the original IDSnet program were also identical to the features of Lee andStolfo. Therefore we decided to use these features without really digging intothe complex code. We saw in the efficiency test (e.g., in the log file) thatmany of the features were the same for most of the packets. This might bethe reason to the problem with the clustering in the SOM algorithm. And itis also obvious, packets with similar feature values activate the same neuron.One reason as explanation to this could be that the features are maybe notcalculated correctly or maybe not calculated as we intended in this project. We

10.4 Remarks on project progress 87
did trust the IDSnet program with regard to the feature value calculations andby the time we got suspicious about this situation, it was to late to investigatethe code responsible for feature values calculations. However, this is only aqualified guess and does not need to be correct.Due to time pressure, we did not manage to implement other features like theones described in section 5.3.5. It could have been a worthy effort if we triedto implement those features and some more in order widen the list of generalfeatures.
10.4 Remarks on project progress
The developed intrusion detection system was intended to be used in a GRIDenvironment. It was also intended to investigate what kind of network vulner-abilities there are for the GRID system and construct GRID-related featuresto detect the attacks that occur in the GRID. However, we did not manage torealize that due to the time pressure.As concluding remark to the project we may say that it has been truly excitingand fascinating working with this project. It is an open project covering a widerange of subjects and there are a lot of extension possibilities. We did manageto cover the necessary theoretical fields and tried to give reasons for our choicesas explanatory as possible. It is though a bit annoying that we didn’t get fullysatisfying test results to justify our work and choices in the project. But we aresure that is not insoluble and with further inspection, it would be possible tofix these and achieve a better result.

88 Concluding remarks

Appendix A
User manual
We present a manual for the SOM algorithm part implemented in the IDSnetprogram.
SomsensorA somsensor is an input device and represents the self-organizing algorithm inthe IDSnet program. It’s task is to receive packets from an output device andmake an analysis to set up a network model. The somsensor will be ready toreceive packets when the Record button is pushed.
When the IDSnet is started, a somsensor device together with an ethernet andsensor device are created by default. By double click on the somsensor device,a panel will pop up from the button of the screen (sometimes the panel gets’stuck’, and you may need to scroll the pane up manually).
Somsensor panelIn the somsensor panel changes can be made to the learning algorithm. In theleft section you can design your own algorithm by giving new values to some ofthe variables of the algorithm. Once the new values are defined, they will beapplied to the algorithm when the Apply button is pushed. The Cancel buttonwill close the somsensor panel.
Training and testing
90 User manual
The somsensor can start the training when the somsensor device is selected andthe Record button is pushed. It will only collect IP packets of type TCP, UDPand ICMP from an output device. Once the collected packets equal or exceedthe number of epochs defined in somsensor panel, the somsensor device auto-matically starts testing and the Update button in the left section gets enabled.By pushing the update button, the collected packets that have been tested withthe trained algorithm, will be plotted in the right section of the somsensor panel,which represents the Kohonen layer of the algorithm. The training/testing canbe stopped by pushing the Stop button.

Appendix B
Functional test
Below is a list of basic operations, which will be tested.
• Program start. Test of program start to observe the SOM algorithm(known as Somsensor in the IDSnet program) is also initiated and availableon the main screen
• Record/stop/clear operation. Test of Somsensor device with the basic op-erations and see if the status of the Somsensor changes
• Training and testing. Test of training and testing of the Somsensor. Ob-serve whether packets are received by the Somsensor and are processed.
• The GUI of the SOM. It will be tested to see that the GUI of the SOMworks (e.g., the changed parameters are applied)
These tests will help us to find out if the functionalities are operational regardingthe GUI.
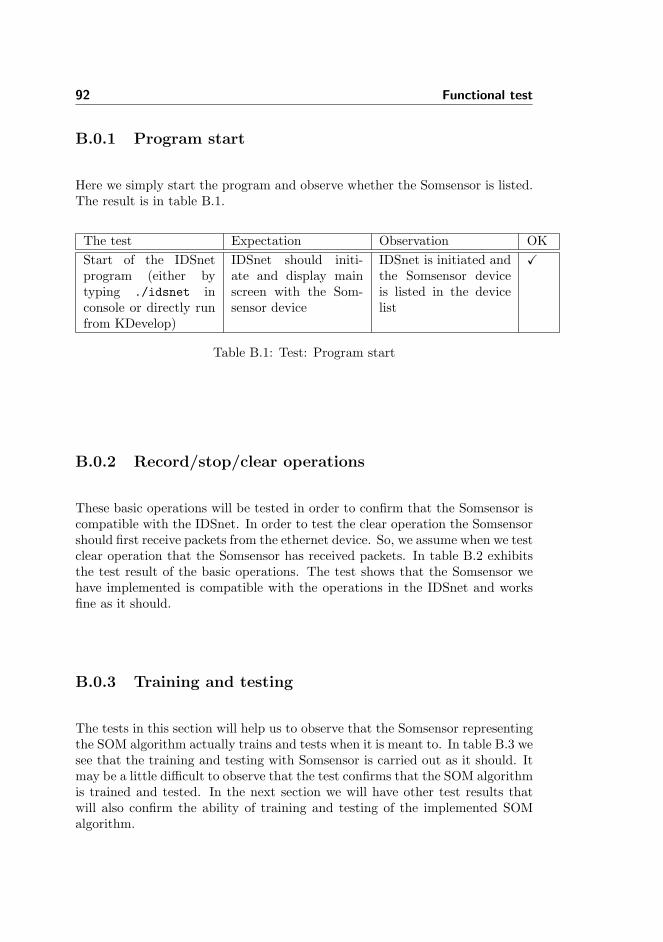
92 Functional test
B.0.1 Program start
Here we simply start the program and observe whether the Somsensor is listed.The result is in table B.1.
The test Expectation Observation OKStart of the IDSnetprogram (either bytyping ./idsnet inconsole or directly runfrom KDevelop)
IDSnet should initi-ate and display mainscreen with the Som-sensor device
IDSnet is initiated andthe Somsensor deviceis listed in the devicelist
X
Table B.1: Test: Program start
B.0.2 Record/stop/clear operations
These basic operations will be tested in order to confirm that the Somsensor iscompatible with the IDSnet. In order to test the clear operation the Somsensorshould first receive packets from the ethernet device. So, we assume when we testclear operation that the Somsensor has received packets. In table B.2 exhibitsthe test result of the basic operations. The test shows that the Somsensor wehave implemented is compatible with the operations in the IDSnet and worksfine as it should.
B.0.3 Training and testing
The tests in this section will help us to observe that the Somsensor representingthe SOM algorithm actually trains and tests when it is meant to. In table B.3 wesee that the training and testing with Somsensor is carried out as it should. Itmay be a little difficult to observe that the test confirms that the SOM algorithmis trained and tested. In the next section we will have other test results thatwill also confirm the ability of training and testing of the implemented SOMalgorithm.
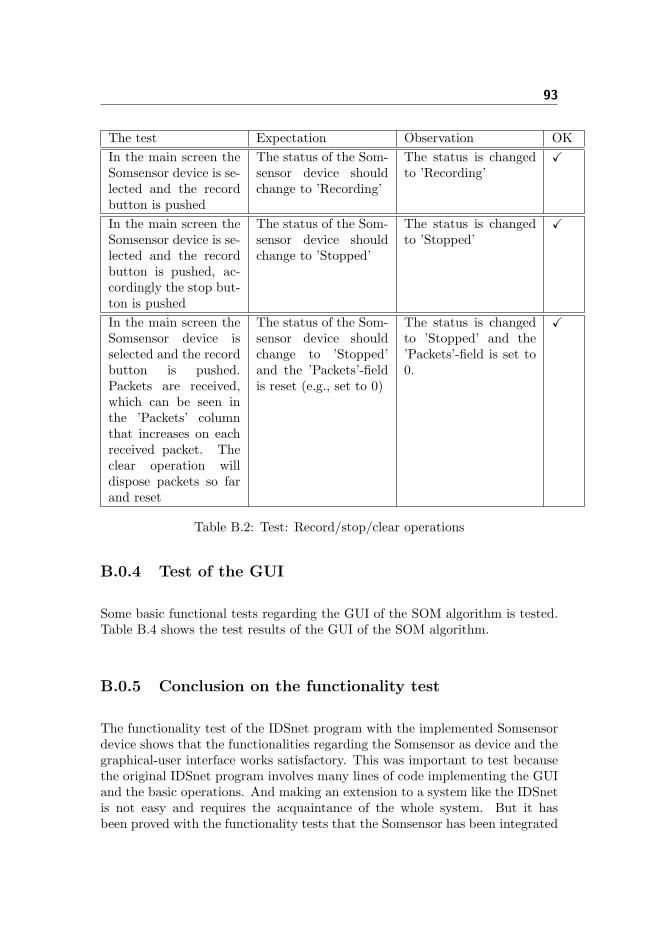
93
The test Expectation Observation OKIn the main screen theSomsensor device is se-lected and the recordbutton is pushed
The status of the Som-sensor device shouldchange to ’Recording’
The status is changedto ’Recording’
X
In the main screen theSomsensor device is se-lected and the recordbutton is pushed, ac-cordingly the stop but-ton is pushed
The status of the Som-sensor device shouldchange to ’Stopped’
The status is changedto ’Stopped’
X
In the main screen theSomsensor device isselected and the recordbutton is pushed.Packets are received,which can be seen inthe ’Packets’ columnthat increases on eachreceived packet. Theclear operation willdispose packets so farand reset
The status of the Som-sensor device shouldchange to ’Stopped’and the ’Packets’-fieldis reset (e.g., set to 0)
The status is changedto ’Stopped’ and the’Packets’-field is set to0.
X
Table B.2: Test: Record/stop/clear operations
B.0.4 Test of the GUI
Some basic functional tests regarding the GUI of the SOM algorithm is tested.Table B.4 shows the test results of the GUI of the SOM algorithm.
B.0.5 Conclusion on the functionality test
The functionality test of the IDSnet program with the implemented Somsensordevice shows that the functionalities regarding the Somsensor as device and thegraphical-user interface works satisfactory. This was important to test becausethe original IDSnet program involves many lines of code implementing the GUIand the basic operations. And making an extension to a system like the IDSnetis not easy and requires the acquaintance of the whole system. But it hasbeen proved with the functionality tests that the Somsensor has been integrated
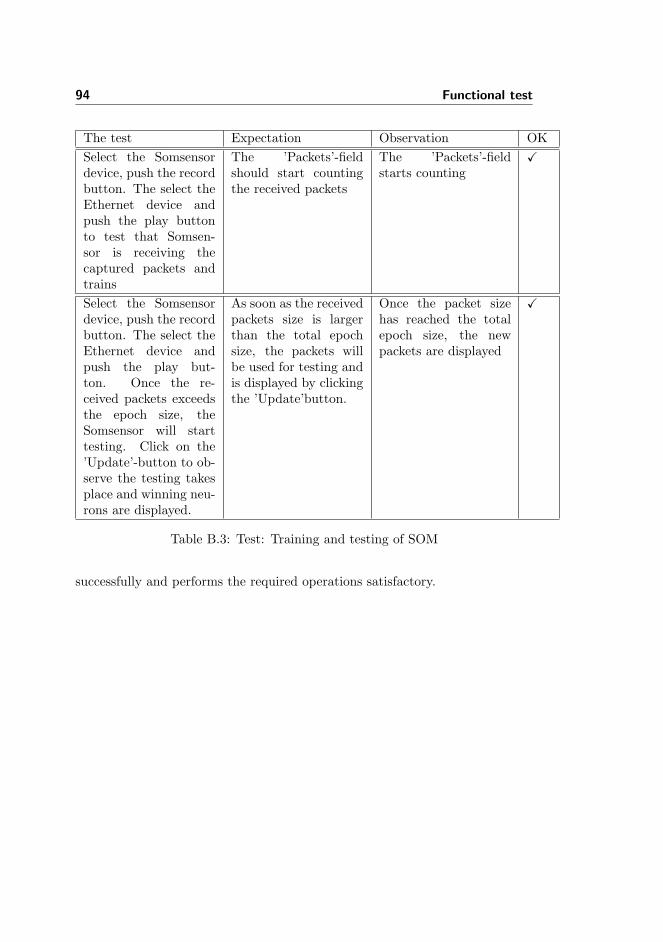
94 Functional test
The test Expectation Observation OKSelect the Somsensordevice, push the recordbutton. The select theEthernet device andpush the play buttonto test that Somsen-sor is receiving thecaptured packets andtrains
The ’Packets’-fieldshould start countingthe received packets
The ’Packets’-fieldstarts counting
X
Select the Somsensordevice, push the recordbutton. The select theEthernet device andpush the play but-ton. Once the re-ceived packets exceedsthe epoch size, theSomsensor will starttesting. Click on the’Update’-button to ob-serve the testing takesplace and winning neu-rons are displayed.
As soon as the receivedpackets size is largerthan the total epochsize, the packets willbe used for testing andis displayed by clickingthe ’Update’button.
Once the packet sizehas reached the totalepoch size, the newpackets are displayed
X
Table B.3: Test: Training and testing of SOM
successfully and performs the required operations satisfactory.
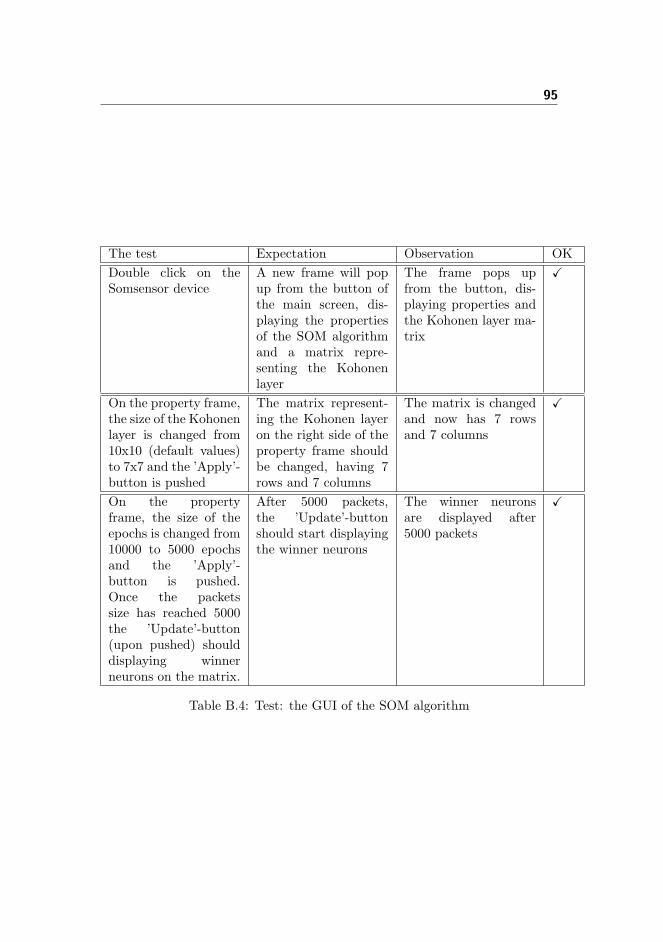
95
The test Expectation Observation OKDouble click on theSomsensor device
A new frame will popup from the button ofthe main screen, dis-playing the propertiesof the SOM algorithmand a matrix repre-senting the Kohonenlayer
The frame pops upfrom the button, dis-playing properties andthe Kohonen layer ma-trix
X
On the property frame,the size of the Kohonenlayer is changed from10x10 (default values)to 7x7 and the ’Apply’-button is pushed
The matrix represent-ing the Kohonen layeron the right side of theproperty frame shouldbe changed, having 7rows and 7 columns
The matrix is changedand now has 7 rowsand 7 columns
X
On the propertyframe, the size of theepochs is changed from10000 to 5000 epochsand the ’Apply’-button is pushed.Once the packetssize has reached 5000the ’Update’-button(upon pushed) shoulddisplaying winnerneurons on the matrix.
After 5000 packets,the ’Update’-buttonshould start displayingthe winner neurons
The winner neuronsare displayed after5000 packets
X
Table B.4: Test: the GUI of the SOM algorithm

96 Functional test
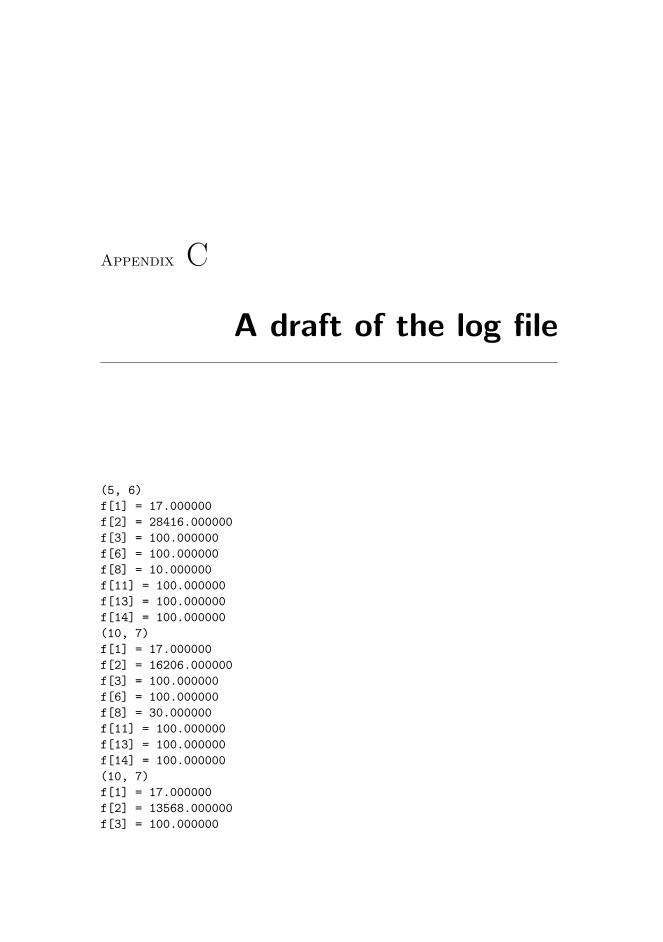
Appendix C
A draft of the log file
(5, 6)f[1] = 17.000000f[2] = 28416.000000f[3] = 100.000000f[6] = 100.000000f[8] = 10.000000f[11] = 100.000000f[13] = 100.000000f[14] = 100.000000(10, 7)f[1] = 17.000000f[2] = 16206.000000f[3] = 100.000000f[6] = 100.000000f[8] = 30.000000f[11] = 100.000000f[13] = 100.000000f[14] = 100.000000(10, 7)f[1] = 17.000000f[2] = 13568.000000f[3] = 100.000000
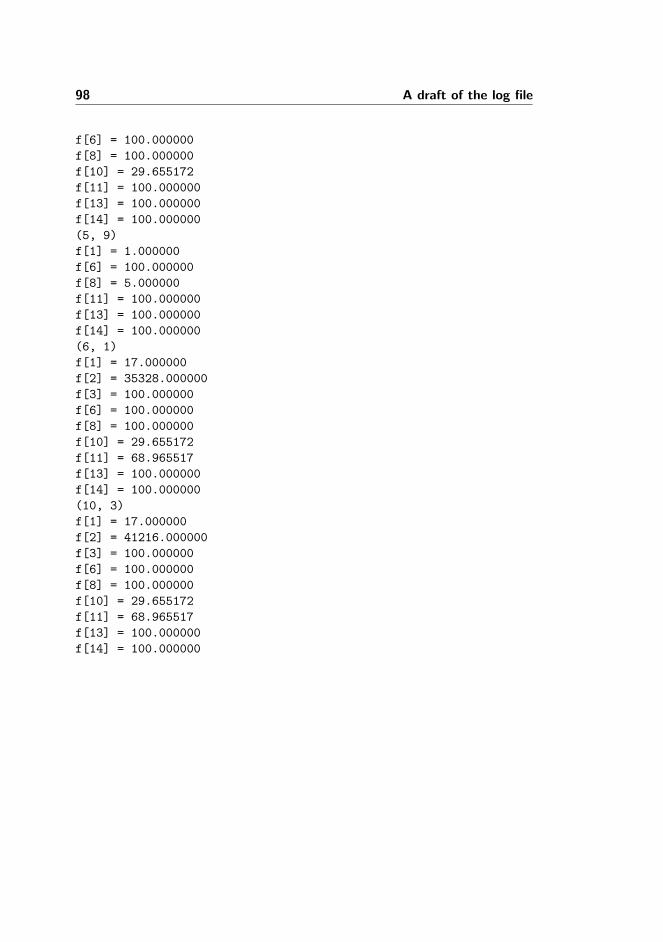
98 A draft of the log file
f[6] = 100.000000f[8] = 100.000000f[10] = 29.655172f[11] = 100.000000f[13] = 100.000000f[14] = 100.000000(5, 9)f[1] = 1.000000f[6] = 100.000000f[8] = 5.000000f[11] = 100.000000f[13] = 100.000000f[14] = 100.000000(6, 1)f[1] = 17.000000f[2] = 35328.000000f[3] = 100.000000f[6] = 100.000000f[8] = 100.000000f[10] = 29.655172f[11] = 68.965517f[13] = 100.000000f[14] = 100.000000(10, 3)f[1] = 17.000000f[2] = 41216.000000f[3] = 100.000000f[6] = 100.000000f[8] = 100.000000f[10] = 29.655172f[11] = 68.965517f[13] = 100.000000f[14] = 100.000000
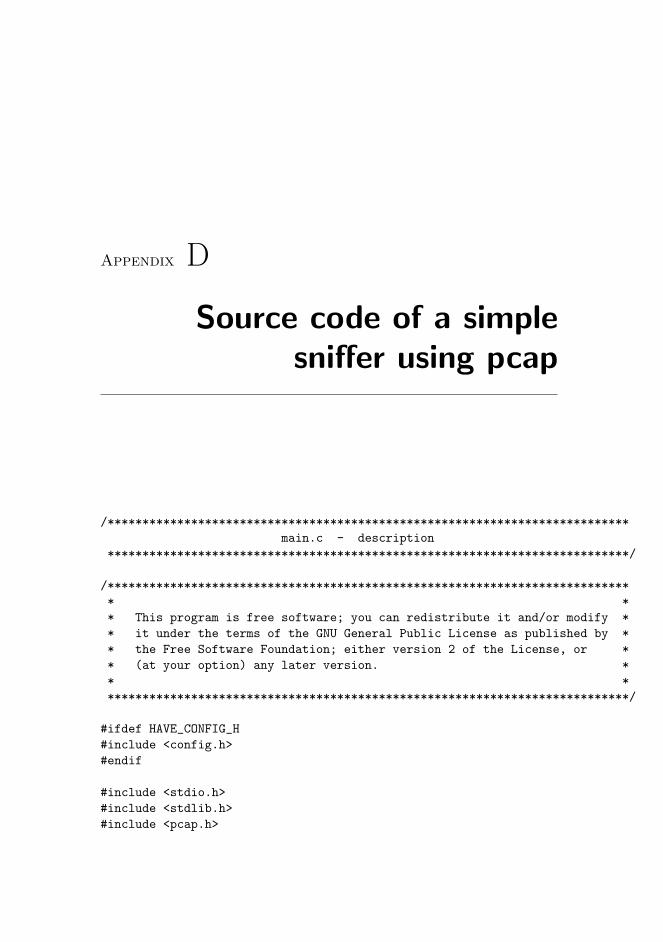
Appendix D
Source code of a simplesniffer using pcap
/***************************************************************************main.c - description
***************************************************************************/
/**************************************************************************** ** This program is free software; you can redistribute it and/or modify ** it under the terms of the GNU General Public License as published by ** the Free Software Foundation; either version 2 of the License, or ** (at your option) any later version. ** ****************************************************************************/
#ifdef HAVE_CONFIG_H#include <config.h>#endif
#include <stdio.h>#include <stdlib.h>#include <pcap.h>
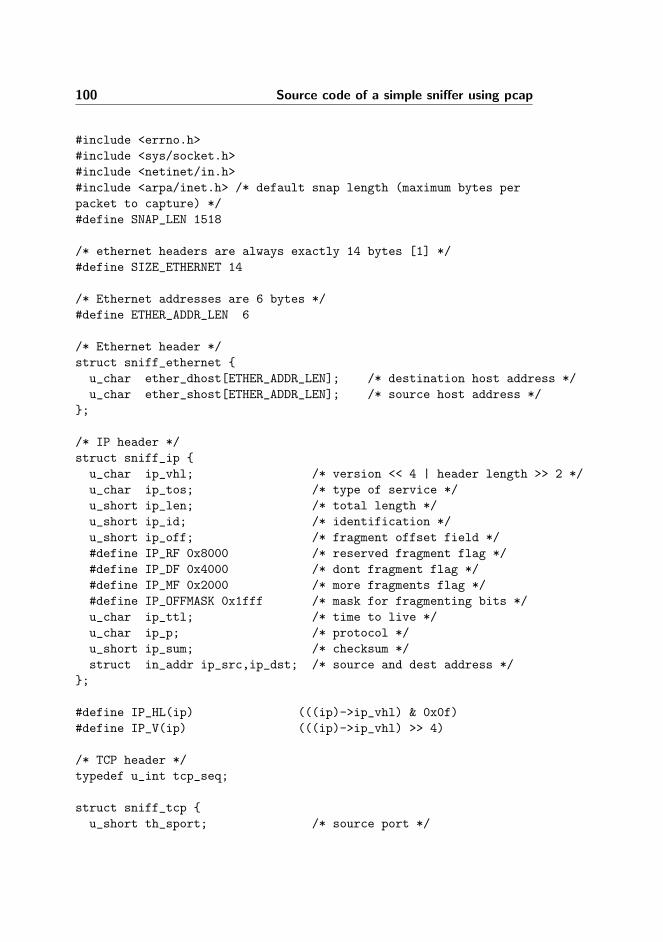
100 Source code of a simple sniffer using pcap
#include <errno.h>#include <sys/socket.h>#include <netinet/in.h>#include <arpa/inet.h> /* default snap length (maximum bytes perpacket to capture) */#define SNAP_LEN 1518
/* ethernet headers are always exactly 14 bytes [1] */#define SIZE_ETHERNET 14
/* Ethernet addresses are 6 bytes */#define ETHER_ADDR_LEN 6
/* Ethernet header */struct sniff_ethernet {u_char ether_dhost[ETHER_ADDR_LEN]; /* destination host address */u_char ether_shost[ETHER_ADDR_LEN]; /* source host address */
};
/* IP header */struct sniff_ip {u_char ip_vhl; /* version << 4 | header length >> 2 */u_char ip_tos; /* type of service */u_short ip_len; /* total length */u_short ip_id; /* identification */u_short ip_off; /* fragment offset field */#define IP_RF 0x8000 /* reserved fragment flag */#define IP_DF 0x4000 /* dont fragment flag */#define IP_MF 0x2000 /* more fragments flag */#define IP_OFFMASK 0x1fff /* mask for fragmenting bits */u_char ip_ttl; /* time to live */u_char ip_p; /* protocol */u_short ip_sum; /* checksum */struct in_addr ip_src,ip_dst; /* source and dest address */
};
#define IP_HL(ip) (((ip)->ip_vhl) & 0x0f)#define IP_V(ip) (((ip)->ip_vhl) >> 4)
/* TCP header */typedef u_int tcp_seq;
struct sniff_tcp {u_short th_sport; /* source port */
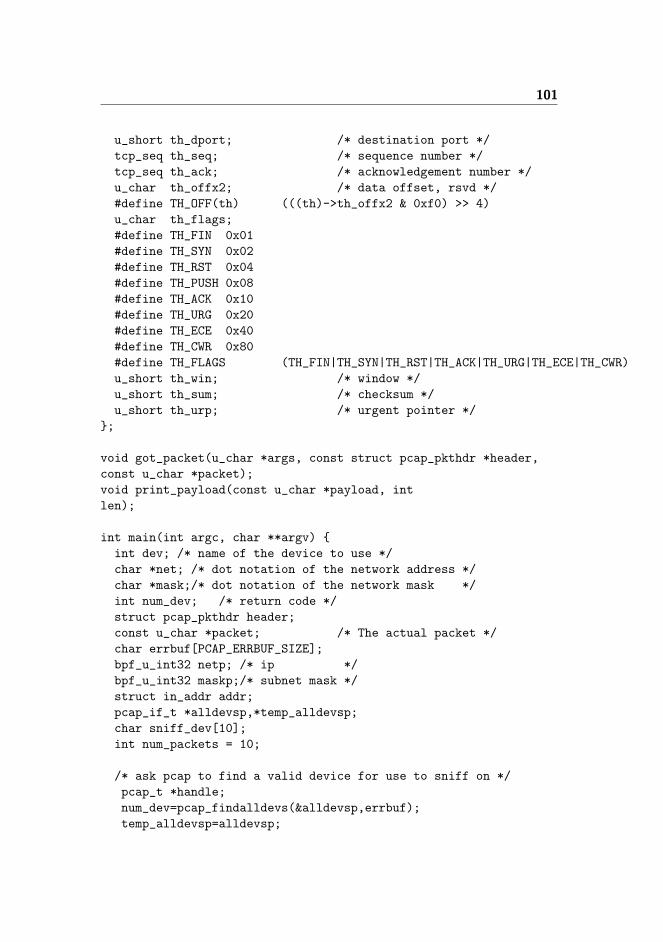
101
u_short th_dport; /* destination port */tcp_seq th_seq; /* sequence number */tcp_seq th_ack; /* acknowledgement number */u_char th_offx2; /* data offset, rsvd */#define TH_OFF(th) (((th)->th_offx2 & 0xf0) >> 4)u_char th_flags;#define TH_FIN 0x01#define TH_SYN 0x02#define TH_RST 0x04#define TH_PUSH 0x08#define TH_ACK 0x10#define TH_URG 0x20#define TH_ECE 0x40#define TH_CWR 0x80#define TH_FLAGS (TH_FIN|TH_SYN|TH_RST|TH_ACK|TH_URG|TH_ECE|TH_CWR)u_short th_win; /* window */u_short th_sum; /* checksum */u_short th_urp; /* urgent pointer */
};
void got_packet(u_char *args, const struct pcap_pkthdr *header,const u_char *packet);void print_payload(const u_char *payload, intlen);
int main(int argc, char **argv) {int dev; /* name of the device to use */char *net; /* dot notation of the network address */char *mask;/* dot notation of the network mask */int num_dev; /* return code */struct pcap_pkthdr header;const u_char *packet; /* The actual packet */char errbuf[PCAP_ERRBUF_SIZE];bpf_u_int32 netp; /* ip */bpf_u_int32 maskp;/* subnet mask */struct in_addr addr;pcap_if_t *alldevsp,*temp_alldevsp;char sniff_dev[10];int num_packets = 10;
/* ask pcap to find a valid device for use to sniff on */pcap_t *handle;num_dev=pcap_findalldevs(&alldevsp,errbuf);temp_alldevsp=alldevsp;
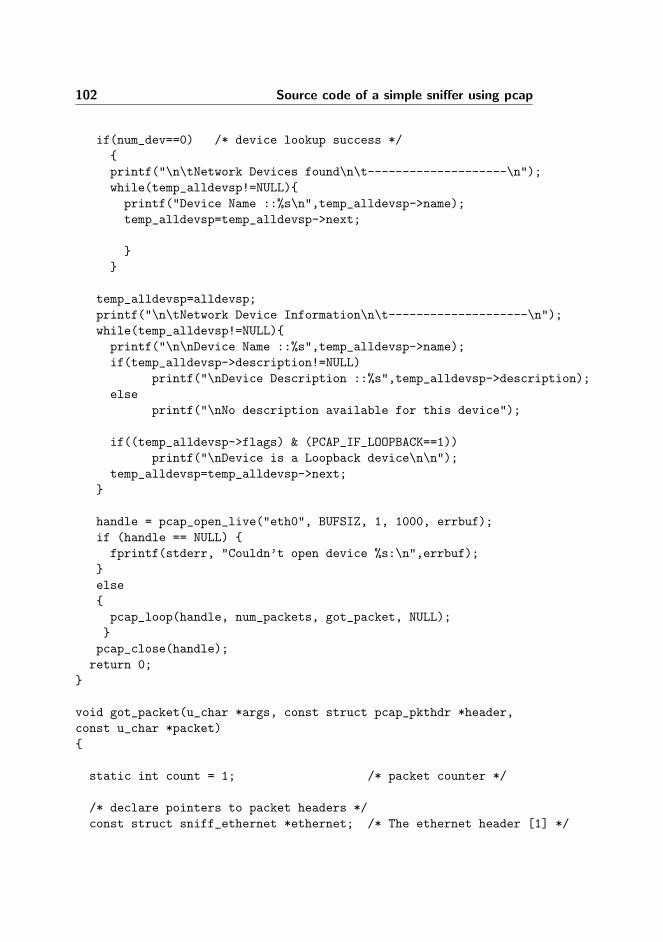
102 Source code of a simple sniffer using pcap
if(num_dev==0) /* device lookup success */{printf("\n\tNetwork Devices found\n\t--------------------\n");while(temp_alldevsp!=NULL){printf("Device Name ::%s\n",temp_alldevsp->name);temp_alldevsp=temp_alldevsp->next;
}}
temp_alldevsp=alldevsp;printf("\n\tNetwork Device Information\n\t--------------------\n");while(temp_alldevsp!=NULL){printf("\n\nDevice Name ::%s",temp_alldevsp->name);if(temp_alldevsp->description!=NULL)
printf("\nDevice Description ::%s",temp_alldevsp->description);else
printf("\nNo description available for this device");
if((temp_alldevsp->flags) & (PCAP_IF_LOOPBACK==1))printf("\nDevice is a Loopback device\n\n");
temp_alldevsp=temp_alldevsp->next;}
handle = pcap_open_live("eth0", BUFSIZ, 1, 1000, errbuf);if (handle == NULL) {fprintf(stderr, "Couldn’t open device %s:\n",errbuf);
}else{pcap_loop(handle, num_packets, got_packet, NULL);
}pcap_close(handle);return 0;
}
void got_packet(u_char *args, const struct pcap_pkthdr *header,const u_char *packet){
static int count = 1; /* packet counter */
/* declare pointers to packet headers */const struct sniff_ethernet *ethernet; /* The ethernet header [1] */
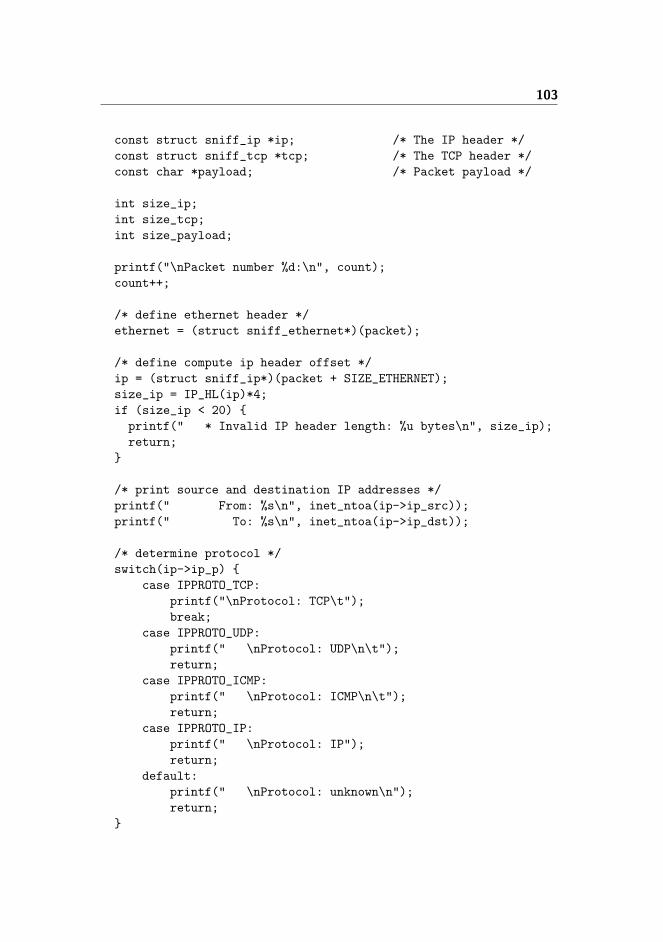
103
const struct sniff_ip *ip; /* The IP header */const struct sniff_tcp *tcp; /* The TCP header */const char *payload; /* Packet payload */
int size_ip;int size_tcp;int size_payload;
printf("\nPacket number %d:\n", count);count++;
/* define ethernet header */ethernet = (struct sniff_ethernet*)(packet);
/* define compute ip header offset */ip = (struct sniff_ip*)(packet + SIZE_ETHERNET);size_ip = IP_HL(ip)*4;if (size_ip < 20) {printf(" * Invalid IP header length: %u bytes\n", size_ip);return;
}
/* print source and destination IP addresses */printf(" From: %s\n", inet_ntoa(ip->ip_src));printf(" To: %s\n", inet_ntoa(ip->ip_dst));
/* determine protocol */switch(ip->ip_p) {
case IPPROTO_TCP:printf("\nProtocol: TCP\t");break;
case IPPROTO_UDP:printf(" \nProtocol: UDP\n\t");return;
case IPPROTO_ICMP:printf(" \nProtocol: ICMP\n\t");return;
case IPPROTO_IP:printf(" \nProtocol: IP");return;
default:printf(" \nProtocol: unknown\n");return;
}
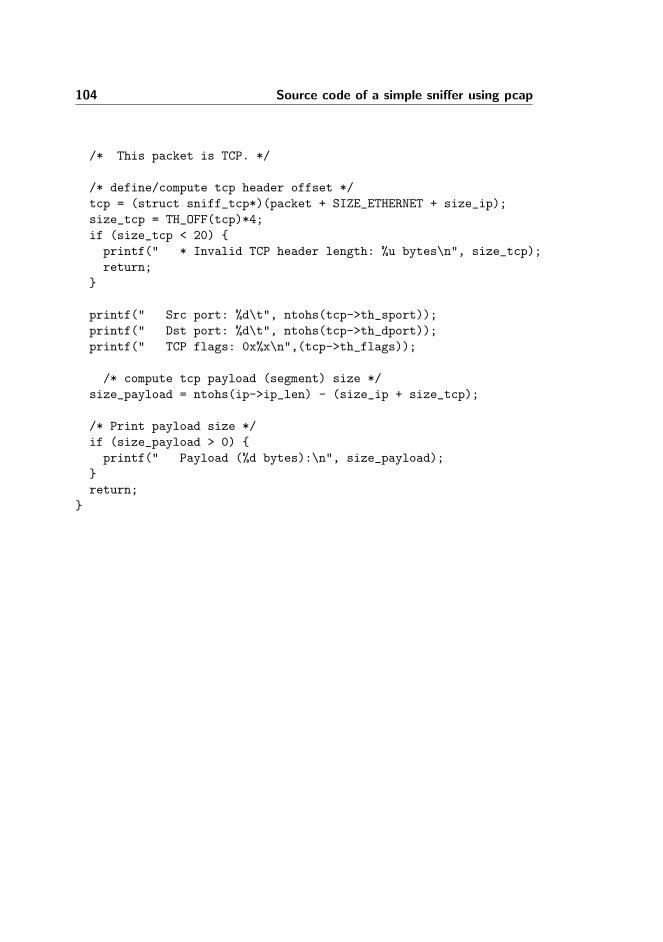
104 Source code of a simple sniffer using pcap
/* This packet is TCP. */
/* define/compute tcp header offset */tcp = (struct sniff_tcp*)(packet + SIZE_ETHERNET + size_ip);size_tcp = TH_OFF(tcp)*4;if (size_tcp < 20) {printf(" * Invalid TCP header length: %u bytes\n", size_tcp);return;
}
printf(" Src port: %d\t", ntohs(tcp->th_sport));printf(" Dst port: %d\t", ntohs(tcp->th_dport));printf(" TCP flags: 0x%x\n",(tcp->th_flags));
/* compute tcp payload (segment) size */size_payload = ntohs(ip->ip_len) - (size_ip + size_tcp);
/* Print payload size */if (size_payload > 0) {printf(" Payload (%d bytes):\n", size_payload);
}return;
}
Bibliography
[1] ftp://ftp.sas.com/pub/neural/FAQ.html.
[2] http://doc.trolltech.com/.
[3] http://insecure.org/nmap/.
[4] http://nsaditor.com.
[5] http://www2.imm.dtu.dk/IDSnet/.
[6] http://www.cert.org/.
[7] http://www.iana.org/assignments/port-numbers.
[8] http://www.tcpdump.org.
[9] http://www.wikipedia.org.
[10] Damiano Bolzoni, Sandro Etalle, Pieter H. Hartel, and Emmanuele Zam-bon. Poseidon: a 2-tier anomaly-based network intrusion detection system.In Proceedings of the 4th IEEE International Workshop on InformationAssurance, 13-14 April 2006, Egham, Surrey, UK, pages 144–156, 2006.
[11] D. A. Frincke, D. Tobin, J. C. McConnell, J. Marconi, and D. Polla. Aframework for cooperative intrusion detection. In Proc. 21st NIST-NCSCNational Information Systems Security Conference, pages 361–373, 1998.
[12] Simon Haykin. Neural Networks, A Comprehensive Foundation. PrenticeHall, 2nd edition, 1999.
106 BIBLIOGRAPHY
[13] T. Kanungo, D. Mount, N. Netanyahu, C. Piatko, R. Silverman, and A. Wu.An efficient k-means clustering algorithm: analysis and implementation. InIEEE Transactions on Pattern Analysis and Machine Intelligence 24(7):881-892., 2002.
[14] Ben Krose and Patrick van der Smagt. An introduction to neural networks.The University of Amsterdam, 1996.
[15] Pavel Laskov, Patrick Dussel, Christin Schafer, and Konrad Rieck. Learningintrusion detection: Supervised or unsupervised?. In Image Analysis andProcessing - ICIAP, 13th International Conference, Cagliari, Italy, pages50–57, 2005.
[16] Wenke Lee and Salvatore J. Stolfo. A framework for constructing featuresand models for intrusion detection systems. ACM Trans. Inf. Syst. Secur.,3(4):227–261, 2000.
[17] John Zhong Lei and Ali A. Ghorbani. Network intrusion detection using animproved competitive learning neural network. In 2nd Annual Conferenceon Communication Networks and Services Research (CNSR 2004), 19-21May 2004, Fredericton, N.B., Canada, pages 190–197. IEEE ComputerSociety, 2004.
[18] P. Lichodzijewski, A. Zincir-Heywood, and M. Heywood. Dynamic intru-sion detection using self organizing maps, 2002.
[19] Giuseppe Patane and Marco Russo. The enhanced lbg algorithm. NeuralNetworks, 14(9):1219–1237, 2001.
[20] Jake Ryan, Meng-Jang Lin, and Risto Miikkulainen. Intrusion detectionwith neural networks. In Michael I. Jordan, Michael J. Kearns, and Sara A.Solla, editors, Advances in Neural Information Processing Systems, vol-ume 10. The MIT Press, 1998.
[21] Robin Sharp. The poor man’s guide to computer networks and their appli-cations. April 2004.
[22] Shi Zhong, Taghi Khoshgoftaar, and Naeem Seliya. Clustering-based Net-work Intrusion Detection. Department of Computer Science and Engineer-ing, Florida Atlantic University.