Unspent Funds Across Federal Agencies · 1 I. EXECUTIVE SUMMARY Our project examined unspent money,...
36
Unspent Funds Across Federal Agencies Prepared for: Booz Allen Hamilton Prepared by: Ben Donovan Jinyi Zhang Josie Link Kruti Suchde Public Policy 804 April 30, 2018 Disclaimer: This student paper was prepared in 2018 in partial completion of the requirements for Public Policy 804, a course in the Masters of Public Policy Program at the Sanford School of Public Policy at Duke University. The research, analysis, and policy alternatives contained in this paper are the work of the student team that authored the document, and do not represent the official or unofficial views of the Sanford School of Public Policy or of Duke University. Without the specific permission of its authors, this paper may not be used or cited for any purpose other than to inform the client organization about the subject matter.
Transcript of Unspent Funds Across Federal Agencies · 1 I. EXECUTIVE SUMMARY Our project examined unspent money,...

Unspent Funds Across Federal Agencies
Prepared for: Booz Allen Hamilton
Prepared by: Ben Donovan Jinyi Zhang Josie Link
Kruti Suchde
Public Policy 804
April 30, 2018
Disclaimer: This student paper was prepared in 2018 in partial completion of the requirements for Public Policy 804, a course in the Masters of Public Policy Program at the Sanford School of Public Policy at Duke University. The research, analysis, and policy alternatives contained in this paper are the work of the student team that authored the document, and do not represent the official or unofficial views of the Sanford School of Public Policy or of Duke University. Without the specific permission of its authors, this paper may not be used or cited for any purpose other than to inform the client organization about the subject matter.

TABLE OF CONTENTS
I. EXECUTIVE SUMMARY . . . . . . . . . . . . . . . . . . . . . . . . . . . . . . . . . . . . . . . . . . . . . . . . .1
II. POLICY ISSUE . . . . . . . . . . . . . . . . . . . . . . . . . . . . . . . . . . . . . . . . . . . . . . . . . . . . . . . . . .2
III. METHODOLOGY. . . . . . . . . . . . . . . . . . . . . . . . . . . . . . . . . . . . . . . . . . . . . . . . . . . . . . . .2
IV. BUDGET BREAKDOWN . . . . . . . . . . . . . . . . . . . . . . . . . . . . . . . . . . . . . . . . . . . . . . . . . .4
V. UNOBLIGATED BALANCES . . . . . . . . . . . . . . . . . . . . . . . . . . . . . . . . . . . . . . . . . . . . . .6
A. Overview . . . . . . . . . . . . . . . . . . . . . . . . . . . . . . . . . . . . . . . . . . . . . . . . . . . . . . . . . 6
B. Single-year Unobligated Balances . . . . . . . . . . . . . . . . . . . . . . . . . . . . . . . . . . . . . .9
C. Reasons for Unobligated Balances . . . . . . . . . . . . . . . . . . . . . . . . . . . . . . . . . . . . .10
D. Areas for Concern in Unobligated Balances . . . . . . . . . . . . . . . . . . . . . . . . . . . . . 16
VI. UNLIQUIDATED OBLIGATIONS . . . . . . . . . . . . . . . . . . . . . . . . . . . . . . . . . . . . . . . . . 17
A. Overview . . . . . . . . . . . . . . . . . . . . . . . . . . . . . . . . . . . . . . . . . . . . . . . . . . . . . . . .17
B. Delivered vs Undelivered Orders . . . . . . . . . . . . . . . . . . . . . . . . . . . . . . . . . . . . .21
C. Agencies with More Delivered Orders: SSA, OPM, and Treasury . . . . . . . . . . . .23
D. Agencies with More Undelivered Orders: HUD, ED, and NSF. . . . . . . . . . . . . . .25
VII. NEXT STEPS . . . . . . . . . . . . . . . . . . . . . . . . . . . . . . . . . . . . . . . . . . . . . . . . . . . . . . . . . . .28
ACKNOWLEDGEMENTS . . . . . . . . . . . . . . . . . . . . . . . . . . . . . . . . . . . . . . . . . . . . . . . . . . .30
BIBLIOGRAPHY . . . . . . . . . . . . . . . . . . . . . . . . . . . . . . . . . . . . . . . . . . . . . . . . . . . . . . . . . . .31
APPENDICES . . . . . . . . . . . . . . . . . . . . . . . . . . . . . . . . . . . . . . . . . . . . . . . . . . . . . . . . . . . .A-1
Appendix I: 24 CFO Agencies . . . . . . . . . . . . . . . . . . . . . . . . . . . . . . . . . . . . . . . . A-1
1
I. EXECUTIVE SUMMARY
Our project examined unspent money, both unobligated balances and unliquidated
obligations, across federal agencies in fiscal year 2017 (FY17). We found several legitimate
reasons for unspent money sitting in federal agency bank accounts. Some of the major reasons
include insurance funds, reserves, long project timelines, and budgetary constraints. However, we
also explored areas for improvement around unspent money, including budgetary mismanagement,
politics, and uncertainty.
Our team identified agencies with large unobligated balances (money in accounts but not
promised) and unliquidated obligations (money promised but not paid) both in dollar amounts and
percentages. The agencies with the largest unobligated balances out of total budget authority were
the U.S. Agency for International Development (USAID) at 72 percent and Department of Housing
and Urban Development (HUD) at 46 percent. An example of an agency with a large unliquidated
obligation balance out of total obligations was the Environmental Protection Agency (EPA) at 88
percent.
For spending patterns involving unliquidated obligations, we examined delivered goods or
services rendered to agencies and whether they had received these services yet. The Social Security
Administration (SSA), Office of Personnel Management (OPM), and Department of the Treasury
(Treasury) had at least 75 percent delivered orders. In these cases, such agencies have received
delivered goods or services, set aside money for these orders, but have not yet paid it out. On the
other hand, HUD, the Department of Education (ED), and National Science Foundation (NSF)
have at least 92 percent undelivered orders. In these cases, the agencies have not received the
services. These cases usually involve multi-year contracts, grants, program subsidies, undisbursed
loans, and insurance claims.

2
We recommend further research into (1) agencies with the most single-year unobligated
funds to identify potential inefficiencies, such as the Departments of Agriculture (USDA), Justice
(DOJ), and State (DOS), (2) agencies without a majority of undelivered or delivered orders, such
as the Department of Health and Human Services (HHS), USDA, and DOJ, and (3) unobligated
and unliquidated obligations over time, noting any effects of changes in Presidential
administrations.
II. POLICY ISSUE
Our team started with the initial policy issue prompt: “there is currently no government-
wide view of money promised but not paid or of the balance of money sitting around. How much
money is obligated but currently unspent (unliquidated obligations)? How much money is in
accounts but unobligated (unobligated balances)? Once we uncover the lurking patterns and
visualize them, can we determine which agencies are not using money efficiently? What is the best
strategy to encourage or influence inefficient actors to change their behavior?”
Through our subsequent research, we refined this policy prompt. In conversations with
budget experts and our client Booz Allen Hamilton (Booz Allen), our team targeted the issue of
unspent balances across federal agencies. We contextualized this research by recognizing the
current era of budget austerity and uncertainty. Our refined policy question became: “What are the
reasons federal agencies have unspent balances?”
III. METHODOLOGY
In 2014, President Obama signed the Digital Accountability and Transparency Act (DATA
Act). The Department of the Treasury (Treasury) and the Office of Management and Budget

3
(OMB) have led the DATA Act’s implementation. The legislation aims to make federal spending
data more accessible to the public, improve spending data quality, and allow for better government
oversight (Digital Accountability and Transparency Act of 2014). Before the Act, no
comprehensive platform existed to compare all government spending or setting consistent data
standards across agencies (Picard). In compliance with the DATA Act, Treasury is developing
beta.USAspending.gov, the next generation of the USAspending.gov website. The site will improve
the public’s understanding of obligated and unobligated balances by expanding the
USAspending.gov website to include data for all federal funds according to appropriation, agency,
program, and function.
To retrieve agency-specific information based on DATA Act standards, we used
USAspending.gov Raw Agency Submission Files for 2017 Quarter 4 (“USAspending.gov”). From
this website, we retrieved the data for the 24 Chief Financial Officers (CFO) Act agencies (see
Appendix I for further explanation on CFO agencies). We downloaded File A (appropriations) and
File B (program activity) for all agencies and combined them in Excel.
To examine more agency-specific information in Section VI Parts B “Agencies with More
Delivered Orders” and C “Agencies with More Undelivered Orders”, we used Agency Financial
Reports (AFR), which occur annually pursuant to OMB Circular A-136, Financial Reporting
Requirements. These AFRs provide an overview of the agency’s financial and performance
information. Inspector Generals from agencies or outside auditing firms conduct annual financial
audits to identify possible challenges or concerns for the agency’s future.
To address the question of how money goes unspent in the federal government, we
analyzed unobligated balances, or money that has not been spent or put towards a specific purpose.
For unobligated balances, we used two different data sources, OMB’s FY17 Balance for Budget

4
Authority and agency specific data from the DATA Act’s reporting requirements, to understand if
there are any governmental or legal reasons for unobligated balances. Then, we examined
unliquidated obligations, using data only from the DATA Act’s reporting requirements, to look
for patterns in promised but unpaid money. Next, we split unliquidated obligations into delivered
and undelivered orders, and profiled six federal agencies who fit clear spending patterns.
IV. BUDGET BREAKDOWN
Figure 1: Budget Breakdown Flowchart
To help illustrate the problem of unspent money across federal agencies, our team created
the flowchart in Figure 1. Treasury’s DATA Act Information Model Schema (DAIMS v1.2)
defines total budget authority as “authority provided by law to enter into obligations that will result
in outlays of Federal funds” (“Federal Spending Transparency”). Congress obligates total budget
authority in one-year, multiyear or no-year (unlimited) periods. Total budget authority represents
the funds that a government agency can spend in a given fiscal year (U.S. Senate Glossary Terms).

5
Total budget authority divides into two sub-categories, obligated and unobligated balances.
Obligated balances consist of funds designated for a specific payment. Treasury defines an
obligation as a “legally binding agreement that will result in outlays, immediately or in the future”
(“Federal Spending Transparency”). Examples can range from small purchases of office supplies
to massive purchases of multi-million-dollar fighter jets. Government agencies incur an obligation
whenever they pay for a good or service, award a grant, or place an order.
Unobligated balances, the other subcategory, are the “cumulative amount of budget
authority that remains available for obligation under law in unexpired accounts at a point in time”
(“Federal Spending Transparency”). This money often functions as a reserve against unexpected
costs or to cover potential insurance claims. An example of unobligated balances is the Federal
Deposit Insurance Corporation (FDIC)’s reserve of money to insure future bank deposits and
federal government employees’ benefits and pensions.
Obligated balances, funds designated for a specific purchase, are comprised of two groups:
unliquidated and liquidated obligations. Liquidated obligations are funds for which agencies have
allocated money and already made payments (“GPO.gov”). Conversely, unliquidated obligations
are allocated, but unpaid, funds for a specific purpose.
Unliquidated obligations fall into two additional categories: delivered and undelivered.
Delivered orders are services performed for or delivered to but not paid by a government agency.
Treasury defines delivered orders as “programs for which no current service performance is
required such as annuities, insurance claims, benefit payments, and loans” (“Federal Spending
Transparency”). For example, when an employee of a federal agency has completed work for said
agency, the agency plans on paying the employee, but the employee has not received any payment
for the work.
6
The other category of unliquidated obligations is undelivered goods/services. Undelivered
funds are the “amount of goods and/or services ordered, which have not been ... received but have
been prepaid or advanced” (“Federal Spending Transparency”). This category includes “amounts
specified in other contracts or agreements such as grants, program subsidies, undisbursed loans
and claims” (“Federal Spending Transparency”). An example of undelivered goods/services is a
grant to a private research institution like Stanford University for a study. The federal agency has
set aside money for this study. The university, however, has not completed or “delivered” the
research.
V. TOTAL UNOBLIGATED BALANCES 1
A. Overview
Unobligated balances -- money sitting in federal accounts, but not designated for a specific
outlay or purpose -- make up a significant portion of some federal agencies’ total budgets. Chart 1
shows that as of FY17 agencies with larger budgets tend to carry bigger unobligated balances.
1 Total unobligated balances include multi-year, no-year and single-year unobligated balances.

7
Chart 1: Unobligated Balances – FY17 2
Source: USAspending.gov
HHS and SSA are outliers due to their bigger budgets but smaller unobligated balances.
The Department of Defense (DOD), Treasury, and OPM have the largest unobligated balances.
Both DOD and Treasury have over $360 billion sitting in their bank accounts not designated for a
specific purchase.
2 To make Chart 1, our team used Column S “UnobligatedBalance_CPE” in File A to measure unobligated balances. To get the total budget authority, we used USAspending.gov’s Application Programming Interface (API). First, we had to identify the agency ID using this link, which sorted agencies by percent of total government-wide spending in descending order. Next, we inserted the agency ID into the “ZZZ” part of this URL: https://api.usaspending.gov/api/v2/financial_balances/agencies/?fiscal_year=2017&funding_agency_id=ZZZ.

8
Chart 2: Percentage of Unobligated Balances – FY17 3
Source: USAspending.gov
To better compare the agencies, our team decided to visualize the balances on a percentage
basis. Chart 2 shows unobligated balances as a percentage of total budget authority. USAID has
the largest percentage -- over 70 percent -- in unobligated balances. As outlined in Part B, agencies
including USAID reserve these funds for many legitimate reasons. Future researchers may focus
on such agencies in the middle of Chart 2 like OPM, USDA, and DOJ to find reasons for their
reserve. The researchers should identify specific reasons or lack of reasons for these balances to
identify potential waste, fraud or abuse.
3 To make the agencies more comparable, in Chart 2, we converted the raw numbers to percentages of unobligated balance out of total budget authority.

9
B. Single-Year Unobligated Balances
Chart 3: Single-year Unobligated Balances – FY17 4
Source: USAspending.gov
Unobligated balances separate into several categories depending upon their periods of
availability. Funds have single-year, multi-year or no-year periods of availability for allocation.
Agencies must return single-year funds to the Treasury if they are unspent in the given year. Multi-
year spending authority gives the agencies multiple years to spend or obligate the funds. No-year
spending authority allows agencies to spend with no time restrictions (U.S. Senate Glossary
Terms).
4 To focus on the “use-it-or-lose-it” funds, our team measured the single-year unobligated balances by sorting for 2017 in both Columns C “BeginningPeriodOfAvailability” and D “EndingPeriodOfAvailability.” After that, we added the 2017 only data from Column S “UnobligatedBalance_CPE.” From this data, we created Chart 3.
10
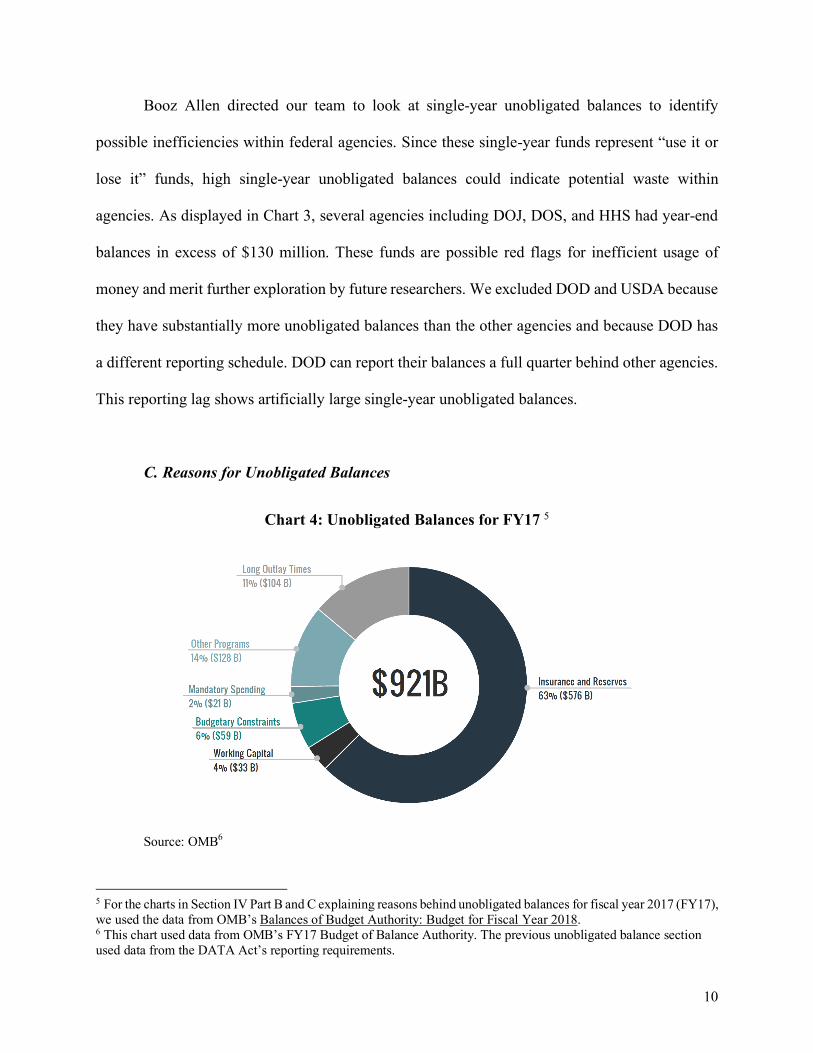
Booz Allen directed our team to look at single-year unobligated balances to identify
possible inefficiencies within federal agencies. Since these single-year funds represent “use it or
lose it” funds, high single-year unobligated balances could indicate potential waste within
agencies. As displayed in Chart 3, several agencies including DOJ, DOS, and HHS had year-end
balances in excess of $130 million. These funds are possible red flags for inefficient usage of
money and merit further exploration by future researchers. We excluded DOD and USDA because
they have substantially more unobligated balances than the other agencies and because DOD has
a different reporting schedule. DOD can report their balances a full quarter behind other agencies.
This reporting lag shows artificially large single-year unobligated balances.
C. Reasons for Unobligated Balances
Chart 4: Unobligated Balances for FY17 5
Source: OMB6
5 For the charts in Section IV Part B and C explaining reasons behind unobligated balances for fiscal year 2017 (FY17), we used the data from OMB’s Balances of Budget Authority: Budget for Fiscal Year 2018. 6 This chart used data from OMB’s FY17 Budget of Balance Authority. The previous unobligated balance section used data from the DATA Act’s reporting requirements.

11
We found several legitimate reasons for $921 billion in unspent money sitting in federal
agency bank accounts in FY17. As shown in Chart 4, the OMB’s Balance of Budget Authority
FY17 showed $921 billion unobligated balances across all federal agencies. Some of the major
reasons include insurance funds, reserves, long project timelines, and budgetary constraints.
However, we also identified the “Other Programs” section as a category possibly involving
budgetary mismanagement, politics, and uncertainty.
Chart 5: Unobligated Balances: Insurance and Reserves
Source: OMB
Insurance and Reserves comprise 63 percent of the total unobligated balances in FY17.
Most balances in this category involve the federal government’s response to the 2008 financial
crisis. The Housing and Economic Recovery Act of 2008 allowed Treasury to purchase Fannie
Mae and Freddie Mac’s obligations and other securities (U.S. Office of Budget and Management).
Deposit insurance (FDIC) accounts for $107 billion of the $576 billion in unobligated balances.
The FDIC insures deposits and protects the customers of failed banking institutions.
The remaining funds involve federal pensions and other insurance funds. The OPM
Employees Life Insurance Fund represents $67.9 billion of the $576 billion in unobligated funds.

12
The fund consists of withholdings from active employees, agency contributions, and government
contributions appropriated to OPM. Other smaller funds make up the balance of the remaining
$576 billion.
Chart 6: Unobligated Balances: Long Outlay Times
Source: OMB
Long outlay times account for another $128 billion of the $921 billion total estimated FY17
unobligated balances (U.S. Office of Budget and Management). Some projects take years to
complete. Examples include construction projects, major procurement, and research and
development projects. One solution could be providing partial funding to cover the work
performed each year. This method, however, could lead to procurement inefficiencies with
contractors uncertain of future funding plans.

13
Chart 7: Unobligated Balances: Budgetary Constraints
Source: OMB
Budgetary constraints account for $59 billion of the $921 billion. The Department of
Transportation (DOT) accounts for 83 percent of these balances through its federal-aid highway
accounts and the Federal Transit Administration’s Formula Grants (U.S. Office of Budget and
Management). DOT collects funds from gas taxes but cannot spend or obligate this money beyond
a limit set by Congress. This spending limit creates an excess of unobligated balances.
Other programs can only access fee collections if given authority by Congress. One
example is the Food and Drug Administration’s (FDA) prescription drug user fees (GAO Report
17-268T). Another example is EPA’s hazardous waste sites future cleanup fund (GAO Report 17-
59).

14
Chart 8: Unobligated Balances: Working Capital
Source: OMB
Working capital funds (WCF) account for $33 billion of the $921 billion total unobligated
balances. WCFs allow payment collection in return for providing goods and services (U.S. Office
of Budget and Management). A Government Accountability Office (GAO) review found that
WCFs could give federal agencies considerable control and flexibility in providing administrative
services. The Department of Labor (DOL) uses its WCF for administrative services, including
personnel, payroll, accounting, automated data processing, supply, and procurement services
(GAO Report 94-121). WCFs allow necessary government operations to occur, which means
unobligated balances within these funds are also needed.

15
Chart 9: Unobligated Balances: Mandatory Spending
Source: OMB
Mandatory benefits account for about $21 billion of the $921 billion total balances (U.S.
Office of Budget and Management). Appropriations for mandatory benefits are based on a formula
of expected take-up rate among eligible participants. Congress will often appropriate a “cushion”
of funding above estimated demand. When demand exceeds forecast amounts, the agencies do not
need to ask for supplemental appropriations. The benefit programs with the largest unobligated
balances include the Department of Veterans Affairs’ Compensation and Pensions Program ($9
billion), USDA’s Supplemental Nutrition Assistance Program ($7 billion), and SSA’s
Supplemental Security Income Program ($4 billion).

16
D. Areas for Concern in Unobligated Balances
Chart 10: Unobligated Balances: Other Spending
Source: GAO and OMB
We have explored three possible explanations for the “other spending” category, including
mismanagement, political motivations, and uncertainty. While our team found budgetary
uncertainty to be an appropriate reason for unspent money, we found no evidence for
mismanagement and political motivations to be legitimate reasons for unspent money.
Budget mismanagement causes agencies to accumulate large unobligated balances when
they should obligate money to specific programs. It could be that agencies do not plan their
spending, have effective oversight, or obligate things funds fast enough. This can be represented
by a slow spendout rate, which is the rate at which budget authority becomes outlays in a fiscal
year. For example, in 2008, HUD received a supplemental appropriation to provide disaster relief
late in the fiscal year. The timing led to a large increase in the agency’s unobligated balance,
although HUD officials said they made an effort to obligate the supplemental appropriations
quickly (GAO Report 13-798).
17
The reason could also be political. In 2017, Rex Tillerson, former Secretary of State, was
reluctant to spend the $80 million that Congress provided to fight terrorist propaganda and Russian
disinformation (Gearan).
Finally, agencies want to prepare for operations under uncertainty when a budget cannot
be passed on time. In 2016, the Western Area Power Administration under the Department of
Energy (DOE) adopted a policy to retain at least one quarter of its annual budget as a contingency
for operations to deal with a continuing resolution or government shutdown (GAO Report 16-26).
VI. UNLIQUIDATED OBLIGATIONS
A. Overview
Unliquidated obligations are monies promised or obligated but not yet paid. Chart 11 shows
unliquidated obligations out of total obligations in FY17.

18
Chart 11: Unliquidated Obligations – FY17 7
Source: USAspending.gov
DOD with nearly $600 billion and HHS with over $300 billion have more unliquidated
obligations than the other agencies in terms of dollar amounts. An interesting pattern is that DOT,
USAID, and NSF have more multi-year unliquidated obligations than FY17 total obligations
incurred, which is usually not the case. 8 The three agencies may have carried forward and
accumulated much more unliquidated obligations from previous years than the other agencies.
7 For Chart 11, 12, and 13, we measured unliquidated obligations by adding Columns Q “ObligationsUndeliveredOrdersUnpaidTotal_CPE” and W “ObligationsDeliveredOrdersUnpaid Total_CPE” in File B. Our team then compared them to total obligations incurred from File A’s Column Q “ObligationsIncurredTotalByTAS_CPE”. 8 Total obligations are promises agencies make for FY17, which we found from USAspending.gov’s API. Yet the unliquidated obligations in the raw files agencies submitted to USAspending.gov is multi-year data.

19
Chart 12: Unliquidated Obligations for USAID, DOT, and NSF – FY17 9
Source: USAspending.gov
The detailed breakdown in Chart 12 shows that USAID has unliquidated obligations
exceeding total obligations by almost $20 billion. DOT follows with approximately $12.5 billion
and NSF has over $5 billion. The three agencies have long-term projects such as foreign aid,
construction, and research and development. The unique pattern they demonstrate seems
justifiable. Yet future researchers may want to investigate it for potential inefficiencies. For
example, USDA and the National Aeronautics and Space Administration (NASA) also focus on
long-term projects. They however do not have more unliquidated obligations than total obligations
as shown in Chart 11.
9 For Chart 11, 12, and 13, we measured unliquidated obligations by adding Columns Q “ObligationsUndeliveredOrdersUnpaidTotal_CPE” and W “ObligationsDeliveredOrdersUnpaid Total_CPE” in File B. Our team then compared them to total obligations incurred from File A’s Column Q “ObligationsIncurredTotalByTAS_CPE”.
20
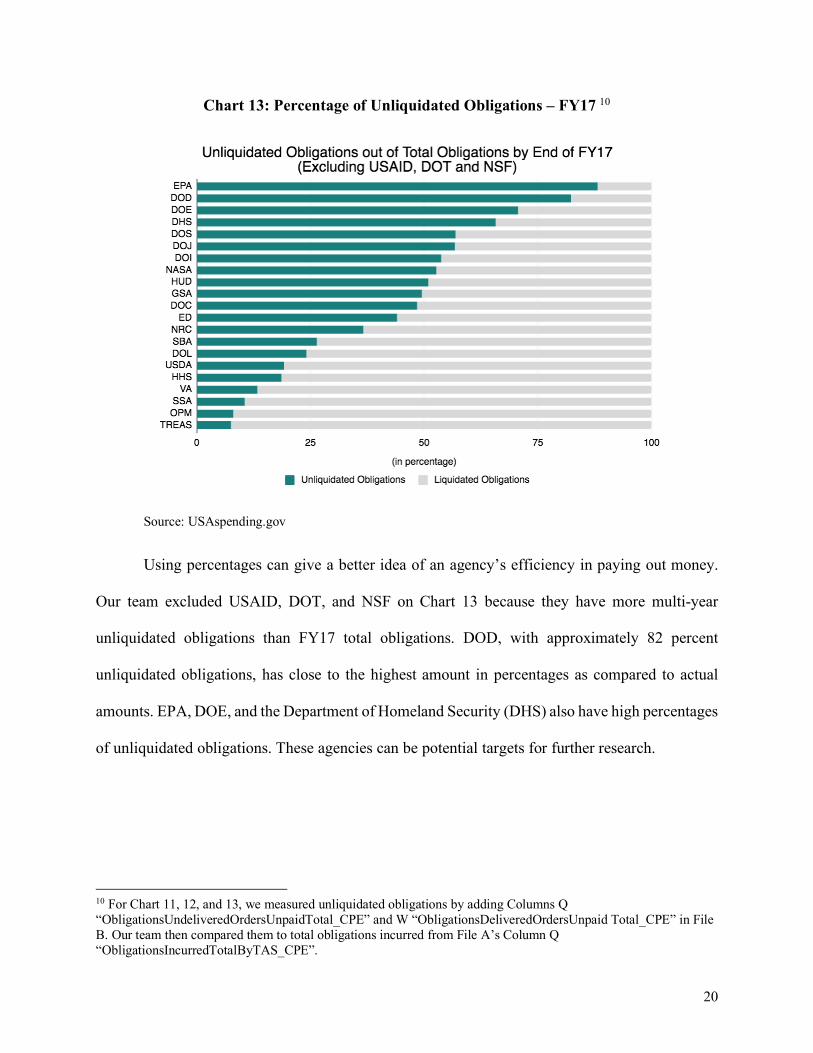
Chart 13: Percentage of Unliquidated Obligations – FY17 10
Source: USAspending.gov
Using percentages can give a better idea of an agency’s efficiency in paying out money.
Our team excluded USAID, DOT, and NSF on Chart 13 because they have more multi-year
unliquidated obligations than FY17 total obligations. DOD, with approximately 82 percent
unliquidated obligations, has close to the highest amount in percentages as compared to actual
amounts. EPA, DOE, and the Department of Homeland Security (DHS) also have high percentages
of unliquidated obligations. These agencies can be potential targets for further research.
10 For Chart 11, 12, and 13, we measured unliquidated obligations by adding Columns Q “ObligationsUndeliveredOrdersUnpaidTotal_CPE” and W “ObligationsDeliveredOrdersUnpaid Total_CPE” in File B. Our team then compared them to total obligations incurred from File A’s Column Q “ObligationsIncurredTotalByTAS_CPE”.

21
B. Delivered vs Undelivered Orders
Delivered orders are services performed for or delivered to but not yet paid by a
government agency. Undelivered orders are goods or services ordered but not received or paid
(“Federal Spending Transparency”). Delivered and undelivered orders sum up to the unliquidated
obligations total.
Chart 14: Delivered vs Undelivered Obligations – FY17 11
Source: USAspending.gov
Chart 14 shows the dollar amounts of delivered and undelivered orders out of total
obligations in FY17. HHS, SSA, and DOD had the largest delivered orders. NSF, the Small
11 After creating Chart 13, our team broke out delivered and undelivered unliquidated obligations by splitting out Columns Q “ObligationsUndeliveredOrdersUnpaidTotal_CPE” and W “ObligationsDeliveredOrdersUnpaidTotal_CPE” in File B. Chart 14 shows the raw numbers of delivered versus undelivered orders. We identified agencies with higher percentages of delivered versus undelivered unliquidated obligations in Chart 7 and 8.

22
Business Administration (SBA), and Nuclear Regulatory Commission (NRC) had the smallest
delivered orders.
Chart 15: Percentage of Delivered vs Undelivered Obligations – FY17 12
Source: USAspending.gov
To get a better understanding of the delivered and undelivered orders for individual
agencies, we used the percentage of delivered versus undelivered orders for each of the agencies.
Chart 15 shows agencies in descending order of percentage of delivered orders. We focused on the
top and bottom three agencies with more delivered orders (greater than 75 percent) and more
undelivered orders (more than 92 percent). We wanted to investigate whether the spending patterns
of these agencies explained why they had more delivered or undelivered orders.
12 To get a better understanding of delivered and undelivered orders on an individual agency we created Chart 15 using the percentage of delivered versus undelivered orders.

23
C. Agencies with More Delivered Orders: SSA, OPM, and Treasury
Social Security Administration (SSA)
SSA is responsible for three primary functions. It oversees the Old Age and Survivors
Insurance program that gives retirement and survivor benefits to qualified workers. This program
accounted for the bulk of program spending, with $793 billion dispersed to workers in FY17. The
second program is Disability Insurance, which covers disabled workers and their families. This
category constituted $141 billion in spending in FY17. Finally, SSA administers the Supplemental
Security Income program supporting older, blind, and disabled adults and children living below
the federal poverty line. This program constituted $51 billion in spending in FY17 (“Social
Security Administration”).
In FY17, 97.9 percent of SSA’s unliquidated obligations were for delivered orders.
Workers pay into Social Security throughout their working life. SSA collects money deducted
from employees’ paychecks. Since SSA deals with funds delivered to the administration from
workers’ paychecks, its delivered orders balance is appropriately much higher than the other
agencies.
SSA’s Office of the Inspector General (OIG) found that it reached 14 of 15 performance
goals set by the OIG. However, the OIG found significant areas for improvement including
reducing improper benefit payments, recovering overpayments, and strengthening transparency
and accountability (“Fiscal Year 2017”).
Office of Personnel Management (OPM)
OPM is responsible for the overall human resources (HR) functioning of the federal
government and its agencies. It is mainly accountable for HR and federal employee management

24
services, retirement benefits, healthcare and insurance programs, and civil service hiring
(OPM.gov).
OPM’s main spending in FY17 included Civil Service Retirement and Disability Benefits
(CSRS and FERS), Health Benefits, Life Insurance Benefits, and HR Services. Around 63 percent
of the obligations incurred in FY17 were from Retirement Benefits (“OPM - 2017 Agency
Financial Report”). Delivered orders remaining unpaid include amounts accrued for the services
federal employees, contractors deliver. They also include programs that do not require current
service performance, such as annuities, insurance claims, and benefit payments (“Federal
Spending Transparency”). 92.7 percent of OPM’s unliquidated obligations were delivered orders
in FY17. Federal employees provide contributions towards their retirement (delivered services)
then OPM pays out to them after they retire (delivered orders unpaid). This reasonable spending
pattern explains why OPM has more delivered than undelivered orders.
OPM’s OIG, however, identified a number of external factors and internal challenges that
could pose a risk of fraud, waste, or abuse of federal assets in FY17. The OIG found one of the
OPM’s main challenges was improper retirement payments amounting to about $304 million in
FY16 paid to deceased retirees (“OPM - 2017 Agency Financial Report”).
Department of the Treasury (Treasury)
Treasury acts as the premier financial institution for the federal government. Treasury is
responsible for debt management, cash production, loans to federal agencies, and economic policy
formulation (“Treasury - 2017 Agency Financial Report”).
Treasury’s major offices include the Bureau of Engraving and Printing (BEP) and the
Bureau of the Fiscal Service (Fiscal Service). BEP produces U.S. currency notes and secures
government documents. Fiscal Service Bureau provides central payment services to federal

25
agencies and delivers administrative shared services to federal agencies. The nature of these
program activities translates to a large percentage of delivered orders of unliquidated obligations.
For FY17, 79.7 percent of Treasury’s unliquidated obligations are delivered orders. While, federal
agencies have performed the appropriate administrative services, Treasury has not paid for their
services yet (“Treasury - 2017 Agency Financial Report”). This reasonable spending explains why
Treasury has more delivered than undelivered orders.
The OIG contracted an external firm, KPMG, to audit Treasury’s financial statements for
FY17. Its findings indicated that Treasury had no instances of noncompliance with laws,
regulations, contracts, and grant agreements (“Treasury - 2017 Agency Financial Report”).
D. Agencies with More Undelivered Orders: HUD, ED, and NSF
Department of Housing and Urban Development (HUD)
HUD’s mission is to strengthen the housing market, meet the need for quality affordable
housing, and build inclusive communities free of discrimination. The program activities of HUD
are mostly grant and contract-based. HUD thus has a larger percentage of undelivered orders
within its unliquidated obligations. In FY17, 92 percent of HUD’s unliquidated obligations were
undelivered orders.
The Office of Community Planning and Development is HUD’s subagency with the largest
budget. It provides funding to a broad array of government and nonprofit entities for housing,
economic development, homelessness assistance, and community development. The Office’s main
business areas are the Community Development Block Grants (CDBG) and HOME Investment
Partnerships Program (HOME).
26
The Federal Housing Administration (FHA) is another major HUD subagency. It acts as a
mortgage insurer for many U.S. homeowners. According to HUD’s Agency Financial Report, the
FHA enters into long-term contracts for both program and administrative services (“HUD - 2017
Agency Financial Report”).
In 2017, HUD’s OIG found DATA Act standards compliance as an emerging challenge for
the agency. By the May 2017 deadline, HUD had not submitted all the required data due to
unresolved data quality and file consolidation issues. The OIG review reported “a low level of
management and executive support for this statutorily required effort” (“HUD - 2017 Agency
Financial Report”). The review also found little monitoring at the subgrantee level for CDBG
programs. This problem at the subgrantee level could be an area of improvement for HUD grantees
and the agency itself.
Department of Education (ED)
The Department of Education is mainly responsible for incorporating policies related to
federal education funding including fund distribution, student loan collection, and monitoring fund
usage (“ED - FY 2017 Agency Financial Report”). Other activities include collecting data and
conducting research on U.S. schools, identifying challenges in the education system, and
implementing federal laws to ensure that programs receiving federal funding are not discriminating
against members of historically marginalized groups (“ED - FY 2017 Agency Financial Report”).
Most of ED’s programs involve grants to state and local educational agencies or grants and loans
to postsecondary students (“ED - FY 2017 Agency Financial Report”). Student loans and grant
programs represent the department’s largest outlays (Direct Loan and Pell Grant).
In FY17, 92.8 percent of the unliquidated obligations for ED were undelivered orders.
These undelivered orders came in the form of grants, program subsidies, undisbursed loans and

27
claims (“Federal Spending Transparency”). The Direct Student Loans and Pell Grants formed
approximately 78 percent of ED’s outlays in FY17 (“ED - FY 2017 Agency Financial Report”).
Loans and grants are obligated services but will only be paid out (liquidated) to students once they
enroll in a postsecondary institution. This is a understandable spending pattern.
Based on FY17, the OIG nevertheless identified improper payments as one of the
management challenges that ED would have to address in FY18. The Pell Grant and the Direct
Loan programs have been subject to improper payments, including over $2.3 million in
unsupported costs between 2014 - 2017 (“ED - FY 2017 Agency Financial Report”). The other
management challenges were improving information technology security, increasing oversight and
monitoring of the department programs, and ensuring data accuracy and reliability.
National Science Foundation (NSF)
NSF supports basic research, invests in research facilities and centers, funds the
development of Science, Technology, Engineering and Math talent, and supports graduate
fellowships. The nature of these activities necessitates long term agency planning when liquidating
its obligations. Three program activities with the biggest undelivered and unpaid orders were
Computer, Information Sciences and Engineering, Mathematical and Physical Sciences, and
Education and Human Resources. Accrued grant liabilities were 77 percent of total liabilities
(“NSF FY2017 Agency Financial Report”).
In FY17, 96.5 percent of NSF’s the unliquidated obligations were undelivered orders. We
identified three reasons for this spending pattern.
• First, 5 percent of NSF’s obligations were for contracts, 22 percent for cooperative
agreements, and 73 percent for grants (both single-year and continuing awards).

28
Contractors could deliver services within a relatively short period. However, grant
recipients need longer time to complete research projects and deliver results in the future.
• Second, NSF’s proposal and award timeline takes about 10 months. At the end of FY17
(September 30th), grant applicants may not have received their grants (unliquidated) and
started any research projects (undelivered).
• Third, NSF developed corrective actions to address issues highlighted in FY16 financial
statement audit. These actions included strengthening internal controls over undelivered
orders. In addition, NSF did not have a significant risk of improper payments for grants,
contracts, and payroll payments.
Overall, NSF was efficient in managing funds. It received Treasury’s Certificate of
Appreciation for outstanding collaboration on the DATA Act and the beta version of
USAspending.gov. The agency conducted a comprehensive analysis of expired awards and made
significant progress in closing awards. NSF also evaluated whether it had designed and
implemented internal controls effectively to manage and report financial and award data in
compliance with the DATA Act (“NSF FY2017 Agency Financial Report”).
VII. NEXT STEPS
The research we conducted provides a general understanding of unspent money within the
24 CFO agencies during FY17. However, agencies have unique spending habits because they have
different programs and provide different services. Our recommendations for Booz Allen or any
researcher who is interested in delving further into this topic would be to research individual
agencies and identify specific spending trends for unspent money. Possible next steps include:

29
1. Examine top agencies with high levels of single-year unobligated funds, such as USDA,
DOJ, and DOS, to understand if the spending pattern within these agencies explains the
existence of these funds.
2. In the case of unliquidated obligations, examine the agencies without a large majority of
undelivered or delivered orders, such as HHS, USDA, and DOJ, which would provide
further insight on spending trends on an individual agency level.
3. Examine unspent money (both unobligated and unliquidated obligations) across many
decades to see if spending patterns are consistent over long periods of time. In particular
analyze whether changes in presidential administrations influence the differences in
spending patterns over time.
Suggested tools that future researchers can utilize to get agency specific information:
● Interview agency officials
● Analyze IG reports
● Make Freedom of Information Act (FOIA) requests
● Request Congressional Research Service (CRS) reports with the help of Congressional
offices; and
● Examine the GAO spendout rate

30
ACKNOWLEDGMENTS
We would like to thank our client, Janelle Becker, Associate at Booz Allen Hamilton, for
providing us with the opportunity to work on this project and for giving us regular feedback and
guidance. Our professor, Mac McCorkle, advised us during crucial turning points in the project
and referred us to Professor Brook and Mr. Hildebrand. Clark Edwards, our Teaching Assistant,
gave us useful comments and feedback on our written drafts. Doug Brook, Professor at the Sanford
School of Public Policy, was immensely helpful to our team in understanding the federal budgeting
process and answering any questions we had about budgeting. Asher Hildebrand, Chief of Staff,
U.S. Rep. David Price at U.S. House of Representatives, guided our team to consider the role of
budget austerity and uncertainty in unspent money, as well as suggested the CRS reports for further
research.

31
BIBLIOGRAPHY
Digital Accountability and Transparency Act of 2014. Pub. L. 113-101. 9 May 2014. Library of
Congress. Accessed 23 Apr. 2018. https://www.congress.gov/113/plaws/publ101/PLAW--
113publ101.pdf
"Data Standards", MAX.gov,
https://max.gov/maxportal/assets/public/offm/DataStandardsFinal.htm. Accessed 11 Apr.
2018.
“Federal Spending Transparency”. https://fedspendingtransparency.github.io/dictionary-v1.2/.
Accessed 9 Apr. 2018.
Fiscal Year 2017 Inspector General’s Statement on the Social Security Administration’s Major
Management and Performance Challenges. Social Security Administration Office of the
Inspector General, https://oig.ssa.gov/sites/default/files/audit/full/pdf/A-02-18-50298_0.pdf.
Gearan, Anne. “Perspective: Got a Pot of Money to Fight Russian Interference? Here’s How Not
to.” Washington Post, 8 Mar. 2018. www.washingtonpost.com,
https://www.washingtonpost.com/news/posteverything/wp/2018/03/08/got-a-pot-of-money-
to-fight-russian-interference-heres-how-not-to/.
“Glossary Term | Budget Authority.” U.S. Senate: Glossary Term | Budget Authority, 18 Jan. 2018,
www.senate.gov/reference/glossary_term/budget_authority.htm.
“OPM.Gov.” U.S. Office of Personnel Management, https://www.opm.gov/about-us/. Accessed
11 Apr. 2018.
Picard, Joe. “The DATA Act Will Shed Light on Government Spending.” TheHill, 16 Dec. 2013,
http://thehill.com/blogs/congress-blog/economy-budget/193262-the-data-act-will-shed-light-
on-government-spending.
32
Social Security Administration, FY2017 Agency Financial Report. 15 Nov. 2017.
https://www.ssa.gov/finance/2017/Complete%20Financial%20Section.pdf. Accessed 11 Apr.
2018.
“USASpending.gov”, http://usaspending-submissions.s3-website-us-gov-west-
1.amazonaws.com/Raw%20Quarterly%20DATA%20Act%20Files/2017/Q4/.
U.S. Department of Education, FY2017 Agency Financial Report, 13 Nov. 2017.
https://www2.ed.gov/about/reports/annual/2017report/agency-financial-report.pdf.
U.S. Department of Housing and Urban Development, FY2017 Agency Financial Report, 15 Nov.
2017. https://www.hud.gov/sites/dfiles/CFO/documents/afr2017.pdf.
U.S. Government Accountability Office. 2013 Sequestration and Shutdown: Selected Agencies
Generally Managed Unobligated Balances in Reviewed Accounts, but Balances Exceeded
Target Levels in Two Accounts. no. GAO-16-26, Oct. 2015. www.gao.gov,
https://www.gao.gov/products/GAO-16-26.
U.S. Government Accountability Office. Budget Issues: Key Questions to Consider When
Evaluating Balances in Federal Accounts. no. GAO-13-798, Sept. 2013. www.gao.gov,
https://www.gao.gov/products/GAO-13-798.
U.S. Government Accountability Office. Federal Fees, Fines, and Penalties: Observations on
Agency Spending Authorities. no. GAO-17-268T, Dec. 2016. www.gao.gov,
https://www.gao.gov/products/GAO-17-268T.
U.S. Government Accountability Office. Permanent Funding Authorities: Some Selected Entities
Should Review Financial Management, Oversight, and Transparency Policies. no. GAO-17-
59, 9 Dec. 2016. www.gao.gov, https://www.gao.gov/products/GAO-17-59.

33
U.S. Government Accountability Office. Working Capital Funds: Three Agency Perspectives. No.
AIMD-94-121, May 1994. https://www.gao.gov/assets/220/219672.pdf.
U.S. National Science Foundation, FY2017 Agency Financial Report, 15 Nov. 2017.
https://www.nsf.gov/pubs/2018/nsf18020/pdf/nsf18020.pdf.
U.S. Office of Budget and Management. Balances of Budget Authority, Budget of the United States
Government, Fiscal Year 2018 - Content Details - BUDGET-2018-BALANCES.
https://www.govinfo.gov/app/details/BUDGET-2018-BALANCES. Accessed 16 Feb. 2018.
U.S. Office of Personnel Management, FY2017 Agency Financial Report, Nov. 2017.
https://www.opm.gov/about-us/budget-performance/performance/2017-agency-financial-
report.pdf.
U.S. Treasury, FY2017 Agency Financial Report, 15 Nov. 2017.
https://www.treasury.gov/about/budget-performance/annual-performance-
plan/Documents/FY17_AFR_508_FINAL.pdf.
2 CFR 200.97 - Unliquidated Obligations, www.gpo.gov/fdsys/granule/CFR-2014-title2-
vol1/CFR-2014-title2-vol1-sec200-97.

A-1
APPENDIX I
24 CFO Council Federal Agencies
Department of Agriculture
Department of Commerce
Department of Defense
Department of Education
Department of Energy
Department of Health and Human Services
Department of Homeland Security
Department of Housing and Urban
Development
Department of the Interior
Department of Justice
Department of Labor
Department of State
Department of Transportation
Department of the Treasury
Department of Veterans Affairs
Environmental Protection Agency
National Aeronautics and Space Administration
Agency for International Development
General Services Administration
National Science Foundation
Nuclear Regulatory Commission
Office of Personnel Management
Small Business Administration
Social Security Administration
Source: cfo.gov/about