
Unpacking the Student Success Scorecard
22
Measuring Disproportionate Impact and Identifying Factors that Impact Hispanic Student Completion Rates Unpacking the Student Success Scorecard etstein, Ph.D., Vice President of Instruction, San Joaquin De Ommeren, Ed.D., Dean, Research, Analysis and Accountability, uyen, Senior Research Analyst, San Joaquin Delta College encil, Research Analyst, San Joaquin Delta College , Ph.D., Research Program Specialist II, CCCCO
-
Upload
flynn-sweeney -
Category
Documents
-
view
18 -
download
0
description
Unpacking the Student Success Scorecard. Measuring Disproportionate Impact and Identifying Factors that Impact Hispanic Student Completion Rates. Matthew Wetstein, Ph.D., Vice President of Instruction, San Joaquin Delta College - PowerPoint PPT Presentation
Transcript of Unpacking the Student Success Scorecard
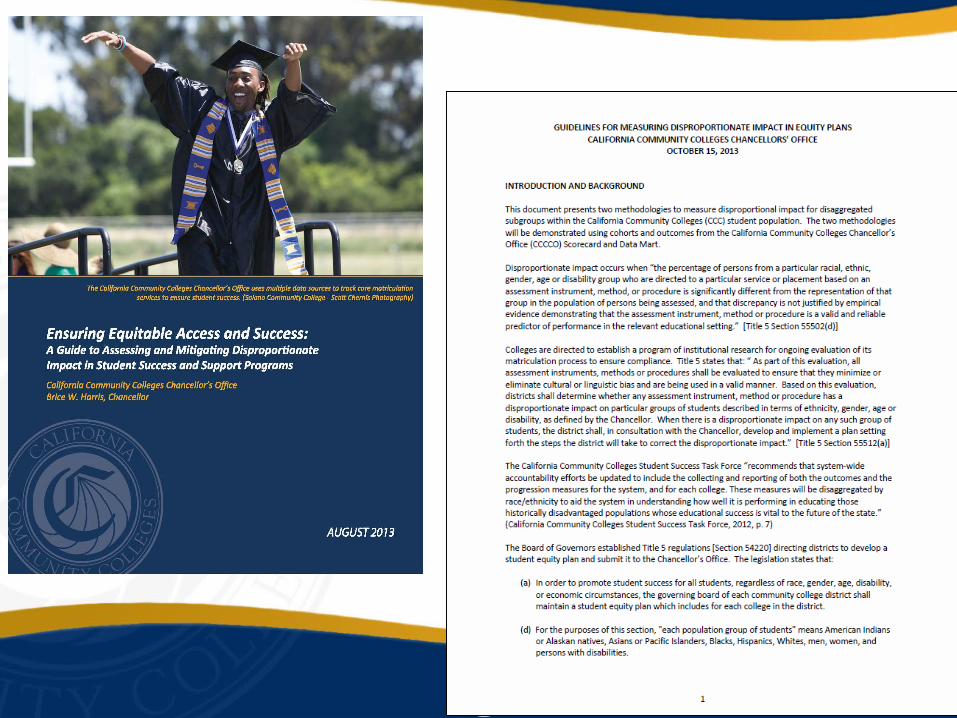
Measuring Disproportionate Impact and Identifying Factors that Impact Hispanic Student Completion Rates
Unpacking the Student Success Scorecard
Matthew Wetstein, Ph.D., Vice President of Instruction, San Joaquin Delta CollegeAlice van Ommeren, Ed.D., Dean, Research, Analysis and Accountability, CCCCOAlyssa Nguyen, Senior Research Analyst, San Joaquin Delta CollegeSabrina Sencil, Research Analyst, San Joaquin Delta CollegeTom Leigh, Ph.D., Research Program Specialist II, CCCCO
Background• Increasing attention to reducing the
achievement gap (outcomes) • Policymakers and administrators are inquiring
about the racial disparities• Researchers are being tasked to measure and
explain inequities and disparities • Hispanic enrollment is increasing, but a
persistent completion gap exits.
CautionRacial categories are constructs and do not capture social, cultural, economic and political issues surrounding racial diversity.
Differences in outcomes are due to underlying social, cultural, economic issues associated with race/ethnicity.
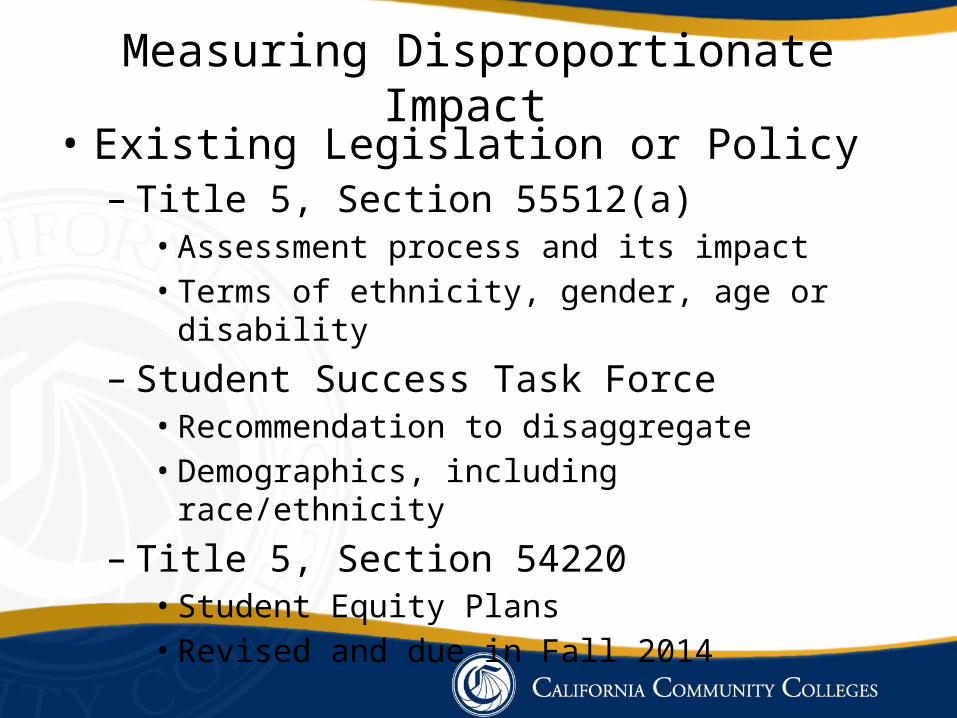
Measuring Disproportionate Impact • Existing Legislation or Policy– Title 5, Section 55512(a)• Assessment process and its impact• Terms of ethnicity, gender, age or disability
– Student Success Task Force• Recommendation to disaggregate• Demographics, including race/ethnicity
– Title 5, Section 54220• Student Equity Plans• Revised and due in Fall 2014


2013 Scorecard Completion
COHORT2013 Scorecard 2006-07 Cohort
OUTCOMEAttained Completion
Outcome
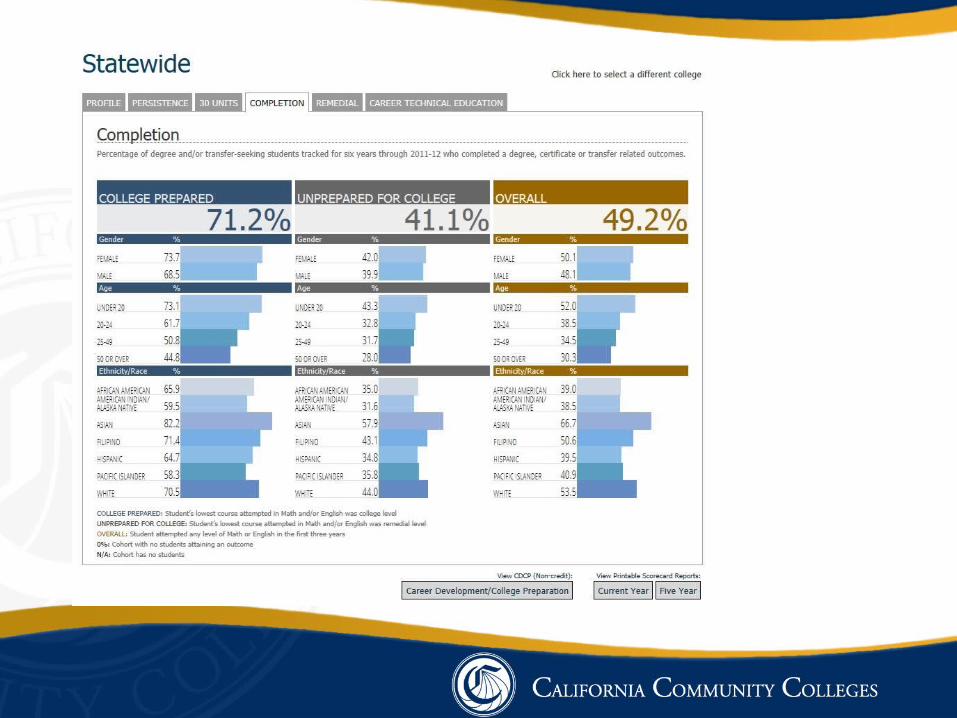
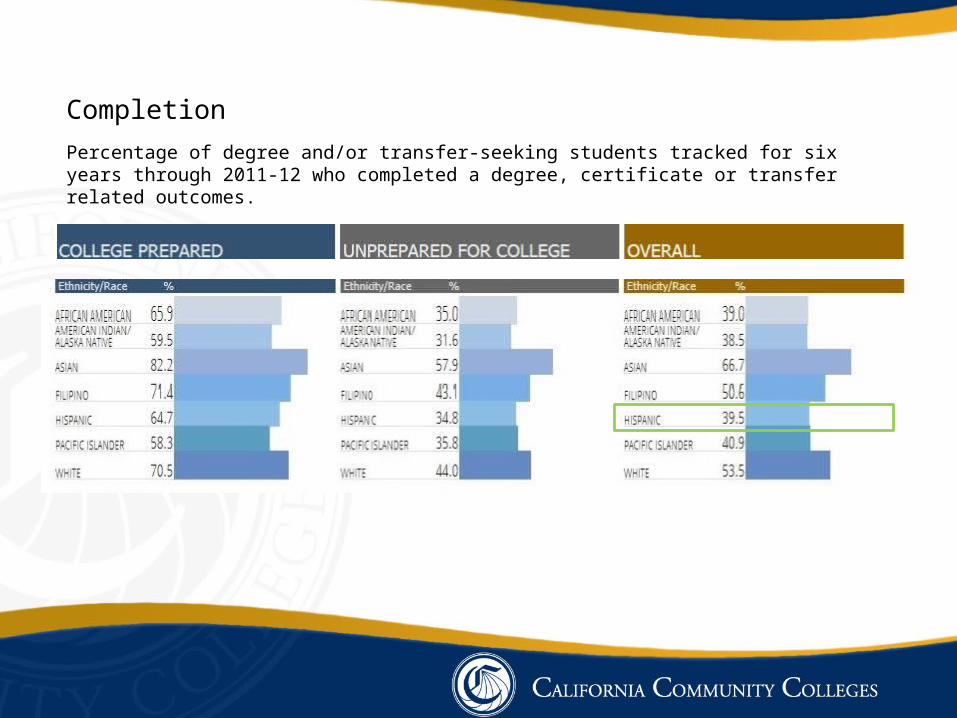
CompletionPercentage of degree and/or transfer-seeking students tracked for six years through 2011-12 who completed a degree, certificate or transfer related outcomes.
Measuring Disproportionate Impact
Two Methods:• 80-Percent Rule• Proportionality Index
The 80 Percent Rule
The 80 Percent Rule methodology is based on the Equal Employment Opportunity Commission (EEOC) 80% Rule, outlined in the 1978 Uniform Guidelines on Employee Selection Procedures, and was used in Title VII enforcement by the U.S. Equal Opportunity Commission, Department of Labor, and the Department of Justice.
The 80% Rule states that: “A selection rate for any race, sex, or ethnic group which is less than four-fifths (4/5) (or eighty percent) of the rate for the group with the highest rate will generally be regarded by the Federal enforcement agencies as evidence of adverse impact, while a greater than four-fifths rate will generally not be regarded by Federal enforcement agencies as evidence of adverse impact.”
The 80 Percent Rule (cont’d)
Three Steps:
1. Calculate the frequency and percent of disaggregated subgroups in cohort and outcome groups.
2. Calculate the percent attainment of each subgroup. Divide the outcome count by the cohort count.
3. Divide the percent attainment of each subgroup by the percent attainment of a reference group to obtain the 80 Percent Ratio.
Calculating the 80 Percent Ratio
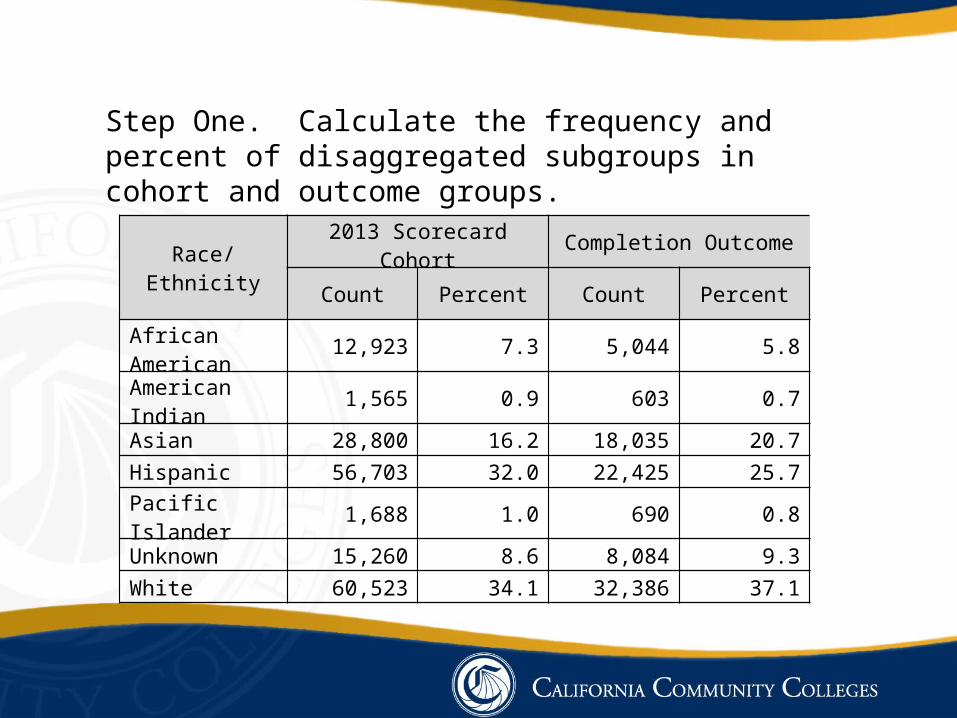
Step One. Calculate the frequency and percent of disaggregated subgroups in cohort and outcome groups.
Race/Ethnicity2013 Scorecard Cohort Completion OutcomeCount Percent Count Percent
African American 12,923 7.3 5,044 5.8American Indian 1,565 0.9 603 0.7Asian 28,800 16.2 18,035 20.7Hispanic 56,703 32.0 22,425 25.7Pacific Islander 1,688 1.0 690 0.8Unknown 15,260 8.6 8,084 9.3White 60,523 34.1 32,386 37.1
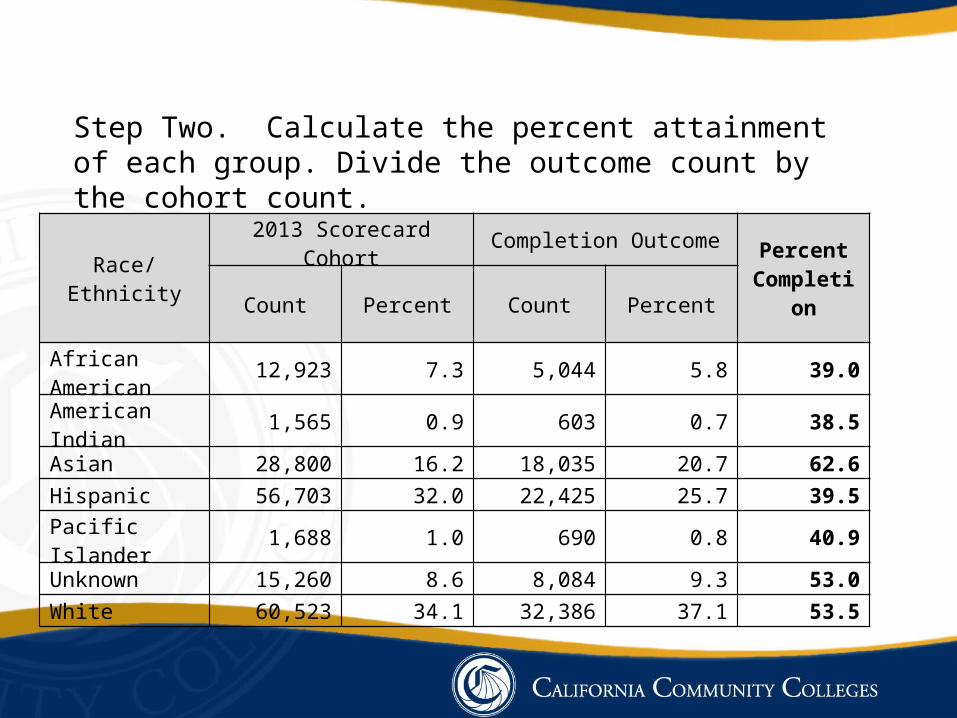
Step Two. Calculate the percent attainment of each group. Divide the outcome count by the cohort count.
Race/Ethnicity2013 Scorecard Cohort Completion Outcome
Percent CompletionCount Percent Count Percent
African American 12,923 7.3 5,044 5.8 39.0American Indian 1,565 0.9 603 0.7 38.5Asian 28,800 16.2 18,035 20.7 62.6Hispanic 56,703 32.0 22,425 25.7 39.5Pacific Islander 1,688 1.0 690 0.8 40.9Unknown 15,260 8.6 8,084 9.3 53.0White 60,523 34.1 32,386 37.1 53.5
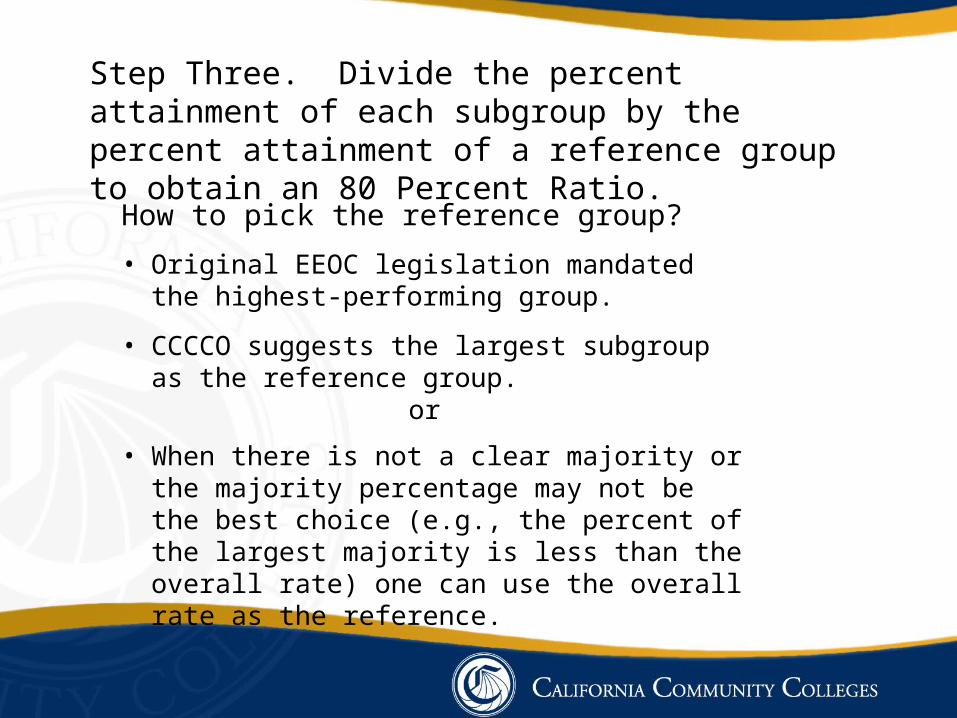
Step Three. Divide the percent attainment of each subgroup by the percent attainment of a reference group to obtain an 80 Percent Ratio.
How to pick the reference group?
• Original EEOC legislation mandated the highest-performing group.
• CCCCO suggests the largest subgroup as the reference group.
or
• When there is not a clear majority or the majority percentage may not be the best choice (e.g., the percent of the largest majority is less than the overall rate) one can use the overall rate as the reference.
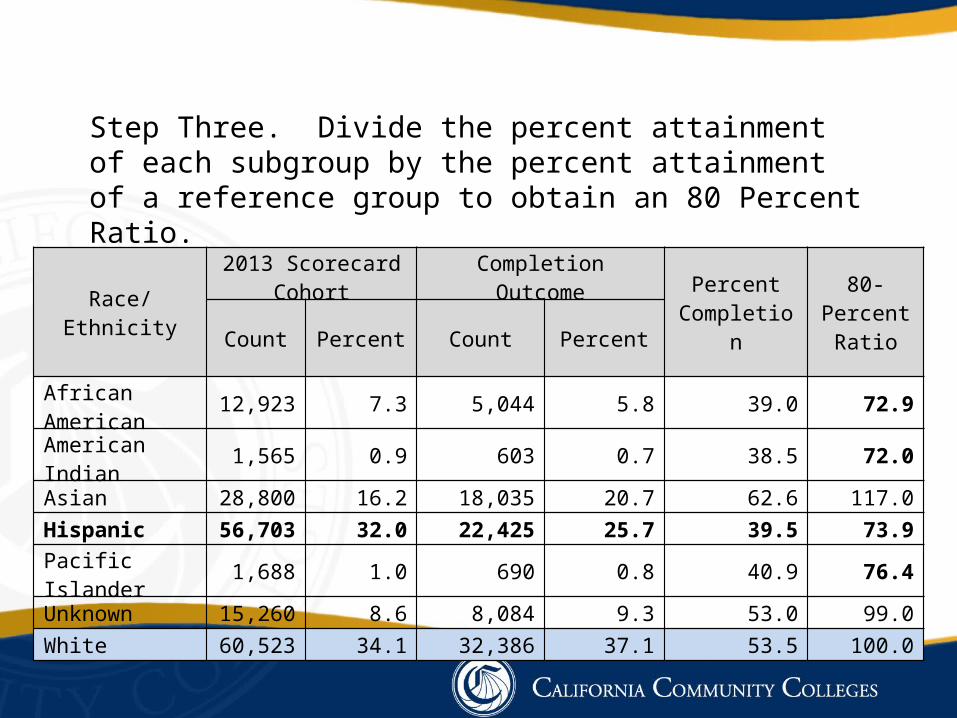
Step Three. Divide the percent attainment of each subgroup by the percent attainment of a reference group to obtain an 80 Percent Ratio.
Race/Ethnicity
2013 Scorecard Cohort Completion Outcome
Percent Completion
80-Percent Ratio
Count Percent Count Percent
African American 12,923 7.3 5,044 5.8 39.0 72.9American Indian 1,565 0.9 603 0.7 38.5 72.0Asian 28,800 16.2 18,035 20.7 62.6 117.0Hispanic 56,703 32.0 22,425 25.7 39.5 73.9Pacific Islander 1,688 1.0 690 0.8 40.9 76.4Unknown 15,260 8.6 8,084 9.3 53.0 99.0White 60,523 34.1 32,386 37.1 53.5 100.0
Proportionality
Divide the percentage of each race/ethnicity in the outcome group by its percent in the cohort.
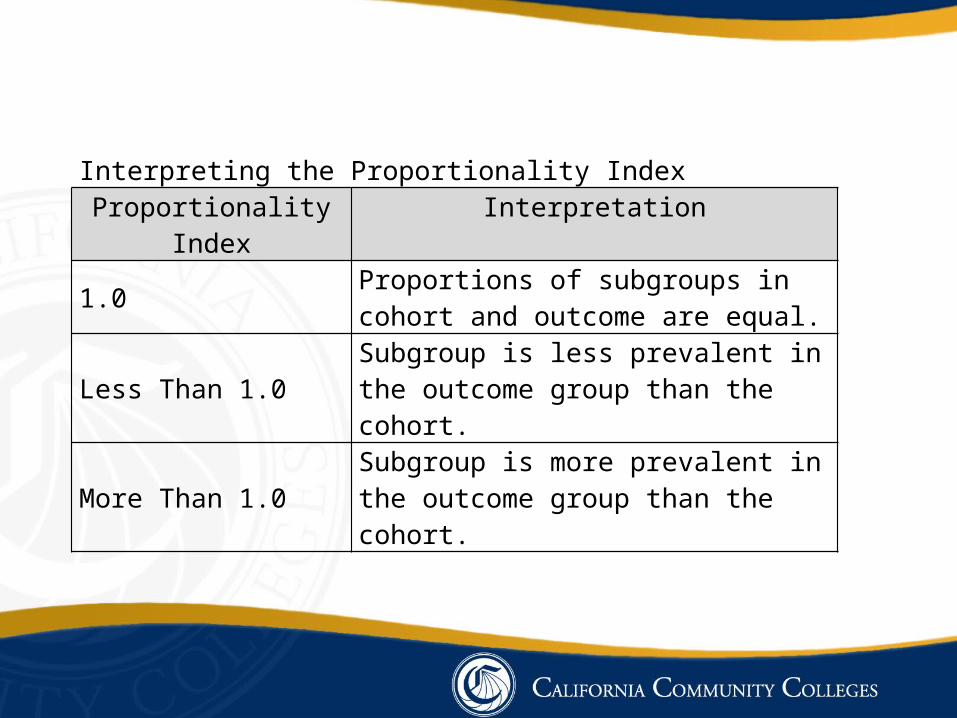
Interpreting the Proportionality IndexProportionality Index Interpretation
1.0Proportions of subgroups in cohort and outcome are equal.
Less Than 1.0Subgroup is less prevalent in the outcome group than the cohort.
More Than 1.0Subgroup is more prevalent in the outcome group than the cohort.
Race/Ethnicity2013 Scorecard Cohort Completion Outcome
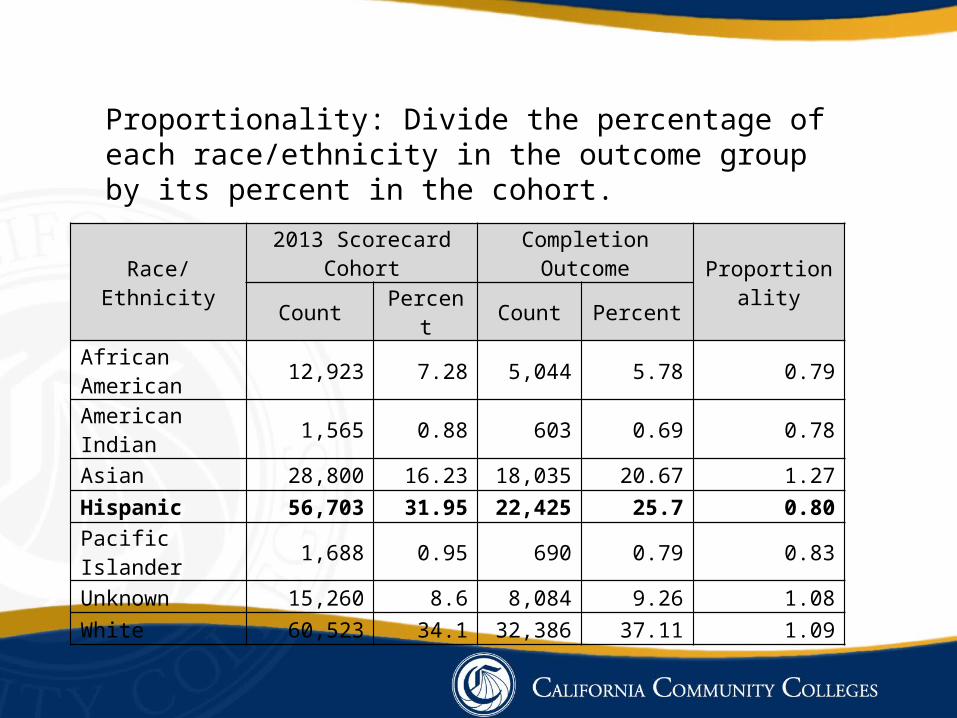
ProportionalityCount Percent Count PercentAfrican American 12,923 7.28 5,044 5.78 0.79American Indian 1,565 0.88 603 0.69 0.78Asian 28,800 16.23 18,035 20.67 1.27Hispanic 56,703 31.95 22,425 25.7 0.80Pacific Islander 1,688 0.95 690 0.79 0.83Unknown 15,260 8.6 8,084 9.26 1.08White 60,523 34.1 32,386 37.11 1.09
Proportionality: Divide the percentage of each race/ethnicity in the outcome group by its percent in the cohort.
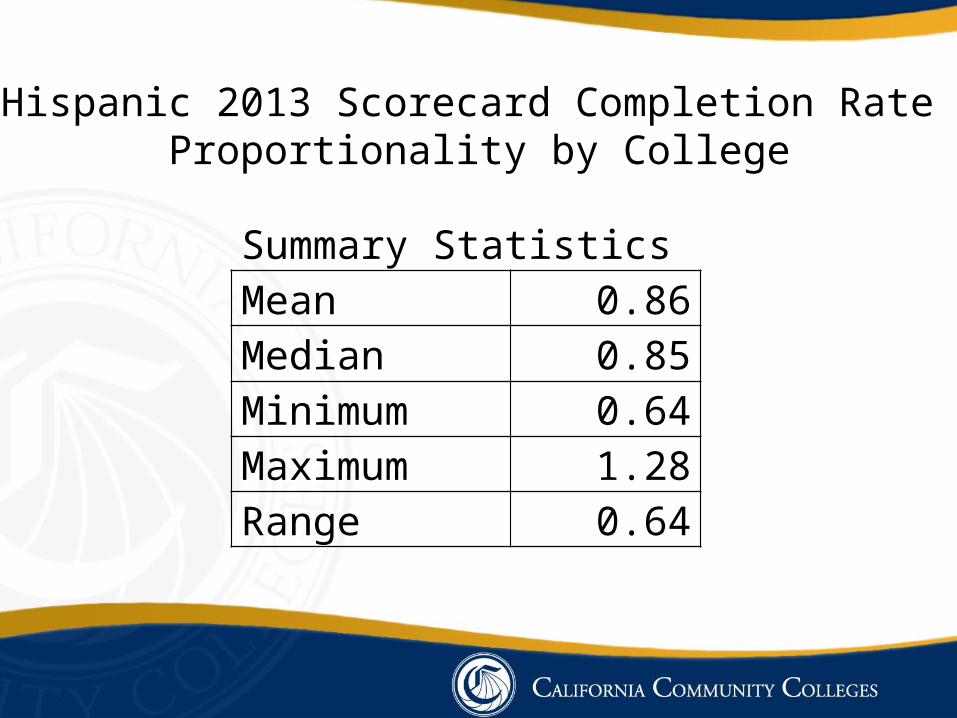
Summary StatisticsMean 0.86Median 0.85Minimum 0.64Maximum 1.28Range 0.64
Hispanic 2013 Scorecard Completion Rate Proportionality by College
Graduate or Professional Degree
Baccalaureate Degree
Associate Degree
Some College No Degree
High School Graduate
Grades 10,11,or 12 But Did Not Graduate
Grade Nine Or Less
All
0% 20% 40% 60% 80% 100%
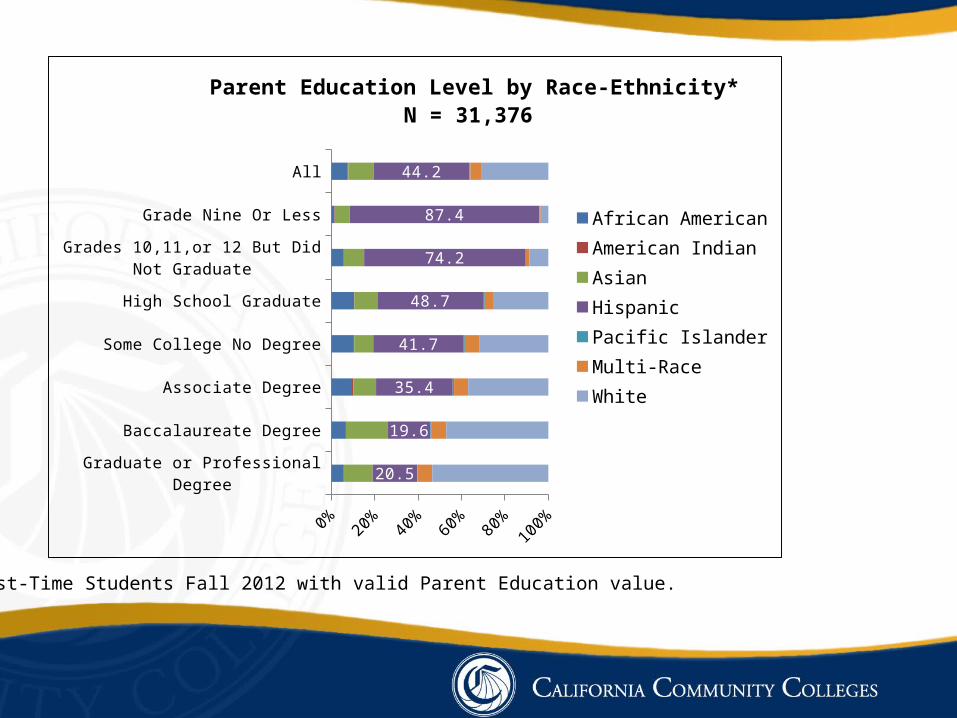
20.5
19.6
35.4
41.7
48.7
74.2
87.4
44.2
Parent Education Level by Race-Ethnicity* N = 31,376
African AmericanAmerican IndianAsianHispanicPacific IslanderMulti-RaceWhite
*First-Time Students Fall 2012 with valid Parent Education value.


![[PPT]Unpacking the Tools of Success - Dallas Independent … · Web viewAgenda I. DISD Core Beliefs II. Unpacking Student Expectations III. Characteristics of Learning Objectives](https://static.fdocuments.in/doc/165x107/5b1bbcd87f8b9a28258ee030/pptunpacking-the-tools-of-success-dallas-independent-web-viewagenda-i-disd.jpg)