UNMET SERVICE NEEDS AND CRITICAL GAPS -...
33
FFY2018-19_MHBG_DRAFT_071717_9AM CONDRAY: 7/17/17 9:20 AM Page 1 of 33 UNMET SERVICE NEEDS AND CRITICAL GAPS WITHIN NEVADA’S CURRENT MENTAL HEALTH SYSTEM FFY 2018 – 2019 BLOCK GRANT APPLICATION COMMUNITY MENTAL HEALTH SERVICES BLOCK GRANT (MHBG) PLAN AND REPORT NEVADA DEPARTMENT OF HEALTH & HUMAN SERVICES DIVISION OF PUBLIC & BEHAVIORAL HEALTH BUREAU of BEHAVIORAL HEALTH WELLNESS & PREVENTION WORKING DRAFT: 7/17/17 9:20 AM
Transcript of UNMET SERVICE NEEDS AND CRITICAL GAPS -...

FFY2018-19_MHBG_DRAFT_071717_9AM CONDRAY: 7/17/17 9:20 AM
Page 1 of 33
UNMET SERVICE NEEDS AND CRITICAL GAPS
WITHIN NEVADA’S CURRENT MENTAL HEALTH SYSTEM
FFY 2018 – 2019 BLOCK GRANT APPLICATION
COMMUNITY MENTAL HEALTH SERVICES BLOCK GRANT
(MHBG)
PLAN AND REPORT
NEVADA
DEPARTMENT OF HEALTH & HUMAN SERVICES
DIVISION OF PUBLIC & BEHAVIORAL HEALTH
BUREAU of BEHAVIORAL HEALTH WELLNESS & PREVENTION
WORKING DRAFT: 7/17/17 9:20 AM
FFY2018-19_MHBG_DRAFT_071717_9AM CONDRAY: 7/17/17 9:20 AM
Page 2 of 33
STEP 2:
Unmet Service Needs and Critical Gaps within Nevada’s Current Behavioral Health System
A wide range of information sources was examined for the purpose of identifying unmet service
needs and critical gaps in Nevada’s current behavioral health system, which is responsible for
serving each of the populations that were targeted by the Substance Abuse and Mental Health
Services Administration (SAMHSA) for FFY 2018-2019:
• Children with serious emotional disturbance (SED) and their families
• Adults with serious mental illness (SMI)
• Older Adults with serious mental illness (SMI)
• Individuals with SMI or SED in the rural and homeless populations
• Individuals who have an Early Serious Mental Illness (ESMI) (10 percent MHBG set aside)
Community psychiatric epidemiology and behavioral health data were reviewed to distinguish the
prevalence of mental disorders in Nevada and nationwide. When available, county-level prevalence
rates were considered to reveal subsets of the state’s population with particular needs. The rates of
persons served by the state’s current behavioral health system were then evaluated within the
context of the prevalence rates reported for the United States as a whole, and for Nevada and its
individual counties. Billing data for hospital emergency room visits related to mental health were
additionally considered as indicators of SED and SMI that were either untreated or ineffectively
managed. Finally, results are reported from recent focus groups that were conducted statewide to
identify unmet service needs and critical gaps from the perspectives of stakeholders and consumers.
The combined findings from these multiple sources of information indicate the presence of
significant unmet service needs and critical gaps within Nevada’s current behavioral health system,
and this information shaped the strategic priorities for the work that is planned for each target
population during FFY 2018–2019. An overview of these unmet needs and critical gaps is listed
below, and the evidence identifying their significance is then summarized.
Overview of Unmet Service Needs and Critical Gaps:
Nevada’s Current Behavioral Health System
1. Nevada’s children and adolescents are vulnerable to developing severe mental disorders,
which in the absence of effective interventions may progress to chronic and debilitating
illnesses. One-third of Nevada’s adolescents reported experiencing depressed mood and
reduced functioning during the year before they participated in the most recent 2015 Nevada
Youth Risk Behavior Survey, which is conducted by the Centers for Disease Control (CDC)
and Prevention, and local and state education and health agencies. The state’s youth were
more likely to report one or more suicide attempts during the prior year, compared to their
age peers nationwide. More than 20% acknowledged deliberate acts of self harm, such as
cutting or burning themselves, without the intent to die. Importantly, the clinical outcomes
and current mental health status, in 2017, for each adolescent who reported psychological
distress and life-threatening behaviors, in 2015, are unknown.
2. Expansion of early intervention services for individuals with early serious mental illness
(ESMI) and first episode of psychosis (FEP) throughout Nevada is a critical need.
Between 8% and 13% of Nevada’s children and adolescents are at risk for developing severe

FFY2018-19_MHBG_DRAFT_071717_9AM CONDRAY: 7/17/17 9:20 AM
Page 3 of 33
mental disorders. An additional 20% are vulnerable to psychological distress, suicide-
related behaviors, and acts of deliberate self harm without intent to die. Early intervention
services have been initiated for first episode of psychosis (FEP) in the urban counties of
northern and southern Nevada. Expanding these services to early serious mental illness
(ESMI), and to the rural and frontier regions of the state is vital.
3. Access to the state’s mental health services for children with serious emotional
disturbance (SED) and adults with serious mental illness (SMI) is severely limited.
The numbers of individuals covered by Medicaid benefits more than doubled between 2013
and 2015 due to the Medicaid expansion by Governor Brian Sandoval in 2014 under the
Affordable Care Act (ACA). However, the percentage of Nevada residents with SED and
SMI who were served by the state’s mental health system was less than 10% of each
population in FY 2016; eight percent (8%) of the estimated number of children with SED,
and nine percent (9%) of the estimated number of adults with SMI. Service penetration
rates for each population were lower than the rates nationwide.
Access to services is a complex issue. An important factor for Nevada is that almost all of
the state qualifies as a mental health professional shortage area (Health Resources and
Services Administration, HRSA), with the only exception being Las Vegas (Griswold et al.,
2017, Map 5.3, p. 148). Equally important is the lack of adequate health information
technology and measurement methodology to track productivity metrics associated with
community providers whose services are supported through Medicaid fee-for-service and
managed care resources. (See Unmet Needs/Critical Gaps # 4 and # 6 below.)
4. Nevada’s mental health workforce is underdeveloped in volume and in clinical expertise.
Almost all of the state of Nevada qualifies as a mental health professional shortage area.
The state’s geography and its low population density in rural and frontier regions amplify
the challenges associated with this critical shortage. Stable financial resources and active
investment from state leadership are required to incentivize professional training and
development for Nevada’s current and future mental health workforce.
5. Suicide prevention efforts are not integrated with clinical services or post-mortem reviews
within the state’s current mental health system. Nevada continues to rank in the top 10
states with the highest rates of suicide deaths nationwide. Countywide rates reflect the
highest numbers of suicide deaths per population in the rural and frontier regions.
Suicide-related conditions accounted for 39% of all behavioral-health related visits among
children and adolescents to Nevada’s emergency rooms from 2009 to 2014. Ideally, suicide
prevention efforts are integrated with clinical intervention services that involve evidence-
based and promising practices, and post-mortem reviews that support quality assurance and
performance improvement initiatives. This type of integrated model is incomplete and
fragmented in the urban counties of northern and southern Nevada, and nonexistent in the
state’s rural and frontier counties.
6. Health information technology and measurement methodology that support Nevada’s
current mental health care system, including its community providers, are characterized
by critical gaps. Data are not organized for prevention, planning, and treatment. This
includes a lack of effective support for monitoring and evaluating the efficacy of programs
based on access to services and clinical outcomes. Health records databases are not
integrated. The reference in Gap #1 (above) to findings from the 2015 Nevada Youth Risk
Behavior Survey serves to illustrate these technical and analytical deficiencies. Specifically,

FFY2018-19_MHBG_DRAFT_071717_9AM CONDRAY: 7/17/17 9:20 AM
Page 4 of 33
the clinical outcomes and current mental health status, in 2017, for each Nevada adolescent
who reported psychological distress and life-threatening behaviors, in 2015, are unknown.
7. Results were examined from ten (10) statewide focus groups that were conducted from
April 2016 to June 2016 as part of the planning and development phases for Certified
Community Behavioral Health Clinics (CCBHC) in Nevada (Woodard, 2016b).
Participants included consumers, family members, advocates and providers. Strong
agreement across participants was observed regarding broad themes, as well as specific
issues. Prominent themes and issues identified by focus group participants included:
• Staffing – Insufficient numbers of behavioral health providers and medical personnel
were identified, especially in psychiatry, child psychology and school social work.
Professional training for providers was consistently recommended in the areas of
crisis management, care coordination and peer support.
• Access – Both providers and consumers identified the need for more services, as
well as the need for more varieties of services.
• Care Coordination – The need to improve collaboration, coordination and
communication was identified, with sharing of data and electronic records
considered to be crucial. The importance of establishing a formal, defined standard
of care that is implemented statewide was emphasized. Use of multidisciplinary
teams for the care of complex cases was suggested.
• Services – More treatment options for different stages of illness were recommended,
as well as more resources devoted to prevention, early intervention, treatment, and
crisis management.

FFY2018-19_MHBG_DRAFT_071717_9AM CONDRAY: 7/17/17 9:20 AM
Page 5 of 33
• CHILDREN WITH SERIOUS EMOTIONAL DISTURBANCE (SED)
AND THEIR FAMILIES *
Rates of Serious Emotional Disturbance (SED) in Nevada’s Children: An estimated 37,266
children in Nevada suffered from serious emotional disturbance (SED) during 2015-2016, which
represents 11% of the state’s youth population (2016 SAMHSA Uniform Reporting System (URS)
Output Tables-Nevada). This estimate is similar to the 12-month prevalence rate of 8% for SED
observed among adolescents aged 13 to 17 who participated in the United States community survey
involving parallel household and school samples (Kessler et al., 2012, National Comorbidity Survey
Replication Adolescent Supplement). It is also comparable to the range of estimates for major
depressive episode (MDE) among adolescents in Nevada and the United States obtained by the
National Surveys on Drug Use and Health (NSDUH) that are shown in Table 1 (below).
Table 1: Past Year Major Depressive Episode (MDE) Among Adolescents Aged 12-17
in Nevada and the United States: 2010-2011 to 2013-2014
Years 2010-2011 2011-2012 2012-2013 2013-2014
Nevada 8.6% 8.5% 9.6% 11.6%
United States 8.1% 8.7% 9.9% 11.0%
Source: Substance Abuse and Mental Health Services Administration. Behavioral Health
Barometer: Nevada, 2015. HHS Publication No. SMA-16-Baro-2015-NV. Rockville, MD:
Substance Abuse and Mental Health Services Administration, 2015.
The most recent available NSDUH data indicate that approximately 26,000 adolescents in Nevada
(11.6% of all adolescents) per year in 2013-2014 experienced at least one major depressive episode
during the year before being surveyed. The rate for adolescents in Nevada was similar to the
national percentage observed for that same survey period. Importantly, the percentage experiencing
at least one major depressive episode during each survey period increased from 2010-2011 to
2013-2014.
Rates of Health Risk Behaviors in Nevada’s Children: The Youth Risk Behavior Surveillance
System (YRBSS) monitors health behaviors among youth and young adults to evaluate the success of
public health efforts directed to protect and enhance the wellbeing of these individuals nationwide.
YRBSS includes school-based survey, the Youth Risk Behavior Survey (YRBS), which is conducted
by the Centers for Disease Control and Prevention (CDC) and state and local education and health
agencies to collect population-based data on health behaviors of interest. This section summarizes
findings concerning the emotional health of Nevada’s youth who were surveyed for the 2015 YRBS
from February, 2015 through May, 2015.
FFY2018-19_MHBG_DRAFT_071717_9AM CONDRAY: 7/17/17 9:20 AM
Page 6 of 33
Emotional Health Profile of Nevada’s High School Students (Grades 9-12), 2015:
Tables 2 - 4 (below) summarize responses among Nevada’s High School students (Grades 9 –12) to
questions about their emotional health and suicide-related thoughts and behaviors that occurred
during the 12 months before they participated in the 2015 Nevada High School Youth Risk Behavior
Survey. Overall rates for United States High School students are provided as a comparison. Results
indicate that Nevada’s youth experienced disturbances to their emotional health during the
12 months before their participation in the survey, and these disturbances included symptoms of
depression and suicide attempts.
Psychological Distress and Suicide Attempts among Nevada’s Adolescents, 2015:
Two patterns emerged from the results of the 2015 Nevada High School Youth Risk Behavior
Survey (Table 2 and Table 3 below) that are informative about the emotional health of Nevada’s
High School Students, and that indicate the presence of unmet needs and critical gaps within the
state’s current behavioral health system. The first pattern concerns the proportion of Nevada’s high
school students (33%) who reported experiencing the hallmark symptoms of a major depressive
episode during the 12 months before the survey—“feeling sad or hopeless almost every day for two
or more weeks so that they stopped doing some usual activities.” The proportion of Nevada’s youth
who experienced this mood disturbance was elevated compared to the proportion of high school
students in the United States as a whole (30%), although this group difference did not reach
statistical significance (p=0.09). Moreover, 22% of Nevada’s adolescents reported having
intentionally cut or burned themselves without wanting to die during the 12 months before the
survey.
Thus, converging evidence suggests the presence of emotional disturbance and
disability for adolescents in Nevada, as well as nationwide, with 12-month prevalence estimates
ranging from 8% (national samples) and 9-13% (2016 SAMHSA Uniform Reporting System (URS)
Output Tables-Nevada) for serious emotional disturbance (SED), and 8-11% for major depressive
episode (MDE) (SAMHSA, NSDUH samples). Moreover, the hallmark symptoms of a major
depressive episode were reported by one third of Nevada’s adolescents, which was similar to the
national rate. This latter finding is suggestive of levels of psychological distress that are more
pervasive in this age cohort than would be expected based on the established 12-month prevalence
estimates for serious emotional disturbance (SED) and major depressive episode (MDE).
The second pattern evident from the 2015 Nevada High School Youth Risk Behavior
Survey involves a heightened risk of injury and death through suicide attempts made during the year
before they participated in the survey. As reflected in Table 2 (below) approximately 11% of
Nevada’s high school students reported having engaged in one or more suicide attempts during the
12 months before the survey, compared to 9% of US high school students. Importantly, that
difference between the proportions for Nevada and US adolescents was statistically significant
(p=0.03). Table 3a and Table 3b (below) provide a detailed profile of this subgroup of Nevada’s
adolescents by sex, age, grade and race/ethnicity (Table 3a), and by region (Table 3b). Results
show the greatest numbers of suicide attempts during the prior 12 months occurred for females,
students in the 9th and 10th grades, American Indians/Alaskan Natives, and for students living in
rural and frontier counties.

FFY2018-19_MHBG_DRAFT_071717_9AM CONDRAY: 7/17/17 9:20 AM
Page 7 of 33
Table 2: Summary of Emotional Health during the past 12 months, Nevada High School Students, 2015
(Adapted from: Youth Risk Behavior Surveillance System, 2015 High School Youth Risk Behavior Survey §)
Question
Nevada 2015 United States
2015
p-
value
Nevada
2015 more likely
than
United
States
2015
United
States
2015 more likely
than
Nevada
2015
No
difference
(NV = US)
Felt sad or hopeless? (almost every day for 2 or
more weeks in a row so that
they stopped doing some usual
activities during the 12 mos
before the survey) §
32.7 (30.0–35.6) ‡ 29.9 (28.0–31.8) 0.09
o
Intentionally cut or
burned themselves without
wanting to die? (one or
more times during the 12
mos before the survey) †
21.5 (19.9–23.0) — ~
Seriously considered
attempting suicide? (during the 12 mos before the
survey) §
17.2 (14.8–20.0) 17.7 (16.7–18.8) 0.71 o
Made a plan about how
they would attempt
suicide? (during the 12 mos
before the survey) §
15.8 (13.8–18.1) 14.6 (13.4–15.8) 0.31 o
Attempted suicide? (one
or more times during the 12
mos before the survey) §
10.7 (9.1–12.6) 8.6 (7.6–9.6) 0.03 o
Attempted suicide that
resulted in an injury,
poisoning, or overdose
that had to be treated by a
doctor or nurse (during the
12 mos before the survey) §
2.8 (2.0–3.7) 2.8 (2.2–3.5) 0.98 o
Footnotes: ‡ Percentage, 95% confidence interval; — Data not available; ~ = P-value not available
§ Accessed from Application URL on June 5, 2017:
https://nccd.cdc.gov/youthonline/App/Results.aspx?TT=G&OUT=0&SID=HS&QID=QQ&LID=NV&YID=2015&LID
2=XX&YID2=2015&COL=T&ROW1=N&ROW2=N&HT=QQ&LCT=LL&FS=S1&FR=R1&FG=G1&FI=I1&FP=P1
&FSL=S1&FRL=R1&FGL=G1&FIL=I1&FPL=P1&PV=&TST=True&C1=NV2015&C2=XX2015&QP=G&DP=1&V
A=CI&CS=N&SYID=&EYID=&SC=DEFAULT&SO=ASC
† Source: Lensch T, Baxa A, Zhang F, Gay C, Larson S, Clements-Nolle K, Yang W. State of Nevada, Division of
Public and Behavioral Health and the University of Nevada Reno. 2015 Nevada High School Youth Risk Behavior
Survey (YRBS), Table 32, p. 36.

FFY2018-19_MHBG_DRAFT_071717_9AM CONDRAY: 7/17/17 9:20 AM
Page 8 of 33
Table 3a: Percentage of high school students who attempted suicide a by sex, age, grade and race/ethnicity
Nevada, Youth Risk Behavior Survey, 2015 §
Yes No
N b % c CI (95%) d N % CI (95%)
Overall Total Total 488 9.8% (8.7-10.9) 3928 90.2% (89.1-91.3)
Sex Female 308 11.7% (10.0-13.4)
Male 176 7.8% (6.4-9.3)
Age 14 years old or
younger 61 9.6% (6.7-12.6)
15 years old 148 11.6% (9.4-13.8)
16 years old 134 10.0% (7.7-12.4)
17 years old 110 9.9% (7.8-12.0)
18 years old or
older 34 5.7 (3.2-8.3)
Grade 9th grade 159 11.4% (9.1-13.7)
10th grade 136 11.3% (8.9-13.7)
11th grade 115 8.8% (6.7-11.0)
12th grade 70 7.5% (5.6-9.3)
Race/Ethnicity American
Indian/Alaska
Native
10 16.5% (5.2-27.9)
Asian 19 8.0% (3.8-12.2)
Black 21 8.0% (4.1-11.9)
Native
Hawaiian/Pacifi
c Islander
9 9.5% (2.4-16.6)
White 173 8.4% (6.6-10.1)
Hispanic/Latino 210 11.4% (9.6-13.2)
Footnotes: a Attempted suicide one or more times during the 12 months before the survey. b Sample size in the total and subgroups may differ due to missing data. c Weighted row percent d Percentage, 95% confidence interval
§ Adapted from: Lensch T, Baxa A, Zhang F, Gay C, Larson S, Clements-Nolle K, Yang W. State of
Nevada, Division of Public and Behavioral Health and the University of Nevada Reno. 2015 Nevada High
School Youth Risk Behavior Survey (YRBS), Table 30, p. 34.

FFY2018-19_MHBG_DRAFT_071717_9AM CONDRAY: 7/17/17 9:20 AM
Page 9 of 33
Table 3b: Percentage of high school students who attempted suicide a by region
Nevada, Youth Risk Behavior Survey, 2015 §
Yes No
N b % c CI (95%) d N % C.I. (95%)
Overall
Total Total 488 9.8% (8.7-10.9) 3928 90.2% (89.1-91.3)
Region Carson City and
Douglas 35 11.7% (3.1-20.4)
Elko, White Pine and
Eureka 37 11.4% (7.0-15.9)
Churchill, Humboldt,
Pershing and Lander 26 8.3% (3.0-13.5)
Lyon, Mineral and
Storey 25 12.8% (7.9-17.6)
Nye and Lincoln 52 14.9% (11.4-18.4)
Washoe 119 11.7% (9.0-14.4)
Clark 194 9.2% (7.8-10.5)
Footnotes: a Attempted suicide one or more times during the 12 months before the survey. b Sample size in the total and subgroups may differ due to missing data. c Weighted row percent d Percentage, 95% confidence interval
§ Adapted from: Lensch T, Baxa A, Zhang F, Gay C, Larson S, Clements-Nolle K, Yang W. State
of Nevada, Division of Public and Behavioral Health and the University of Nevada Reno. 2015
Nevada High School Youth Risk Behavior Survey (YRBS), Table 30, p. 34.

FFY2018-19_MHBG_DRAFT_071717_9AM CONDRAY: 7/17/17 9:20 AM
Page 10 of 33
Suicide Attempts with Injuries and Medical Intervention among Nevada’s Youth,
2015: The 2015 Nevada High School Youth Risk Behavior Survey results determined that 3% of
Nevada’s high school students reported having made suicide attempts that resulted in injury,
poisoning or overdose, and that required treatment from a doctor or nurse. The national rate for
suicide attempts that resulted in medical intervention did not differ from Nevada’s rate. Thus,
Nevada’s adolescents were more likely to have made a suicide attempt during the 12 months before
participating in the survey, compared to US adolescents as a whole, but this group effect did not
hold for attempts that required treatment from a medical professional.
Tables 4a – 4g (below) show the frequencies of suicide related injuries among
Nevada’s residents who were treated during emergency department visits from February 1, 2014 to
May 31, 2015. Frequencies represent numbers of injuries that are reported by external cause of
injury (methods of self injury), age and region. Age is distinguished among children younger than
14, adolescents aged 14 to 19, and adults aged 20 and older. The most frequently used methods for
these attempts statewide were self-inflicted poisoning by solid or liquid substances and self-inflicted
injury by cutting and piercing instrument. These most common methods were observed across all
urban and rural regions of the state.
Tables 4a – 4e: Rural and Frontier Counties
Table 4a: Carson City & Douglas County Suicide Attempts: External Cause of Injury, Emergency Room Visits by Age, 02/01/2014-5/31/2015
Age during
Emergency Room Visit
< 14
f
14-19
f
20+
f
Solid or Liquid Substance 3 33 38 Gases in Domestic Use 0 0 0 Other Gases and Vapors 0 1 0 Hanging Strangulation and Suffocation 0 1 4 Submersion [Drowning] 0 0 0 Firearms Air Guns and Explosives 0 0 1 Cutting and Piercing Instrument 1 18 44 Jumping form High Place 0 0 0 Other and Unspecified Means 0 5 9 Source: Hospital Emergency Room Discharge, Nevada Division of Public and Behavioral Health,
Office of Public Informatics and Epidemiology, June 2017
*Categories are not mutually exclusive.

FFY2018-19_MHBG_DRAFT_071717_9AM CONDRAY: 7/17/17 9:20 AM
Page 11 of 33
Table 4b: Elko County, White Pine County, Eureka County Suicide Attempts: External Cause of Injury, Emergency Room Visits by Age, 02/01/2014-5/31/2015
Age during
Emergency Room Visit
< 14
f
14-19
f
20+
f
Solid or Liquid Substance 1 19 45 Gases in Domestic Use 0 0 0 Other Gases and Vapors 0 0 1 Hanging Strangulation and Suffocation 0 1 1 Submersion [Drowning] 0 0 0 Firearms Air Guns and Explosives 0 1 1 Cutting and Piercing Instrument 0 7 16 Jumping form High Place 0 0 0 Other and Unspecified Means 1 1 4 Source: Hospital Emergency Room Discharge, Nevada Division of Public and Behavioral Health,
Office of Public Informatics and Epidemiology, June 2017
*Categories are not mutually exclusive.
Table 4c: Churchill County, Humboldt County, Pershing County, Lander County Suicide Attempts: External Cause of Injury, Emergency Room Visits by Age, 02/01/2014-5/31/2015
Age during
Emergency Room Visit
< 14
f
14-19
f
20+
f
Solid or Liquid Substance 5 17 52 Gases in Domestic Use 0 0 0 Other Gases and Vapors 0 1 0 Hanging Strangulation and Suffocation 0 3 5 Submersion [Drowning] 0 0 0 Firearms Air Guns and Explosives 0 0 3 Cutting and Piercing Instrument 1 10 21 Jumping form High Place 0 0 0 Other and Unspecified Means 0 2 6 Source: Hospital Emergency Room Discharge, Nevada Division of Public and Behavioral Health,
Office of Public Informatics and Epidemiology, June 2017scharge
*Categories are not mutually exclusive.

FFY2018-19_MHBG_DRAFT_071717_9AM CONDRAY: 7/17/17 9:20 AM
Page 12 of 33
Table 4d: Lyon County, Mineral County, Storey County Suicide Attempts: External Cause of Injury, Emergency Room Visits by Age, 02/01/2014-5/31/2015
Age during
Emergency Room Visit
< 14
f
14-19
f
20+
f
Solid or Liquid Substance 5 10 23 Gases in Domestic Use 0 0 0 Other Gases and Vapors 0 0 0 Hanging Strangulation and Suffocation 0 0 2 Submersion [Drowning] 0 0 0 Firearms Air Guns and Explosives 0 0 0 Cutting and Piercing Instrument 0 13 15 Jumping form High Place 0 0 0 Other and Unspecified Means 2 0 6 Source: Hospital Emergency Room Discharge, Nevada Division of Public and Behavioral Health,
Office of Public Informatics and Epidemiology, June 2017
*Categories are not mutually exclusive.
Table 4e: Nye County & Lincoln County Suicide Attempts: External Cause of Injury, Emergency Room Visits by Age, 02/01/2014-5/31/2015
Age during
Emergency Room Visit
< 14
f
14-19
f
20+
f
Solid or Liquid Substance 2 21 68 Gases in Domestic Use 0 0 0 Other Gases and Vapors 0 0 1 Hanging Strangulation and Suffocation 0 0 3 Submersion [Drowning] 0 0 0 Firearms Air Guns and Explosives 0 0 1 Cutting and Piercing Instrument 5 19 27 Jumping form High Place 0 0 0 Other and Unspecified Means 0 5 14 Source: Hospital Emergency Room Discharge, Nevada Division of Public and Behavioral Health,
Office of Public Informatics and Epidemiology, June 2017
*Categories are not mutually exclusive.

FFY2018-19_MHBG_DRAFT_071717_9AM CONDRAY: 7/17/17 9:20 AM
Page 13 of 33
Tables 4f – 4g: Urban Counties
Table 4f: Washoe County Suicide Attempts: External Cause of Injury, Emergency Room Visits by Age, 02/01/2014-5/31/2015
Age during
Emergency Room Visit
< 14
f
14-19
f
20+
f
Solid or Liquid Substance 10 130 352 Gases in Domestic Use 0 0 0 Other Gases and Vapors 0 0 1 Hanging Strangulation and Suffocation 0 7 8 Submersion [Drowning] 0 0 0 Firearms Air Guns and Explosives 0 0 6 Cutting and Piercing Instrument 5 39 231 Jumping form High Place 0 0 3 Other and Unspecified Means 2 17 44 Source: Hospital Emergency Room Discharge, Nevada Division of Public and Behavioral Health,
Office of Public Informatics and Epidemiology, June 2017
*Categories are not mutually exclusive.
Table 4g: Clark County Suicide Attempts: External Cause of Injury, Emergency Room Visits by Age, 02/01/2014-5/31/2015
Age during
Emergency Room Visit
< 14
f
14-19
f
20+
f
Solid or Liquid Substance 49 381 1437 Gases in Domestic Use 0 0 2 Other Gases and Vapors 0 3 15 Hanging Strangulation and Suffocation 6 21 66 Submersion [Drowning] 0 0 1 Firearms Air Guns and Explosives 0 1 30 Cutting and Piercing Instrument 41 229 631 Jumping form High Place 0 2 17 Other and Unspecified Means 11 64 236 Source: Hospital Emergency Room Discharge, Nevada Division of Public and Behavioral Health,
Office of Public Informatics and Epidemiology, June 2017
*Categories are not mutually exclusive.
FFY2018-19_MHBG_DRAFT_071717_9AM CONDRAY: 7/17/17 9:20 AM
Page 14 of 33
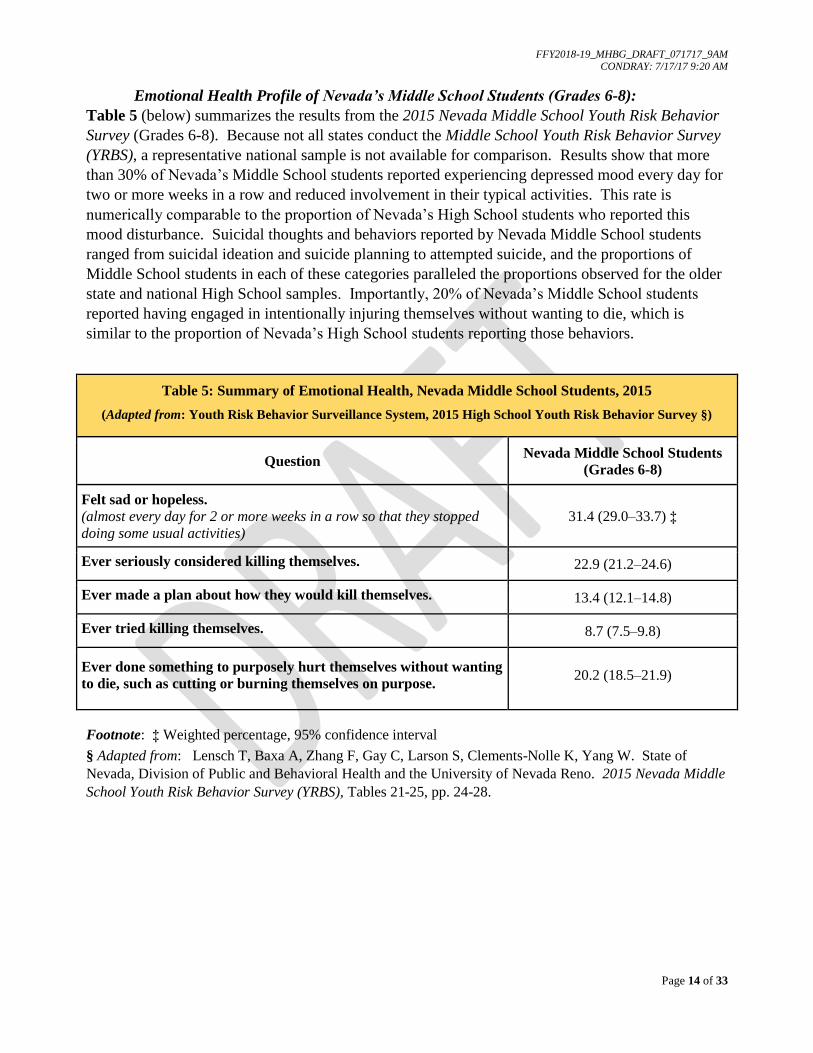
Emotional Health Profile of Nevada’s Middle School Students (Grades 6-8):
Table 5 (below) summarizes the results from the 2015 Nevada Middle School Youth Risk Behavior
Survey (Grades 6-8). Because not all states conduct the Middle School Youth Risk Behavior Survey
(YRBS), a representative national sample is not available for comparison. Results show that more
than 30% of Nevada’s Middle School students reported experiencing depressed mood every day for
two or more weeks in a row and reduced involvement in their typical activities. This rate is
numerically comparable to the proportion of Nevada’s High School students who reported this
mood disturbance. Suicidal thoughts and behaviors reported by Nevada Middle School students
ranged from suicidal ideation and suicide planning to attempted suicide, and the proportions of
Middle School students in each of these categories paralleled the proportions observed for the older
state and national High School samples. Importantly, 20% of Nevada’s Middle School students
reported having engaged in intentionally injuring themselves without wanting to die, which is
similar to the proportion of Nevada’s High School students reporting those behaviors.
Table 5: Summary of Emotional Health, Nevada Middle School Students, 2015
(Adapted from: Youth Risk Behavior Surveillance System, 2015 High School Youth Risk Behavior Survey §)
Question Nevada Middle School Students
(Grades 6-8)
Felt sad or hopeless.
(almost every day for 2 or more weeks in a row so that they stopped
doing some usual activities)
31.4 (29.0–33.7) ‡
Ever seriously considered killing themselves. 22.9 (21.2–24.6)
Ever made a plan about how they would kill themselves. 13.4 (12.1–14.8)
Ever tried killing themselves. 8.7 (7.5–9.8)
Ever done something to purposely hurt themselves without wanting
to die, such as cutting or burning themselves on purpose. 20.2 (18.5–21.9)
Footnote: ‡ Weighted percentage, 95% confidence interval
§ Adapted from: Lensch T, Baxa A, Zhang F, Gay C, Larson S, Clements-Nolle K, Yang W. State of
Nevada, Division of Public and Behavioral Health and the University of Nevada Reno. 2015 Nevada Middle
School Youth Risk Behavior Survey (YRBS), Tables 21-25, pp. 24-28.

FFY2018-19_MHBG_DRAFT_071717_9AM CONDRAY: 7/17/17 9:20 AM
Page 15 of 33
SUMMARY: Findings from the recent 2015 National Surveys on Drug Use and Health and
the 2015 Nevada High School Youth Risk Behavior Survey indicate the health and well being of
Nevada’s children and adolescents are compromised, and raise serious questions about the services
available to these individuals through the state’s current mental health system. An important
question concerns whether responsible adults and educators were aware that Nevada’s high school
and middle school students were experiencing significant psychological distress, and engaging in
suicide attempts and deliberate acts of self harm that did not necessarily result in medical
intervention. A related question concerns the severity of their distress, and the degree of their
suicide risk and self injury. It is possible that the acuity of psychological distress and the lethality
of suicidal behaviors were low to moderate, and that each resolved without attracting much
attention. It is also possible that in the absence of effective mental health intervention, such
psychological distress and ‘silent’ suicide attempts may escalate in syndromal distinctiveness and
severity, and in risk for injury and death. Providing appropriate and optimal interventions to such
individuals will depend on a range of health services capacities, including the accurate identification
of subsets within these populations. Nevada’s current mental health workforce is underdeveloped,
and ongoing training and educational efforts have been identified as a program priority for
FFY2018-2019.

FFY2018-19_MHBG_DRAFT_071717_9AM CONDRAY: 7/17/17 9:20 AM
Page 16 of 33
Access to Services for Nevada’s Children with Serious Emotional Disturbance (SED):
Services Provided by the Nevada State Mental Health Authority (SMHA): An estimated
37,266 children in Nevada suffered from serious emotional disturbance (SED) during 2015-2016,
which represents 11% of the state’s youth population (2016 SAMHSA Uniform Reporting System
(URS) Output Tables-Nevada). Based on the National Outcomes Measures (NOMS) for this
period, 3,035 children with serious emotional disturbance (SED) were served by Nevada’s State
Mental Health Authority (SMHA), which represents eight percent (8%) of the estimated services
need for this population. Service penetration rates are presented below for Nevada’s children
aged 0-17, and the national rates are provided as a comparison.
Table 6: Children with SED served by the Nevada State Mental Health Authority by Age, FY 2016
Age (years)
Total Served Penetration Rates
(per 1,000 population) Nevada US
n % n % State US
Total 13,435 100.0% 4,979,257 100.0% 4.6 15.3
0-12 1,404 10.5% 769,252 15.4% 2.9 14.6
13-17 1,631 12.1% 639,492 12.8% 8.7 30.6
Source: 2016 SAMHSA Uniform Reporting System (URS) - Nevada
Division of Child and Family Services (DCFS), in the Nevada Department of Health and Human
Services (DHHS), reported serving 2,486 children with SED during FY 2016. Of the 3,035 children
with SED who were served by the State Mental Health Authority, an estimated 530 children were
provided care in Nevada’s rural communities through the Division of Public and Behavioral Health
(DPBH) Rural Clinics for Mental Health Services. These services include patient assessments in
the rural hospitals, and direct care services at each of 16 Rural Clinic locations.
Treatment for Depression Among Nevada’s Adolescents with Major Depressive Episode,
Aged 12-17: As summarized in the previous section, the most recent available data reported by the
National Surveys on Drug Use and Health (NSDUH) indicate that approximately 26,000
adolescents in Nevada (11. 6% of all adolescents in the state), per year in 2013-2014, experienced at
least one Major Depressive Episode
(MDE) during the year before being
surveyed. Nevada’s percentage of
adolescents experiencing MDE was
similar to the national percentage.
Importantly, as shown in Figure 1 (left),
almost one-third of Nevada’s
adolescents with MDE received
treatment for depression (31.4%), which
was similar to the annual national
average (38.6%) from 2010 to 2014.
Source: SAMHSA, Center for Behavioral Health and Quality, NSDUH, 2010-2014

FFY2018-19_MHBG_DRAFT_071717_9AM CONDRAY: 7/17/17 9:20 AM
Page 17 of 33
Hospital Emergency Room Visits for Mental Health Conditions Among Nevada’s Youth,
Aged 17 and Younger: Limited access to community-based mental health services contributes to
over-utilization of hospital emergency departments. Billing data for hospital emergency room visits
related to mental health conditions were examined as indicators of serious emotional disturbance
(SED) that was either untreated or ineffectively managed. Table 9 (below) provides the frequencies
of emergency room visits by mental health conditions in four domains: mental disorder categories
(mood, anxiety, psychosis); suicidal behaviors (tendencies and ideation); suicide attempts by
method; and substance use disorders (alcohol and other drug). Condition frequencies are based on
emergency room billing codes compiled by University of Nevada, Las Vegas, Center for Health
Information Analysis (CHIA). Data are based on visits, not patients, with any single individual
potentially representing multiple visits.
Depression, drug-related conditions, suicidal ideation and anxiety were the most frequent mental
health conditions diagnosed for Nevada youth who presented to emergency rooms in Nevada
hospitals from 2009 to 2014. Suicide conditions accounted for 39% of the total visits over that
six-year period for this cohort of youth aged 17 and younger. Suicide attempts, combined across
methods (n=2,989 visits), represented 13% of suicide conditions. Suicidal tendencies and ideation
(n=5,907 visits) accounted for an additional 26% of the suicide category.
Table 9: Select Mental Health Related Emergency Room Visits by Gender, Aged 17 and Younger,
Nevada Residents, 2009-2014
Condition Female Male Unknown Total
N Row % N Row % N Row %
Anxiety 2,668 65.1% 1,428 34.9% 0 0.0% 4,096
Depression 4,294 66.2% 2,197 33.8% 0 0.0% 6,491
Bipolar 1,243 49.8% 1,252 50.2% 0 0.0% 2,495
PTSD 270 57.6% 199 42.4% 0 0.0% 469
Schizophrenia 202 49.3% 208 50.7% 0 0.0% 410
Suicidal Tendencies 877 66.7% 437 33.3% 0 0.0% 1,314
Suicidal Ideation 2,767 60.2% 1,826 39.8% 0 0.0% 4,593
Alcohol Related 1,501 47.1% 1,687 52.9% 0 0.0% 3,188
Other Drug Related 3,394 52.9% 3,018 47.1% 1 0.0% 6,413
Suicide Attempt- Solid or Liquid 1,334 77.7% 382 22.3% 0 0.0% 1,716
Suicide Attempt- Gases in Domestic Use 0 0.0% 1 100.0% 0 0.0% 1
Suicide Attempt- Other Gases and Vapors 5 35.7% 9 64.3% 0 0.0% 14
Suicide Attempt- Hanging, Strangulation, Suffocation 43 46.7% 49 53.3% 0 0.0% 92
Suicide Attempt- Cutting & Piercing Instrument 642 73.2% 235 26.8% 0 0.0% 877
Suicide Attempt- Firearms, Air Guns, Explosives 2 20.0% 8 80.0% 0 0.0% 10
Suicide Attempt- Jumping from High Place 8 66.7% 4 33.3% 0 0.0% 12
Suicide Attempt- Drowning 2 100.0% 0 0.0% 0 0.0% 2
Suicide Attempt- Other Unspecified Means 104 39.2% 161 60.8% 0 0.0% 265
Total Behavioral Health Visits* 13,012 56.9% 9,851 43.1% 1 0.0% 22,864
Source: Hospital Emergency Room Discharge, Nevada Division of Public and Behavioral Health,
Office of Public Informatics and Epidemiology, June 2017
* Categories are not mutually exclusive.

FFY2018-19_MHBG_DRAFT_071717_9AM CONDRAY: 7/17/17 9:20 AM
Page 18 of 33
Medicaid Expansion under the Affordable Care Act (ACA) and Health Services Utilization:
Health care financing plays a significant role in the frequency and type of health services that
people use. Equally important is the availability and quality of health care services. Both factors
are clearly reflected in the patterns of health services utilization observed among Nevada residents.
Firstly, the numbers of Nevada residents covered by Medicaid benefits more than doubled when the
state expanded Medicaid coverage in 2014 by Governor Brian Sandoval under the Affordable Care
Act (ACA), increasing from 351,315 in 2013 to 654,442 in 2015. Secondly, as reflected in Table *
(below), this increase in health care coverage appears to have impacted the frequency with which
Nevada residents used health care services, most notably inpatient facilities and hospital emergency
departments. Thus, the dual influences of increased health care coverage, and limited access to
appropriate and optimal services are demonstrated in the utilization of Emergency Department
Services for a wide range of mental health-related conditions from 2009 to 2014, shown in Table *
(above), and the dramatic increase in emergency room visits in 2015, after Medicaid expansion in
2014, shown in Table * (below).
Table *: Medicaid Managed Care Organizations (MCO) and Fee-for-Service (FFS) Utilization, 2015
MCO-FFS Utilization: Percent Change from Calendar Years 2013 – 2015
Provider/Service Type 2013 2015 % Change
MCO Inpatient 441 6,626 93%
Outpatient 588,868 1,482,972 60%
Emergency Room Visits 9,014 48,784 82%
FFS
Inpatient 4,656 8,645 46%
Outpatient 2,197,658 2,474,380 11%
Emergency Room Visits 6,298 12,019 48%
Source: S. Woodard and Nevada Division of Health Care Financing and Policy (2016)

FFY2018-19_MHBG_DRAFT_071717_9AM CONDRAY: 7/17/17 9:20 AM
Page 19 of 33
• ADULTS WITH SERIOUS MENTAL ILLNESS (SMI) *
Rates of Serious Mental Illness (SMI) Among Nevada’s Adults Aged 18 and Older:
An estimated 119,373 adults in Nevada suffered from serious mental illness (SMI) during 2015-
2016, which represents 5.4% of the state’s adult population (2016 SAMHSA Uniform Reporting
System (URS) Output Tables-Nevada). This estimate is generally consistent with the 12-month
prevalence rates for adults aged 18 and older who participated in national and international
community epidemiology surveys. Based on the U.S. National Comorbidity Survey Replication
(Kessler et al., 2005), the 12-month prevalence estimate for the presence of a serious mental
disorder was 5.7%. Based on the World Health Organization-World Mental Health Surveys
(Kessler et al., 2012), involving 28 countries, the 12-month prevalence estimates for serious mental
illness (SMI) were: 4.0-6.8% for one-half of the surveys; 2.3-3.6% for another quarter; and
0.8-1.9% for the final quarter. Finally, those prevalence estimates are also similar to the range of
estimates for serious mental illness (SMI) among adults in Nevada and the United States based on
the National Surveys on Drug Use and Health (NSDUH), which are presented in Table 6 (below).
Table 6: Past Year Serious Mental Illness (SMI) Among Adults Aged 18 or Older
in Nevada and the United States: 2010-2011 to 2013-2014
Years 2010-2011 2011-2012 2012-2013 2013-2014
Nevada 4.0% 3.9% 4.1% 4.3%
United States 3.9% 4.0% 4.1% 4.2%
Source: Substance Abuse and Mental Health Services Administration. Behavioral Health Barometer:
Nevada, 2015. HHS Publication No. SMA-16-Baro-2015-NV. Rockville, MD: Substance Abuse and Mental
Health Services Administration, 2015.
The most recent available NSDUH data indicate that approximately 91,000 adults in Nevada (4.3%
of all adults), per year in 2013-2014, experienced serious mental illness during the year before being
surveyed. Nevada’s rate was similar to the national percentage for that same survey period. The
percentage of adults with SMI did not change significantly from 2010-2011 to 2013-2014.
It is worthwhile to note the quality of the assessment methodology used to obtain the
estimates of serious mental illness in the 2015 National Survey on Drug Use and Health (NSDUH).
Estimates for this diagnostic category were based on follow-up telephone interviews of a sub-
sample from the Mental Health Surveillance Study (MHSS). These follow-up contacts included the
administration of structured clinical interviews (Structured Clinical Interview for DSM-IV, SCID-
IV: First et al., 2002) by trained mental health clinicians. Adults with serious mental illness (SMI)
were identified from among individuals who met the criteria for any mental illness (AMI) based on
these interviews. An adult with AMI was any person having the presence of any mental, behavioral
or emotional disorder during the past year that met DSM-IV criteria, excluding developmental
disorders and substance use disorders. Adults with AMI were defined as having SMI if they had
any mental, behavioral, or emotional disorder that substantially interfered with or limited one or
more major life activities (Center for Behavioral Health Statistics and Quality, 2016).

FFY2018-19_MHBG_DRAFT_071717_9AM CONDRAY: 7/17/17 9:20 AM
Page 20 of 33
Expected Rates of Specific Mental Disorders Among Nevada’s Adults, Aged 18 and Older:
Lifetime and twelve-month prevalence rates for specific mental disorders are available from a
nationally representative face-to-face household survey (Kessler et al., 2005, United States National
Comorbidity Survey Replication) and international face-to-face community surveys conducted in
seventeen countries in Africa, the Americas, Asia and the Pacific, Europe and the Middle East
(Kessler et al., 2007b, World Health Organization’s World Mental Health Survey). Both surveys
were conducted from February 2001 to April 2003. Consideration of these data provides
empirically-derived benchmarks for anticipating the expected rates for Nevada residents who are
members of the targeted populations, as well as for assessing the levels of access to appropriate and
optimal services for those targeted population members.
Table 7a and Table 7b (below) present the ranges of lifetime and 12-month prevalence
estimates for specific classes of disorders (anxiety disorders, mood disorders, impulse-control
disorders, substance use disorders, and any disorder) that were determined by the United States
National Comorbidity Survey Replication and the World Health Organization’s World Mental
Health Survey.
Table 7a: Lifetime prevalence of DSM-IV Disorders, International 1 and National 2 Surveys
Survey Any anxiety
disorder
Any mood
disorder
Any impulse-
control disorder
Any substance-
use disorder
Any disorder
WHO
World Mental
Health Surveys 1
All 17 Countries
combined
(Aged 18 & older;
14 countries)
United States
(Aged 18 & older)
Median % (IQR) a
4.8-31.0
(9.9-16.7)
%/N b (SE) c
31.0/2692 (1.0)
Median % (IQR)
3.3-21.4
(9.8-15.8)
%/N (SE)
21.4/2024 (0.6)
Median % (IQR)
0.3-25.0
(3.1-5.7)
%/N (SE)
25.0/1051 (1.1)
Median % (IQR)
1.3-15.0
(4.8-9.6)
%/N (SE)
14.6/1144 (0.6)
Median % (IQR)
12.0-47.4
(18.1-36.1)
%/N (SE)
47.4/3929 (1.1)
United States
National
Comorbidity
Survey
Replication2
(Aged 18 & older)
% (SE)
28.8 (0.9)
% (SE)
20.8 (0.6)
% (SE)
24.8 (1.1)
% (SE)
14.6 (0.6)
% (SE)
46.4 (1.1)
Adapted from: 1 Kessler et al. (2007b); 2 Kessler et al. (2005a).
a IQR; 25th – 75th percentiles across countries. b N=number of respondents with the disorders indicated in the column
heading; denominators were the numbers of respondents by disorder in each sample by country. c SE; standard error.

FFY2018-19_MHBG_DRAFT_071717_9AM CONDRAY: 7/17/17 9:20 AM
Page 21 of 33
Table 7b: Twelve-month prevalence of DSM-IV Disorders, International 1,2 and National 3 Surveys
Survey Any anxiety
disorder
Any mood
disorder
Any impulse-
control disorder
Any substance-
use disorder
Any disorder
WHO
World Mental
Health Surveys 1,2
All Countries
combined
(Aged 18 & older)
United States
(Aged 18 & older)
Mean % (IQR)†
8.3
(6.5-12.1)
Mean % (SE) §
19.0 (0.7)
Mean % (IQR)
5.1
(3.4-6.8)
Mean % (SE)
9.7 (0.4)
Mean % (IQR)
0.1-10.5.0
(0.6-2.6)
Mean % (SE)
10.5 (0.7)
Mean % (IQR)
0.2-6.4
(1.2-2.8)
Mean % (SE)
3.8 (0.4)
Mean % (IQR)
4.3-26.4
(9.1-16.9)
Mean % (SE)
27.0 (0.9)
United States
National
Comorbidity Survey
Replication 3
(Aged 18 & older)
% (SE)
18.1 (0.7)
% (SE)
9.5 (0.4)
% (SE)
8.9 (0.5)
% (SE)
3.8 (0.3)
% (SE)
26.2 (0.8)
Adapted from: 1 Kessler et al. (2007b); 2 Kessler et al. (2004); 3 Kessler et al. (2005b). † IQR; 25th – 75th percentiles across countries
§ SE; standard error
Expected Rates of Schizophrenia, Non-affective Psychosis (NAP) and Bipolar Disorder
Among Nevada’s Adults, Aged 18 and Older: The median rate of new cases of schizophrenia each
year, or incidence, is estimated to be 15.2 per 100,000 population (McGrath et al., 2008), and the
first episode of psychosis exhibits a peak onset between 15 and 25 years of age (Heinssen et al.,
2014; Kessler et al., 2007). The estimated lifetime prevalence rates for schizophrenia and
schizophreniform disorders range from 0.3-1.6% per 1,000 population (Kessler et al., 2005c). The
lifetime prevalence rate for the broader category of non-affective psychosis (NAP) is estimated at
approximately twice the rate for schizophrenia and schizophreniform disorder (Kessler et al.,
2005c). Non-affective psychosis (NAP) has been examined systematically in at least one large-
scale community epidemiology survey (Kendler et al., 1996), in which a probability subsample
received an initial screen for psychotic symptoms, and detailed follow up interviews that were
conducted by mental health professionals of one-third of the initial participants based on their
responses to the screen. Clinician defined diagnoses of non-affective psychosis in that study
resulted in lifetime prevalence rates of 0.2% for narrowly-defined NAP and 0.7% for broadly-
defined NAP. Clinical validity was additionally examined, with the clinician defined diagnoses
determined to be predictive of clinical (hospitalization, mediation, illness duration, thought
disorder) and social functioning (chronic impairment, low income, unemployment, urban residence,
and marital status of single, divorced or separated) characteristics.
The lifetime prevalence rates for bipolar disorder (BPD), estimated from a nationally
representative community survey of United States households, indicate average (standard deviation)
FFY2018-19_MHBG_DRAFT_071717_9AM CONDRAY: 7/17/17 9:20 AM
Page 22 of 33
rates of 1.0% (13.2) for Bipolar I; 1.1% (10.6) for Bipolar II; and 2.4% (23.3) for Subthreshold
Bipolar Disorder (Merikangas et al., 2007). Twelve-month prevalence rates estimated from the
same survey included: 0.6% (9.2) for Bipolar I; 0.8% (9.9) for Bipolar II; and 1.4% (15.4) for
Subthreshold Bipolar Disorder. Age at onset estimates for those diagnoses ranged from averages of
18.2 years and 20.3 years for Bipolar I and Bipolar II, respectively, and interquartile ranges (25th-
75th percentiles) from 12.3-21.2 years and 12.1-24.0 years, respectively. Age-of-onset was
somewhat later for Subthreshold Bipolar Disorder, with an average of 22.2 years and a range from
13.0-28.3 years. Importantly, prevalence rates for the same categories of bipolar disorder observed
by the World Mental Health Survey Initiative (Merikangas et al., 2011), based on 11 countries, are
generally consistent with the rates obtained from the community survey of U.S. households
described above.
To reemphasize, findings from the community epidemiological surveys summarized above
provide empirically-derived benchmarks for anticipating the expected rates for Nevada residents
who are members of the targeted populations, as well as for assessing the levels of access to
appropriate and optimal services for those targeted population members.
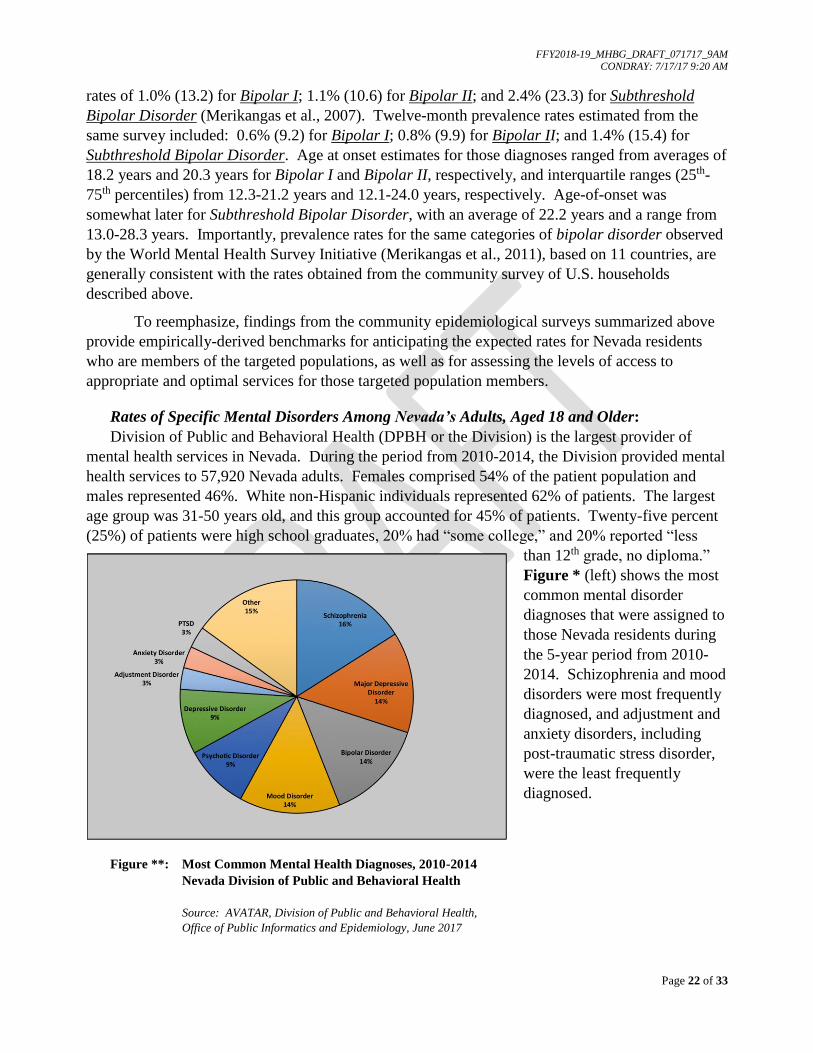
Rates of Specific Mental Disorders Among Nevada’s Adults, Aged 18 and Older:
Division of Public and Behavioral Health (DPBH or the Division) is the largest provider of
mental health services in Nevada. During the period from 2010-2014, the Division provided mental
health services to 57,920 Nevada adults. Females comprised 54% of the patient population and
males represented 46%. White non-Hispanic individuals represented 62% of patients. The largest
age group was 31-50 years old, and this group accounted for 45% of patients. Twenty-five percent
(25%) of patients were high school graduates, 20% had “some college,” and 20% reported “less
than 12th grade, no diploma.”
Figure * (left) shows the most
common mental disorder
diagnoses that were assigned to
those Nevada residents during
the 5-year period from 2010-
2014. Schizophrenia and mood
disorders were most frequently
diagnosed, and adjustment and
anxiety disorders, including
post-traumatic stress disorder,
were the least frequently
diagnosed.
Figure **: Most Common Mental Health Diagnoses, 2010-2014
Nevada Division of Public and Behavioral Health
Source: AVATAR, Division of Public and Behavioral Health,
Office of Public Informatics and Epidemiology, June 2017

FFY2018-19_MHBG_DRAFT_071717_9AM CONDRAY: 7/17/17 9:20 AM
Page 23 of 33
Rates of Suicide and Suicide-related Behaviors Among Nevada’s Adults Aged 18 and Older:
Rates of Suicide Deaths Among Nevadans by Region: ADD Table of Griswold-Packham
data showing urban/rural breakdowns from 2009 – 2014.
Rates of Suicide Ideation Among Nevada’s Adults Aged 18 and Older: The most recent
available data from the National Surveys on Drug Use and Health (2015 NSDUH) indicate that
approximately 92,000 adults in Nevada (4.4% of all adults), per year during 2013-2014, had serious
thoughts of suicide during the year before participating in the survey. Nevada’s rate was similar to
the national percentage observed for that same period. Table * (below) presents the range of
estimates for serious thoughts of suicide among adults in Nevada and the United States. The
percentages did not change significantly across the five-year period.
Table 7: Past Year Serious Thoughts of Suicide Among Adults Aged 18 or Older
in Nevada and the United States: 2010-2011 to 2013-2014
Years 2010-2011 2011-2012 2012-2013 2013-2014
Nevada 3.6% 3.8% 3.8% 4.4%
United States 3.8% 3.8% 3.9% 3.9%
Source: Substance Abuse and Mental Health Services Administration. Behavioral Health Barometer: Nevada, 2015.
HHS Publication No. SMA-16-Baro-2015-NV. Rockville, MD: Substance Abuse and Mental Health Services
Administration, 2015.

FFY2018-19_MHBG_DRAFT_071717_9AM CONDRAY: 7/17/17 9:20 AM
Page 24 of 33
Access to Mental Health Services for Nevada’s Adults with Serious Mental Illness (SMI):
Services Provided by the Nevada State Mental Health Authority (SMHA): An estimated
119,373 adults in Nevada suffered from serious mental illness (SMI) during 2015-2016, which
represents 5.4% of the state’s civilian adult population (2016 SAMHSA Uniform Reporting System
(URS) Output Tables-Nevada). Based on the National Outcomes Measures (NOMS) for this
period, 10,400 adults with serious mental illness (SMI) were served by Nevada’s State Mental
Health Authority, which represents 9% of the estimated need for services. Table 8 (below) presents
the service penetration rates for Nevada adults with SMI, and the national rates are provided as a
comparison.
Table 8: Adults with SMI served by the Nevada State Mental Health Authority (SMHA) by Age, FY 2016
Age (years)
Total Served Penetration Rates
(per 1,000 population) Nevada US
n % n % State US
Total 13,435 100.0% 4,979,257 100.0% 4.6 15.3
18-20 288 2.1% 205,480 4.1% 3.0 16.0
21-64 9,512 70.8% 3,143,936 63.1% 5.6 16.8
65-74 533 4.0% 162,995 3.3% 2.0 5.9
75 and over 67 0.5% 56,810 1.1% 0.4 3.1
Source: 2016 SAMHSA Uniform Reporting System (URS) - Nevada
Thirty-four percent (34%) of the 10,400 adults with SMI who were served by Nevada’s mental
health system received their care from the Rural Clinics for Mental Health Services, which include
patient assessments in rural hospitals, and direct care at each of the 16 rural clinic locations.
Mental Health Treatment/Counseling for Any Mental Illness Among Nevada’s Adults,
Aged 18 or Older: As summarized in the previous section, the most recent available data reported
by the National Surveys on Drug Use and Health (NSDUH) indicate that approximately
91,000 adults in Nevada (4.3% of all adults in the state), per year in 2013-2014, experienced serious
mental illness (SMI) during the year before being surveyed. Nevada’s percentage of SMI was
similar to the national percentage for that same period. Moreover, the percentage of adults with
SMI did not change significantly
from 2010-2011 to 2013-2014. As
shown in Figure 2 (left),
approximately 113,000 adults with
any mental illness (AMI) in Nevada
(32% of all adults with AMI), per
year from 2010 to 2014, received
mental health treatment or counseling
within the year before being
surveyed. However, Nevada’s annual
average (32%) for treatment of AMI
was lower than the national annual
average (42.7%) from 2010 to 2014.
Source: SAMHSA, Center for Behavioral Health and Quality, NSDUH, 2010-2014
32%
68%
Fig 2: Past Year Treatment
Among Adults Aged 18 or Older
with Any Mental Illness (AMI), Nevada
Received
Treatment/Counseling
Did Not Receive
Treatment/Counseling

FFY2018-19_MHBG_DRAFT_071717_9AM CONDRAY: 7/17/17 9:20 AM
Page 25 of 33
Hospital Emergency Room Visits for Mental Health Conditions Among Nevada’s Adults,
Aged 18 or Older: Limited access to effective community-based mental health services, including
crisis interventions, contributes to over-utilization of hospital emergency department services.
Billing data for hospital emergency room visits related to mental health were considered as
indicators of serious mental illness (SMI) that was either untreated or ineffectively managed.
Table * (below) provides the frequencies of visits to Nevada hospital emergency rooms among
adults aged 18 or older by mental health conditions in four domains: mental disorder categories
(mood, anxiety, psychosis); suicidal behaviors (tendencies and ideation); suicide attempts by
method; and substance use disorders (alcohol and other drug). Frequencies are based on emergency
room billing codes compiled by University of Nevada, Las Vegas, Center for Health Information
Analysis (CHIA). Data are based on visits, not patients, with any single individual potentially
representing multiple visits.
Anxiety, substance use conditions, depression and suicide-related behaviors were mental health
conditions most frequently diagnosed for Nevada residents aged 18 or older who presented to
emergency rooms in Nevada hospitals from 2009 to 2014. Suicide conditions accounted for 15% of
the total mental health related visits over that six-year period. Suicide attempts, combined across
methods of self injury (n=17,034 visits), represented 23% of suicide conditions. Suicidal tendencies
and ideation (n=57,072 visits) accounted for an additional 77% of the suicide category.
Table **: Select Behavioral Health Related Emergency Room Visits by Gender, Ages 18 or Older, Nevada Residents, 2009-2014
Condition Female Male Unknown Total
N Row % N Row % N Row %
Anxiety 97,406 66.6% 48,761 33.4% 3 0.0% 146,170
Depression 72,565 61.2% 45,987 38.8% 2 0.0% 118,554
Bipolar 30,814 59.6% 20,890 40.4% 1 0.0% 51,705
PTSD 5,385 55.9% 4,244 44.1% 0 0.0% 9,629
Schizophrenia 11,407 37.5% 19,035 62.5% 1 0.0% 30,443
Suicidal Tendencies 4,937 46.1% 5,769 53.9% 0 0.0% 10,706
Suicidal Ideation 19,635 42.3% 26,731 57.7% 0 0.0% 46,366
Alcohol Related 43,725 30.3% 100,378 69.7% 6 0.0% 144,109
Other Drug Related 48,645 44.9% 59,627 55.1% 3 0.0% 108,275
Suicide Attempt- Solid or Liquid 6,528 64.0% 3,670 36.0% 0 0.0% 10,198
Suicide Attempt- Gases in Domestic Use 2 33.3% 4 66.7% 0 0.0% 6
Suicide Attempt- Other Gases and Vapors 33 32.0% 70 68.0% 0 0.0% 103
Suicide Attempt- Hanging, Strangulation, & Suffocation 104 29.9% 244 70.1% 0 0.0% 348
Suicide Attempt- Cutting & Piercing Instrument 2,614 56.3% 2,031 43.7% 1 0.0% 4,646
Suicide Attempt- Firearms, Air Guns, & Explosives 31 18.8% 134 81.2% 0 0.0% 165
Suicide Attempt- Jumping from High Place 21 28.0% 54 72.0% 0 0.0% 75
Suicide Attempt- Drowning 5 50.0% 5 50.0% 0 0.0% 10
Suicide Attempt- Other Unspecified Means 622 41.9% 861 58.1% 0 0.0% 1,483
Total Behavioral Health Visits* 253,312 50.6% 247,454 49.4% 14 0.0% 500,780
Source: Hospital Emergency Room Discharge, Nevada Division of Public and Behavioral Health,
Office of Public Informatics and Epidemiology, June 2017
* Categories are not mutually exclusive.

FFY2018-19_MHBG_DRAFT_071717_9AM CONDRAY: 7/17/17 9:20 AM
Page 26 of 33
Medicaid Expansion under the Affordable Care Act (ACA) and Health Services Utilization: For
ease of reference, the following information, which was presented above in the section concerning
serious emotional disturbance (SED), is re-presented below because of its importance to systems
function and the target population, serious mental illness (SMI), under consideration.
Health care financing plays a significant role in the frequency and type of health services that
people use. Equally important is the availability and quality of health care services. Both factors
are clearly reflected in the patterns of health services utilization observed among Nevada residents.
Firstly, the numbers of Nevada residents covered by Medicaid benefits more than doubled when the
state expanded Medicaid coverage in 2014 under Governor Brian Sandoval and the Affordable Care
Act (ACA), increasing from 351,315 in 2013 to 654,442 in 2015. Secondly, as reflected in
Table * (below), this increase in health care coverage appears to have impacted the frequency with
which Nevada residents used health care services, most notably inpatient facilities and emergency
departments. Thus, the dual influences of increased health care coverage, and limited access to
appropriate and optimal community-based services are demonstrated in the utilization of emergency
department services for a wide range of mental health-related conditions from 2009 to 2014, shown
in Table * (above).
Table *: Medicaid Managed Care Organizations (MCO) and Fee-for-Service (FFS) Utilization, 2015
MCO-FFS Utilization: Percent Change from Calendar Years 2013 – 2015
Provider/Service Type 2013 2015 % Change
MCO Inpatient 441 6,626 93%
Outpatient 588,868 1,482,972 60%
Emergency Room Visits 9,014 48,784 82%
FFS
Inpatient 4,656 8,645 46%
Outpatient 2,197,658 2,474,380 11%
Emergency Room Visits 6,298 12,019 48%
Source: S. Woodard and Nevada Division of Health Care Financing and Policy (2016)
FFY2018-19_MHBG_DRAFT_071717_9AM CONDRAY: 7/17/17 9:20 AM
Page 27 of 33
• Older Adults with SMI *
IN PROGRESS
• Individuals with SMI or SED in the rural and homeless populations, as applicable *
IN PROGRESS

FFY2018-19_MHBG_DRAFT_071717_9AM CONDRAY: 7/17/17 9:20 AM
Page 28 of 33
• INDIVIDUALS WHO HAVE AN EARLY SERIOUS MENTAL ILLNESS (ESMI)
(10 percent MHBG set aside)
Clinical Staging Interventions for Emergent Serious Mental Illness in Nevada’s Youth:
Evidence reviewed in earlier sections (above) indicates that 12-month prevalence estimates for
serious emotional disturbance (SED) range from 8% in representative national community surveys,
and 9-13% for the states and nation as a whole based on earlier-generation community
epidemiology studies (2016 SAMHSA Uniform Reporting System Output Tables-Nevada). Those
rates are comparable to the range of prevalence estimates of 8.1-11.6% for major depressive episode
(MDE) among adolescents aged 12 to 17 in Nevada and the United States obtained by the National
Surveys on Drug Use and Health (NSDUH) from 2010-2011 to 2013-2014. Moreover, the median
rate of new cases of schizophrenia each year is estimated to be 15.2 per 100,000 population
(McGrath et al., 2008), and the first episode of psychosis exhibits a peak onset between 15 and 25
years of age (Heinssen et al., 2014; Kessler et al., 2007). <ADD Table of age-of-onsets for specific
disorders – anxiety, mood, sud, and non-affective psychoses; bipolar I, II and Spectrum; and
Psychotic Experiences – Kessler et al., data.> Therefore, extending early intervention efforts to
identified cases of early serious mental illness (ESMI) among adolescents and young adults
represents an optimal strategy for reducing the duration of untreated illness, a factor known to be
associated with treatment response and clinical course of psychotic disorders (Addington et al.,
2015; Kane et al., 2016).
The emotional health profile of Nevada’s adolescents that was captured in 2015 (Nevada
Youth Risk Behavior Survey, 2015) indicates that one third of the state’s adolescents experienced
depressed mood and reduced functioning during the prior year. They were also more likely to
report one or more suicide attempts without subsequent medical intervention, compared to their age
peers nationwide. More than 20% acknowledged deliberate self injuries, such as cutting or burning
themselves, without the intent to die. It is likely that some of these adolescents experienced
challenging life circumstances that produced strong adjustment reactions (mood disturbance,
suicidal thoughts and behaviors, deliberate self harm), which peaked and then resolved successfully.
It is also probable that other adolescents were experiencing the early stages of a first episode of
psychosis (FEP) or an emerging serious mental illness (SMI), which in the absence of optimal
interventions may progress to chronic and debilitating illnesses. As such, the year 2015 represented
a critical period for a subset of Nevada’s youth, and thereby afforded an opportunity for early
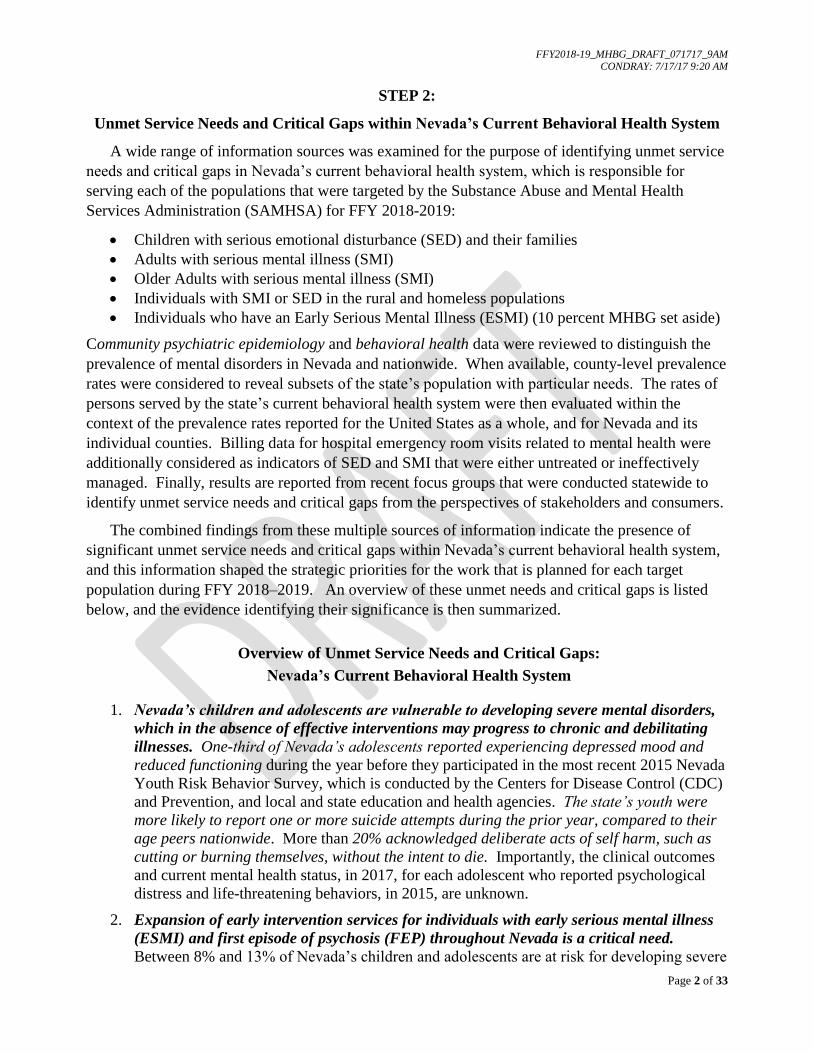
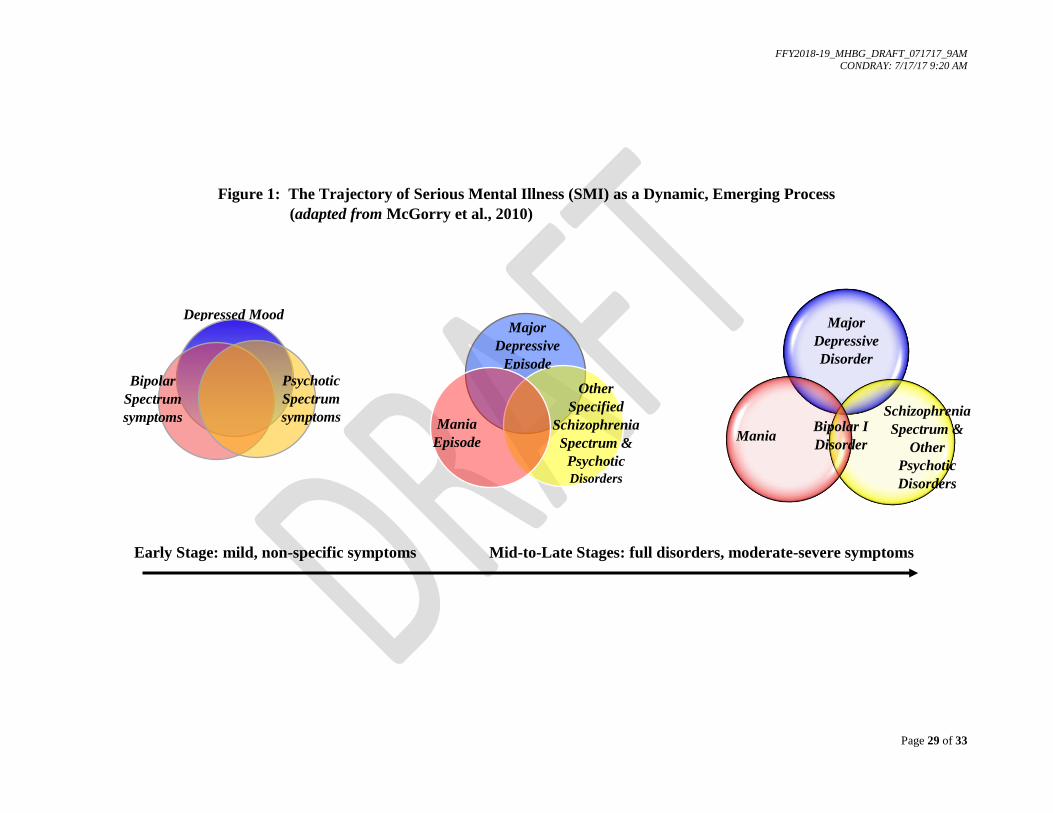
interventions. Figure 1 below (adapted from McGorry et al., 2010) illustrates the idea of chronic
serious mental illness (SMI) as a dynamic process that evolves over time, and that begins as a
diffuse constellation of features, characteristics and mild symptoms, which gradually cohere within
syndromal boundaries.
FFY2018-19_MHBG_DRAFT_071717_9AM CONDRAY: 7/17/17 9:20 AM
Page 29 of 33
Figure 1: The Trajectory of Serious Mental Illness (SMI) as a Dynamic, Emerging Process
(adapted from McGorry et al., 2010)
Early Stage: mild, non-specific symptoms Mid-to-Late Stages: full disorders, moderate-severe symptoms
Bipolar
Spectrum
symptoms
Depressed Mood
Psychotic
Spectrum
symptoms
Major
Depressive
Episode
Mania
Episode
Other
Specified
Schizophrenia
Spectrum &
Psychotic
Disorders
Major
Depressive
Disorder
Mania Bipolar I
Disorder
Schizophrenia
Spectrum &
Other
Psychotic
Disorders

FFY2018-19_MHBG_DRAFT_071717_9AM CONDRAY: 7/17/17 9:20 AM
Page 30 of 33
The objective of providing early interventions for individuals who are at risk for developing
severe mental illness has a long history in the fields of psychiatry and psychopathology. It received
renewed focus and vitality from the success achieved recently by the National Institute of Mental
Health’s (NIMH) Recovery After an Initial Schizophrenia Episode (RAISE) initiative (Heinssen,
Goldstein and Azrin, 2014). In a comparison of comprehensive and usual community care for first
episode psychosis, Kane et al. (2016) demonstrated the feasibility of implementing a comprehensive
recovery-oriented, evidence-based intervention for first-episode psychosis that was carried out in
community health clinics in the United States. Importantly, greater improvements in clinical and
functional outcomes were observed for participants who received this comprehensive,
multidisciplinary, team-based treatment. Extending early intervention services to individuals with
early serious mental illness, as well as to individuals with first episode of psychosis, and to the
rural and frontier regions of Nevada, is a strategic priority for FFY 2018-2019.

FFY2018-19_MHBG_DRAFT_071717_9AM CONDRAY: 7/17/17 9:20 AM
Page 31 of 33
References
Step 2:
Unmet Service Needs and Critical Gaps within Nevada’s Current Behavioral Health System
Addington J, Heinssen R (2012): Prediction and prevention of psychosis in youth at clinical high
risk. Annual Review of Clinical Psychology, 8:269-289.
Addington J, Heinssen R, Robinson DG, Schooler NR, Marcy P, Brunette MF, Correll CU, Estroff
S, Mueser KT, Penn D, Robinson JA, Rosenheck RA, Azrin ST, Goldstein AB, Severe J, Kane JM
(2015): Duration of untreated psychosis in community treatment settings in the United States.
Psychiatric Services 66(7):753-756.
Center for Behavioral Health Statistics and Quality (2016): Key substance use and mental health
indicators in the United States: Results from the 2015 National Survey on Drug Use and Health
(HHS Publication No. SMA 16-4984, NSDUH Series H-51). Retrieved from
http://www.samhsa.gov/data/
First MB, Spitzer RL, Gibbon M, Williams JBW (2002): Structured Clinical Interview for DSM-
IV-TR Axis I Disorders, Research Version, Non-patient Edition (SCID-I/NP). New York, NY:
New York State Psychiatric Institute, Biometrics Research.
Griswold T, Packham J, Gunawan A, Etchegoyhen L, Jorgensen T, Marchand C (January 2017):
Nevada Rural and Frontier Data Book – Eighth Edition, January 2017. Nevada State Office of
Rural Health, Office of Statewide Initiatives, University of Nevada, Reno, School of Medicine,
www.med.unr.edu/statewide
Heinssen R, Goldstein AB, and Azrin ST (2014): Evidence-based treatments for first episode
psychosis: Components of coordinated specialty care. Recovery after an initial schizophrenia
episode. Bethesda, MD: National Institute of Mental Health.
Kane JM, Robinson DG, Schooler NR, et al. (2016): Comprehensive versus usual community care
for first-episode psychosis: 2-year outcomes from the NIMH RAISE Early Treatment Program.
American Journal of Psychiatry, 173(4):362-372.
Kendler KS, Gallagher TJ, Abelson JM, et al. (1996): Lifetime prevalence, demographic risk
factors, and diagnostic validity of nonaffective psychosis as assessed in a US community sample:
The National Comorbidity Survey. Archives of General Psychiatry, 53(11):1022-1031.
Kessler RC, Aguilar-Gaxiola S, Alonso J, Chatterji S, Ling S, Ormel J, Ustun TB, Wang PS (2009):
The global burden of mental disorders: An update from the WHO World Mental Health (WMH)
Surveys. Epidemiol Psichiatr Soc.; 18(1):23-33.
Kessler RC, Amminger GP, Aguilar-Gaxiola S, Alonso J, Lee S, Ustun TB (2007a): Age of onset
of mental disorders: a review of recent literature. Current Opinion in Psychiatry 20:359-364.
Kessler RC, Angermeyer M, Anthony JC, et al. (2007b): Lifetime prevalence and age-of-onset
distributions of mental disorders in the World Health Organization’s World Mental Health Survey
Initiative. World Psychiatry; 6:168-176.

FFY2018-19_MHBG_DRAFT_071717_9AM CONDRAY: 7/17/17 9:20 AM
Page 32 of 33
Kessler RC, Avenevoli S, Costell J, Green JG, Gruber MJ, McLaughlin KA, Petukhova M,
Sampson NA, Zaslavsky AM, Merikangas KR (2012): Severity of 12-month DSM-IV disorders in
the National Comorbidity Survey Replication Adolescent Supplement. Archives of General
Psychiatry; 69(4):381-389.
Kessler RC, Berglund P, Demler O, Jin R, Merikangas KR, Walters EE (2005a): Lifetime
prevalence and age-of-onset distributions of DSM-IV disorders in the National Comorbidity Survey
Replication. Archives of General Psychiatry; 62:593-602.
Kessler RC, Chiu WT, Demler O, Walters EE (2005b): Prevalence, severity and comorbidity of 12-
month DSM-IV disorders in the National Comorbidity Survey Replication. Archives of General
Psychiatry; 62:617-627.
Kessler RC, Birnbaum H, Demler O, Falloon IRH, Gagnon E, Guyer M, Howes MJ, Kendler KS,
SHI L, Walters E, Wu EQ (2005c): The prevalence and correlates of non-affective psychosis in the
National Comorbidty Survey Replication (NCS-R). Biological Psychiatry 58(8):668-676.
Lensch T, Baxa A, Zhang F, Gay C, Larson S, Clements-Nolle K, Yang W. State of Nevada,
Division of Public and Behavioral Health and the University of Nevada Reno. 2015 Nevada High
School Youth Risk Behavior Survey (YRBS).
Lensch T, Baxa A, Zhang F, Gay C, Larson S, Clements-Nolle K, Yang W. State of Nevada,
Division of Public and Behavioral Health and the University of Nevada Reno. 2015 Nevada Middle
School Youth Risk Behavior Survey (YRBS).
McGorry PD, Nelson B, Goldstone S, Yung A (2010): Clinical staging: A heuristic and practical
strategy for new research and better health and social outcomes for psychotic and related mood
disorders. Canadian Journal of Psychiatry 55(8):486-497.
McGrath et al. (2008): Schizophrenia: A concise overview of incidence, prevalence and mortality.
Epidemiologic Reviews; 30:67-76.
SAMHSA, Uniform Reporting System (URS) Output Tables – Nevada. Accessed June, 2017:
https://www.samhsa.gov/data/sites/default/files/Nevada-2016.pdf
Substance Abuse and Mental Health Services Administration. Behavioral Health Barometer:
Nevada, 2015. HHS Publication No. SMA-16-Baro-2015-NV. Rockville, MD: Substance Abuse
and Mental Health Services Administration, 2015.
Substance Abuse Prevention and Treatment Agency (SAPTA) (June 2017): 2016 Epidemiologic
Profile. Office of Public Health Informatics and Epidemiology (OPHIE), Division of Public and
Behavioral Health, Nevada Department of Health and Human Services.
The WHO World Mental Health Consortium (2004): Prevalence, severity, and unmet need for
Treatment of Mental Disorders in the World Health Organization World Mental Health Surveys.
JAMA; 291:2581-2590.
Woodard, S. (lead author) (October 31, 2016a): Application to Participate in the Section 223
Certified Community Behavioral Health Clinics Demonstration Program. Nevada Department of
Health and Human Services, Division of Public and Behavioral Health.
FFY2018-19_MHBG_DRAFT_071717_9AM CONDRAY: 7/17/17 9:20 AM
Page 33 of 33
Woodard, S. (lead author) (October 31, 2016b): Statewide Focus Group Summary: Certified
Community Behavioral Health Clinic. Application to Participate in the Section 223 Certified
Community Behavioral Health Clinics Demonstration Program. Nevada Department of Health and
Human Services, Division of Public and Behavioral Health.
Youth Risk Behavior Surveillance System, 2015 High School Youth Risk Behavior Survey.
Accessed from Application URL on June 5, 2017:
https://nccd.cdc.gov/youthonline/App/Results.aspx?TT=G&OUT=0&SID=HS&QID=QQ&LID=N
V&YID=2015&LID2=XX&YID2=2015&COL=T&ROW1=N&ROW2=N&HT=QQ&LCT=LL&F
S=S1&FR=R1&FG=G1&FI=I1&FP=P1&FSL=S1&FRL=R1&FGL=G1&FIL=I1&FPL=P1&PV=
&TST=True&C1=NV2015&C2=XX2015&QP=G&DP=1&VA=CI&CS=N&SYID=&EYID=&SC
=DEFAULT&SO=ASC
Youth Risk Behavior Surveillance System, 2015 Middle School Youth Risk Behavior Survey.
Accessed from Application URL on June 5, 2017:
https://nccd.cdc.gov/youthonline/App/Results.aspx?TT=G&OUT=0&SID=HS&QID=QQ&LID=N
V&YID=2015&LID2=XX&YID2=2015&COL=T&ROW1=N&ROW2=N&HT=QQ&LCT=LL&F
S=S1&FR=R1&FG=G1&FI=I1&FP=P1&FSL=S1&FRL=R1&FGL=G1&FIL=I1&FPL=P1&PV=
&TST=True&C1=NV2015&C2=XX2015&QP=G&DP=1&VA=CI&CS=N&SYID=&EYID=&SC
=DEFAULT&SO=ASC