Unmanned Aerial Vehicle – Efficient mapping tool available ...
12
CZECH POLAR REPORTS 5 (2): 210-221, 2015 ——— Received December 12, 2015, accepted February 1, 2016. * Corresponding author: Zdeněk Stachoň <[email protected]> Acknowledgements: The authors would like to thank the members of Czech summer expedition to Petuniabukta for their field assistance and companionship. This work was supported by the project NF-CZ07-ICP-1-032-2014 “Polar ecology course – geosciences” under the auspice of the EEA grants & Norway grants and by the project of Masaryk University MUNI/A/1370/2014 „Global environmental changes in time and space (GlobST). We are also indebted to the Czech Arctic Research Infrastructure in Petuniabukta funded by the project CzechPolar LM2010009. The following software was used: Adobe Lightroom 6, Fast Stone Photo Resizer 3.3, Agisoft Photoscan Professional Edition 1.2.0 (64 bit), MeshLab 1.3.4, ArcMap 10.3.1 for Desktop, ArcScene 10.3.1 for Desktop, Gimp 2.8.6, Optris PI Connect. 210 Unmanned Aerial Vehicle – Efficient mapping tool available for recent research in polar regions Radim Stuchlík, Zdeněk Stachoň * , Kamil Láska, Petr Kubíček Department of Geography, Faculty of Science, Masaryk University, Kotlářská 2, 611 37 Brno, Czech Republic Abstract Unmanned Aerial Vehicles (UAV) have technical capabilities to extended usage in various fields of science. The existing UAVs are to be relatively easily accessible in the near future. It is possible to equip them with different sensors but there are still some usage limitations. This paper focuses on demonstrating UAVs usage for research in polar regions. The research in polar regions is very specific and, due to harsh climate, limits the field work with UAVs. The options and limitations are presented in a case study performed in the Nordenskiöldbreen area, Svalbard Archipelago. In the end some derived products suitable for further analysis are presented. Key words: UAV, mapping, spatial analysis, Svalbard, 3D, visual images, thermal images DOI: 10.5817/CPR2015-2-18 Introduction Unmanned Aerial Vehicles (UAVs) be- come more accessible for applications in various fields of science. The terminology related to UAV is still being developed, therefore, different abbreviations can be found regarding this emerging technology, such as UAS (Unmanned Aerial System) and RPAS (Remotely Piloted Aircraft Sys- tems). In general, the whole system con- sists of the following main components: pilot, navigator, UAV, remote control, te- lemetry and other accessories required for maintenance. The pilot controls a UAV through remote control and often uses tele- metry (live video signal from UAV’s cam- era). The navigator is obliged to have vis-
Transcript of Unmanned Aerial Vehicle – Efficient mapping tool available ...

CZECH POLAR REPORTS 5 (2): 210-221, 2015
——— Received December 12, 2015, accepted February 1, 2016. *Corresponding author: Zdeněk Stachoň <[email protected]> Acknowledgements: The authors would like to thank the members of Czech summer expedition to Petuniabukta for their field assistance and companionship. This work was supported by the project NF-CZ07-ICP-1-032-2014 “Polar ecology course – geosciences” under the auspice of the EEA grants & Norway grants and by the project of Masaryk University MUNI/A/1370/2014 „Global environmental changes in time and space (GlobST). We are also indebted to the Czech Arctic Research Infrastructure in Petuniabukta funded by the project CzechPolar LM2010009. The following software was used: Adobe Lightroom 6, Fast Stone Photo Resizer 3.3, Agisoft Photoscan Professional Edition 1.2.0 (64 bit), MeshLab 1.3.4, ArcMap 10.3.1 for Desktop, ArcScene 10.3.1 for Desktop, Gimp 2.8.6, Optris PI Connect.
210
Unmanned Aerial Vehicle – Efficient mapping tool available for recent research in polar regions Radim Stuchlík, Zdeněk Stachoň*, Kamil Láska, Petr Kubíček
Department of Geography, Faculty of Science, Masaryk University, Kotlářská 2, 611 37 Brno, Czech Republic Abstract Unmanned Aerial Vehicles (UAV) have technical capabilities to extended usage in various fields of science. The existing UAVs are to be relatively easily accessible in the near future. It is possible to equip them with different sensors but there are still some usage limitations. This paper focuses on demonstrating UAVs usage for research in polar regions. The research in polar regions is very specific and, due to harsh climate, limits the field work with UAVs. The options and limitations are presented in a case study performed in the Nordenskiöldbreen area, Svalbard Archipelago. In the end some derived products suitable for further analysis are presented. Key words: UAV, mapping, spatial analysis, Svalbard, 3D, visual images, thermal images DOI: 10.5817/CPR2015-2-18 Introduction Unmanned Aerial Vehicles (UAVs) be-come more accessible for applications in various fields of science. The terminology related to UAV is still being developed, therefore, different abbreviations can be found regarding this emerging technology, such as UAS (Unmanned Aerial System) and RPAS (Remotely Piloted Aircraft Sys-
tems). In general, the whole system con-sists of the following main components: pilot, navigator, UAV, remote control, te-lemetry and other accessories required for maintenance. The pilot controls a UAV through remote control and often uses tele-metry (live video signal from UAV’s cam-era). The navigator is obliged to have vis-

R. STUCHLÍK et al.
211
ual contact with the UAV and could partly use telemetry as well. The navigator may have another remote control and control the camera shutter. There are many types of UAVs that can be used for different kinds of field work. Different subgroups of UAVs could be distinguished for example by their engine: (1) with no engine, (2) with an electric engine, and (3) with a combustion engine. Based on their availa-bility, the most popular and widely spread are the UAVs with an electric engine. An-other sorting criterion of UAVs could be for example “wing characteristics”. There are UAVs with (1) flexible wings (hang gliders, paragliders, kites), (2) with fixed wings (gliders, airplanes), and (3) with ro-tary wings (helicopters, multi rotors). Bal-loons and airships have no wings, there-fore they can be considered no-wing UAVs. As stated above, there are a lot of types and subgroups of UAVs and the user should consider many practical aspects of UAV application in field research. One of the most important issues is to consider the purpose of research and character of the examined phenomenon. For example, if
the user plans to measure continuous tem-perature curve at the altitude of 50 meters above the ground for two hours, the best choice is a balloon or an airship instead of a UAV with multi-rotors. The reason for such decision is a time limitation: multi-rotors are mostly unable to fly for such a long time. Therefore, endurance needs to be considered. In addition, specific land-form types and general geometric shape of the examined phenomenon are very im-portant. Narrow and long elements (e.g. rivers) are better explored with a fixed or flexible winged UAV. On the other hand, square elements (e.g. fields) are better ex-plored with a multi-rotor UAV. These types of UAVs are more easily manage-able than the others. An airplane has better endurance than multi-rotor UAVs, but it needs a relatively large area for taking-off and landing in contrast to multi-rotor UAVs. It is very important to mention that UAVs can carry various cargos (cameras, thermographic cameras, infrared cameras, LiDAR, thermometers, humidity and pres-sure sensors, etc.), which are only limited by the maximum payloads of individual UAVs.
Background Research UAVs have been in use since the 19th century (Dobrovolný 1998). Since the late 1970s it has been used mostly for photo-grammetry purposes (Eisenbeiss 2004). Multi-rotor UAVs have been used in pho-togrammetry since 2011 (Miřijovský 2013). Recently, UAVs have been used for vari-ous purposes and worldwide projects. The purposes range from surveillance and pro-tection of animal species in Africa, Indo-nesia etc. (see Kattenborn et al. 2014) up to e.g. creation of highly accurate digital terrain (surface) models (Kakaes et al. 2015). UAVs are used in meteorology and cli-matology, pedogeography, biogeography, geomorphology, land surveying, crisis man-
agement, surveillance, social geography and many other fields of scientific re-search. In this paper, a brief overview of the applications is given together with a case study form Svalbard (see below). An example of usage of UAVs for re-search in the Czech Republic can be con-sidered the work of J. Miřijovský. He has used mostly two types of UAVs. The first one is PIXY (paraglider with combustion engine) and the other is Hexakopter XL. He used Digital Single-Lens Reflex cam-era Canon EOS 500D with lens Canon EF-S 18-55 mm (model EW-60C). He has used this type of UAV mostly in the field of fluvial geomorphology and archaeolo-gy. He was able to achieve very accurate

UNMANNED AERIAL VEHICLE, SVALBARD
212
results. Standard deviations were generally lower than 8 centimetres with an altitude of 60–100 meters. The images were proc-essed by stereophotogrammetry or struc-ture from motion (SfM). SfM method is more accurate than stereophotogrammetry in these cases (Miřijovský 2013). UAVs are often used for inspecting landslides. It is a relatively fast and cheap method how to discover the extent and to compute the volume of landslides. It was used in the Czech Republic near the village of Lito-chovice nad Labem where a landslide bur-ied the motorway D8, which was under construction (UpVision [on-line]). Landslide was for example inspected by UAVs in Australia, especially in south-east Tasmania (Lucieer et al. 2014). The authors applied the structure from motion method on multi-view UAV photography to create the final outputs. They obtained a relatively accurate 3D model, DEMs (Dig-ital Elevation Model) and ortophoto mosa-ic with the horizontal and vertical accuracy
of 7 and 6 cm, respectively. The same im-ages were collected in two time periods (multi-temporal), so they were able to com-pare them to study the landslide dynamics. After that they used the COSI-Corr (Co-registration of Optically Sensed Images and Correlation) image correlation tech-nique to map the terrain displacement. In the last decade the UAV systems have been successfully used also in the Arctic and Svalbard Archipelago, respec-tively. The utilization of different UAVs for atmospheric measurements, aerial sur-vey and photography was reported by e.g. Reuder et al. (2009), Berman et al. (2012), Mayer et al. (2012), Mora et al. (2015), Rippin et al. (2015). In our paper, we focus on the research of physical geography of selected deglaci-ated areas in Svalbard, with particular in-terest in orthophotos and in an application of the thermal imaging technique in a field study.
Material and Methods A case study using an UAV was conducted in terminoglacial zone of the Nordenskiöldbreen glacier (78.6821° N, 16.9067° E) in central Spitsbergen, Sval-bard. Nordenskiöldbreen is a tidewater out-let polythermal type of glacier with an area of 242 km2, located in the northern part of the Billefjorden fjord (Hagen et al. 1993). Further information on the study site and glacier retreat can be found in Plassen et al. (2004), Rachlewicz et al. (2007), van Pelt et al. (2012), Stacke et al. (2013), Vin-šová et al. (2015). The main emphasis was given to a land terminating part and a 250-m-long section of a proglacial river on the northwestern flank of the Nordenski-öldbreen snout. The aim of the case study was to test technical possibilities and learn the limitations of the UAVs used for the research in polar regions. The research in
polar regions is very specific and, due to harsh climate, limits the field work with UAVs. Strong winds and low temperatures may limit the application of UAV technol-ogy in some parts of the year. Strong wind makes the flying manoeuvrability of UAVs much worse than on calm days. Once the wind speed reaches 12 m s-1 the flight is actually impossible. In addition, low tem-peratures lead to shorter flight times, since the battery capacity decreases at sub-zero temperatures. In our study, we used an UAS with the technical specifications summarized in Ta-ble 1. The UAV body is made of 3K car-bon. It has 6 motors - propellers (hexa-copter). The control unit was made by DJI, Co. The GNSS (Global Navigation Satellite System) receiver is only able to receive GPS (Global Positioning System) signal. It

R. STUCHLÍK et al.
213
could pose a big problem, since there are not many GPS satellites in view in polar regions. At least 6 GPS satellites are need-ed to guarantee the proper function. Telem-etry collects important information about the UAV condition and FPV sends it to the ground station (5.8 GHz frequency). The battery with the capacity of 8000 mAh is able to keep the UAV in the air for ap-proximately 18 minutes (in case of good weather conditions). The remote control is a twelve-channel Graupner MX-20 which works on a frequency 2.4 GHz. The range of the remote control is about 1–2 kilo-metres. There is a problem with visibility in case it is further than 300 meters from the pilot. GoPro HD Hero 3+ Black edition and Optris PI thermo cameras are used.
The cameras are GoPro HD Hero 3+ Black edition (GoPro, Inc., USA) and Optris PI thermo camera (Optris, GmbH, Germany). Besides the UAS, the GNSS receiver had to be used to localize all GCPs (Ground Control Points) which were deployed be-fore. In this research GNSS receiver Trim-ble GeoExplorer 6000 Series: Geo XH 3.5G (Trimble Navigation, Ltd., USA) was used. Images and video sequences in termino-glacial zone of the Nordenskiöldbreen were captured on July 11, 2015 from flight level approximately 50 m above ground. The images were taken in continuous man-ual flight over the selected case study area in one second interval by visual and ther-mal cameras simultaneously.
UAV (body) Tarot FY690 Control unit NAZA M V2 Telemetry DJI - WKM iOSD Mini FPV (First Person View) FPV 5.8G (TX600) Battery Gens ace Tattu (8000 mAh) Remote Control Graupner MX-20 2,4 GHz Hott RC (12 channels) Camera GoPro HD Hero 3+ Black Edition, Optris PI Thermal camera
Table 1. Basic UAV specifications, only major components are listed.
Visual Images The camera was calibrated before tak-ing photographs. Since the calibration of GoPro camera is not very easy (due to very short focal length and wide field of view), it was done after the flight. We used software (Adobe Lightroom 6) to elimi-nate geometric distortion. This process al-lows substituting calibration (in the case of GoPro), since the camera used in this study had a wide field of view and a short focal length – 2.77 mm. The geometric distor-tion of original images was relatively high. After the substituted calibration, it was nec-essary to crop the images. As stated by Pa-velka 2003 in Miřijovský (2013), if radial distortion is unknown, only 60% of the im-
age (from image centre) should be used. Images overlap was high; therefore there was no problem to neglect about 40% in-formation from each image. The size of o-riginal images was 4000 x 3000 pixels; the size of cropped images was 2400 x 1800. Ground control points were marked into the images, and the images were merg-ed together. View axes were convergent, not parallel. Due to this fact, classical ster-eophotogrammetry could not have been used. Thus, the SfM method (utilized in Agisoft Photoscan Professional Edition 1.2.0 software) was used instead of stereo-photogrammetry. Thanks to texture simi-larities, the algorithm identified the same

UNMANNED AERIAL VEHICLE, SVALBARD
214
points on different images. We used the algorithm which found 3D structure based on 2D sequences of images. Therefore, a dense cloud of points in 3D was obtained. In the next step, a mesh was created and textured. At this stage of processing, a 3D
model, orthophoto mosaic, points cloud, and DEM (digital elevation model) were created. All these products were georefer-enced. The resulting data could be used for a wide variety of spatial analyses.
Fig. 1. Example of ortophoto mosaic of the proglacial river system on the northwestern flank of the Nordenskiöldbreen snout derived from the captured visual images.
R. STUCHLÍK et al.
215
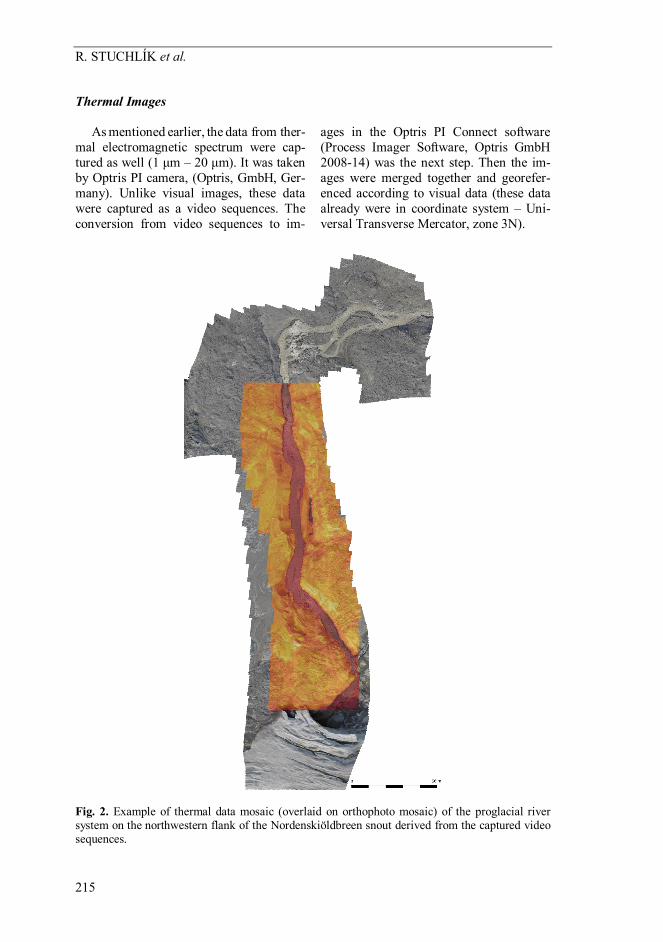
Thermal Images As mentioned earlier, the data from ther-mal electromagnetic spectrum were cap-tured as well (1 μm – 20 μm). It was taken by Optris PI camera, (Optris, GmbH, Ger-many). Unlike visual images, these data were captured as a video sequences. The conversion from video sequences to im-
ages in the Optris PI Connect software (Process Imager Software, Optris GmbH 2008-14) was the next step. Then the im-ages were merged together and georefer-enced according to visual data (these data already were in coordinate system – Uni-versal Transverse Mercator, zone 3N).
Fig. 2. Example of thermal data mosaic (overlaid on orthophoto mosaic) of the proglacial river system on the northwestern flank of the Nordenskiöldbreen snout derived from the captured video sequences.

UNMANNED AERIAL VEHICLE, SVALBARD
216
Results and Discussion The orthophoto mosaic (see Fig. 1) con-sisted of 49 images. At the bottom part of the mosaic, a glacier margin can be seen. The proglacial river pattern and margins are easily distinguished. The mosaic reso-lution is 72 DPI (Dot per Inch) and the radiometric resolution is 32 bits. Theoreti-cal RMSE (Root Mean Square Error) of this model is about 0.4 m. We did not consider other errors (e.g. GNSS accura-cy), since such accuracy is sufficient for polar research. The resulting mosaic of thermal data is presented in Fig. 2. False colour thermal data mosaic overlaps orthophoto mosaic with the opacity set on 50%. The brighter places represent relatively warmer areas.
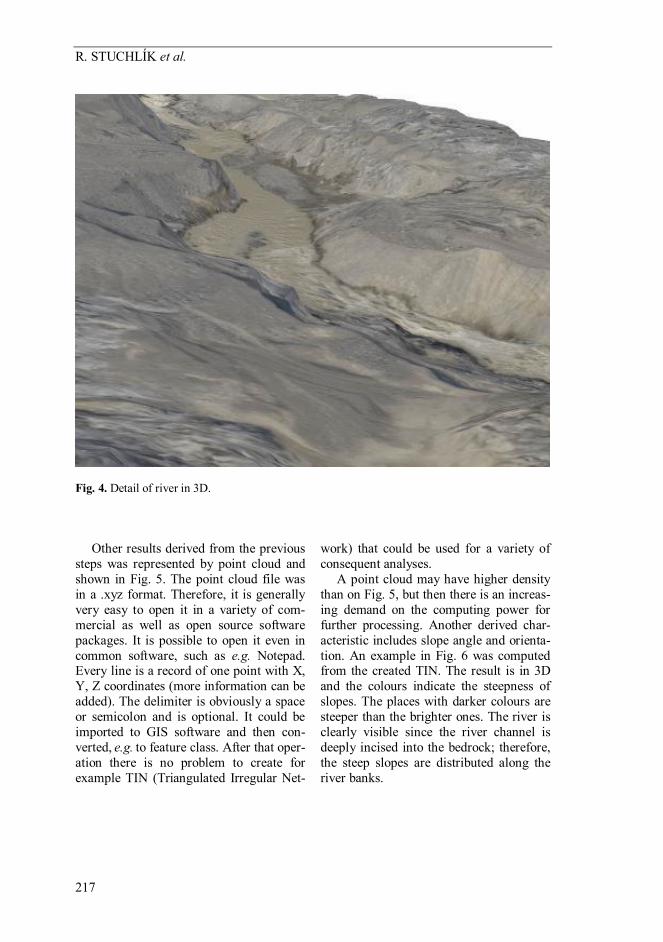
The darkest (and the coldest) place repre-sents the river, which is well visible on the mosaic, but other dark places can reveal high moisture sites, which are not clearly identifiable from the visual images. The orthophoto mosaic created from the captured images allowed to create dif-ferent outputs. Based on the orthophoto mosaic, it was possible to derive a 3D mod-el of a particular area (see Fig. 3), which is most suitable for presentation purposes and topographically-specified information from different fields of science and technology. There is a large amount of basic informa-tion that can be derived, see e.g. Fig. 4 that shows a detailed section of the river.
Fig. 3. Example of 3D model of the proglacial river system.
R. STUCHLÍK et al.
217
Fig. 4. Detail of river in 3D.
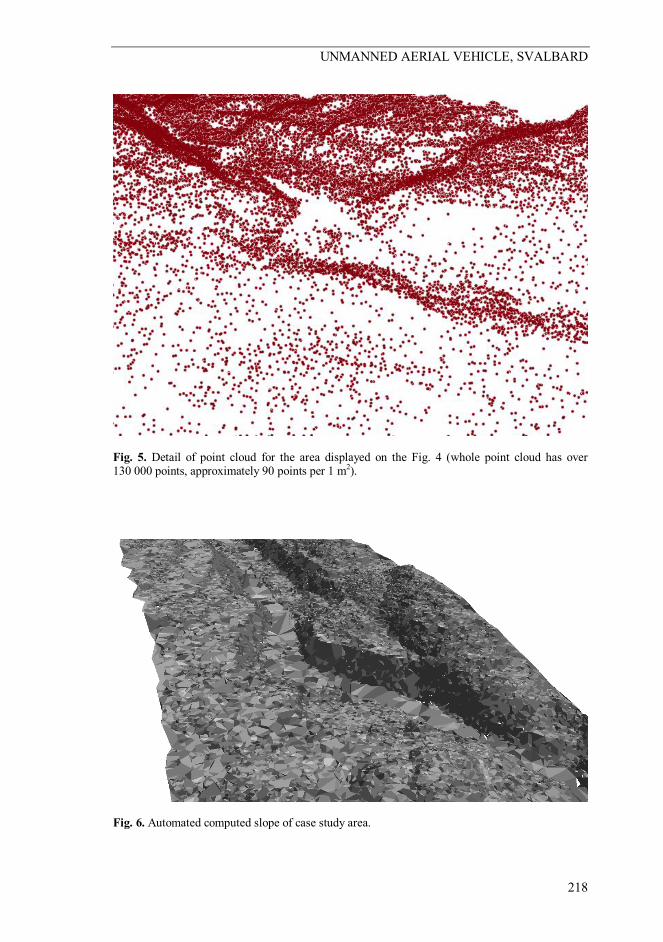
Other results derived from the previous steps was represented by point cloud and shown in Fig. 5. The point cloud file was in a .xyz format. Therefore, it is generally very easy to open it in a variety of com-mercial as well as open source software packages. It is possible to open it even in common software, such as e.g. Notepad. Every line is a record of one point with X, Y, Z coordinates (more information can be added). The delimiter is obviously a space or semicolon and is optional. It could be imported to GIS software and then con-verted, e.g. to feature class. After that oper-ation there is no problem to create for example TIN (Triangulated Irregular Net-
work) that could be used for a variety of consequent analyses. A point cloud may have higher density than on Fig. 5, but then there is an increas-ing demand on the computing power for further processing. Another derived char-acteristic includes slope angle and orienta-tion. An example in Fig. 6 was computed from the created TIN. The result is in 3D and the colours indicate the steepness of slopes. The places with darker colours are steeper than the brighter ones. The river is clearly visible since the river channel is deeply incised into the bedrock; therefore, the steep slopes are distributed along the river banks.
UNMANNED AERIAL VEHICLE, SVALBARD
218
Fig. 5. Detail of point cloud for the area displayed on the Fig. 4 (whole point cloud has over 130 000 points, approximately 90 points per 1 m2).
Fig. 6. Automated computed slope of case study area.

R. STUCHLÍK et al.
219
Conclusion In our paper, the use of multi-rotor UAVs, especially hexacopters, appears to be a very good choice for a wide range of research studies in polar regions. In con-trast to other types of UAVs, the main advantage of hexacopters (multi-rotors) is that it can “hover” in the air above a cer-tain place. Researchers have to pay special attention to select easily distinguishable GCPs. We focused on terminoglacial area of the Nordenskiöldbreen glacier in central Spitsbergen, Svalbard Archipelago. Glacial landscape represented by glacigenic, glacio-fluvial and glaciolacustrine materials in the vicinity of Nordenskiöldbreen had very diverse textures, so the signalling points were poorly visible. More suitable appear-ance and size of GCPs should be chosen next time. Moreover, it would be better to use a different camera than GoPro. The re-sults from the camera with a smaller field of view and longer focal length should be more accurate and a little easier to process. The video sequences from thermal electro-magnetic spectrum (later converted to im-ages) provided very useful information on the study area. It is a useful way to obtain radiometric temperature data used for esti-mation of relative and absolute tempera-ture information of the Earth’s surface or another objects. For example, there is a possibility to distinguish a large number of different types of objects and their prop-erties, which cannot be distinguished on visual images. On the other hand, the ther-
mal camera used in this study was rela-tively heavy and expensive. Therefore, the camera should to dismounted, if not in use. If a UAV is lighter, the battery is able to supply the UAV in the air for a longer period. The aim of the case study was a practi-cal demonstration whether or not the UAS technology with advanced camera system could be used in polar regions. Strong wind and low temperature were the biggest problems when using the UAV in the study area, but the UAV was still able to fly and capture valid images and video sequences. Obviously, the research was performed in the Arctic summer season when weather conditions were much better than in win-ter. Air temperature during the flight peri-od ranged between 5 to 10°C and wind speed below 6 m s-1. In additional suffi-cient number of GPS satellites was in view. For full functionality of UAV it needs to receive signal from at least 6 GPS satel-lites. Even though a small-size research hexacopter was used, it was necessary to find a small flat area where the take-off and landing were possible. After the flights, GCPs positions were measured by a GNSS receiver (Trimble Geoexplorer Geo XH 6000 series). The images from visible spec-trum and video sequences from thermal electromagnetic spectrum were captured. The images and video sequences were ready for post-processing and spatial analy-sis.
Concluding Remarks The biggest advantage of UAVs is that there is no need to have a human being on board. Therefore, it is possible to fly to very dangerous locations, e.g. nuclear power plants after an accident – Fukushima case (Ackerman E. [on-line], Adams et Fried-land 2013), destroyed cities – typhoon Morakot case (Chou et al. 2010) and many
others. Generally, UAVs are rather small, so it is possible to fly between buildings, into buildings, etc. Thanks to their rela-tively low flying altitude, it takes images under clouds. Therefore, it is possible to obtain clear images despite the overcast weather conditions. The final images may have brilliant resolution. There is no prob-

UNMANNED AERIAL VEHICLE, SVALBARD
220
lem to obtain resolution which is better than 1 centimetre to a pixel (Stuchlík 2015). The data acquisition for smaller areas with UAVs is cheaper than buying satellite or aerial images with similar resolution. The pilot or navigator has a live transmission video signal from the camera through FPV (First Person View). Therefore, they are able to control and edit what exactly the camera captures. Additionally, the UAVs allow repeating a data collection in desired time interval upon user request, which is often more flexible compared to other re-mote sensing acquisition systems. Unfortunately, UAVs have some disad-vantages. One of relatively important dis-advantages is the dependence on weather conditions even during the Arctic summer (Láska et al. 2012, Láska et al. 2013). UAVs are unable to fly in heavy rain or fog. The main problem connected with fog is a low visibility condition. The pilot or navigator is unable to visually controll the UAV. Strong wind is another trouble as
well. Due of their small size, they can only carry light payload which means that it is unable to carry survey cameras, but only digital cameras. It is impossible to scan an extensive area, since UAVs have a rela-tively short flying time (depending on the type of a UAV and its engine). Another limitation is bureaucracy. For example the administrator of this field in the Czech Republic is the Civil Aviation Authority. The main restrictions are related to flying areas. It is forbidden to fly above people, near urban areas and airports, and fly over roads. It is possible to request exceptions, of course. The pilot is obliged to obtain a pilot license and other necessary docu-ments (Stuchlík 2015). In our study we showed a use of UAS technology on the Arctic Svalbard Archi-pelago and described the processing of col-lected images and video sequences. Some examples of outputs de-rived from the col-lected data suitable for further spatial analy-sis were reported as well.
References ADAMS, S. M., FRIEDLAND, C. J. (2013): A Survey of Unmanned Aerial Vehicle (UAV) Usage for
Imagery Collection in Disaster Research and Management, 8 p., (https://blume.stanford.edu/ sites/default/files/RS_Adams_Survey_paper_0.pdf.)
BERMAN, E. S. F., FLADELAND, M., LIEM, J., KOLYER, R. and GUPTA, M. (2012): Greenhouse gas analyzer for measurements of carbon dioxide, methane, and water vapor aboard an unmanned aerial vehicle. Sensors and Actuators, B: Chemical, 169: 128-135.
CHOU, T.-Y., YEH, M-L., CHEN, Y-CH. and CHEN, Y-H. (2010): Disaster monitoring and management by the Unmanned Aerial Vehicle technology. In: ISPRS TC VII Symposium – 100 Years ISPRS Advancing Remote Sensing Science. Institute of Photogrammetry and Remote Sensing, Vienna University of Technology, Vienna, 137-142 pp. ISSN 1682-1777.
DOBROVOLNÝ, P. (1998): Remote Sensing of the Earth: Digital Image Processing (Dálkový průzkum Země: digitální zpracování obrazu). 1. edition. Masaryk university, Brno, Czech Republic, 208 p. ISBN 80-210-1812-7 (In Czech).
EISENBEISS, H. (2004): A mini unmanned aerial vehicle (UAV): System overview and image acquisition, 7 p., (http://www.isprs.org/proceedings/xxxvi/5-w1/papers/11.pdf.)
HAGEN, J., LIESTØL, O., ROLAND, E. and JORGENSEN, T. (1993): Glacier atlas of Svalbard and Jan Mayen. Norsk Polarinstitutt Meddelelser, 129, 141 pp.
KAKAES, K., GREENWOOD, F., LIPPINCOTT, M., DOSEMAGEN, S., MEIER, P. and WICH, S. (2015): Drones and aerial observation: New Technologies For Property Rights, Human Rights, And Global Development A Primer, New America, (http://www.newamerica.org)
KATTENBORN, T., SPERLICH, M., BATAUA, K. and KOCH, B. (2014): Automatic Single Palm Tree Detection in Plantations Using UAV-based Photogrammeric Point Clouds. International Archives of the Photogrammetry, Remote Sensing & Spatial Information Sciences, pp. 139-144.

R. STUCHLÍK et al.
221
LÁSKA, K., CHLÁDOVÁ, Z., AMBROŽOVÁ, K. and HUSÁK, J. (2013): Cloudiness and weather variation in central Svalbard in July 2013 as related to atmospheric circulation. Czech Polar Reports, 3: 184-195.
LÁSKA, K., WITOSZOVÁ, D. and PROŠEK, P. (2012): Weather patterns of the coastal zone of Petuniabukta (Central Spitsbergen) in the period 2008–2010. Polish Polar Research, 33: 297-318.
LUCIEER, A., DE JONG, S. M. and TURNER, D. (2014): Mapping landslide displacements using Structure from Motion (SfM) and image correlation of multi-temporal UAV photography. Progress in Physical Geography, 38: 97-116, (http://ppg.sagepub.com/content/38/1/97.full.pdf +html).
MAYER, S., JONASSEN, M. O., SANDVIK, A. and REUDER, J. (2012): Profiling the Arctic Stable Boundary Layer in Advent Valley, Svalbard: Measurements and Simulations. Boundary-Layer Meteorology, 143: 507-526.
MIŘIJOVSKÝ, J. (2013): Unmanned aerial systems - data collection and utilisation in photogrammetry (Bezpilotní systémy – sběr dat a využití ve fotogrammetrii). 1. edition. UP Publishing, Olomouc, Czech Republic, 169 p. ISBN 978-80-244-3923-5 (In Czech).
MORA, C., VIEIRA, G., PINA, P., LOUSADA, M. and CHRISTIANSEN, H. H. (2015): Land Cover Classification Using High-Resolution Aerial Photography in Adventdalen, Svalbard. Geografiska Annaler, Series A: Physical Geography, 97: 473-488.
PLASSEN, L., VORREN, T. and FORWICK, M. (2004): Integrated acoustic and coring investigation of glacigenic deposits in Spitsbergen fjords. Polar Research, 23: 89-110.
RACHLEWICZ, G., SZCZUCIŃSKI, W. and EWERTOWSKI, M. (2007): Post-“Little Ice Age” retreat rates of glaciers around Billefjorden in central Spitsbergen, Svalbard. Polish Polar Research, 28: 159-186.
REUDER, J., BRISSET, P., JONASSEN, M., MÜLLER, M. and MAYER, S. (2009): The Small Unmanned Meteorological Observer SUMO: A new tool for atmospheric boundary layer research. Meteorologische Zeitschrift, 18: 141-147.
RIPPIN, D. M., POMFRET, A. and KING, N. (2015): High resolution mapping of supra-glacial drainage pathways reveals link between micro-channel drainage density, surface roughness and surface reflectance. Earth Surface Processes and Landforms, 40: 1279-1290.
STACKE, V., MIDA, P., LEHEJČEK, J., TÓTHOVÁ, G. and NÝVLT, D. (2013): Recent landscape changes in terminoglacial area of the Nordenskiöldbreen, central Spitsbergen, Svalbard. Czech Polar Reports, 3: 3-6.
STUCHLÍK, R. (2015): UAV data and its utilization in crisis management. Masaryk university, Brno, 92 p.
VAN PELT, W. J. J., OERLEMANS, J., REIJMER, C. H., POHJOLA, V. A., PETTERSSON, R. and VAN ANGELEN, J. H. (2012): Simulating melt, runoff and refreezing on Nordenskiöldbreen, Svalbard, using a coupled snow and energy balance model. The Cryosphere, 6: 641-659.
VINŠOVÁ, P., PINSEEL, E., KOHLER, T. J., VAN DE VIJVER, B., ŽÁRSKÝ, J. D., KAVAN, J. and KOPALOVÁ, K. (2015): Diatoms in cryoconite holes and adjacent proglacial freshwater sediments, Nordenskiöld glacier (Spitsbergen, High Arctic). Czech Polar Reports, 5: 112-133.
Web sources ACKERMAN, E. [on-line]: Japan Earthquake: Global Hawk UAV May Be Able to Peek Inside
Damaged Reactors. IEEE Spectrum, (http://spectrum.ieee.org/automaton/robotics/military-robots/global-hawk-uav-may-be-able-to-peek-inside-damaged-reactors.)
UpVision [on-line]: News, (http://www.upvision.cz/)


![FY18 RWDC State Unmanned Aerial System Challenge ... · Unmanned Aerial System Challenge: Practical Solutions to ... , Real World Design Challenge ... , unmanned aerial vehicle [UAV])](https://static.fdocuments.in/doc/165x107/5ae85cfb7f8b9a8b2b8fe5e5/fy18-rwdc-state-unmanned-aerial-system-challenge-aerial-system-challenge-practical.jpg)