2009 PPAI Sales Survey FINAL REPORT June 2010 saved in Dec.pdf

WHO?WHAT?WHERE? WHEN?
WHYAs the marketing landscape
continues to evolve, so must the processes and the people involved. Marketing is no longer a series of projects and campaigns; it is now an ongoing process of learning and engagement. Data has long played a role in efforts to drive business growth and reach new and existing customers. While marketers have been applying data in various forms for some time, the rise in using a blend of tools and technologies has changed the game. Brands and agencies are now equipped with a wealth of transactional data that provide a rich, in-depth profile about each individual customer. This data helped answer the four w’s of marketing—the who, what,
BEHIND THE BUY New Research
Reveals How Brands And
Agencies Value Promotional
Productsby Moumita Das
UNLOCKING THE
48 | AUGUST 2017 |
FEATURE | PPAI Exclusive Research
WHAT?WHERE? WHEN?where and when: who buys, what they are buying, where they buy and when they buy.
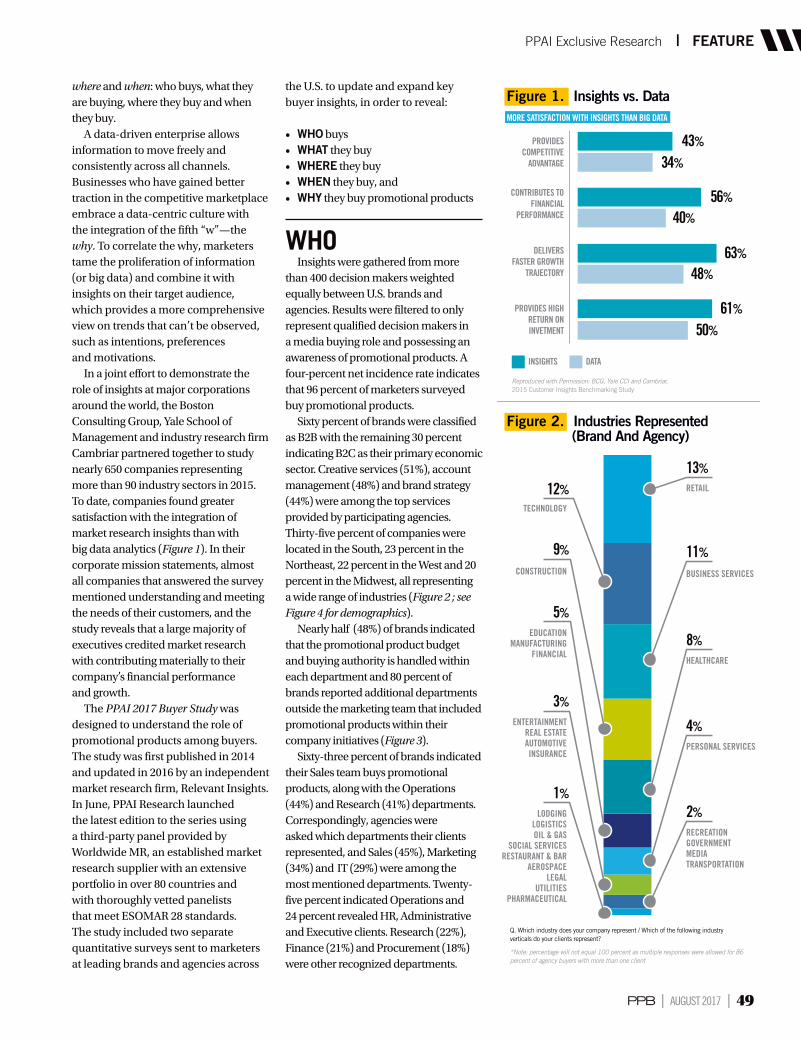
A data-driven enterprise allows information to move freely and consistently across all channels. Businesses who have gained better traction in the competitive marketplace embrace a data-centric culture with the integration of the fifth “w”—the why. To correlate the why, marketers tame the proliferation of information (or big data) and combine it with insights on their target audience, which provides a more comprehensive view on trends that can’t be observed, such as intentions, preferences and motivations.
In a joint effort to demonstrate the role of insights at major corporations around the world, the Boston Consulting Group, Yale School of Management and industry research firm Cambriar partnered together to study nearly 650 companies representing more than 90 industry sectors in 2015. To date, companies found greater satisfaction with the integration of market research insights than with big data analytics (Figure 1). In their corporate mission statements, almost all companies that answered the survey mentioned understanding and meeting the needs of their customers, and the study reveals that a large majority of executives credited market research with contributing materially to their company’s financial performance and growth.
The PPAI 2017 Buyer Study was designed to understand the role of promotional products among buyers. The study was first published in 2014 and updated in 2016 by an independent market research firm, Relevant Insights. In June, PPAI Research launched the latest edition to the series using a third-party panel provided by Worldwide MR, an established market research supplier with an extensive portfolio in over 80 countries and with thoroughly vetted panelists that meet ESOMAR 28 standards. The study included two separate quantitative surveys sent to marketers at leading brands and agencies across
the U.S. to update and expand key buyer insights, in order to reveal:
• WHO buys• WHAT they buy• WHERE they buy• WHEN they buy, and• WHY they buy promotional products
WHO Insights were gathered from more
than 400 decision makers weighted equally between U.S. brands and agencies. Results were filtered to only represent qualified decision makers in a media buying role and possessing an awareness of promotional products. A four-percent net incidence rate indicates that 96 percent of marketers surveyed buy promotional products.
Sixty percent of brands were classified as B2B with the remaining 30 percent indicating B2C as their primary economic sector. Creative services (51%), account management (48%) and brand strategy (44%) were among the top services provided by participating agencies. Thirty-five percent of companies were located in the South, 23 percent in the Northeast, 22 percent in the West and 20 percent in the Midwest, all representing a wide range of industries (Figure 2 ; see Figure 4 for demographics).
Nearly half (48%) of brands indicated that the promotional product budget and buying authority is handled within each department and 80 percent of brands reported additional departments outside the marketing team that included promotional products within their company initiatives (Figure 3).
Sixty-three percent of brands indicated their Sales team buys promotional products, along with the Operations (44%) and Research (41%) departments. Correspondingly, agencies were asked which departments their clients represented, and Sales (45%), Marketing (34%) and IT (29%) were among the most mentioned departments. Twenty-five percent indicated Operations and 24 percent revealed HR, Administrative and Executive clients. Research (22%), Finance (21%) and Procurement (18%) were other recognized departments.
Figure 1. Insights vs. Data
Figure 2. Industries Represented (Brand And Agency)
INSIGHTS DATA
Reproduced with Permission: BCG, Yale CCI and Cambriar, 2015 Customer Insights Benchmarking Study
*Note: percentage will not equal 100 percent as multiple responses were allowed for 86 percent of agency buyers with more than one client
Q. Which industry does your company represent / Which of the following industry verticals do your clients represent?
PROVIDES COMPETITIVE
ADVANTAGE
CONTRIBUTES TO FINANCIAL
PERFORMANCE
DELIVERS FASTER GROWTH
TRAJECTORY
PROVIDES HIGH RETURN ON INVETMENT
43%
34%
56%
40%
63%
48%
61%
50%
1%LODGING
LOGISTICSOIL & GAS
SOCIAL SERVICESRESTAURANT & BAR
AEROSPACELEGAL
UTILITIESPHARMACEUTICAL
4%PERSONAL SERVICES
5%EDUCATION
MANUFACTURINGFINANCIAL
8%HEALTHCARE
9%CONSTRUCTION
11%BUSINESS SERVICES
12%TECHNOLOGY
13%RETAIL
2%RECREATIONGOVERNMENTMEDIATRANSPORTATION
3%ENTERTAINMENT
REAL ESTATEAUTOMOTIVEINSURANCE
MORE SATISFACTION WITH INSIGHTS THAN BIG DATA
| AUGUST 2017 | 49
PPAI Exclusive Research | FEATURE
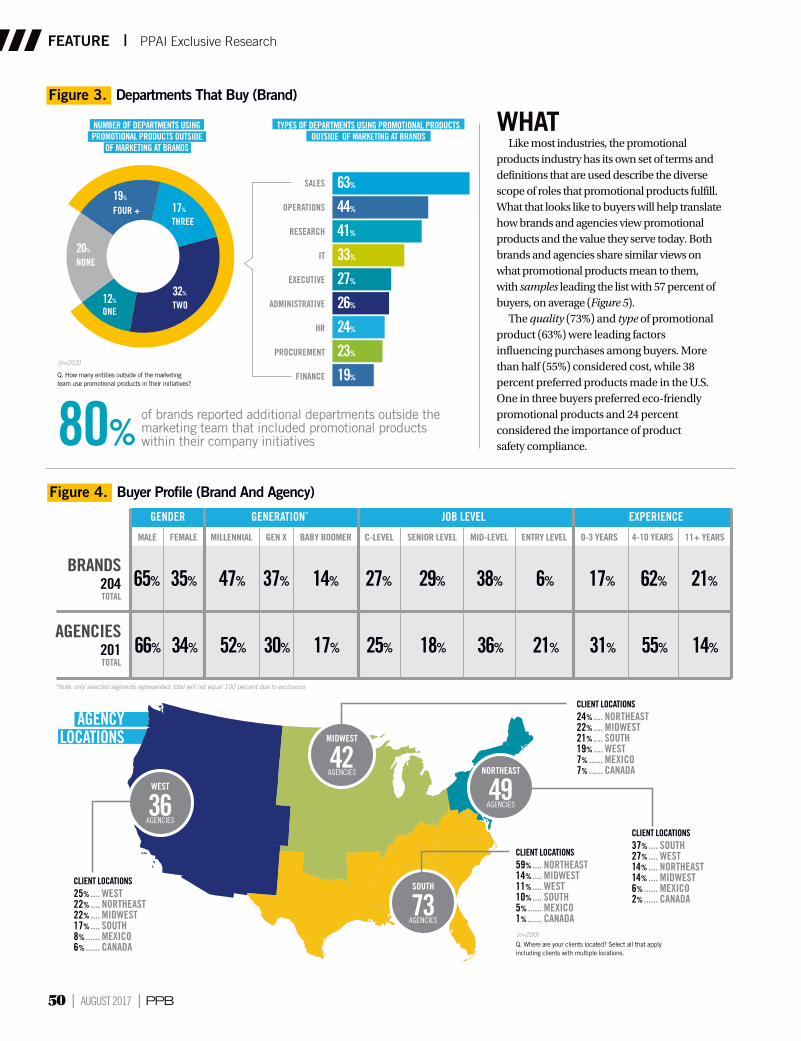
Figure 3. Departments That Buy (Brand)
TYPES OF DEPARTMENTS USING PROMOTIONAL PRODUCTS OUTSIDE OF MARKETING AT BRANDS
CLIENT LOCATIONS
NUMBER OF DEPARTMENTS USING PROMOTIONAL PRODUCTS OUTSIDE
OF MARKETING AT BRANDS
AGENCY LOCATIONS
(n=203)
(n=200)
Q. How many entities outside of the marketing team use promotional products in their initiatives?
Q. Where are your clients located? Select all that apply including clients with multiple locations.
SALES
OPERATIONS
RESEARCH
IT
EXECUTIVE
ADMINISTRATIVE
HR
PROCUREMENT
GENDER GENERATION* JOB LEVEL EXPERIENCE
FINANCE
63%
44%
41%
33%
27%
26%
24%
23%
19%
65% 35%35% 47% 37% 14% 27% 29% 38% 6% 17% 62% 21%
66% 34%34% 52% 30% 17% 25% 18% 36% 21% 31% 55% 14%
TWO
THREEFOUR +
NONE
ONE
19%
20%
12%32%
17%
of brands reported additional departments outside the marketing team that included promotional products within their company initiatives
Figure 4. Buyer Pro�le (Brand And Agency)
BRANDS204TOTAL
AGENCIES201TOTAL
*Note: only selected segments represented; total will not equal 100 percent due to exclusions
24%.... NORTHEAST22%.... MIDWEST21%.... SOUTH19%.... WEST7%...... MEXICO7%...... CANADA
CLIENT LOCATIONS25%.... WEST22%.... NORTHEAST22%.... MIDWEST17%.... SOUTH8%...... MEXICO6%...... CANADA
CLIENT LOCATIONS59%.... NORTHEAST14%.... MIDWEST11%.... WEST10%.... SOUTH5%...... MEXICO1%...... CANADA
CLIENT LOCATIONS37%.... SOUTH27%.... WEST14% .... NORTHEAST14% .... MIDWEST6%...... MEXICO2%...... CANADA
NORTHEAST
49AGENCIES
SOUTH
73AGENCIES
MIDWEST
42AGENCIES
WEST
36AGENCIES
80%
WHATLike most industries, the promotional
products industry has its own set of terms and definitions that are used describe the diverse scope of roles that promotional products fulfill. What that looks like to buyers will help translate how brands and agencies view promotional products and the value they serve today. Both brands and agencies share similar views on what promotional products mean to them, with samples leading the list with 57 percent of buyers, on average (Figure 5).
The quality (73%) and type of promotional product (63%) were leading factors influencing purchases among buyers. More than half (55%) considered cost, while 38 percent preferred products made in the U.S. One in three buyers preferred eco-friendly promotional products and 24 percent considered the importance of product safety compliance.
50 | AUGUST 2017 |
FEATURE | PPAI Exclusive Research
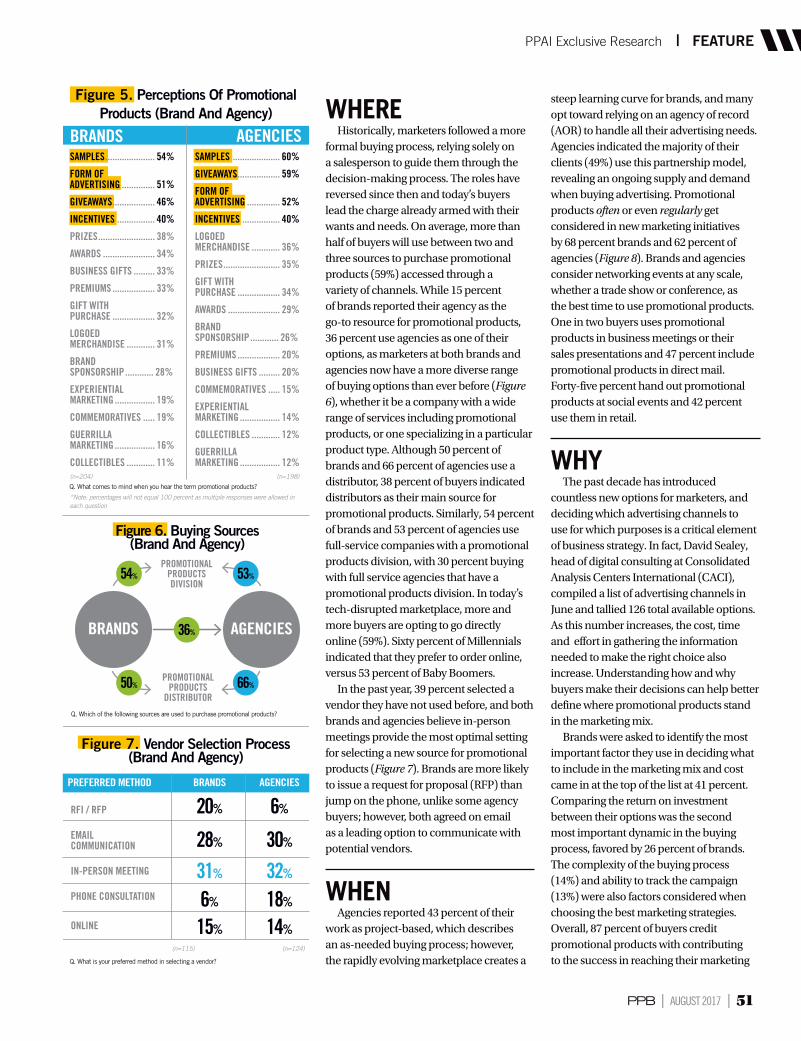
WHEREHistorically, marketers followed a more
formal buying process, relying solely on a salesperson to guide them through the decision-making process. The roles have reversed since then and today’s buyers lead the charge already armed with their wants and needs. On average, more than half of buyers will use between two and three sources to purchase promotional products (59%) accessed through a variety of channels. While 15 percent of brands reported their agency as the go-to resource for promotional products, 36 percent use agencies as one of their options, as marketers at both brands and agencies now have a more diverse range of buying options than ever before (Figure 6), whether it be a company with a wide range of services including promotional products, or one specializing in a particular product type. Although 50 percent of brands and 66 percent of agencies use a distributor, 38 percent of buyers indicated distributors as their main source for promotional products. Similarly, 54 percent of brands and 53 percent of agencies use full-service companies with a promotional products division, with 30 percent buying with full service agencies that have a promotional products division. In today’s tech-disrupted marketplace, more and more buyers are opting to go directly online (59%). Sixty percent of Millennials indicated that they prefer to order online, versus 53 percent of Baby Boomers.
In the past year, 39 percent selected a vendor they have not used before, and both brands and agencies believe in-person meetings provide the most optimal setting for selecting a new source for promotional products (Figure 7). Brands are more likely to issue a request for proposal (RFP) than jump on the phone, unlike some agency buyers; however, both agreed on email as a leading option to communicate with potential vendors.
WHENAgencies reported 43 percent of their
work as project-based, which describes an as-needed buying process; however, the rapidly evolving marketplace creates a
steep learning curve for brands, and many opt toward relying on an agency of record (AOR) to handle all their advertising needs. Agencies indicated the majority of their clients (49%) use this partnership model, revealing an ongoing supply and demand when buying advertising. Promotional products often or even regularly get considered in new marketing initiatives by 68 percent brands and 62 percent of agencies (Figure 8). Brands and agencies consider networking events at any scale, whether a trade show or conference, as the best time to use promotional products. One in two buyers uses promotional products in business meetings or their sales presentations and 47 percent include promotional products in direct mail. Forty-five percent hand out promotional products at social events and 42 percent use them in retail.
WHYThe past decade has introduced
countless new options for marketers, and deciding which advertising channels to use for which purposes is a critical element of business strategy. In fact, David Sealey, head of digital consulting at Consolidated Analysis Centers International (CACI), compiled a list of advertising channels in June and tallied 126 total available options. As this number increases, the cost, time and effort in gathering the information needed to make the right choice also increase. Understanding how and why buyers make their decisions can help better define where promotional products stand in the marketing mix.
Brands were asked to identify the most important factor they use in deciding what to include in the marketing mix and cost came in at the top of the list at 41 percent. Comparing the return on investment between their options was the second most important dynamic in the buying process, favored by 26 percent of brands. The complexity of the buying process (14%) and ability to track the campaign (13%) were also factors considered when choosing the best marketing strategies. Overall, 87 percent of buyers credit promotional products with contributing to the success in reaching their marketing
Figure 5. Perceptions Of Promotional Products (Brand And Agency)
Figure 7. Vendor Selection Process(Brand And Agency)
Figure 6. Buying Sources(Brand And Agency)
20%
28%
31%
6%
15%
6%
30%
32%
18%
14%
SAMPLES..................... 54%
FORM OF ADVERTISING .............. 51%
GIVEAWAYS.................. 46%
INCENTIVES ................ 40%
PRIZES........................ 38%
AWARDS ...................... 34%
BUSINESS GIFTS ......... 33%
PREMIUMS .................. 33%
GIFT WITH PURCHASE .................. 32%
LOGOED MERCHANDISE ............ 31%
BRAND SPONSORSHIP............ 28%
EXPERIENTIAL MARKETING ................. 19%
COMMEMORATIVES ..... 19%
GUERRILLA MARKETING ................. 16%
COLLECTIBLES ............ 11%
SAMPLES .................... 60%
GIVEAWAYS.................. 59%
FORM OF ADVERTISING .............. 52%
INCENTIVES ................ 40%
LOGOED MERCHANDISE ............ 36%
PRIZES........................ 35%
GIFT WITH PURCHASE .................. 34%
AWARDS ...................... 29%
BRAND SPONSORSHIP............ 26%
PREMIUMS .................. 20%
BUSINESS GIFTS ......... 20%
COMMEMORATIVES ..... 15%
EXPERIENTIAL MARKETING ................. 14%
COLLECTIBLES ............ 12%
GUERRILLA MARKETING ................. 12%
BRANDS AGENCIES
AGENCIESBRANDS
BRANDSPREFERRED METHOD AGENCIES
(n=198)(n=204)
(n=124)(n=115)
Q. What comes to mind when you hear the term promotional products?
Q. Which of the following sources are used to purchase promotional products?
Q. What is your preferred method in selecting a vendor?
*Note: percentages will not equal 100 percent as multiple responses were allowed in each question
RFI / RFP
EMAIL COMMUNICATION
IN-PERSON MEETING
PHONE CONSULTATION
ONLINE
36%
PROMOTIONAL PRODUCTS DIVISION
PROMOTIONAL PRODUCTS
DISTRIBUTOR
54% 53%
66%50%
| AUGUST 2017 | 51
PPAI Exclusive Research | FEATURE
goals, and found promotional products
have the ability to regularly engage with
their customers (54%) in a way that’s
distinctive to the medium (51%). Buyers
and agencies also acknowledged the
cost-effective benefits of promotional
product, such as their flexibility to
easily fit budget parameters (36%) and
the bonus exposure provided with no
extra charge (27%).
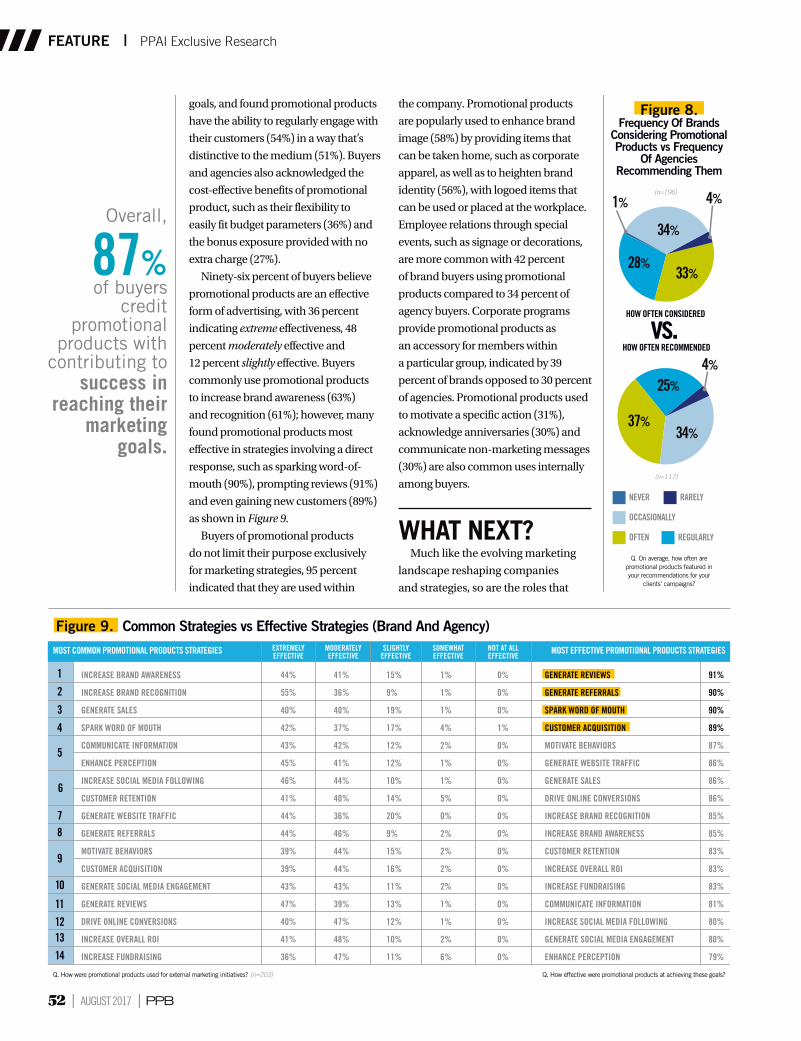
Ninety-six percent of buyers believe
promotional products are an effective
form of advertising, with 36 percent
indicating extreme effectiveness, 48
percent moderately effective and
12 percent slightly effective. Buyers
commonly use promotional products
to increase brand awareness (63%)
and recognition (61%); however, many
found promotional products most
effective in strategies involving a direct
response, such as sparking word-of-
mouth (90%), prompting reviews (91%)
and even gaining new customers (89%)
as shown in Figure 9.
Buyers of promotional products
do not limit their purpose exclusively
for marketing strategies, 95 percent
indicated that they are used within
the company. Promotional products
are popularly used to enhance brand
image (58%) by providing items that
can be taken home, such as corporate
apparel, as well as to heighten brand
identity (56%), with logoed items that
can be used or placed at the workplace.
Employee relations through special
events, such as signage or decorations,
are more common with 42 percent
of brand buyers using promotional
products compared to 34 percent of
agency buyers. Corporate programs
provide promotional products as
an accessory for members within
a particular group, indicated by 39
percent of brands opposed to 30 percent
of agencies. Promotional products used
to motivate a specific action (31%),
acknowledge anniversaries (30%) and
communicate non-marketing messages
(30%) are also common uses internally
among buyers.
WHAT NEXT?Much like the evolving marketing
landscape reshaping companies
and strategies, so are the roles that
INCREASE BRAND AWARENESS 44% 41% 15% 1% 0% GENERATE REVIEWS 91%
INCREASE BRAND RECOGNITION 55% 36% 9% 1% 0% GENERATE REFERRALS 90%
GENERATE SALES 40% 40% 19% 1% 0% SPARK WORD OF MOUTH 90%
SPARK WORD OF MOUTH 42% 37% 17% 4% 1% CUSTOMER ACQUISITION 89%
COMMUNICATE INFORMATION 43% 42% 12% 2% 0% MOTIVATE BEHAVIORS 87%
ENHANCE PERCEPTION 45% 41% 12% 1% 0% GENERATE WEBSITE TRAFFIC 86%
INCREASE SOCIAL MEDIA FOLLOWING 46% 44% 10% 1% 0% GENERATE SALES 86%
CUSTOMER RETENTION 41% 40% 14% 5% 0% DRIVE ONLINE CONVERSIONS 86%
GENERATE WEBSITE TRAFFIC 44% 36% 20% 0% 0% INCREASE BRAND RECOGNITION 85%
GENERATE REFERRALS 44% 46% 9% 2% 0% INCREASE BRAND AWARENESS 85%
MOTIVATE BEHAVIORS 39% 44% 15% 2% 0% CUSTOMER RETENTION 83%
CUSTOMER ACQUISITION 39% 44% 16% 2% 0% INCREASE OVERALL ROI 83%
GENERATE SOCIAL MEDIA ENGAGEMENT 43% 43% 11% 2% 0% INCREASE FUNDRAISING 83%
GENERATE REVIEWS 47% 39% 13% 1% 0% COMMUNICATE INFORMATION 81%
DRIVE ONLINE CONVERSIONS 40% 47% 12% 1% 0% INCREASE SOCIAL MEDIA FOLLOWING 80%
INCREASE OVERALL ROI 41% 48% 10% 2% 0% GENERATE SOCIAL MEDIA ENGAGEMENT 80%
INCREASE FUNDRAISING 36% 47% 11% 6% 0% ENHANCE PERCEPTION 79%
EXTREMELY EFFECTIVE
MODERATELY EFFECTIVE
SLIGHTLY EFFECTIVE
SOMEWHAT EFFECTIVE
NOT AT ALL EFFECTIVE
MOST EFFECTIVE PROMOTIONAL PRODUCTS STRATEGIESMOST COMMON PROMOTIONAL PRODUCTS STRATEGIES
1
2
3
4
5
6
78
9
10
11
1213
14Q. How effective were promotional products at achieving these goals?Q. How were promotional products used for external marketing initiatives? (n=203)
Figure 8. Frequency Of Brands
Considering Promotional Products vs Frequency
Of Agencies Recommending Them
(n=117)
(n=196)
Q. On average, how often are promotional products featured in your recommendations for your
clients’ campaigns?
vs.
NEVER RARELY
OCCASIONALLY
OFTEN REGULARLY
HOW OFTEN CONSIDERED
HOW OFTEN RECOMMENDED
1%
4%
4%
34%
34%37%
25%
33%28%
Figure 9. Common Strategies vs Effective Strategies (Brand And Agency)
Overall,
87%of buyers
credit promotional
products with contributing to
success in reaching their
marketing goals.
52 | AUGUST 2017 |
FEATURE | PPAI Exclusive Research
lead the effort. There was a time when there were only two C-level positions in most companies: the chief executive officer and the chief financial officer. Over time, new roles have been introduced in response to a game-changing disruption in the marketplace. When technology came to the forefront, the chief information officer role was introduced. When a renewed emphasis on human assets became a high management priority, the chief people officer position was created. The past several years have seen a pronounced emphasis on data and its potential to help organizations function more effectively and today, more and more companies identify data and analytics as the new source of strategic insight and competitive advantage. To no surprise, the latest game changer in the marketplace is welcomed with additional seats at the big table. In fact, a stunning 66 percent of brands report their company has plans to or currently has an appointed data or analytics role in their C-suite.
The evolution from chief information officer to chief data officer to chief analytics officer is a direct indicator of a shift in priorities that will drive businesses in entirely new ways. Once the byproduct of an organization’s core functions, data is now curated to hold a more strategic position feeding insight across all enterprise functions and moving the power of data into the hands of key decision makers. Ninety-two percent of brands observed this role influencing marketing strategy, 62 percent of which felt more strongly it indicated a great influence. The change in direction unlocks the need for leaders in every sector to join in the game—including marketers. Agencies are taking notice as 95 percent agreed on the importance of providing analytic capabilities.
When asked how agencies saw their clients approaching their marketing planning in 2017, 62 percent said they anticipate an increase to their budget, while 32 percent believe there would be no changes, and only six
percent expect their clients to make cuts. In contrast, when brands were asked how they would allocate their dollars in 2017, 35 percent stated they would increase their budget toward promotional products, compared to 58 percent toward market research.
Promotional products have come a long way, yet in a constantly evolving marketplace, the question we must ask is, “Can we do more?” Recently data trackers have come under fire for being too costly, slow and for delivering unreliable data—and while technology to track product usage is still in its early stages and therefore expensive, 62 percent of brands said they would invest between six and 20 percent more in their overall budget if and when a tracking technology was offered to them (Figure 10).
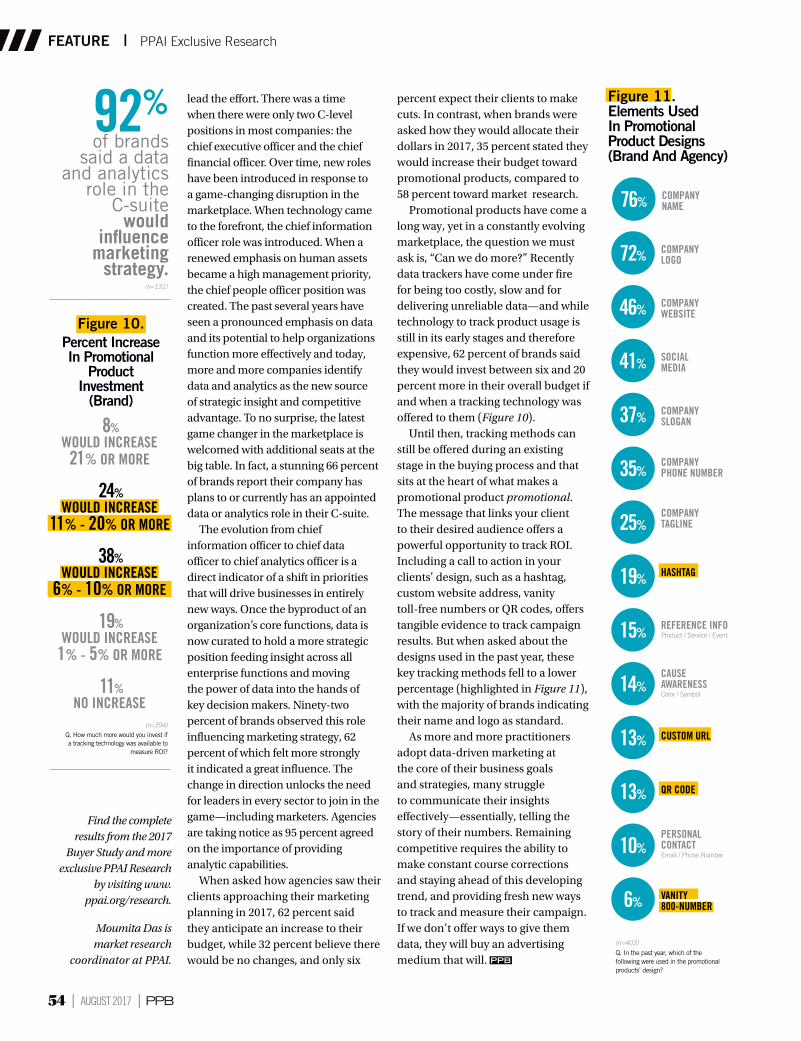
Until then, tracking methods can still be offered during an existing stage in the buying process and that sits at the heart of what makes a promotional product promotional. The message that links your client to their desired audience offers a powerful opportunity to track ROI. Including a call to action in your clients’ design, such as a hashtag, custom website address, vanity toll-free numbers or QR codes, offers tangible evidence to track campaign results. But when asked about the designs used in the past year, these key tracking methods fell to a lower percentage (highlighted in Figure 11), with the majority of brands indicating their name and logo as standard.
As more and more practitioners adopt data-driven marketing at the core of their business goals and strategies, many struggle to communicate their insights effectively—essentially, telling the story of their numbers. Remaining competitive requires the ability to make constant course corrections and staying ahead of this developing trend, and providing fresh new ways to track and measure their campaign. If we don’t offer ways to give them data, they will buy an advertising medium that will.
Find the complete results from the 2017
Buyer Study and more exclusive PPAI Research
by visiting www.ppai.org/research.
Moumita Das is market research
coordinator at PPAI.
Figure 11. Elements Used In Promotional Product Designs(Brand And Agency)
(n=403)Q. In the past year, which of the following were used in the promotional products’ design?
76% COMPANY NAME
72% COMPANY LOGO
46% COMPANY WEBSITE
37% COMPANY SLOGAN
35%COMPANY PHONE NUMBER
25%COMPANY TAGLINE
15%REFERENCE INFOProduct / Service / Event
10%PERSONAL CONTACTEmail / Phone Number
14%CAUSE AWARENESSColor / Symbol
19% HASHTAG
13% CUSTOM URL
13% QR CODE
6% VANITY 800-NUMBER
41% SOCIAL MEDIA
Figure 10. Percent Increase In Promotional
Product Investment
(Brand)
(n=394)
(n=131)
Q. How much more would you invest if a tracking technology was available to
measure ROI?
8% WOULD INCREASE21% OR MORE
24% WOULD INCREASE
11% - 20% OR MORE
38% WOULD INCREASE
6% - 10% OR MORE
19% WOULD INCREASE
1% - 5% OR MORE
11% NO INCREASE
92% of brands
said a data and analytics
role in the C-suite
would in�uence
marketing strategy.
54 | AUGUST 2017 |
FEATURE | PPAI Exclusive Research