Unlocking the Potential of Small and Mid-Scale LNG
34
Unlocking the Potential of Small and Mid-Scale LNG Implications for the Future Oil and Gas IQ’s Small and Mid-Scale LNG Summit Kathleen Eisbrenner April 24, 2012
Transcript of Unlocking the Potential of Small and Mid-Scale LNG

Unlocking the Potential of Small and Mid-Scale LNG
Implications for the Future
Oil and Gas IQ’s Small and Mid-Scale LNG Summit
Kathleen Eisbrenner
April 24, 2012

1
Past 10 years in LNG
The current global natural gas situation
Next 10 years in LNG
LNG opportunity overview and conclusions
A Guide for Today’s Comments
1

2
LNG has continued disproportionate growth in overall natural gas global demand
North America Shale production fundamentally changes requirements for LNG imports in North America
Many new markets have been opened to natural gas use through LNG imports, largely driven through rapid deployment provided by floating regasification technology
Growth in LNG availability has been beset by technical, political and commercial challenges (Qatar being an exception)
The Past 10 Years in Natural Gas and LNG
2

3
Costs for traditional new Greenfield liquefaction facilities have soared
China has entered the market as a huge base load LNG buyer willing to pay attractive oil-linked prices
The oil to gas price ratio has grown from 7 to 1, to 24 to 1, to 60 to 1
The Past 10 Years in Natural Gas and LNG
3

Spot LNG Prices
4
USA
NBP
Asia
2011
$4
$9
$16
2012
$2
$9
$16
Delta
$2 Delta = $1 Billion
NPV for each 1 mtpa

5
Belgium France Greece Italy Japan Puerto Rico South Korea Spain Taiwan Turkey United States
Past Decade: Only 11 Countries Imported LNG in 2000
5

6
Belgium France Greece Italy Japan Puerto Rico South Korea Spain Taiwan Turkey United States Argentina Brazil Canada Chile China Dominican Republic India Kuwait Mexico Portugal United Kingdom
Past Decade: More Than Double That by 2010
6

7
History of Floating Regasification
7
CURRENT SITES Argentina Brazil Kuwait United Kingdom United States Dubai
Current Sites
Planned Sites
FLOATING REGAS
PLANNED SITES Bangladesh Bahrain Belgium China Dominican Republic Germany Indonesia Israel Italy Jamaica Mexico Pakistan South Africa Uruguay Vietnam
2000 - 11 LNG Importing Countries (No Floating Regas) 2005 - First Floating Regasification Site (Gulf of Mexico) 2010 - 22 LNG Importing Countries 2012 - 12 Floating Regasification Sites 2015 - 30 or More Floating Regasification Sites (Projected)

8
Floating Regas Solutions
8
Near Shore
Offshore

9
New market alternatives are liquid fuels, priced at oil, fuel oil and diesel indices
Floating regasification has demonstrated how quickly innovative technologies can be adopted and accepted by the LNG industry
Floating regasification has demonstrated reduced costs for floating solutions ~ $400 million vs. $1.2 billion for land-based equivalent
Relevance of New Markets and Floating Regasification Technology
9

10
Vessel-Mounted Liquefaction Will Follow Regasification Growth Trend
10
Existing and Planned Floating LNG Projects
0
5
10
15
20
25
2000
2005
2010
2015
2020
Num
ber o
f Pro
ject
s
Floating Regasification Projects
Floating Liquefaction
Projects

11
Today’s FLNG opportunity space Installed FPSOs (1977 to 2010)
History of FPSO Development
1977 2010 1990 2000
100
50
150

12
"Incremental" investment allows decisions to be taken faster
Move from offshore to near-shore/jetty based From shuttle vessels to floating regas terminals via
ship-to-ship transfer From "temporary" solution to permanent From seasonal to base load Bigger isn't always better – replication creates value Investments in floating assets increase option value
Floating Regas Lessons Learned Over the Past Decade
12

13
Lower cost per mmbtu as well as overall investment
Accelerated schedule through replication, efficiency and controlled construction environment
Lower contingency required for cost and time to in service
Attractive financing support Ultimate opportunity to
benefit accross projects from lessons learned and cross-fertilisation
Value Creation Through Korean Built Midstream Solutions
13

14
The gold rush for Australia’s mega projects (with mega cost structures) will continue
Asian basin contract terms will continue to prop up LNG prices
Nuclear disaster in Japan will exacerbate energy shortages Without high level of price support mega projects won’t get
built Space is created for a disruptive technology to move into
upstream LNG – Floating Liquefaction Two approaches succeed
• IOC backed large scale • Smaller scale “capital light”
The Next 10 Years in LNG/FLNG
14

15
0
5
10
15
20
25
30
35
40
Land Based Large ScaleOffshore
Small ScaleOffshore/Nearshore
Liquefaction
Upstream
Future LNG FIDs: Time for a New Model?
15
$ BI
LLIO
N
16
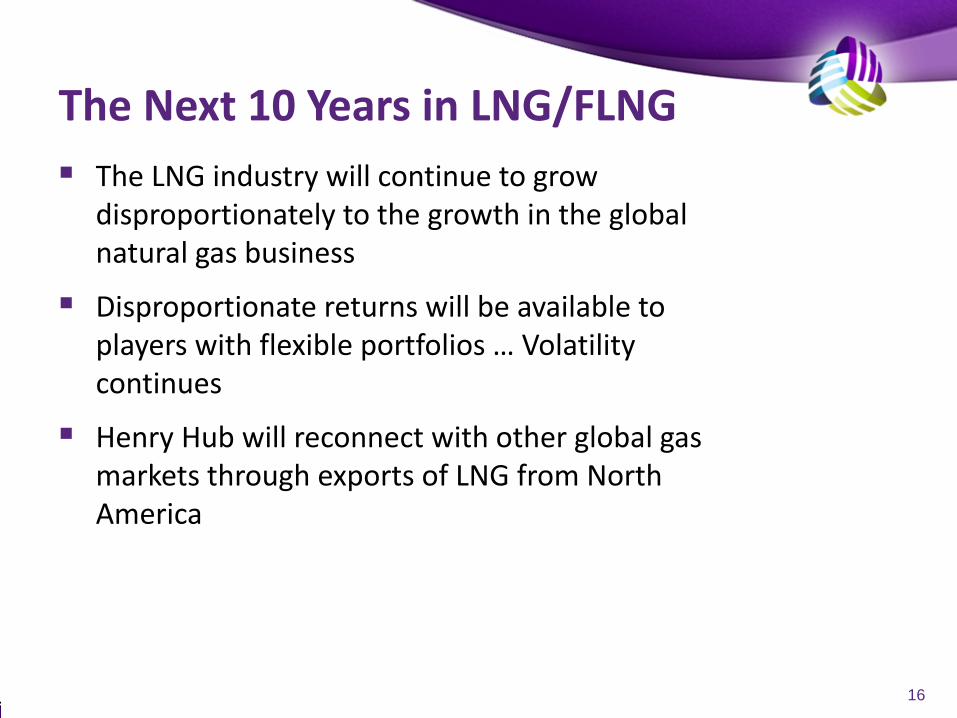
The LNG industry will continue to grow disproportionately to the growth in the global natural gas business
Disproportionate returns will be available to players with flexible portfolios … Volatility continues
Henry Hub will reconnect with other global gas markets through exports of LNG from North America
The Next 10 Years in LNG/FLNG
16

17
Cheniere closes on 4, 3.5 mtpa sales @ 115% HH + $2.25 $3.00
Cheniere to take FID on trains 1 & 2 at Sabine Pass
Rush of new projects are on offer
Henry Hub drops by more than 50% (from a low base of $4.00)
Warmest winter in 100 years causes HH to potentially go negative in the near term
Changes in US Market: Past 6 Months
17
18
Lower purchase price for feedstock
Brownfield economics
Lower/no take or pay (except for tolling fee)
Perceived/Actual Advantages to US Exports
18

19
NOT in technology per se, except to achieve lower unit costs
RATHER BY creating new business models for LNG that compete with the Traditionalists on a fundamentally lower cost basis
Leveraging the power of the Shipyard environment and best practices to keep costs and schedules under control
Floating LNG Dynamics How is Value Created??
19

20
“Relatively” capital light
Small, incremental steps create unexpected competitor to IOCs (much like US Independents “surprised” Majors with Nat Gas Shale plays)
Worldwide global physical arbitrage with financial HH/NBP/Brent plus storage financial overlay
The Way Forward for Growth in Downstream & Upstream LNG: Recognizing the Uniqueness of the Play
20

21
Regional reserves likely to exceed 35 Tcf
Pipeline difficulties and limited domestic market challenge additional natural gas deliveries to shore
Benign sea states and moderate climate enhance FLNG solution
Multiple FLNG vessels provide cost effective solution for Eastern Med
Levantine Basin FLNG Opportunity
21

22
Levant LNG Value Proposition
22
Upstream Partners Levant LNG & Midstream Solution LNG Buyers
Levant LNG Buys Gas
From Producers
Floating Liquefaction Vessel Converts Gas to LNG,
Stores LNG & Offloads to LNG Transit Vessels
Levant LNG Sells LNG to Offtakers
FOB
Levant LNG Participates In MIDSTREAM
SOLUTION Including:
Engineering, Commercial Contracts, Financing,
Construction, Operations

DSME/D&H Solutions DSME a world leading shipbuilder and
offshore solutions provider; constructed 9 of 11 floating regasification vessels globally
DSME successful in floating regasification and desires entry floating liquefaction
D&H Solutions, JV of DSME and Hemla, created to exploit stranded gas utilizing FLNG
Next Decade Management company of Levant LNG,
whose initial mission is to bring the Tamar FLNG opportunity to fruition
Team of selected LNG experts engaged to execute developmental efforts – technical, commercial and financial
Initial Shareholders
23
Introduction to Levant LNG
▪ Other potential shareholders › Off-takers › Suppliers › Operations provider

24
The Tamar FLNG Opportunity
24
Tamar- a deepwater gas field with proven gas reserves of 9 Tcf (3-3.5 Tcf for LNG exports) The Tamar operator (Noble) is
building production infrastructure for pipeline deliveries in Israel expected by Q1 2013, ~$3 billion investment Near depleted Mari-B Field will
serve as a buffer for natural gas storage to maximize production efficiency for Tamar gas supplying Israeli domestic market Marginal incremental field
development costs for LNG exports make this gas very competitive on the world LNG market Adjacent Leviathan and Cyprus
Block 12 Fields have greater reserve potential
Yam Tethys Field
Tamar Partners Noble Energy (Operator) Delek Drilling Dor Gas Exploration Avner Oil Exploration Isramco Negev 2

25
Tamar FLNG Project Milestones
25
Final Investment Decision
Binding Off-Take Agreement Negotiations
Management Services Agreement
Engineering (Pre-FEED & FEED)
Off-Take LOI Execution
Binding HOA With Tamar Partners for Gas Supply
TUA and Financial Structure Development & Negotiation
1st Commercial LNG Cargo
1st LNG Cargo
FPSO Sail Out of Korea
1st LNG Production
Shipyard Construction of FLNG Unit
Subsea Installations
Delivery to Site
Installation & Commissioning

26
The Potential for Offshore Floating Liquefaction
26
~3,922 fields
~1,043 fields
~719 fields
~347 fields
~337 fields
73 fields
4 50-100 Tcf
5-50 Tcf
1-5 Tcf
0.5-1 Tcf
0.25 - 0.5 Tcf
0.1 - 0.25 Tcf
< 0.1 Tcf
Levant LNG Focus
Large-Scale LNG 20 TCF Leviathan 7 TCF Block 12 Cyprus Many North America Locations
+ Many More……
2-20 Tcf

27
Potential for Near Shore FLNG
Unlimited...

28
Everett
Cove Point
Elba Island Lake Charles
Sabine Pass
Freeport
Golden Pass Cameron
Costa Azúl
Canaport
Pascagoula
Existing Facilities In Close Proximity to Key Shale Production

29
Opportunity exists for exports of natural gas from North America › North America Proven Natural Gas
Reserves Increased Over 60% During Past 10 Years Due to Shale Gas Production
› Domestic U.S Consumption Remained Relatively Flat Over The Same Time Period
Regulatory Framework For LNG Exports Is Still Being Finalized by the FERC and DOE
But, Likely Less Regulatory and Country Risk Than Other Gas Long LNG Export Opportunities
Early Mover Advantage May Exist For DOE Granted Export Licenses, So Time Is of The Essence.
The U.S. Export Opportunity
29
0
50
100
150
200
250
300
2000 2001 2002 2003 2004 2005 2006 2007 2008 2009 2010
U.S. Consumption (Bcf/day) Proven Reserves (Tcf)
Significant Increase in Proven Reserves Versus Relatively Flat Consumption Profile Creates
Potential for US Exports
Evaluating Feasibility, Cost, Timeline, and Business Structure to Implement a Floating LNG Solution in the U.S.

30
Vehicle Fuel
Marine bunkering
Industrial fuel (including for drilling rigs)
Additional New Markets for LNG
30

31
What Will Drive Future Success??
31

Thank You…
32

33


![Small-Mid LNG Plant[1]](https://static.fdocuments.in/doc/165x107/5476085db4af9fa30a8b5faa/small-mid-lng-plant1.jpg)